Article

Mathematical Model for Choosing Counterparty When Assessing Information Security Risks

Department of Complex Information Security of Computer Systems, Tomsk State University of Control Systems and Radioelectronics, 634050 Tomsk, Russia
*
Author to whom correspondence should be addressed.
Risks 2021, 9(7), 133; https://doi.org/10.3390/risks9070133
Submission received: 5 June 2021 / Revised: 7 July 2021 / Accepted: 8 July 2021 / Published: 13 July 2021

Abstract

:
The need to assess the risks of the trustworthiness of counterparties is increasing every year. The identification of increasing cases of unfair behavior among counterparties only confirms the relevance of this topic. The existing work in the field of information and economic security does not create a reasonable methodology that allows for a comprehensive study and an adequate assessment of a counterparty (for example, a developer company) in the field of software design and development. The purpose of this work is to assess the risks of a counterparty’s trustworthiness in the context of the digital transformation of the economy, which in turn will reduce the risk of offenses and crimes that constitute threats to the security of organizations. This article discusses the main methods used in the construction of a mathematical model for assessing the trustworthiness of a counterparty. The main difficulties in assessing the accuracy and completeness of the model are identified. The use of cross-validation to eliminate difficulties in building a model is described. The developed model, using machine learning methods, gives an accurate result with a small number of compared counterparties, which corresponds to the order of checking a counterparty in a real system. The results of calculations in this model show the possibility of using machine learning methods in assessing the risks of counterparty trustworthiness.

1. Introduction

In recent years, attention to the problem of violations on the part of counterparties, when concluding contractual relationships, has increased.
At the legislative level, documents have been approved that oblige companies to check potential counterparties before entering into contractual relations with them. For example, the Bank of Russia approved the standard STO BR IBBS-1.4-2018 “Ensuring information security of organizations of the banking system of the Russian Federation. Information security risk management in outsourcing”, which obliges subordinate organizations to manage and control the risks of information security violations, including in the outsourcing of software development. Identifying probable violators and creating a model of a violator is one of the main stages of conducting a pre-project survey and forming requirements for potential counterparties. According to the independent full-cycle research agency “MAGRAM Market Research” (a marketing agency that conducts sociological and marketing research of any complexity), 64% of entrepreneurs faced untrustworthy counterparties. The most common cases of untrustworthy behavior are related to the payment of orders. Thus, a long delay in payment was noted by 54% of respondents, and a refusal to pay for the delivered goods services—by 44%.
The remaining cases of untrustworthy behavior were distributed as follows
  • the counterparty did not perform the work or delivery that was fully or partially paid for by us: −19%;
  • the counterparty “lured” our client to himself or to our competitors: −14%;
  • the counterparty delivered goods or provided a service of inadequate quality: −13%;
  • the counterparty posed as someone he is not: −13%;
  • the counterparty forged documents: −6%;
  • the counterparty delivered counterfeit products: −6%.
The question was asked only to respondents who had experienced untrustworthiness in counterparties over the past six months (28%) (PSB 2020).
Thus, we will understand trustworthiness as a property of a counterparty that reflects the absence of a predisposition to commit actions or omissions in the course of joint contractual activities that cause damage to the company in the form of direct material losses and (or) as a reduction or loss of its business reputation.
This paper considers the approaches used in the field of assessing the risks of counterparty trustworthiness, reviews the literature on this topic, describes the developed model for assessing the risks of counterparty trustworthiness and its construction. The possibility of using the stochastic gradient descent method, with satisfactory results, in assessing the risks of counterparty trustworthiness is also described.

2. Literature Review

The approaches related to this problem can be divided into three groups:
  • risk avoidance,
  • transfer of counterparty risk to other companies,
  • risk mitigation and risk acceptance.

2.1. Risk Avoidance

ISO 27001 focuses on ensuring that information security breaches do not lead to significant financial damage to the organization and/or to significant difficulties in its activities, and that it has sufficiently well-trained employees to conduct procedures to minimize possible adverse consequences in the event of a serious incident (ISO 2005).
The importance of correlating information security and business risks is highlighted in their work by such scientists as Coles-Kemp and Overill. These authors point out the current shortcomings in the interaction between teams conducting risk assessment in existing business processes as a whole (Coles-Kemp and Overill 2007).
Hayden (2010) in his works notes that for an effective risk assessment, security metrics must be defined. Security metrics should be about choosing the best methods to determine what you need to know about security to improve your understanding of operational processes within limited resources. Philippou et al. (2020), Frei, and Rashid believe that standard security metrics need to be adapted according to the technical and organizational factors of a particular organization, depending on the business environment, and analyze the possibility of using the GQM approach in the development of metrics. This approach involves the use of a symbiosis method (SecuritY Metrics and BusIness ObjectiveS, Integrated and Synchronized), covering security from the decision-making process to the specific measurement practice, as well as covering both technical and organizational aspects (Basili et al. 2014).

2.2. Transfer of Counterparty Risk to Other Companies

Shameli-Sendi (2020) has developed a model that forms a multi-organizational pyramid of security needs, each of which forms a hierarchical multi-level one that includes security issues and related business processes. The author shows how the model developed by him improves such risk assessment methods as CVSS (Common Vulnerability Scoring System) and OWASP (Open Web Application Security Project).
Moreover, the mechanisms and procedures aimed at providing basic security management measures for the protection of corporate information were considered in their textbooks by Peltier and No (Peltier 2016).
Approaches related to the adoption, determination and transfer of the risk assessment of the trustworthiness of counterparties to other companies are noted by a number of scientific researchers.
Not so long ago, Park et al. (2015) in his research gives a similar rating of personal information, using various factors, such as asset value, financial stability, importance and identification. The author assessed the use of personal information and the risk of abuse of this information as components of the rating model.
At the moment, when drawing up a budget for information security expenses, companies do not include budget items aimed at checking potential counterparties. According to the survey, in most cases, the main indicator for making decisions on the size of investments is the estimate of net discounted income (NPV). The second most popular method is a simple ranking of the benefits (which are usually understood as risk reduction) obtained from the implementation of a particular tool or project. In various sources, other approaches are also suggested. Almost all the remaining approaches are based on the AHP (analytical hierarchy process) methodology (Bodin et al. 2005, 2008; Gordon and Loeb 2006; Saaty 1990).

2.3. Risk Mitigation and Risk Acceptance

Companies’ corporate information was reviewed by Na et al. (2019), who also proposed a rating model for verifying information within the framework of ensuring the economic security of the organization, based on 14 factors, which include general information about the organization, internal information of the organization and additional data. However, this model only provides a general assessment of a potential counterparty, without affecting the specifics of legislation in various areas and the assessment of risks from information security.
For example, Park et al. (2015) in his research gives a similar rating of personal information, using various factors, such as asset value, financial stability, importance and identification. The author assessed the use of personal information and the risk of abuse of this information as components of the rating model.
Bonollo et al. (2017) they note the large computational and time costs for analyzing the counterparty. In their work Estimating the Counterparty Risk Exposure by Using the Brownian Motion Local Time, the authors express the need to reduce the time spent on analyzing the counterparty by using the properties of local time wisely.
Thus, it can be stated that the existing work in the field of information security in software development does not create a reasonable methodology that allows for a comprehensive study and an adequate assessment of the counterparty (for example, a software developer company) when entering into contractual relations with it in the field of software development. This, in turn, does not reduce the risk of offenses and crimes that constitute security threats, both for individual organizations and for the whole state.

3. Research Methodology and Results

3.1. Description of the Model under Development

Currently, partial verification of the counterparty’s trustworthy is usually carried out by separate specialized departments of the company based on information systems, for example, SPARK, Integrum, etc. Since these checks are time consuming and may contain errors due to the influence of the human factor, and the audit does not take into account industry-specific parameters, there is a need to automate the risk assessment process of a management decision to cooperate with a counterparty (developer company) (Koltays et al. 2020).
The purpose of this work is to determine whether the counterparty is trustworthy or untrustworthy in order to make a management decision on cooperation with him.
At the same time, if the counterparty is trustworthy, then the possibility of cooperation is assumed with him, if the counterparty is untrustworthy, then it is not worth cooperating with him.
To achieve the goal, you must complete the following tasks:
  • Identify a trustworthy source of input data;
  • Define the input and output data of the model;
  • Define the requirements for the model;
  • Select the method of building the model;
  • Prepare data for modeling if necessary;
  • Build a model;
  • Check the feasibility of the model requirements;
  • Analyze the simulation results.
At the present time, there are many information and analytical systems that have both positive and negative aspects of the selection of counterparty companies. In this regard, the first task was to conduct an analysis of information and analytical systems to identify the best options for assessing the trustworthiness of organizations.
In order to choose a trustworthy data source, a comparative analysis of information and analytical systems for checking counterparties was carried out. These tables (table) provide a comparison of 32 systems available on the Russian market that specialize in providing information support in the field of counterparty analysis. During the selection of the optimal counterparty verification systems required to obtain trustworthy and trustworthy data, the systems were compared according to the following parameters:
  • User-friendly interface;
  • Fast request processing speed;
  • Daily data update;
  • Data upload;
  • Express risk assessment;
  • Search for company affiliations;
  • Availability of financial statements;
  • Organizational and management structure;
  • Availability of change monitoring.
As a result, five information systems were selected that meet all the specified requirements of the analysis: SPARK, Contour.Focus, Seldon.Basis, Kartoteka, SCREEN.
In order to determine the best one from the data of 5 information systems, the AHP proposed by T. Saaty was used (Saaty 1990):
To find the best information and analytical system, the values of global priorities were calculated. The final rating value of each IAS (information and analytical system) for a group of criteria is calculated according to the following formula:
B = a X 1 + b X 2 + c X 3 + d X 4 + e X 5 + q X 6 + r X 7 + t X 8 + y X 9 .
According to the results of this method, the following values of global priorities of information systems were obtained:
  • SPARK: 0.3915 ;
  • Contour.Focus: 0.2727 ;
  • Seldon.Basis: 0.1877 ;
  • Kartoteka: 0.0883 ;
  • SCREEN: 0.0599 .
When constructing the matrix for the correctness of calculations, the consistency of the analyzed matrices was clarified. The calculated consistency ratio of each matrix is in the range from 1.36% to 10%, which confirms the accuracy of the application of the hierarchy analysis method. Thus, using the method of AHP by T. Saaty, the best information and analytical system was identified: Spark-Interfax.
In the modeling process, a sample from the SPARK information and analytical system (IAS) (a system for Professional Analysis of markets and companies) was used as input data for the model (SPARK 2021), which is a list of counterparties and their characteristics: The age of the company, the average number of employees, important information, net profit (loss), the period of repayment of receivables (in days), the period of repayment of accounts payable (in days), the period of turnover of fixed assets, the period of turnover of assets, the current liquidity ratio, the quick liquidity ratio, absolute liquidity ratio. SPARK is used as a tool for downloading information for this experiment, but any user can also find this information in open state sources of information absolutely free of charge.
The output data is a list of numerical states of counterparties: ( 1 ) —the counterparty is untrustworthy; ( + 1 ) —the counterparty is trustworthy.
In this case, the model must meet the following requirements:
  • adequacy;
  • adaptability;
  • effectiveness;
  • the accuracy of the model must exceed 80%;
  • the completeness of the model must exceed 80%.
At the same time, the accuracy of the model is understood as the ratio of correct responses to the sum of correct and false responses.
The completeness of the model refers to the ratio of correct responses to the sum of correct responses and false omissions.
The stochastic gradient method, which can be used in machine learning, will be used as a method for constructing the model. In this case, the training will be performed on the sample first x l = ( x i , y i ) i = 1 l , where x i x n is objects, and y i { 1 ; + 1 } is the answers of the “teacher”.
The model itself will be a linear classification model:
a ( x ; w ) = s i g n x , w ,
where s i g n x , w —sign of the scalar product of vector x by vector w.
The geometric meaning of the vector w is that it is the guiding vector of the separating hyperplane in n-dimensional space. Moreover, if the sign of the scalar product is positive, that is, the point lies on one side of the separating hyperplane, then we classify the object as a class “+1”, that is “trustworthy counterparty”. If the sign of the scalar product is negative, then we consider the object of the class “−1”, that is, “not trustworthy”.
To find an unknown vector w, we set the problem of minimizing the functional of the proportion of incorrect answers:
Q ( a , X ) = 1 l i = 1 l a ( x i ; w ) y i = 1 l i = 1 l s i g n x , w y i m i n w .
This functional is discrete with respect to the weights, and therefore, in order to use the gradient method, it is necessary to reduce the problem to minimizing the smooth functional:
Q ( w , X ) = 1 l i = 1 l y i x i , w < 0 m i n w .
Enter the value M i ( w ) = y i ( x i ; w ) —margin of the object x i :
Q ( w , X ) = 1 l i = 1 l M i ( w ) < 0 m i n w .
The indent sign indicates the correctness of the classifier’s answer (positive indent corresponds to the correct answer, negative—to the wrong one), and its absolute value characterizes the degree of confidence of the classifier in its answer. Scalar product x , w in proportion to the distance from the separating hyperplane to the object, respectively, the closer the indentation is to zero, the closer the object is to the class boundary, the lower the confidence in its belonging.
The functional according to Formula (3) evaluates the error of the algorithm on the object using the threshold loss function L ( M ) = M < 0 , where the function argument is indented M ( w ) = y x , w . To introduce a smooth functional, we evaluate this function at all points of M: L ( M ) L ˜ ( M ) .
After that, you can get an upper bound on the functional:
Q ( w , X ) = 1 l i = 1 l L ˜ y i x , w m i n w .
At the same time, if the upper estimate L ˜ ( M ) is smooth, then L ( M ) will be smooth. If the top score is close to zero, then the percentage of incorrect answers will also be close to zero.
The logistic loss function will be used as the upper estimate:
L ˜ ( M ) = log 1 + e M
Thus, the objective function will be expressed in minimizing the upper bound L ˜ ( M ) .

3.2. Building a Model

Stochastic gradient descent is a modification of gradient descent. The essence of gradient descent is to minimize the function by taking small steps towards the fastest decrease in the function.
Gradient descent begins with initialization of the weight vector, for example, with zeros ( w 0 = 0 ), and then the gradient steps are repeated in the cycle (StochGrad 2021). We apply the method to the problem, and then the gradient step (Formula (8)) will consist of what we subtract from the current approximation of the weight vector w t 1 the gradient vector, with some coefficient η t . Repeating these steps until convergence occurs (Formula (9)), that is, until the vector of weights begins to change only negligibly.
w t = w t 1 η t Q ( w t 1 , X ) ,
where w t — the considered vector of weights, w t 1 —current approximation of the weight vector, Q ( w t 1 , X ) —gradient, η t —gradient coefficient, t = 1 , 2 , 3 ,
w t w t 1 < ε ,
where ε —accuracy.
When the gradient descends to the representation of the j:th component of the gradient vector (Formula (10)), there is a summation for all objects of the training sample, where the summands are summed, which, in fact, show how to change the j:th weight in order to improve the quality on the object x i as much as possible. Moreover, the whole sum shows how to change the j:th weight in order to improve the quality of the entire training sample.
In the case of stochastic gradient descent, the gradient vector calculated over the entire sample is not calculated at one iteration, but the gradient of the functional on only one object randomly selected from the training sample (Formula (11)).
Q w j = 2 l i = 1 j x i j x i , w y i ,
where l—the number of objects in the training sample.
w t = w t 1 η t Q ( w , { x i } ) ,
where x i X -randomly selected object.
Thus, gradient descent requires summing over all the objects of the training sample at each iteration, which can be a problem if the sample is large. Stochastic gradient descent solves this problem by using only one training sample object at each of its iterations. It also allows you to train linear models on very large samples that do not fit into the computer’s memory.
For the simulation, companies whose main activity is the development of computer software, consulting services in this area and other related services were considered.
The total number of companies according to IAS SPARK (SPARK 2021) was 34,324, of which 46.53% of the companies are “trustworthy”, 53.47%—“not trustworthy”. For the simulation, a sample with an extension was taken .csv of 3432 companies, which corresponds to the distribution of trustworthiness in the original sample (Table 1). At the same time, trustworthiness was determined by the summary risk indicator (Table 2): If the risk is “low”, then the company is trustworthy, if “medium” or “high”, then the company is untrustworthy. This transformation was carried out by a composite index using SPARK algorithms. According to the information from the developer company: The consolidated risk indicator is a cumulative assessment of the analytical indicators of DDI, FRI, PDI, as well as the Status of the company (the state of liquidation, bankruptcy, etc.). It represents 3 risk values: Low, medium and high. FRI: From 1 to 14—low risk, from 15 to 85-medium risk and from 86 to 99-high risk. DDI: From 1 to 40—low risk, from 41 to 70-medium risk and from 71 to 99-high risk. PDI: From 1 to 49—high risk, from 50 to 79-medium risk and from 80 to 99-low risk. We have updated the manuscript, revealing these definitions (SPARK 2021).
The input data is described in Table 3 and Table 4.
The dependence between the input data was checked by calculating the correlation coefficient and evaluating it on the Cheddock scale. As a result, it was decided to exclude the “current liquidity ratio” and “quick liquidity ratio” from the input data, since there is a strong and very strong relationship between them and the “absolute liquidity ratio” (correlation coefficient values from 0.7 to 0.9 and greater than 0.9 , respectively).
To successfully apply the machine learning method to the input data, the following transformations were performed:
  • the separator of the integer and fractional parts in Excel was defined as “.”;
  • the separation of groups of digits in Excel was removed;
  • the data in the text format is converted to the numeric format according to Table 5;
  • abnormal values were converted: All negative values of the period of repayment of accounts payable, the period of repayment of accounts receivable, the period of turnover of fixed assets, the period of turnover of assets were determined as “−1”;
  • omissions in the data were removed: The omissions in the “Company size” were defined as “−1”, the remaining omissions as “0”;
  • the data is given for a single scale from 0 to 1.
The linear_ model.SGDClassifier() method of the sklearn Python library was used for modeling. Attribute values were accepted by default (Sklearn 2021), except for the following:
  • loss–loss function, value-‘log’; random_ state;
  • is used to make it possible to repeat experiments, value-70;
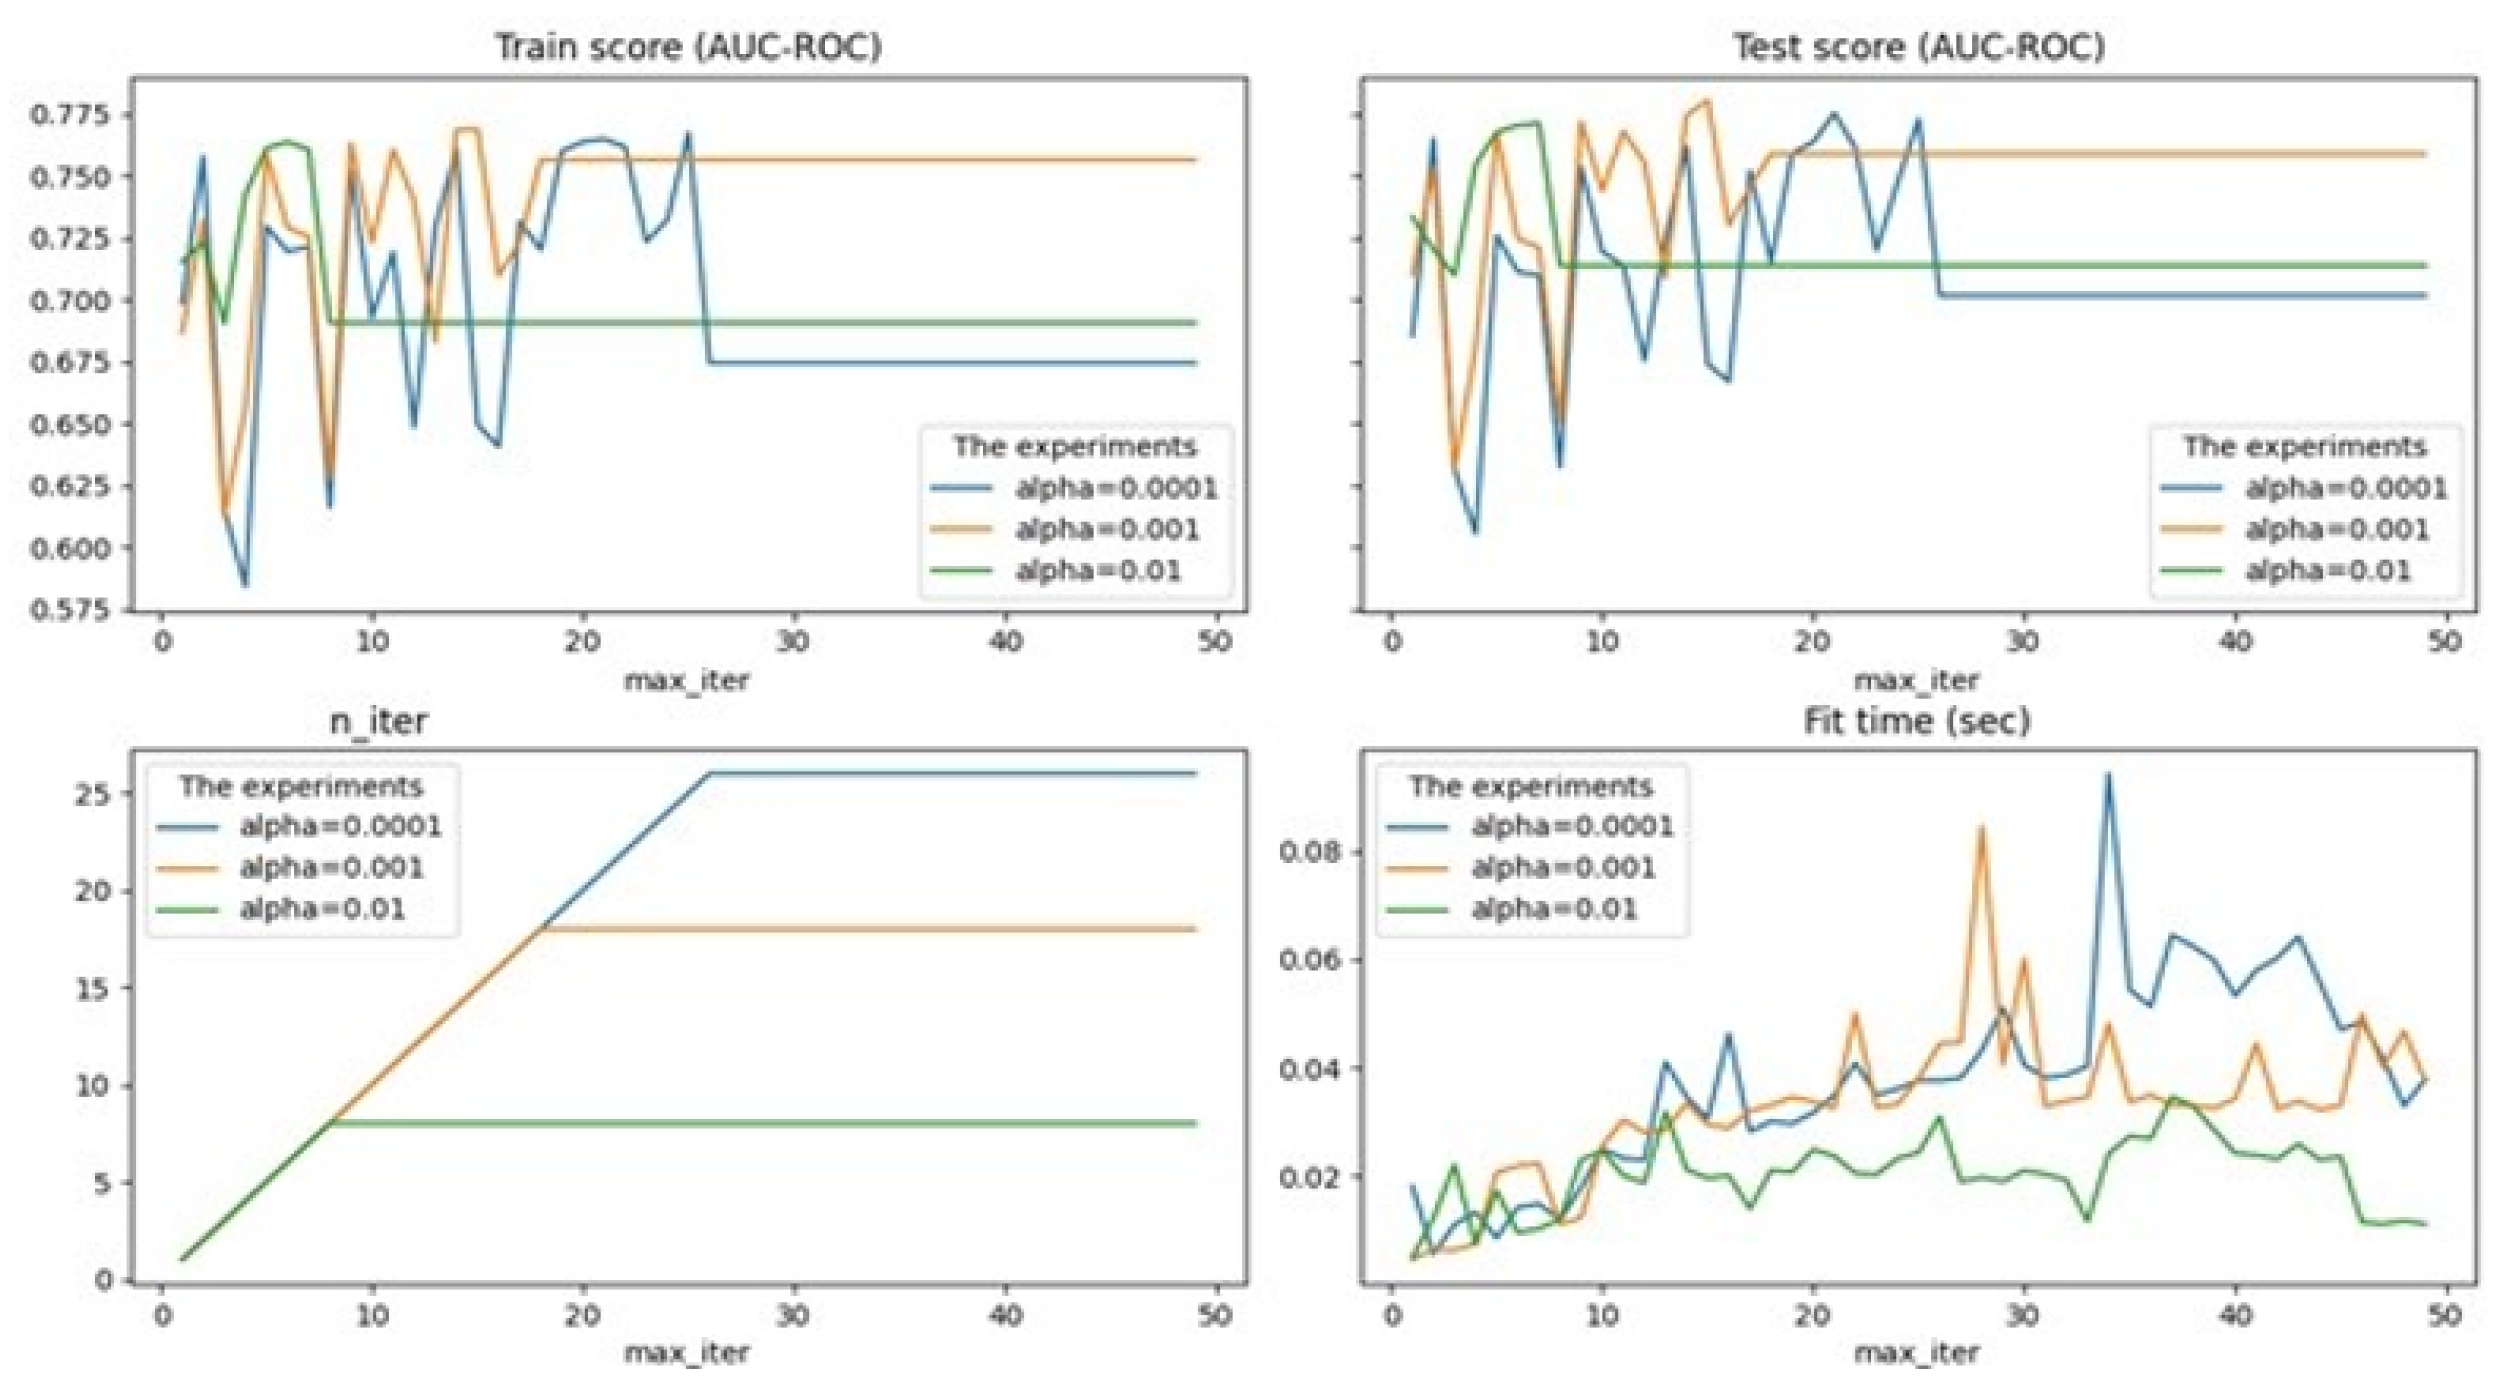
  • alpha is a constant that is multiplied by penalty (by default-0.0001), experiments were performed for 0.01, 0.001, 0.0001;
  • max_ iter—the maximum number of passes on the training data (so-called epochs), by default-1000, the optimal maximum number of passes was identified to avoid the problem of overfitting;
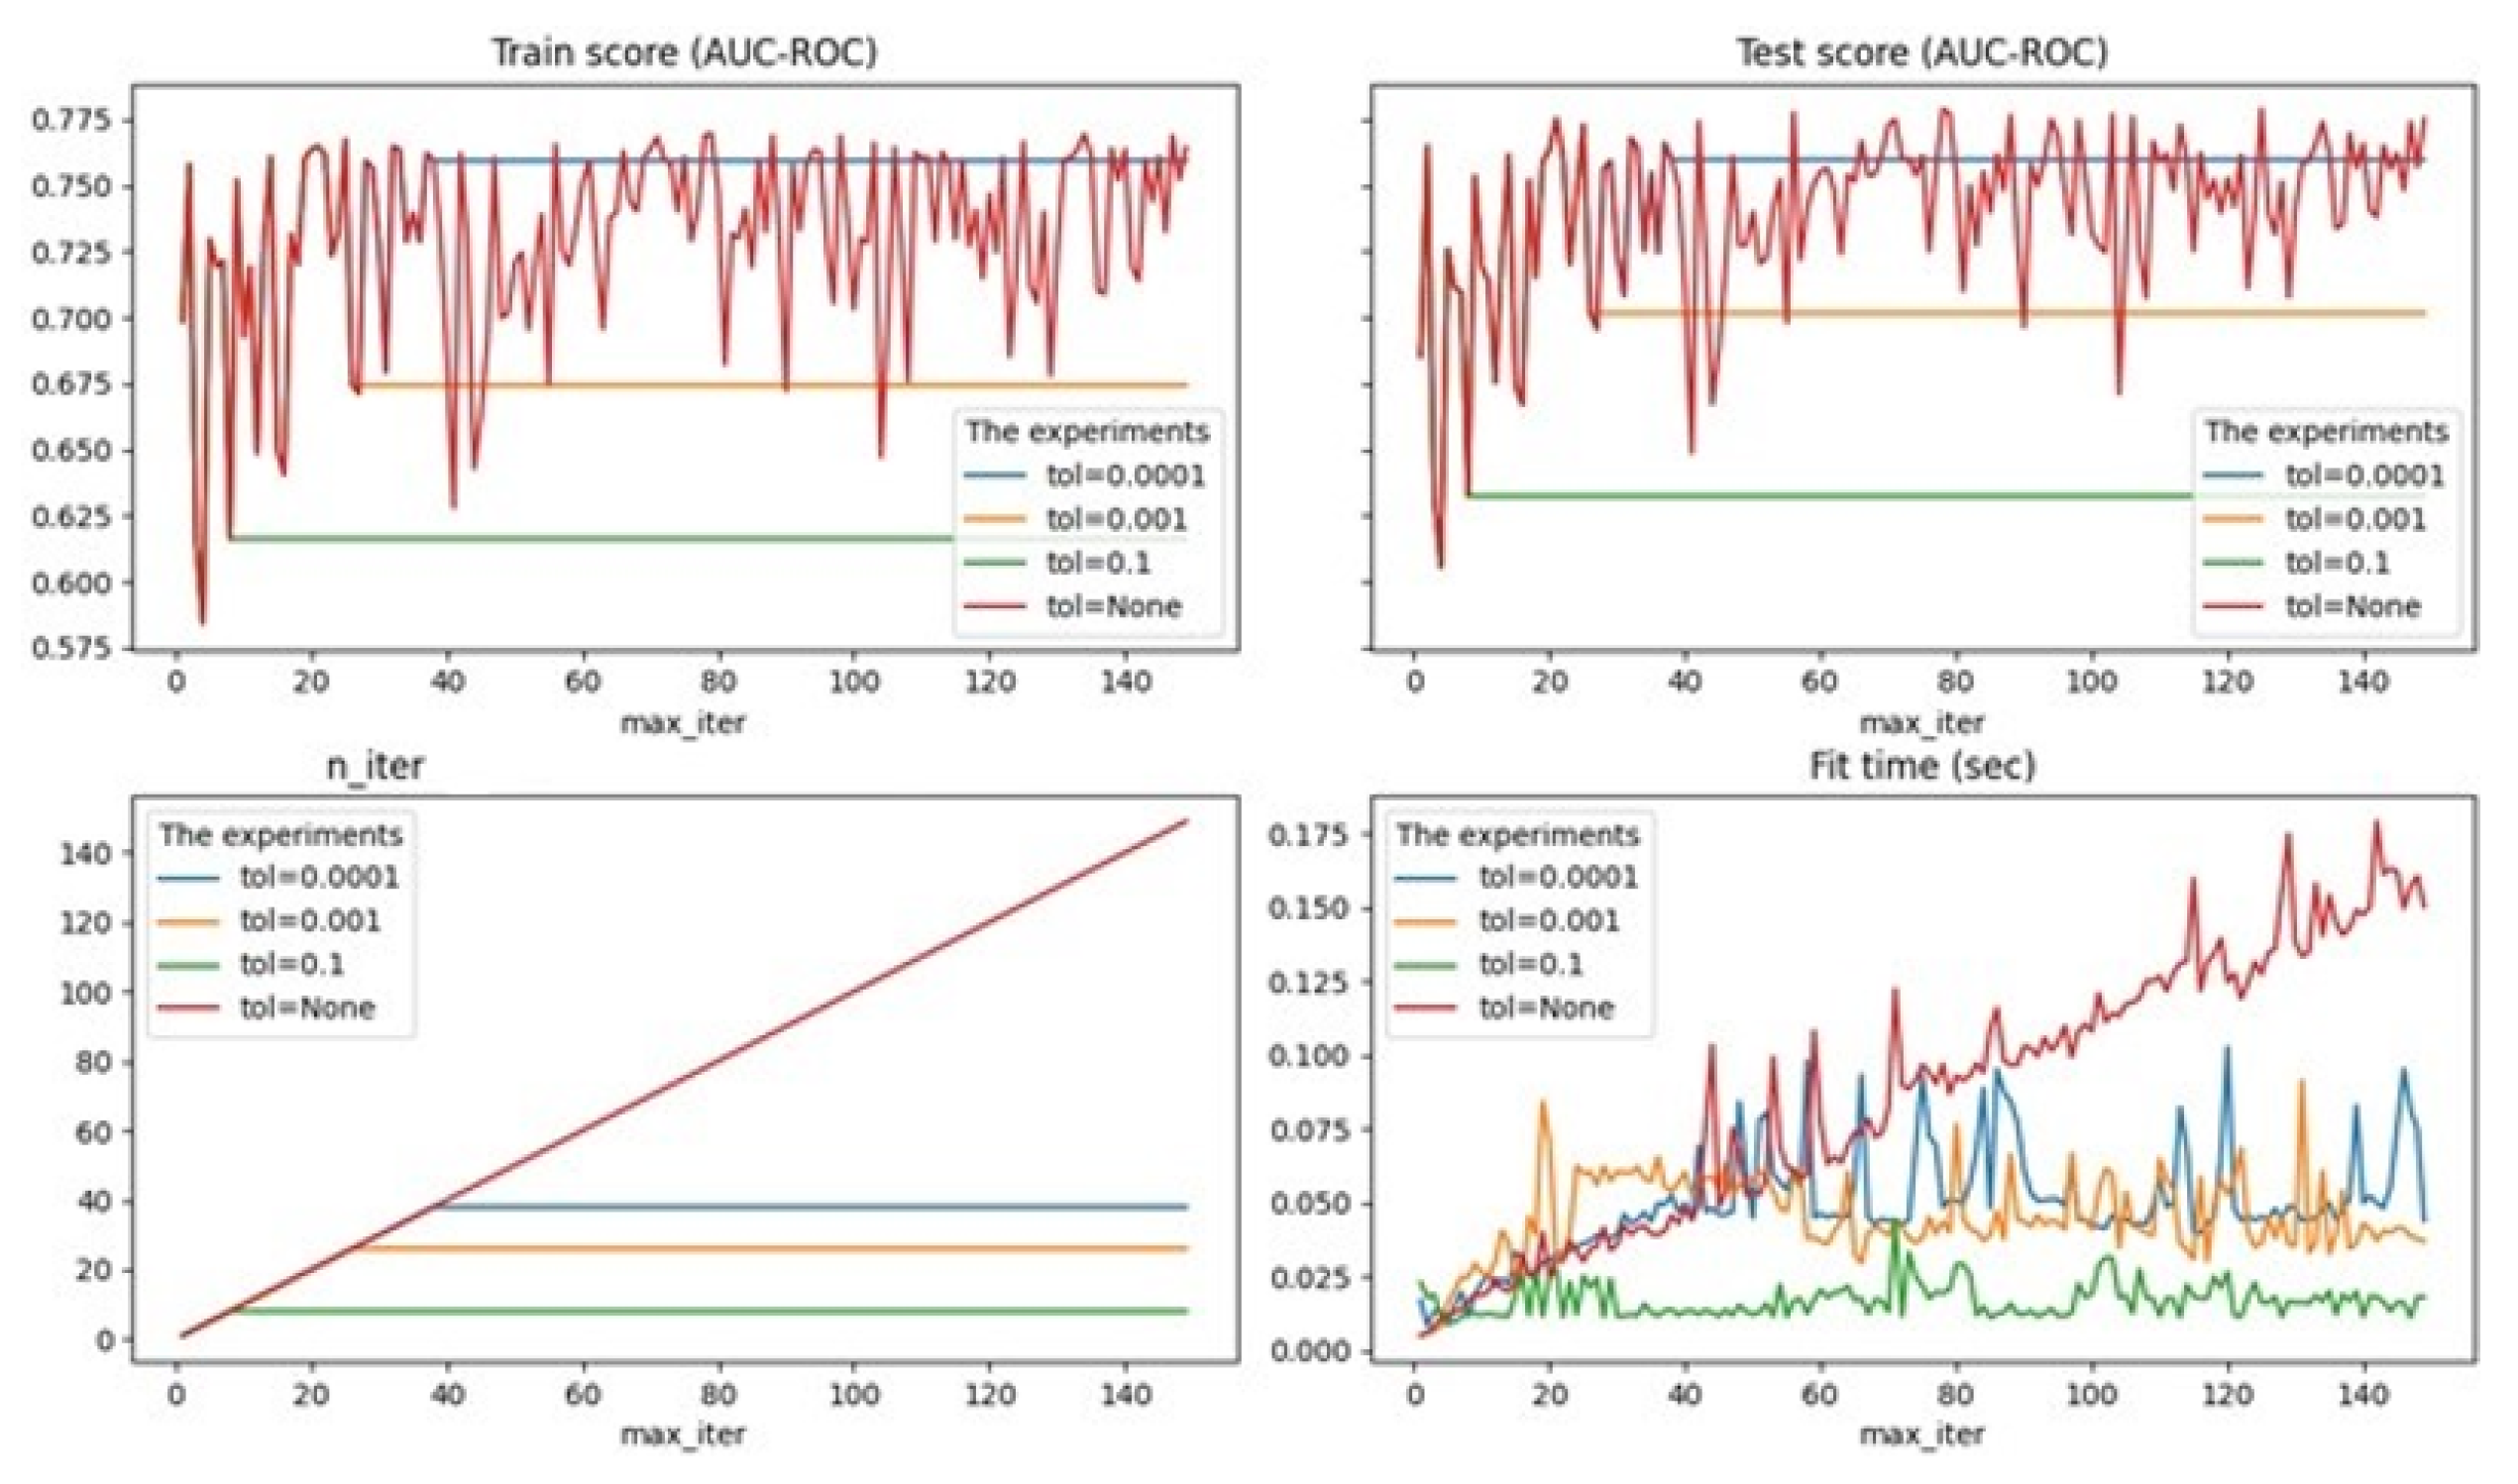
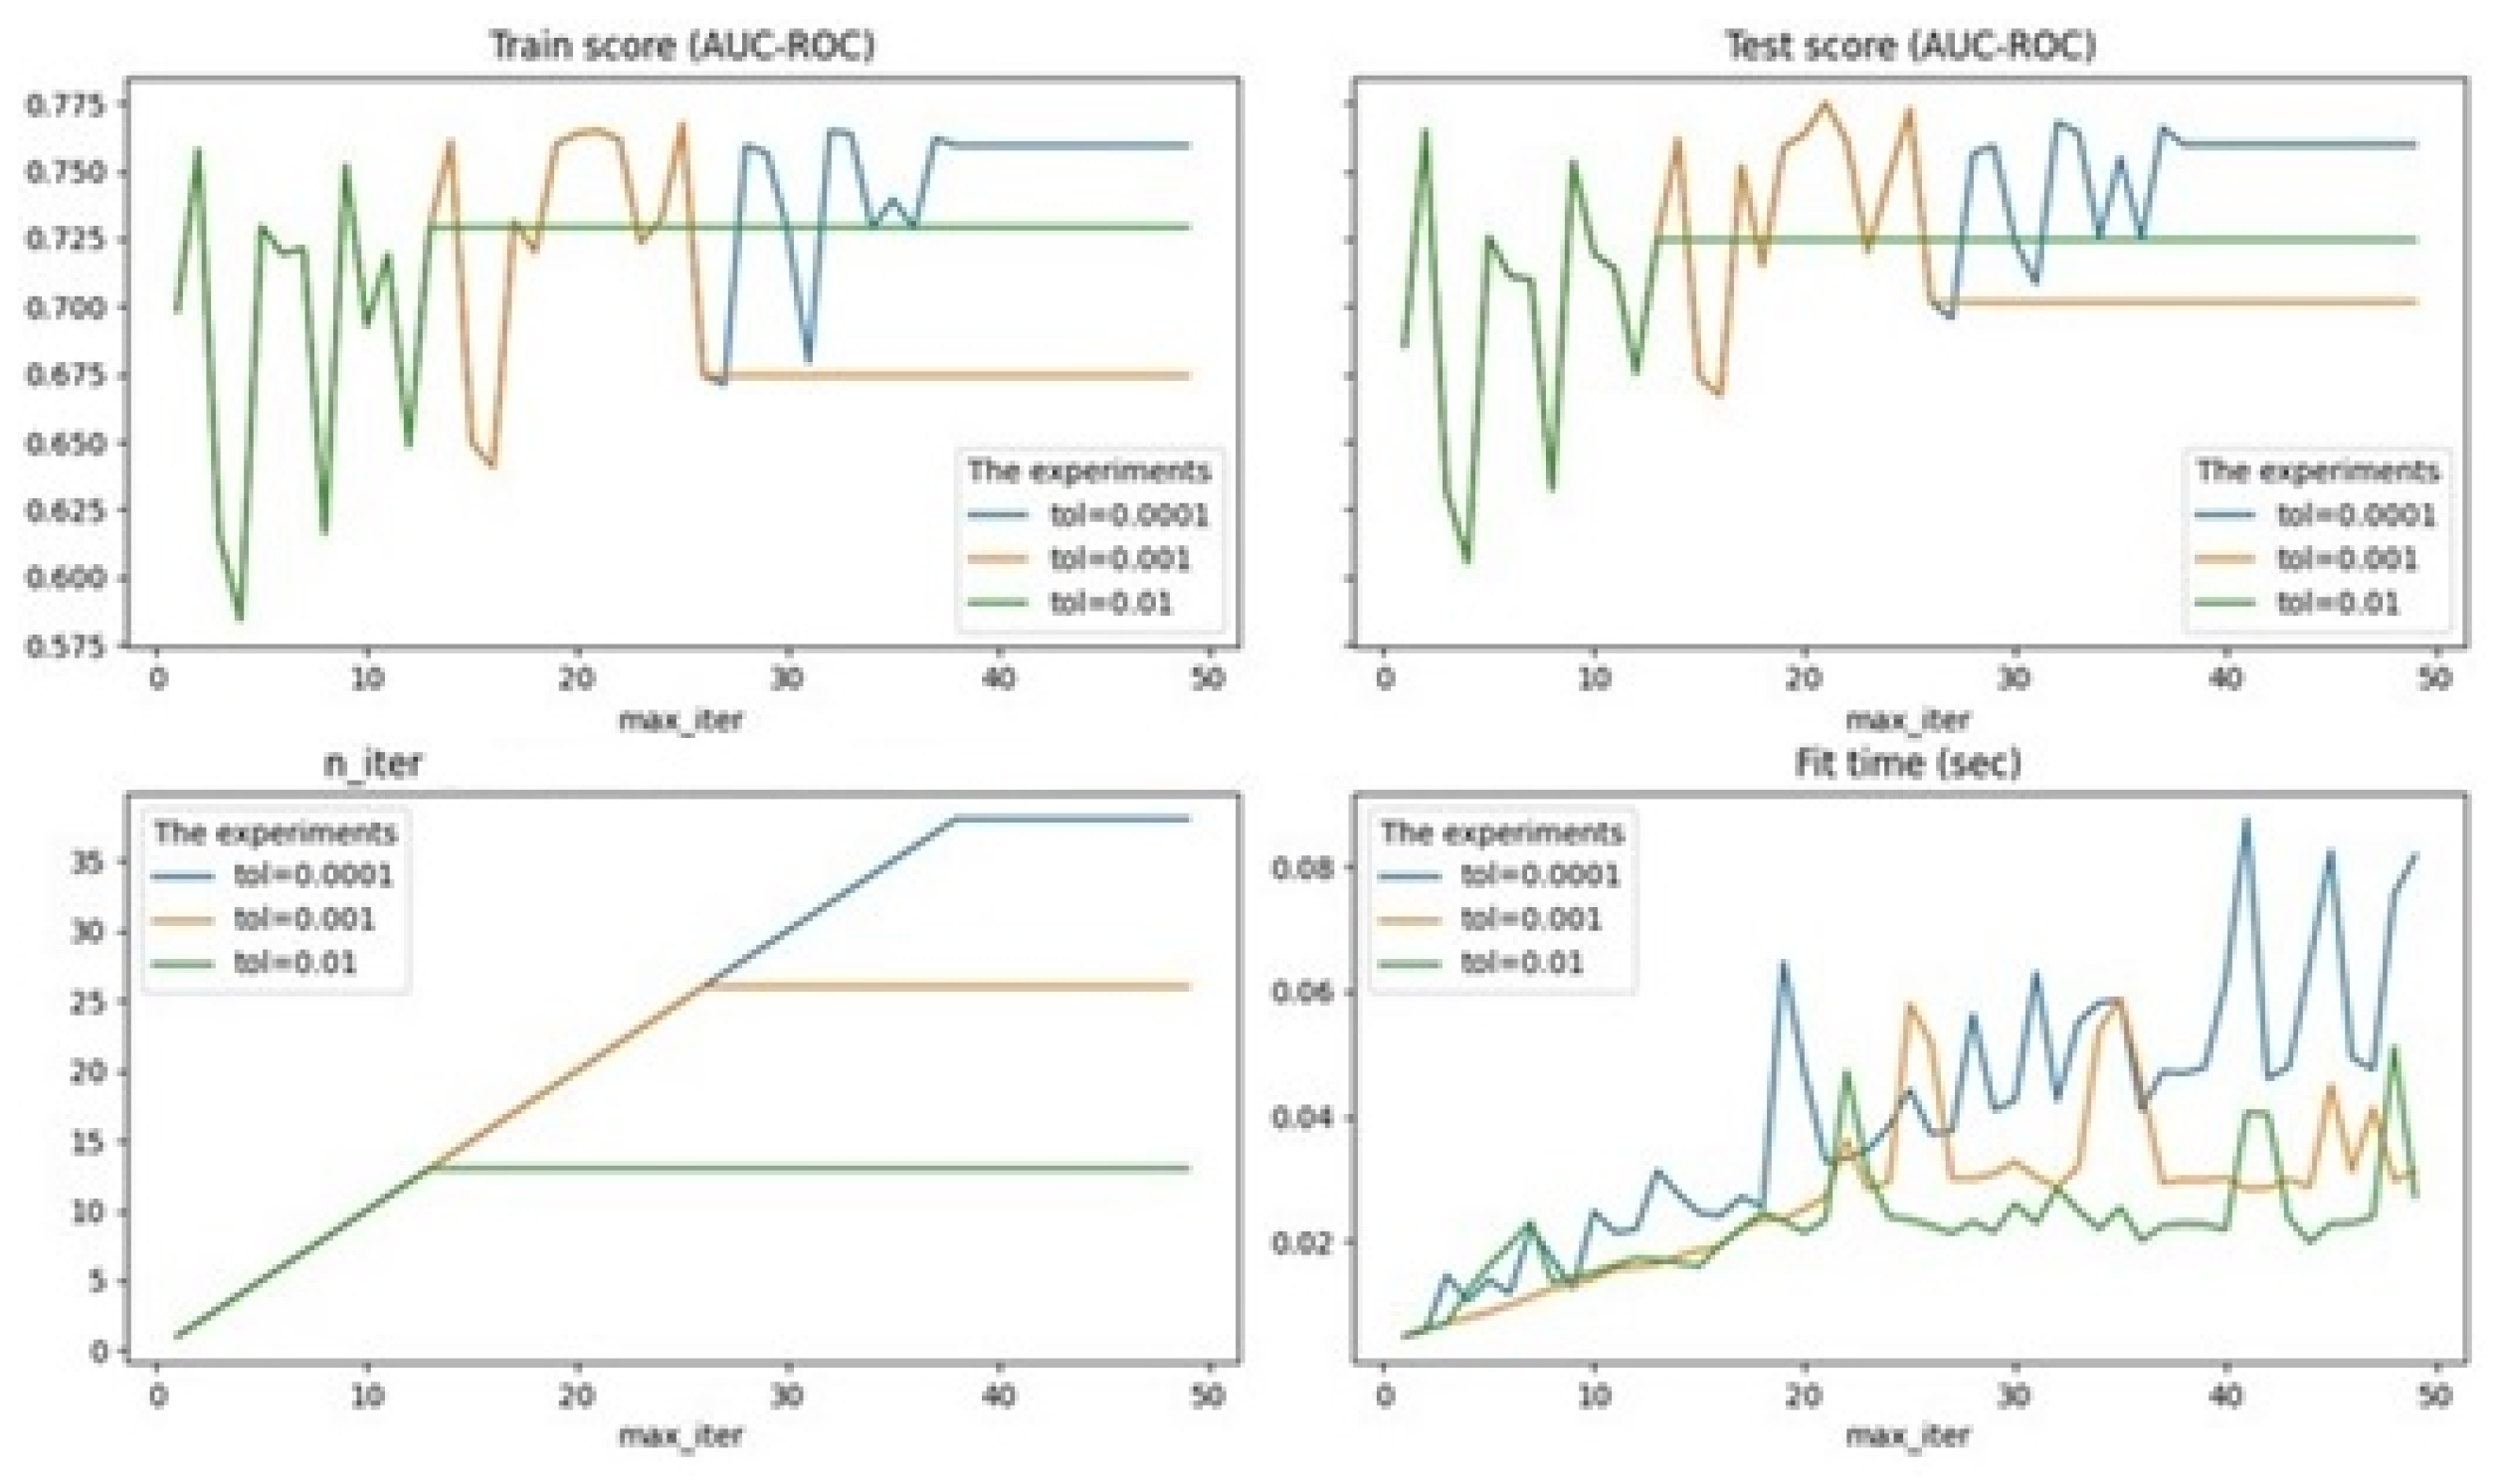
  • tol-stop criterion: Training will stop when loss > best_ loss—tol (default-0.001), experiments are performed for None, 0.01, 0.001, 0.0001.

4. Results

During the experiments, it turned out that the accuracy and completeness due to the imbalance of the responses of the model and the real system is difficult to assess, so it was decided to replace the accuracy and completeness estimate with the ROC curve estimate (AUC-ROC), which shows the dependence of the number of correctly classified positive responses on the number of incorrectly classified negative responses. In this case, the AUC-ROC criterion should be more than 80% (Fainzilberg and Zhuk 2009; Fawcett 2006; Petrie and Sabin 2020).
The experiments were carried out separately for each attribute (Table 6 and Figure 1, Figure 2 and Figure 3).
Based on the results of the experiments, it was decided to set m a x i t e r = 30 to reduce the training time, a l p h a = 0.001 , and tol to be left as default. The final value of the AUC-ROC criterion is about 75%.
Thus, the model does not meet the requirements (the AUC-ROC criterion is less than 80%). To improve the accuracy of the simulation results at the model training stage, cross-validation can be used (Cross 2021; Refaeilzadeh et al. 2009) when evaluating the model, the available data is divided into k parts, then the model is trained on k 1 parts of the data, and the remaining part of the data is used for testing. The procedure is repeated k times; as a result, each of the k pieces of data is used for testing.
As a result, the model is trained more efficiently on more uniform data, which increases the accuracy of its results.
Four types of cross validation were used (Cross 2021):
  • KFold is a classic cross-validation method, the sample is divided into k groups, while one object can appear in the groups only once, the class ratio is not preserved.
  • StratifiedKFold-a cross-validation method in which the sample is divided into k groups with the class relations preserved.
  • ShuffleSplit is a cross-validation method in which the sample is divided into k groups with random permutations, i.e., one object can appear in the groups several times.
  • StratifiedShuffleSplit-a method that is a merger of StratifiedKFold and ShuffleSplit, i.e., the sample is divided into k groups with class relations preserved and with random permutations.
As a result, according to the method:
  • KFold model quality-0.83;
  • StratifiedKFold-0.83;
  • ShuffleSplit-0.83;
  • StratifiedShuffleSplit-0.84.
All values of the AUC-ROC criterion are greater than 80%, which means that the quality requirements are met when using all methods. Since StratifiedShuffleSplit achieves the maximum accuracy of the model, the resulting model will contain this method.
Next, the results were analyzed and the model requirements were verified:
  • adequacy;
  • adaptability;
  • efficiency;
  • the AUC-ROC criterion must be more than 80%.

5. Discussion

Based on the test data, the trustworthiness of the counterparty was predicted using the constructed model, while the number of objects (companies) varied from 2 to 100. As part of the test, the most distant counterparty from the separating hyperplane in n-dimensional space was first selected. Then the next one, which is a little closer, and so on. It turned out that with a small number of compared counterparties (less than 7), the model correctly classifies the trustworthiness of the counterparty. With 17 or more compared counterparties, the quality of the model no longer meets the quality requirements of the AUC-ROC criterion. However, due to the specifics of checking the counterparty before entering into a contractual relationship (as a rule, up to 10 companies are compared), we can assume that the model meets this requirement.
The adequacy of the model was also checked by the average response values of the model and the system using the Student’s t-test (Scipy 2021) with a significance level of 5% (Table 7). On all test data, the pvalue is greater than 0.05, which means that the hypothesis is rejected, the average response values of the model and the system are equal, so the model is adequate.
Adaptability shows the ability of the model to adapt to changes in the external environment and the original. Since the model can be retrained on new data, this requirement is met.
Efficiency reflects the acceptable time to solve the problem, the amount of memory and resources used. During the simulation, the model attributes were selected so that the execution time and the quality of the model were optimal.
Comparing the developed solution with the rating model of corporate information for ensuring the economic security of activities, we can conclude that the use of the stochastic gradient descent method allows us to obtain an identical result with satisfactory accuracy and low time costs. Such results allow researchers and specialists to use this machine learning method in assessing the risks of counterparty reliability, which has not been considered by anyone from the scientific community before.
Discussing this model, using the methods mentioned above, we can assume that this model offers a convenient approach with sufficient calculation accuracy. This approach complements the work of Hayden L., in the question of choosing the necessary parameters for assessing security risks. In this case, we offer an affordable method for assessing business security risks, the so-called trustworthiness (Basili et al. 2014; Hayden 2010; Philippou et al. 2020).
Comparing the developed solution with the rating model of corporate information to ensure the economic security of (Na et al. 2019). it can be concluded that the use of the stochastic gradient descent method allows us to obtain an identical result with satisfactory accuracy and low time costs. (Bellotti et al. 2021). proved the effectiveness of using machine learning methods in forecasting and analysis.
Future research directions should take into account the industry-specific feature of company verification. Since different areas of activity have their own specific criteria. For organizations involved in the development and maintenance of information security, this will be especially important. In particular, when evaluating software development companies, on the possibility of their implementing undeclared features in the software. This approach can be used to develop a probabilistic model for evaluating the potential implementation of undeclared features in software packages. This will be relevant for two stages of the software development lifecycle—the choice of the contractor (developer company) and the approval of the technical specification.
For the stage of acceptance of works, it is relevant to use methods for identifying vulnerabilities and undeclared opportunities. For example, when developing a probabilistic model for the stage of selecting a developer company, the main directions of construction are planned:
  • analysis of potential development companies based on the parameters that characterize the trustworthiness of companies and their potential connections with competitors (including foreign ones);
  • accounting of publicly available sources of information about the counterparty’s activities in the field of information security (“State Register of Certified Information Security Tools”, etc.).

6. Conclusions

Currently, counterparty risk assessments are available only through subscription services for paid information and analytical systems. However, our proposed machine learning model can reproduce these estimates with reasonable accuracy based on the input data that is freely available.
Based on the results of the construction and testing of the model described above, it can be judged that the purpose of the work in determining a trustworthy or untrustworthy counterparty for making a management decision on cooperation has been achieved.
As a result of the experiments, a model was developed for assessing the risks of a management decision in cooperating with a counterparty, which classifies the counterparty as trustworthy (“+1”) or or untrustworthy (“−1”). This allows us to determine the risks, negative factors that may arise in cooperation with the counterparty, and the use of the model reduces the verification time. At the same time, the model gives an accurate result with a small number of compared counterparties, which corresponds to the order of verification of the counterparty in the real system. This model can be used in the development of information security policy, in particular in matters related to the assessment of counterparty trustworthiness risks. Due to the assessment of the trustworthiness of counterparties, the risk of non-fulfillment of obligations is reduced, and as a result, the number of crimes in the field of business activity is reduced. From the existing limitations, the lack of a well-developed scientific and methodological base in this direction, as well as the complexity of comparison with other researchers, is revealed. The future development of this study is planned to automate the risk assessment of the reliability of counterparties of various types of activities, taking into account industry specifics.

Author Contributions

Investigation, A.K. (Andrey Koltays), A.K. (Anton Konev) and A.S.; methodology, A.K. (Andrey Koltays); writing—original draft preparation, A.K. (Andrey Koltays); and writing—review and editing, A.K. (Anton Konev) and A.S. All authors have read and agreed to the published version of the manuscript.

Funding

This research was funded by the Ministry of Science and Higher Education of Russia, Government Order for 2020–2022, project no. FEWM-2020-0037 (TUSUR).

Institutional Review Board Statement

Not applicable.

Informed Consent Statement

Not applicable.

Data Availability Statement

Not applicable.

Conflicts of Interest

The authors declare no conflict of interest.

References

  1. Basili, Victor, Adam Trendowicz, Martin Kowalczyk, Jens Heidrich, Carolyn Seaman, Jürgen Münch, and Dieter Rombach. 2014. GQM+Strategies in a Nutshell. Cham: Springer International Publishing, pp. 9–17. [Google Scholar] [CrossRef]
  2. Bellotti, Anthony, Damiano Brigo, Paolo Gambetti, and Frédéric Vrins. 2021. Forecasting recovery rates on non-performing loans with machine learning. International Journal of Forecasting 37: 428–44. [Google Scholar] [CrossRef]
  3. Bodin, Lawrence D., Lawrence A. Gordon, and Martin P. Loeb. 2005. Evaluating information security investments using the Analytic hierarchy process. Communications of the ACM 48: 78–83. [Google Scholar] [CrossRef]
  4. Bodin, Lawrence D., Lawrence A. Gordon, and Martin P. Loeb. 2008. Information security and risk management. Communications of the ACM 51: 64–68. [Google Scholar] [CrossRef]
  5. Bonollo, Michele, Luca Di Persio, Luca Mammi, and Immacolata Olivad. 2017. Estimating the counterparty risk exposure by using the brownian motion local time. International Journal of Applied Mathematics and Computer Science 27: 435–47. [Google Scholar] [CrossRef] [Green Version]
  6. Coles-Kemp, Lizzie, and Richard E. Overill. 2007. On the role of the facilitator in information security risk assessment. Journal in Computer Virology 3: 143–48. [Google Scholar] [CrossRef]
  7. Cross-Validation: Evaluating Estimator Performance. 2021. Available online: https://scikit-learn.org/stable/modules/cross_validation.html (accessed on 12 May 2021).
  8. Fainzilberg, Leonid Solomonovich, and Tatyana Nikolaevna Zhuk. 2009. Guaranteed Assessment of Efficiency of Diagnostic Tests Based on Advanced ROC-Analysis. Garantirovannaia Otsenka Effektivnosti Diagnosticheskikh Testov na Osnove Usilennogo ROC-Analiza], Control Systems and Machines 5: 3–13. [Google Scholar]
  9. Fawcett, Tom. 2006. An introduction to ROC analysis. Pattern Recognition Letters 27: 861–74. [Google Scholar] [CrossRef]
  10. Gordon, Lawrence A., and Martin P. Loeb. 2006. Budgeting process for information security expenditures. Communications of the ACM 49: 121–25. [Google Scholar] [CrossRef]
  11. Hayden, Lance. 2010. IT Security Metrics: A Practical Framework for Measuring Security & Protecting Data Case Study 1: In Search of Enterprise Metrics. New York: McGraw-Hill Education Group. [Google Scholar]
  12. Koltays, Andrey, Anton Konev, Alexandra Shatrova, and Polina Shelupanova. 2020. Automation of tax control mechanism with the use of specialized information and analytical systems within the framework of ensuring security. International Journal of Emerging Trends in Engineering Research 8: 1405–9. [Google Scholar] [CrossRef]
  13. Ias «spark». 2021. Available online: http://www.sparkinterfax.ru/ (accessed on 25 April 2021).
  14. ISO/IEC 27001 Information Security Management. 2005. Available online: https://www.iso.org/isoiec-27001-information-security.html (accessed on 14 April 2021).
  15. Na, Onechul, Lee Won Park, Harang Yu, Yanghoon Kim, and Hangbae Chang. 2019. The rating model of corporate information for economic security activities. Security Journal 32: 435–56. [Google Scholar] [CrossRef] [Green Version]
  16. Park, Chulhyun, Cholsu Kim, Youngsung Kim, Hoon-sang An, and Jongho Bae. 2015. Improvement of Personal Information Protection Level in the Military Using the Measurement of Disclosure Risk. Journal of Security Engineering 12: 581–96. [Google Scholar] [CrossRef]
  17. Peltier, Thomas R. 2016. Information Security Policies, Procedures, and Standards: Guidelines for Effective Information Security Management. Boca Raton: CRC Press. [Google Scholar]
  18. Petrie, Aviva, and Caroline Sabin. 2020. Medical Statistics at a Glance, 4th ed. Hoboken: John Wiley & Sons. [Google Scholar] [CrossRef]
  19. Philippou, Eleni, Sylvain Frey, and Awais Rashid. 2020. Contextualising and aligning security metrics and business objectives: A GQM-based methodology. Computers and Security 88: 101634. [Google Scholar] [CrossRef]
  20. PSB Analytics & Strategy Magram Marce Research. 2020. Available online: http://magram.ru/news/fraud.html (accessed on 14 April 2021).
  21. Refaeilzadeh, Payam, Lei Tang, and Huan Liu. 2009. Cross-validation. In Encyclopedia of Database Systems. New York: Springer, vol. 5, pp. 532–38. [Google Scholar]
  22. Saaty, Thomas L. 1990. How to make a decision: The analytic hierarchy process. European Journal of Operational Research 48: 9–26. [Google Scholar] [CrossRef]
  23. Scipy.stats.ttest_ relvalidation. 2021. Available online: https://docs.scipy.org/doc/scipy/reference/generated/scipy.stats.ttest_rel.html (accessed on 12 May 2021).
  24. Shameli-Sendi, Alireza. 2020. An efficient security data-driven approach for implementing risk assessment. Journal of Information Security and Applications 54: 102593. [Google Scholar] [CrossRef]
  25. Sklearn.linear_model.sgdclassifier. 2021. Available online: https://scikit-learn.org/stable/modules/generated/sklearn.linear_model.sgdclassifier.html (accessed on 10 May 2021).
  26. Stochastic Gradient Descent. 2021. Available online: https://www.coursera.org/lecture/supervised-learning/stokhastichieskii-ghradiientnyi-spusk-xry50 (accessed on 10 May 2021).
Figure 1. Results of experiments with the alpha attribute.
Risks 09 00133 g001
Figure 2. Results of experiments with the tol attribute.
Risks 09 00133 g002
Figure 3. Results of experiments with the tol attribute.
Risks 09 00133 g003
Table 1. The distribution of trustworthiness in the source sample and in the sample for modeling.
Company TypeQty%Sample for Simulation%
Trustworthy1597046.53159746.53
Not trustworthy1835453.47183553.47
Total quantity343241003432100
Table 2. Risks in the SPARK information and analytical system.
DDIFRIPDI
Due Diligence Index represents a value from 1 to 99, where a higher value reflects a greater probability that the company was created not for statutory purposes, but as a “transactional unit” that does not have significant assets and operations of its own, or is an “abandoned” assetFinancial Risk Index it is a value from 1 to 99, where a higher value indicates the presence of signs of unsatisfactory financial condition, which may lead to the fact that the company will lose its solvencyPayment Discipline Index (Paydex) represents a value from 0 to 100, where a lower value indicates a high risk of late payments. The payment discipline index is calculated automatically based on the company’s payment data
Table 3. Description of input data (Data in text format).
NameValuesOmissions
1Company sizeMicroenterprises, small enterprises, medium enterprises, large enterprisesYes
2Important informationNo information, there is informationNo
Table 4. Description of input data (Data in numeric format).
NameValuesMaximum ValueOmissions
1Age of the company142.5No
2Average number of employees1916No
3Net profit−397929690003784514000No
4Repayment period of accounts payable−23.8518290058.75Yes
5Repayment period of accounts receivable−767567533Yes
6Fixed asset turnover period−66.46944397.5Yes
7Asset turnover period−658120997003No
8Absolute liquidity ratio−43.48%88311.11%Yes
Table 5. Converting data to text format to the numeric format.
NameTransformation
Company size0—microenterprises, 1—small enterprises, 2—medium enterprises, 3—large enterprises
Important information0—no important information available, 1—important information is available
Table 6. Results of experiments on model attributes.
AttributeAccuracyCompletenessPercentage of Correct AnswersAUC-ROC
alpha = 0.010.68520.84130.76040.7535
alpha = 0.0010.75450.7260.7640.7614
alpha = 0.00010.76030.69450.75750.7531
tol = None0.75630.70390.75820.7544
tol = 0.010.70230.86930.76910.7561
tol = 0.0010.76030.69450.75750.7631
tol = 0.00010.81740.6230.71220.7536
Table 7. An example of the quality of forecasting the trustworthiness of the counterparty using the constructed model.
Number of objects234567891011
AUC-ROC1111110.830.830.870.87
Statisticnonenonenonenonenonenonenonenone−1−1
Pvaluenonenonenonenonenonenonenonenone0.34340.34
Number of objects12131415161718192021
AUC-ROC0.90.90.840.850.850.790.740.740.750.75
Statistic−1−1000−0.57−1−1−1−1
Pvalue0.340.341110.580.330.330.330.33
Publisher’s Note: MDPI stays neutral with regard to jurisdictional claims in published maps and institutional affiliations.

