1. Introduction
Satoshi Nakamoto, whose true identity has never been revealed, came up in 2009, with the first blockchain network and published a paper that said, “What is needed is an electronic payment system based on cryptographic proof instead of trust, allowing any two willing parties to transact directly with each other without the need for a trusted third party” (
Nakamoto 2008). This is the origin of cryptocurrencies and to better understand them we need to understand the background of the global financial crisis of 2009 on which they were launched.
The traditional banking industry was seen to be losing its purpose with avaricious managers resorting to indiscriminate lending that ultimately led to the collapse of the financial system with its subprime lending and with quite a few big banks going bust. On top of that, the central banks went on a money producing spree to save those in trouble, their follies with taxpayer money to save the “system” from collapse raising question marks on the sanctity of fiat currency. Thus the search for alternatives started (
Nakamoto 2008).
In “Bitcoin: A Peer-to-Peer Electronic Cash System” (
Nakamoto 2008), Satoshi Nakamoto explains, if these financial intermediaries, banks, and regulators like central banks that are needed in every transaction today, mainly because of a lack of trust in dealing with unknown parties, are to be avoided, why not use a network? In that way, the trust factor becomes redundant and even the cost of these financial intermediaries is saved! This network is called blockchain, where all transactions happen peer to peer without any intermediary, and are recorded in a ledger simultaneously, and are open to all. According to
Mikhaylov (
2021), the competition through public and private money can be increased by digitalisation. Also, the result shows that in a digital economy any payments can be centred around economic and social platforms.
Satoshi Nakamoto decided to cap the supply of Bitcoins at 21 mn so that it should not resemble fiat currencies and rather should have a limited supply like gold in which everything else will be valued. At present, there have been approximately 18.7 mn Bitcoins mined and if the current mining trend holds, the last Bitcoin is supposed to be mined in the year 2140. However, along with the technology and network that cryptocurrencies provide comes their share of hazards. If the strength of cryptocurrencies is no central control, and it provides essentially peer-to-peer transaction and anonymity, the same strength becomes a weakness when used for illegal activities. That has damaged their reputation.
In this paper, we study the monthly bitcoin price volatility with three other financial assets before and during COVID-19. Many previous studies on Bitcoin volatility are based on financial assets. Previous authors usually argue about important macroeconomic and financial predictors such as
Baur et al. (
2018b). Given that, we show the actual and forecasted prices for all four financial assets to see the forecasting accuracy.
We test the mean absolute percentage error for the volatility of Bitcoin before and during the COVID-19 outbreak comparing it with other financial assets. Also, we run correlation analysis to see if there is any positive or negative among Bitcoin, S&P 500, Gold and TLT(Treasury Bond).
2. Literature Review
Since there is no core theme on which everyone agrees upon for cryptocurrencies, various experts have expressed their opinions in various papers and news articles. Those will be used for analysis and forming a conclusion towards a cohesive economic theory. Historical price data of Bitcoin will be used to compare different arguments and determine the status of cryptocurrencies along with the legal aspect. Since all regulations attempt to classify cryptocurrencies in one form or other, in a certain category, this paper attempts to foresee how governments can use them in their policy formation.
Can cryptocurrencies be a store of value, an investment? Are they a good investing commodity due to their liquidity but very high volatility?
Corbet et al. (
2018) explore dynamic relationships between cryptocurrencies and other financial assets, using data from
CryproCompare.com for cryptocurrencies and Bloomberg for financial assets. Corbet et al. conclude that diversification in the short term for investors is the major benefit of cryptocurrencies. Still, there are quite a few variations in linkages with returns of crypto and other assets if considered in different timeframes and those are on account of external economic and financial shocks. They have used the generalised variance decomposition methodology.
Is cryptocurrency money? Money is a medium of exchange, a unit of account, and a store of value.
Bjerg (
2016) has explained that Bitcoin is money. The author concludes that Bitcoin is commodity money without gold, fiat money without a state, and credit money without debt. The author finally says Bitcoin is something between money and a commodity, although closer to this last one.
What determines the price of cryptocurrencies? Establishing the price for any money or commodity is a peculiar variable. Difficulty levels in extracting or the availability in the market or simply investor interest at that point of time are some of the variables that determine price discovery.
Vieira (
2017) takes a deep dive into an analysis of the formation of the Bitcoin price and also includes volatility and other key drivers. The author gathers data on the Bitcoin price; the Standard & Poor 500 (SP500) index, the daily treasury yield rates of “Treasury Inflation-Protected Securities”; the daily USD price per ounce of gold; the daily number of confirmed Bitcoin transactions; the total number of unique addresses used on the Bitcoin blockchain; the total value of coin base block rewards and transaction fees paid to miners, and the daily number of the term ‘Bitcoin’ queries made in Wikipedia. The author concludes that volatility can also affect price formation (negative shocks have a stronger impact on volatility than positive ones). Also, the author says that the number of transactions and the daily price of gold have a negative relationship with the Bitcoin price.
An important question: Ray Dalio of Bridgewater asks if limited supply is the biggest USP of Bitcoins, then what about other such cryptocurrencies? Although Bitcoin is limited in supply, digital currencies are not limited in supply because new ones have come along and will continue to come along to compete so the supply of Bitcoin-like assets should, and competition will, play a role in determining Bitcoin and other cryptocurrency prices. The better ones will displace these existing ones. Then since Bitcoin works fixedly, it will not cope with the evolving usage of cryptocurrencies, and that is a big risk. Hence the biggest USP i.e., “limited supply” is not as sound as it may appear. For example, if Blackberries were in limited supply they still would not be worth much because they were replaced by more advanced competitors, he says (
Bridgewater 2021). Before going to cryptocurrencies and Bitcoin let us try to understand in simple terms the technology behind cryptocurrencies i.e., Bitcoin. Also, more recent research by
Vukovic et al. (
2021), argues that gold and oil, as typical global commodities, could have been more diversifiers crisis during the first wave of the COVID-19.
2.1. Blockchain Technology
According to
Lynn et al. (
2019), Blockchain is a kind of database, whereas the database itself is a storage of information on a computer system through electronic means. Data i.e., information is stored in the form of tables to make it easier to search when required. For a small amount of information or a small number of people, one can use a spreadsheet but for a very large amount of data storage that can be accessed by several people at once or changed frequently or searched very often, spreadsheets cannot be used due to obvious limitations, and that is where the database has its advantage.
The housing of data is carried out in large databases on a network of supercomputers, which may be hundreds or thousands called servers. While spreadsheets are normally under the control of one single entity, large databases may be maintained by some entity but are not under the control of any single entity and can be accessed, changed, filtered by many people at a time. There is a difference in storage structure between blockchain & database.
How data are structured in blockchain and a database forms the major difference between the two. Information is collected in blocks (groups) that have a certain capacity. The block is chained when miners find the solution of proof of work puzzle to earlier filled blocks hence the name blockchain. While in a database, the data storage is structured in the form of tables linearly and not in the form of blocks. Hence all blockchains are databases but not all databases are blockchains. Because of this sequencing of blocks, the timeline is defined automatically and cannot be changed and the block is cast in stone when filled with data. Every block in the chain has a fixed timing that cannot be changed without unravelling the whole chain.
Since blockchain has the inherent advantage that it cannot be modified, it finds its usage in industries like payments, cybersecurity or healthcare, and others. Effectively it is a distributed ledger that records digital assets. Instead of copying or transferring, those digital assets are distributed, creating an immutable record. Thus, total transparency and real-time access are given to all public as the asset is decentralised. In turn since the ledger of changes is transparent it creates more trust. A more recent study by
Giudici and Pagnottoni (
2020) indicates that Bitcoins prices may differ across trading venues due to various exchanges. In their investigation, they considered eight major exchanges of Bitcoin. Their finding shows that there is a significant connectedness among the exchanges. Moreover, they found that connectedness across exchanges is significantly dynamic.
Blockchain consists of three important concepts: blocks, nodes, and miners. There are three elements to define a block; data in the block, a 32-bit whole number called a nonce and a 256-bit number called a hash. When a block is created, a nonce is randomly generated; subsequently, the nonce generates the block header i.e., cryptographic hash. Nodes are electronic devices that maintain the blockchain and keep the network functioning. They are kind of access points to a distributed ledger and hence no one person or entity controls it, which gives the decentralised nature to blockchain technology. Every node has its copy of the blockchain and the network must algorithmically approve any newly mined block for the chain to be updated, trusted, and verified. Each participant is given a unique alphanumeric identification number that shows their address. Bitcoin shows due to a system of checks and balances, the blockchain maintains integrity and creates trust among users and hence public information can be safely stored in it. New blocks are created by miners by a process called mining. Since every block in a blockchain not only has its unique nonce and hash but also refers to the previous block, mining can become complex for large blockchains. Miners solve a complex maths problem to find an acceptable hash to nonce. A 32-bit nonce and 256-bit hash have approximately 4 bn nonce hash combinations, making finding the right one extremely difficult. When a miner finds that, their block is added to the blockchain
Also, Bitcoin shows that if someone wants to make a change in the block, it requires a change in all the subsequent blocks making it extremely difficult to manipulate the blockchain. When a block is successfully mined, the change is accepted by all of the nodes on the network.
2.2. Supply of Bitcoins
Past transactions of Bitcoins are recorded in a public ledger and mining means adding to this transaction record. Just like a rig used in, say, oil drilling, in cryptography, there is a single computer system that performs all the calculations required for mining. This public ledger also called the blockchain of Bitcoins confirms the transaction to the network and is used by nodes to distinguish illegitimate transactions from legitimate ones.
Since mining is highly resource-intensive and difficult, the number of blocks found each day by miners remains steady. Individual blocks to be considered valid must contain proof of work verified by other Bitcoin nodes each time they receive a block. Bitcoin nodes reach a consensus about ordering events by downloading and verifying this blockchain. Hence it is computationally impossible to modify the history of transactions by any one entity. Miners also introduce Bitcoins into the system and are paid any transaction fees as well as a “subsidy” of newly created coins. This way new Bitcoins are disseminated and decentralised and safety in numbers is provided by the system.
An important difference between commodity mining and Bitcoin mining is that the supply does not depend on the amount of mining. The total number of Bitcoins mined does not depend on how many miners with what capacity are mining. The discoverer is awarded a fixed number of Bitcoins when a new block is discovered and this number halves every 210,000 blocks. Currently, it is 6.25 Bitcoins per block. Also, as an incentive for the miner to include the transaction in their block, the miner receives fees paid by users sending transactions. As the number of Bitcoins per block is decreasing, these fees out of the transaction will become a major source to miners with higher adoption of Bitcoin.
2.3. Limited Supply
As we have seen, Bitcoins are created when the miner discovers a new block. The rate at which a block is created is adjusted every 2016 blocks which in turn is designed to be constant for 2 weeks i.e., 6 per hour. Every 210,000 blocks created; the number of Bitcoins that are awarded per block decreases geometrically at a rate of 50%. Hence approximately every 4 years, the number of Bitcoins per block generated is halved and the total number will be slightly less than 21 mn. It matches a 4-year reward halving schedule or the ultimate total number of Satoshis. Satoshi has never really justified or explained many of these constants.
This decreasing-supply algorithm was chosen because it approximates the rate at which commodities like gold are mined.
3. Crypto (Bitcoin) Main Points of Analysis
3.1. Bitcoin as Fiat Money and Digital Gold
Money has three basic attributes; it is a medium of exchange, a unit of account, and a store of value (
Openlib 2021). Fiat money does not have intrinsic value, since a central authority i.e., the government, declares it as a legal tender, value is attributed to it. Debt is the cornerstone of fiat money, let it be banks or governments someone takes a loan hence money is created. While issuing a banknote, the central bank is also giving you a percentage of the loan as a citizen of that country.
Hence fiat money is equal to debt and it can be increased or decreased by a fiat. Bitcoin does not depend on a debt system, its value depends mainly on the trust of its community, its effectiveness as a medium of exchange. Cryptocurrencies can be money as far as they allow two parties to exchange value but that can be said about a lot of others like gold or even to a barter system. Unlike fiat money cryptocurrencies (Bitcoin) is controlled by no central authority it has limited supply and cannot be increased or decreased by a fiat. It can be spent and received by anyone, anywhere, at any time throughout the world and without the need for a financial intermediary like a bank or a government. Bitcoin since September has been legal tender in El Salvador, so it is a fiat currency in that country now.
The disadvantages of Bitcoin as money have been explained by Melissa L. Pattinson in her book, “Buying into Bitcoin, An Austrian Analysis of the Virtual Currency’s Sustainability”. She explains as Bitcoin fails Ludwig von Mises’s Regression Theorem, according to the Austrian economic perspective, Bitcoin cannot function as money (
Pattinson 2011).
In 1912, Ludwig von Mises in his book “The Theory of Money and Credit, the Regression Theorem” first proposed that the value of money can be traced back (“regressed”) to the goods and services it obtains. According to this theorem, a good with objective exchange value i.e., the capacity of the good in specific conditions to procure a particular quantity of other goods is derived not from nature but by the human process of valuing individual goods, essentially an emotion can become money afterwards according to the
Mises Institute (
2019).
According to Pattinson, Bitcoin fails the Theorem due to two main reasons:
Cryptocurrency has no commodity value;
And since it did not have value before being used as money, it does not have exchange value.
The main counterargument to this is that the whole economic system at present uses fiat money. All fiat currencies are legal tenders because they are sanctioned by respective governments and are based on faith in the economy and credit (against debt) in the economy. Earlier they were tied up with the value of gold, but since 1971, as the USA removed its dollar peg to gold, they have been without any underlying commodity (physical) value. Pattinson concludes that since Bitcoin has no foundation in any of the correct economic theory it is not sustainable in today’s economy.
3.2. Bitcoin as a Currency—Deflation Threat
Another issue with Bitcoins as money comes from its main USP, limited supply, deflation. If Bitcoin is used widely, as its monetary base is limited and cannot be expanded, the economy may create a deflationary scenario which worst case in Keynesian economics, disincentivising individuals to spend, and businesses to invest rather than save, destroying job creation in the process
Bouri et al. (
2017).
A counter-argument to this goes like this: since deflation happens across the chain from raw materials to producers to sellers, it does not change profit ratios for investors or entrepreneurs.
Yermack (
2015) shows that the net effect is they are unlikely to change their investment decisions that are important for job creation. Put differently, in deflation price of goods and services decreases, but the cost of production of these goods and services also decreases thus maintaining the profitability. Savings increase for consumers that decrease the cost of capital incentivizing entrepreneurs to invest. Having said that, this cycle is not smooth and there are big time differences in those stages creating a recession, history suggests.
3.3. Bitcoin Volatility Far Exceeds Even That of Most Volatile Currencies
Bitcoin volatility far outstrips that of many emerging market currencies. For example, Bitcoin is more volatile than currencies with strict capital controls, which are typically found in EM countries with high inflation. As a result, the claim that cryptocurrency could replace some volatile emerging market currencies is based on shaky ground when it comes to Bitcoin liquidity, there have been some positive developments. For example, the notional dollar value of Bitcoin trading volume has risen to more than 5–10
x that of gold in the last two years, despite being primarily driven by price appreciation (
Coindesk 2021). As a result, large transactions are becoming more common in the crypto space.
3.4. Bitcoin as ‘Digital Gold’
Recently one can see there is a shift in retail market participants’ instinct to HODL (hold on for dear life) about Bitcoin which indicates a change in perception. Even though its usage as currency in payments is increasing, there is a digital scarcity of Bitcoin for retail people that has made it a unique asset owing to its limited supply just like gold, hence the term ‘digital gold’. Even though the supply of both is seen as limited, we know the exact supply of Bitcoin whereas the amount of gold that has not been mined is unknown. Just like gold is divided into kilograms and ounces Bitcoin can be divided into Satoshi units equating to 100 millionths of one Bitcoin.
This analogy is opposed by many sightings while gold is a tangible asset, it has intrinsic value whereas Bitcoin is an intangible digital asset hence has no intrinsic value (
Baur et al. 2018b). It has value because people believe it has value and for some reason, that perception goes away then Bitcoin would be worthless. Others focus on the network and services that have been built around Bitcoin, new business models being designed around it and new technology created as well as the brand, Bitcoin has become, invalidates this intrinsic value argument. Albeit slowly, as institutional participation in Bitcoin is increasing, it will give increasing legitimacy to the cryptos and the ecosystem surrounding it. A previous study by
Maiti et al. (
2020) review the five cryptocurrencies daily mean return time series linearity
3.5. Bitcoin Return Distribution
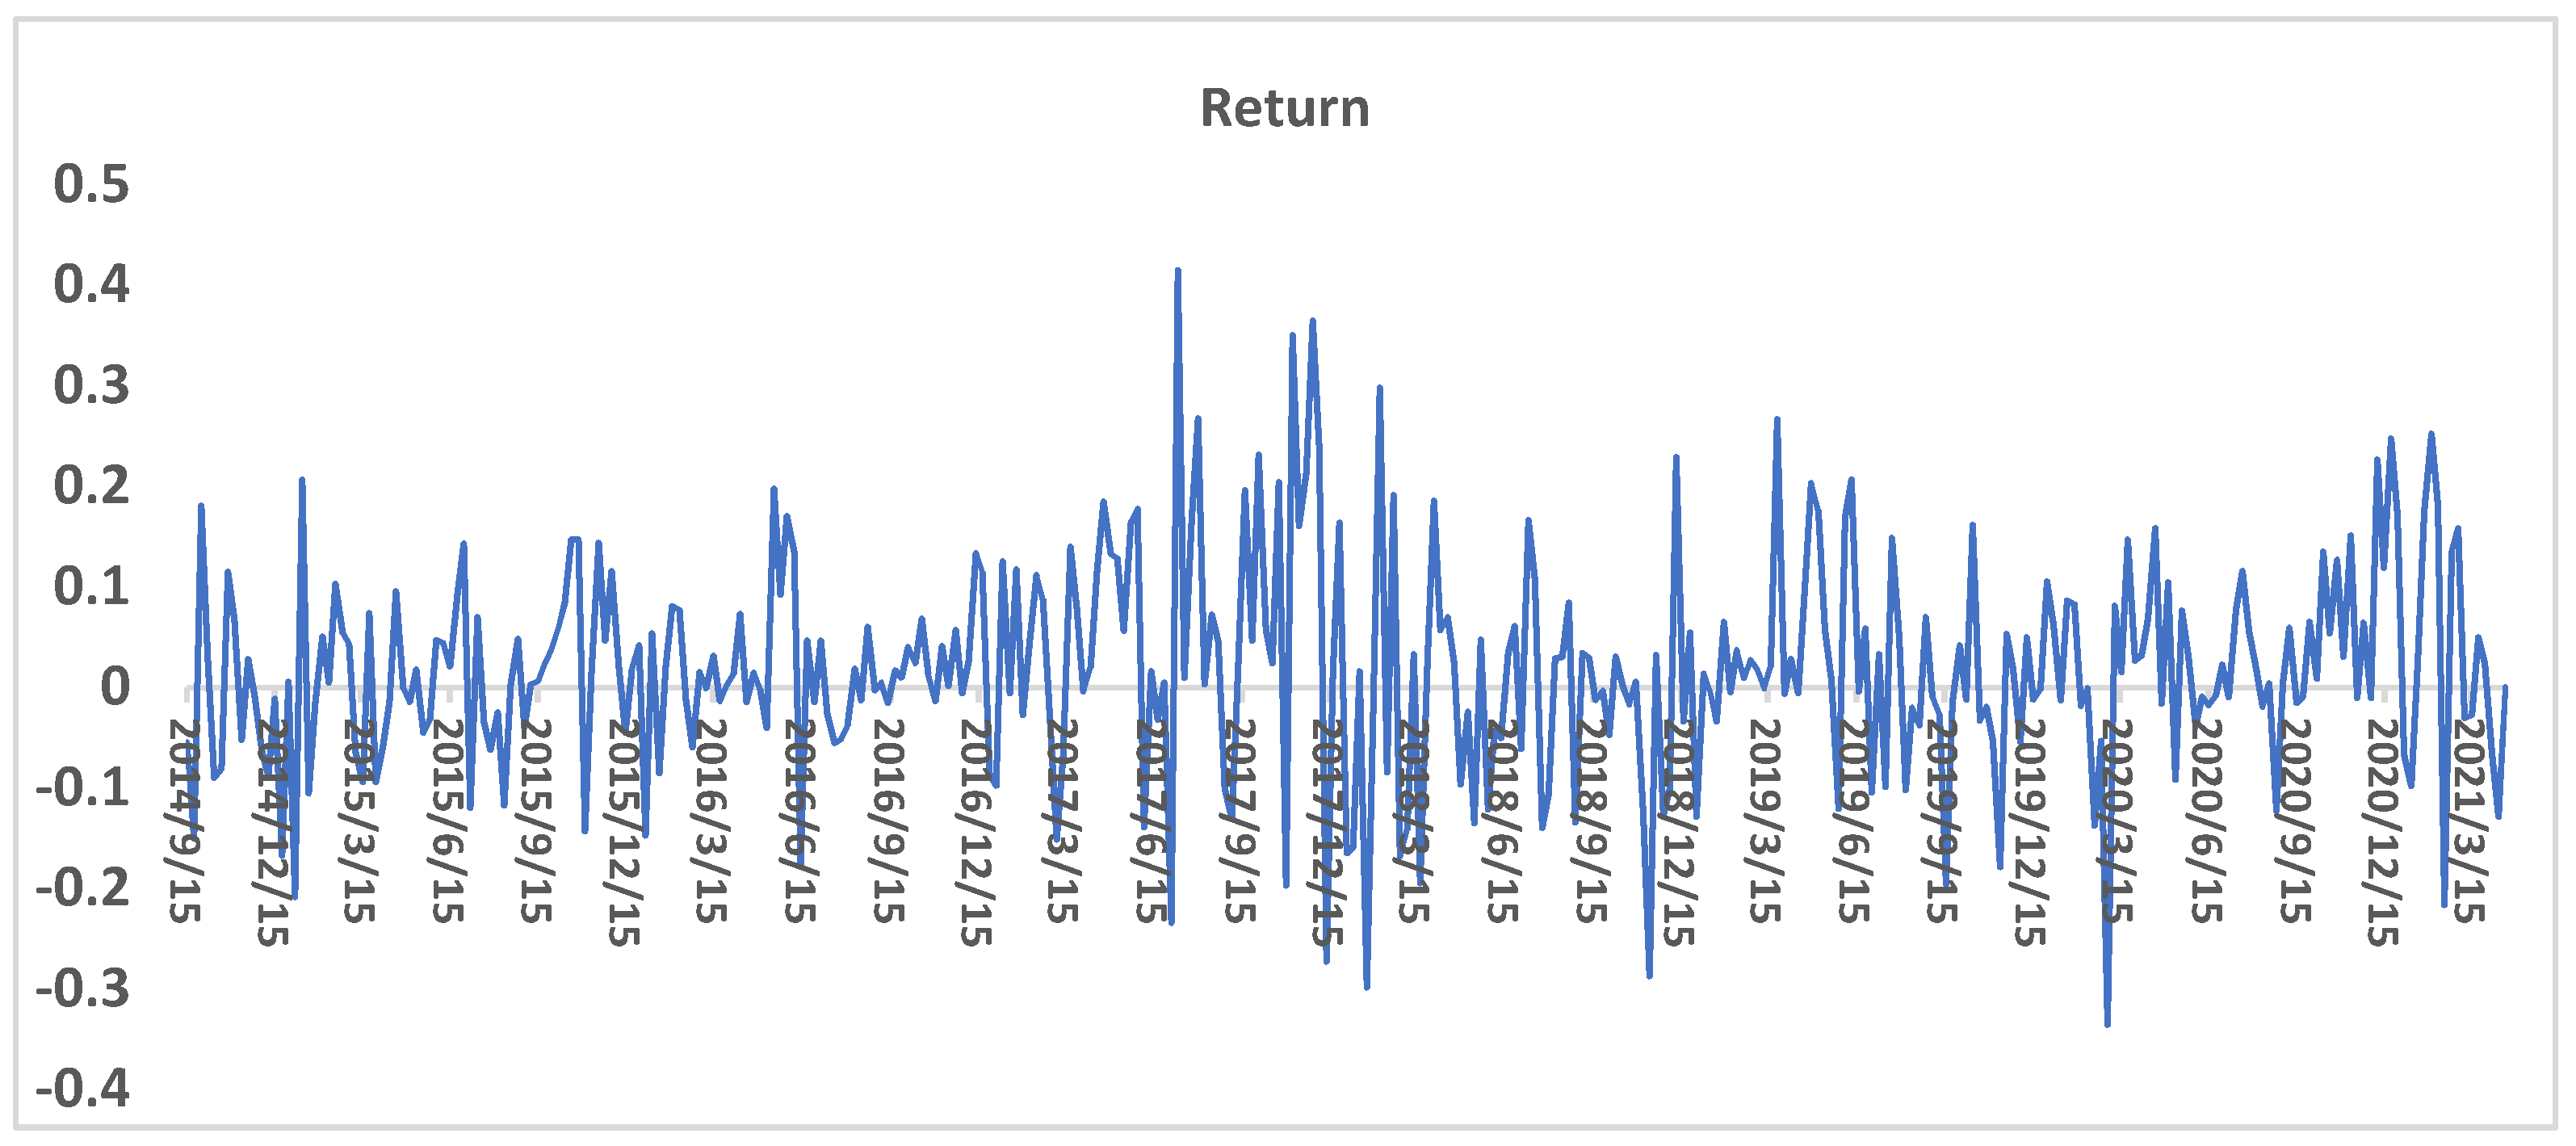
Figure 1 shows the Bitcoin monthly return volatility from 15 September 2014 to 15 September 2021. It demonstrates a big fluctuation between 2017 and 2018. In
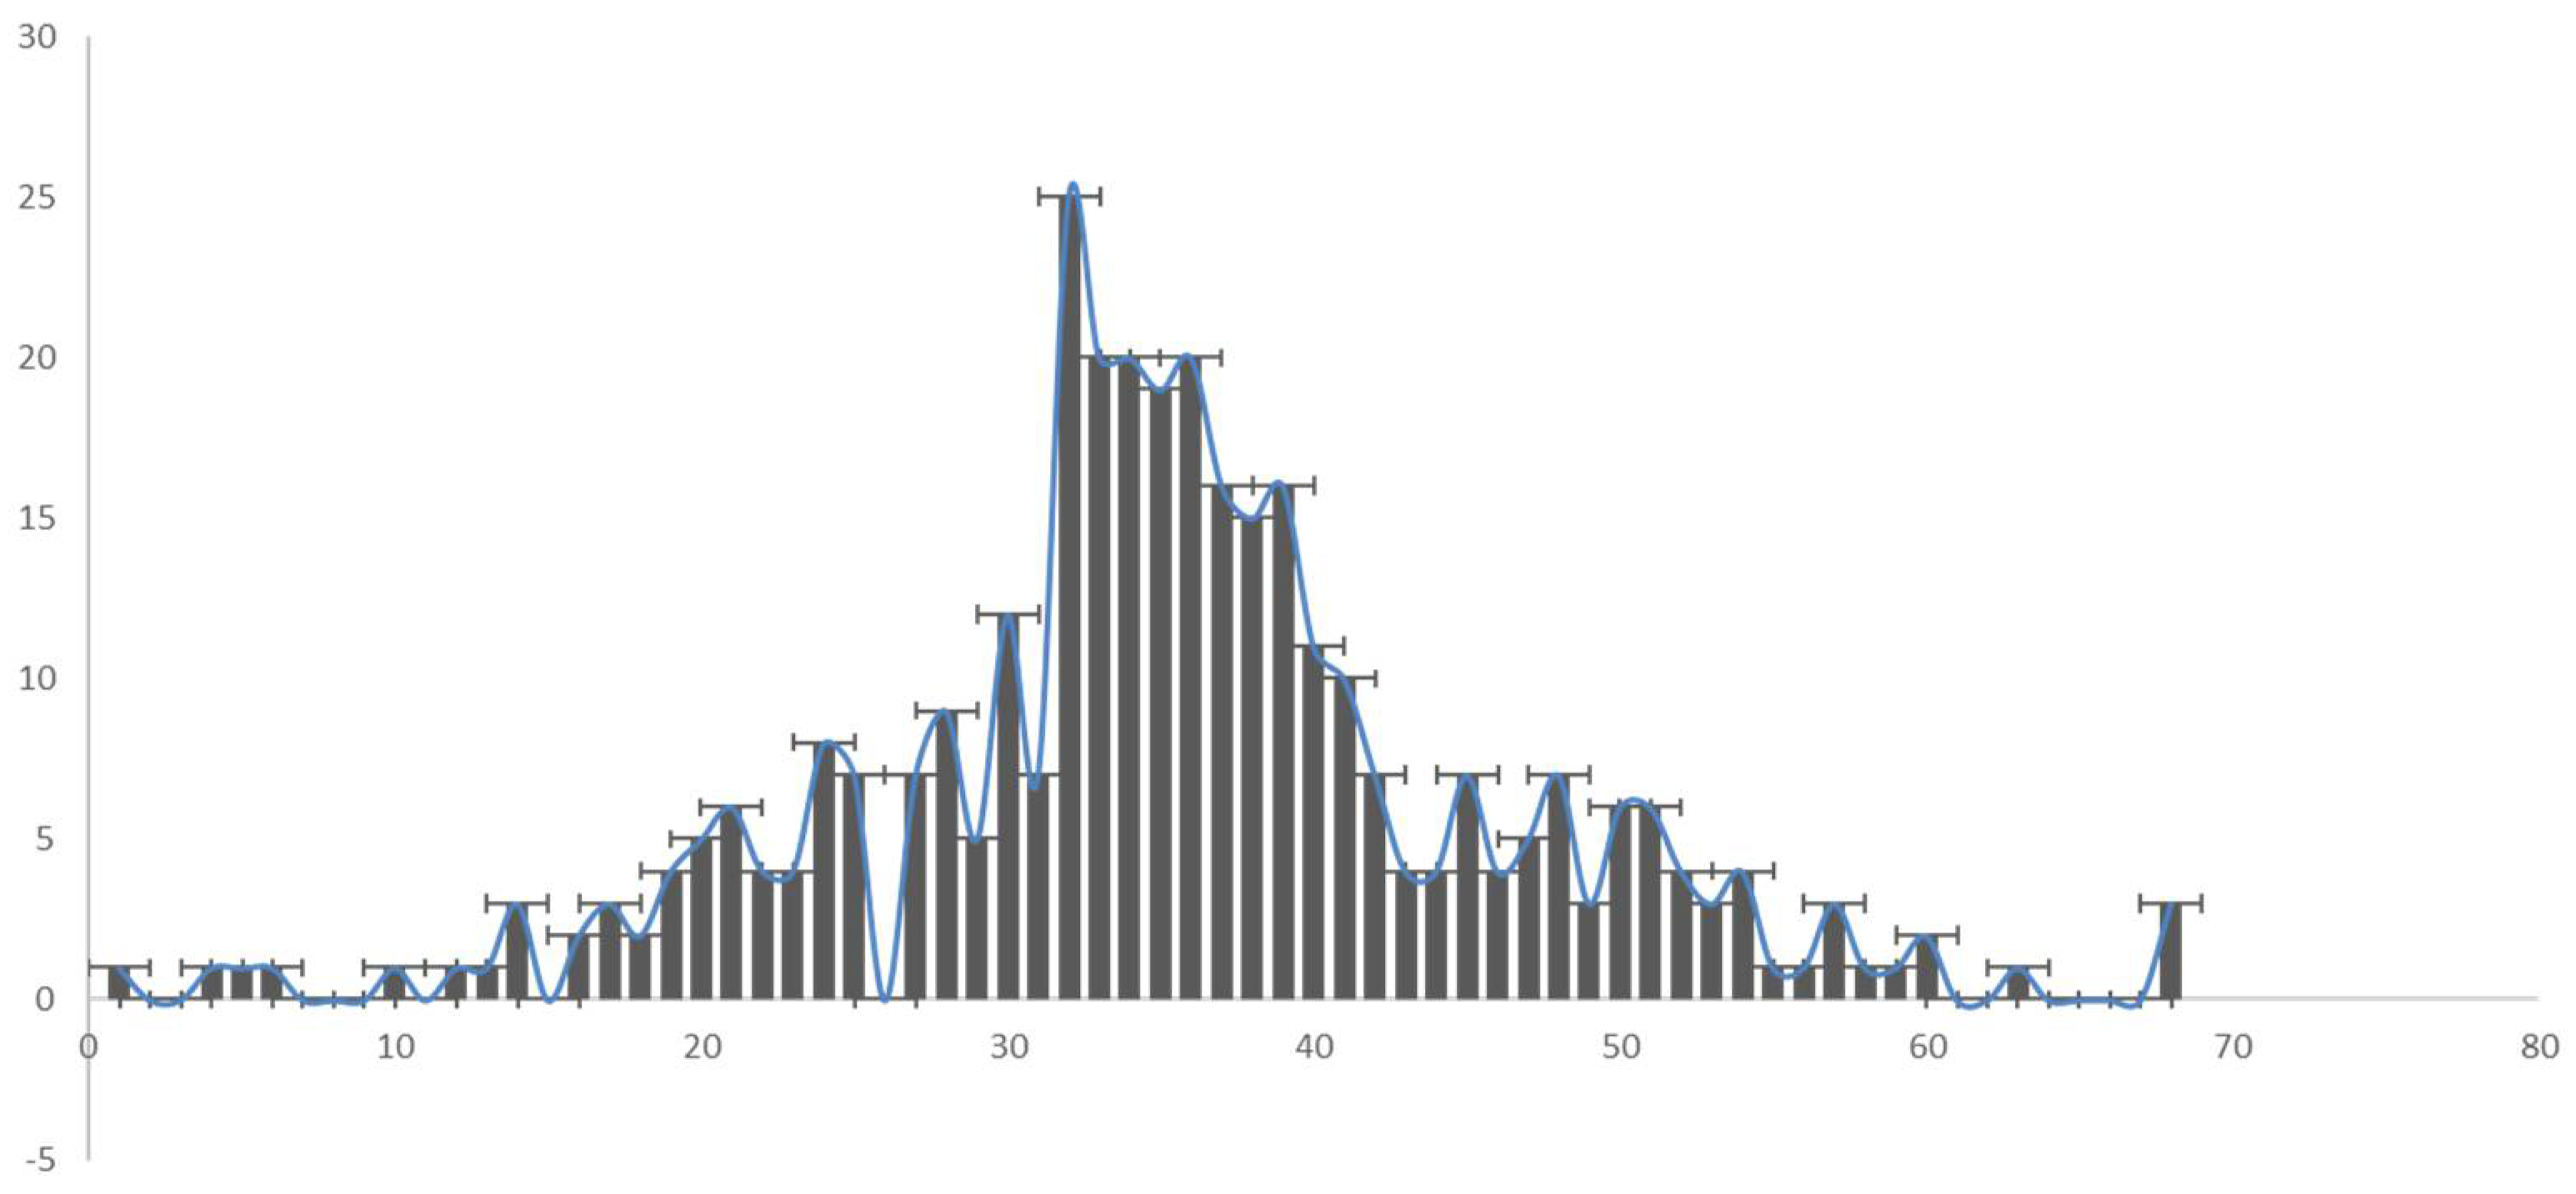
Figure 2, we provide a simple histogram of the monthly returns of Bitcoin from September 2014 to September 2021. The
x-axis shows the monthly returns. The
y-axis, the number of monthly observations. It has a mean of 1.9%—that is the average weekly return through time, and is positive, an obvious point, given Bitcoin’s overall performance since birth. The standard deviation of the distribution gives us an idea of the average deviation that the returns exhibit around the mean and it is 10.63%, quite large. The distribution is slightly positively skewed, indicating a tendency for the tail of the distribution to stretch more to the right indicated by the length of the right tail, which is longer. Finally, a positive kurtosis value indicates an (albeit small) tendency for more of the observations to reside in the tails than at the centre, and hence the characteristic leptokurtic shape of the distribution (thin centre, fatter tails). The grey curve depicts a ‘normal distribution’ as a comparison.
Currently, Bitcoin exhibits returns that can therefore be characterised as slightly positive on average every week; a significant variation on the actual weekly returns; a significant number of large (positive or negative) returns; skewed slightly to the positive side.
Generally, that is a good set to have exposure to as an investor. Positive on average with the chance of some very large returns, and with a higher frequency of them occurring on the positive side.
When considering an asset’s inclusion into a portfolio, three key criteria need to be considered from a top-down risk perspective: namely the asset’s independent volatility, its correlation to other assets in the portfolio (which ultimately lead to diversification benefits), and its weight. The first two are exogenous, whereas the third you can control directly yourself. Fidelity Investments
1 survey in 2020 on Bitcoin identified that the biggest obstacles cited by firms still hesitant to invest in crypto were price volatility and concerns about market manipulation.
Figure 2 shows a simple histogram of the monthly return’s normal distribution of Bitcoin between 15 September 2014 to 15 September 2021. The blue line which is overlaid indicates a normal distribution with mean and standard deviation taken from the empirical Bitcoin/London exchange rates.
3.6. Volatility in the Price of Bitcoin
Volatility is a measure of price dispersion. Here’s what Bitcoin’s volatility looks like since 2019. More recent studies by
Izadi et al. (
2021) indicates how the magnitude of the COVID-19 outbreak can impact the stock price movements on the UK market. Note the recent spike accounted for by the price fall in March 2020 related to the COVID market events. Currently, Bitcoin volatility is at ~60% (which it turns out is about the 20th percentile—so in Bitcoin’s history, current volatility levels are in the lowest 20%. In
Figure 3, we show the 60-day volatility of Bitcoin with that of S&P 500, gold, and Treasury Bonds. We used the last 60 days of returns as the input for our volatility calculation. As a comparison, below is the volatility of Bitcoin versus S&P 500, gold, and Treasury Bonds, since 2019.
3.7. Major Price Crashes of Bitcoin
Even though Bitcoin came into existence in 2009, it was a relatively unknown entity and not widely traded or held until 2017. Its price skyrocketed in 2017 virtually taking it into bubble territory. A big crash soon ensued in which price came down by approximately 90% in the next year. Here is a list of large price crashes in the short history of 12 years of Bitcoin and the circumstances surrounding them.
Mt. Gox, a leading cryptocurrency exchange experienced the highest volumes of trading of all time. Hence the servers slowed and had to be shut down for 8 h creating a panic on top of the preceding price rally in Bitcoin led to a crash as people suspected their money may go to some unknown location and cannot be retrieved. They simply dumped Bitcoin and the price fell 80%. After the unprecedented rally in 2017, governments started voicing concerns about Bitcoin. The trigger was commented on by the government of South Korea and the Bitcoin price bubble popped. Over the next year, the price crashed from approximately 20,000 USD to 2000 USD, a 90% crash.
Implications of historical price crash What those price crashes show is the market is quite fragile, and there is a huge trust deficit as there is no central authority that guarantees the settlement of trades there are no underlying business and cash flows to value it, etc. The proponents say those crashes are part of the pains that come along with the new growing concept. There has been less research undertaken in the area of cryptocurrency volatility, and the current study focuses precisely on the need to address this gap. Given the previous literature review and descriptive information we wish to investigate the following hypotheses:
Hypothesis 1 (H1). The volatility of Bitcoin as a cryptocurrency is higher than that of other financial assets.
Hypothesis 2 (H2). The mean absolute percentage error for the volatility of Bitcoin before the COVID-19 outbreak is more than during the COVID-19 outbreak comparing it with other financial assets.
Hypothesis 3 (H3). There is a positive correlation between Bitcoin, S&P 500, gold and TLT.
4. Data Analysis and Interpretation
In this study, we use secondary data, i.e., the price history of Bitcoin over the last 7 years, is captured from trading exchanges. This information is available at websites
coindesk.com (accessed on 22 April 2021),
yahoofinance.com (accessed on 22 April 2021),
tradingview.com (accessed on 25 April 2021).
We estimate monthly returns of Bitcoin with that of S&P 500, gold, and TLT ETF (Treasury Bond, Exchange Traded Funds). Statistical tools such as correlation analysis and descriptive analysis are used. We follow the study by
Komaroff (
2020) and test the Pearson’s correlation, which evaluates the dependent and independent variable relationship. We did not see any correlation between Bitcoin with other financial assets.
We present the summary statistics of the returns in
Table 1. Panel A demonstrates the period the starting point of the COVID-19 pandemic outbreak in the UK. We notice that, except for Bitcoin, S&P 500, Gold and TLT, gold and all other assets experienced an increase in their average returns accompanied by high volatility. However, Bitcoin exhibits the highest return and highest risk during both sub-periods.
As indicated by
Baur et al. (
2018a), this spectacular growth is explained by strong demand from institutional investors. For instance, Tesla announced on 8 February 2021 that it had bought
$1.5 billion worth of Bitcoin, and it started accepting Bitcoin as a payment method for its products.
In this study, we use the Dickey-Fuller test to test the null hypothesis that a unit root is present in an autoregressive time series model.
The augmented Dickey-Fuller (ADF) test is a popular approach used for testing the unit root null hypothesis. The tests were performed on raw price indices and logarithm-transformed data in both levels and first differences.
In this study, we predict the month-ahead close price of four financial assets. We consider four numbers of historical samples to input the trained model and the close price of the next month is output. Then we run a recursive strategy to achieve the processing of training and test (
Liu and Long 2020). Several previous studies (e.g.,
Ćalasan et al. 2020;
Schroders 2017) employed four factors of statistical evaluation indicators to utilize and compare the performance of related models. These factors include the mean absolute error (MAE), the mean absolute percentage error (MAPE), the root mean square error (RMSE) and the standard deviation of the error (SDE). In the current study we follow the previous research and use the models as follows:
In the above models, N is the number of samples,
x(
t) is the actual monthly close price,
is the predicted monthly close price. The sample units as the main factor are impacted on the values at the above statistical indicators.
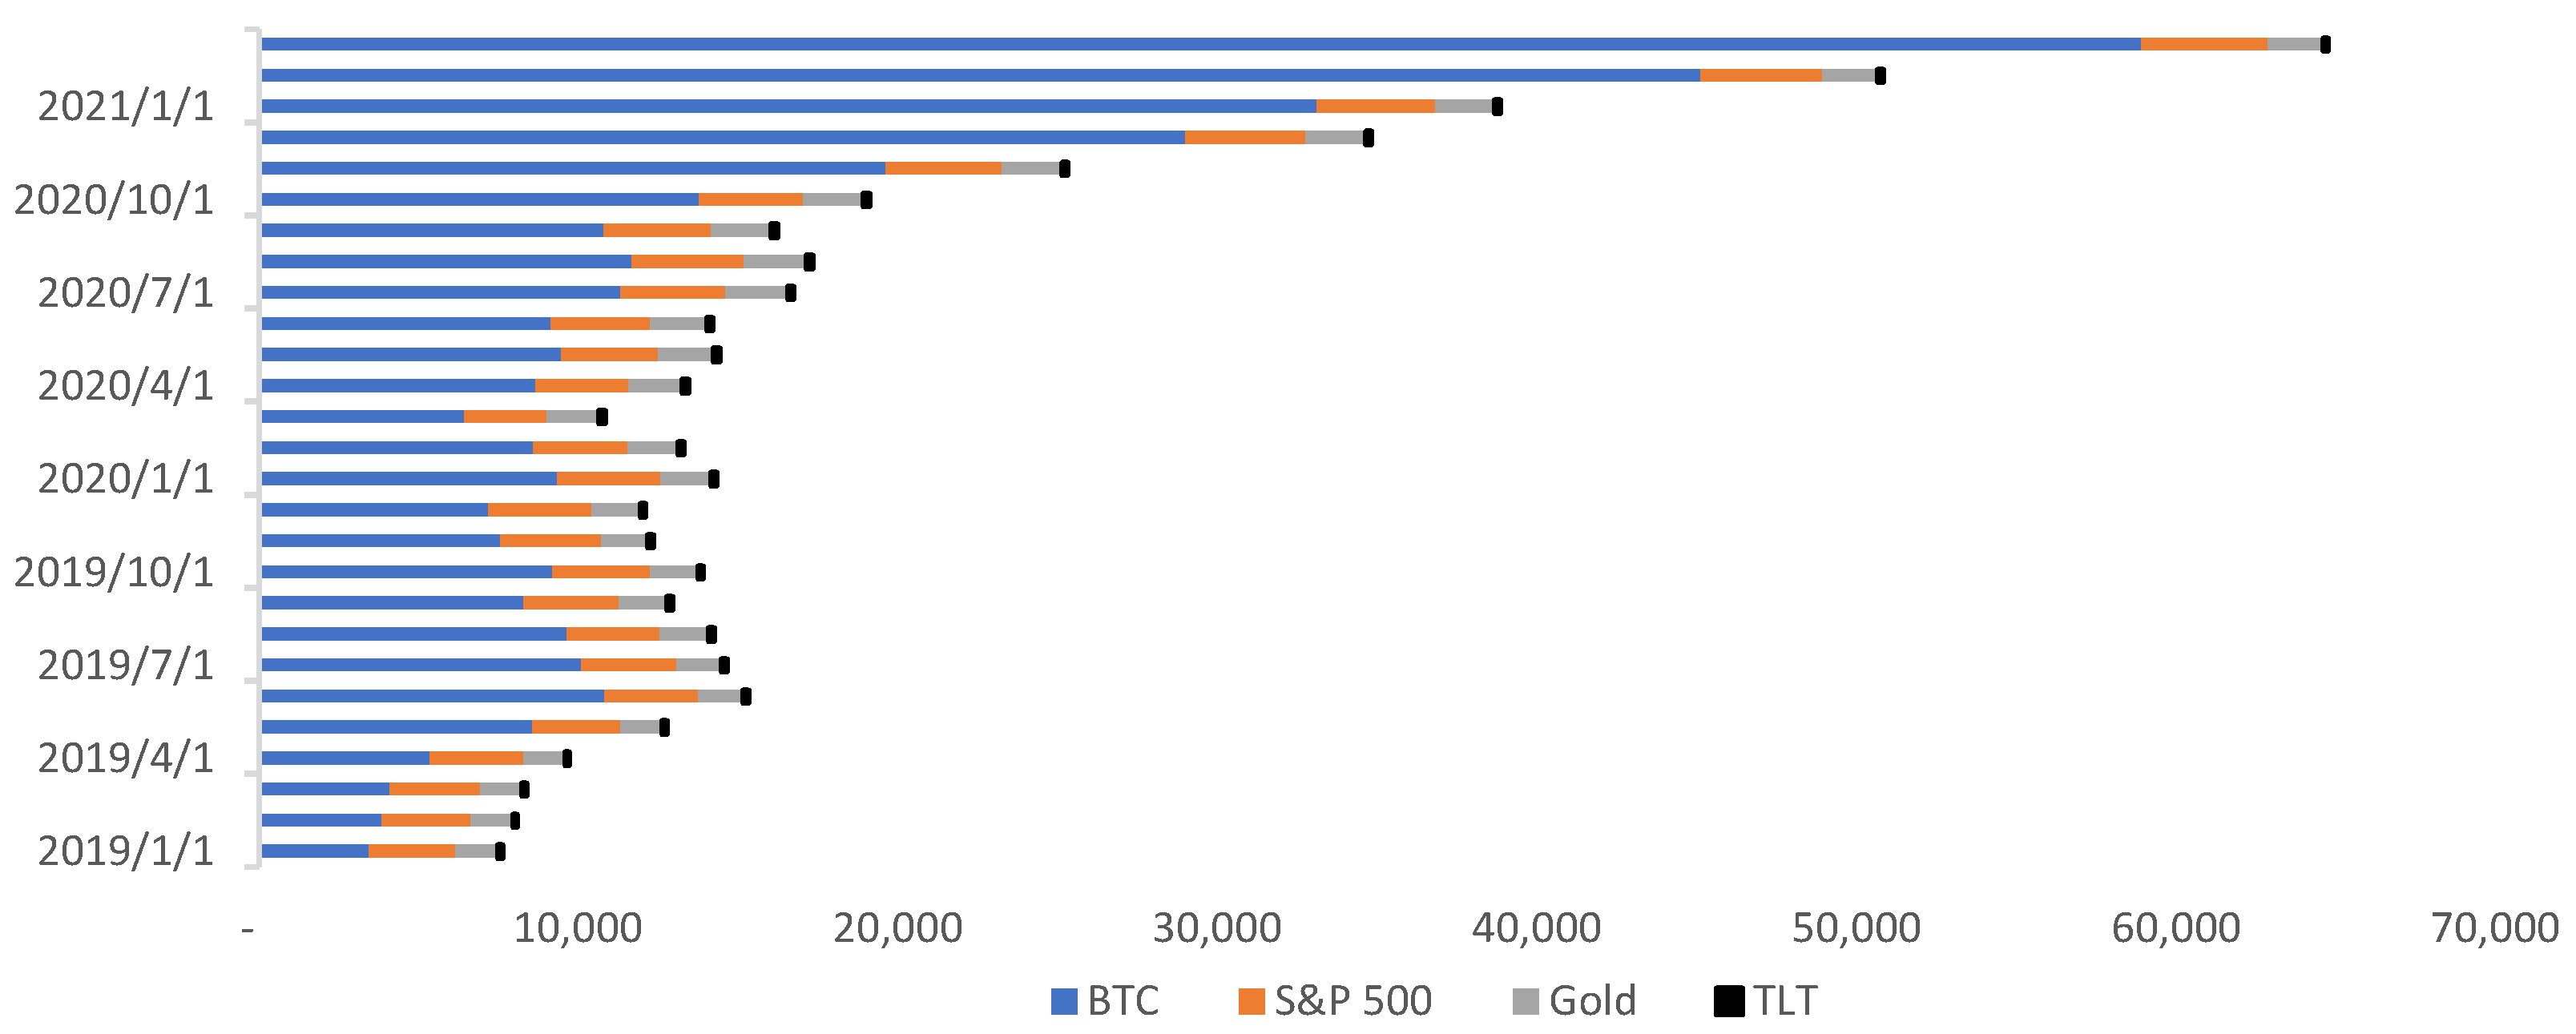
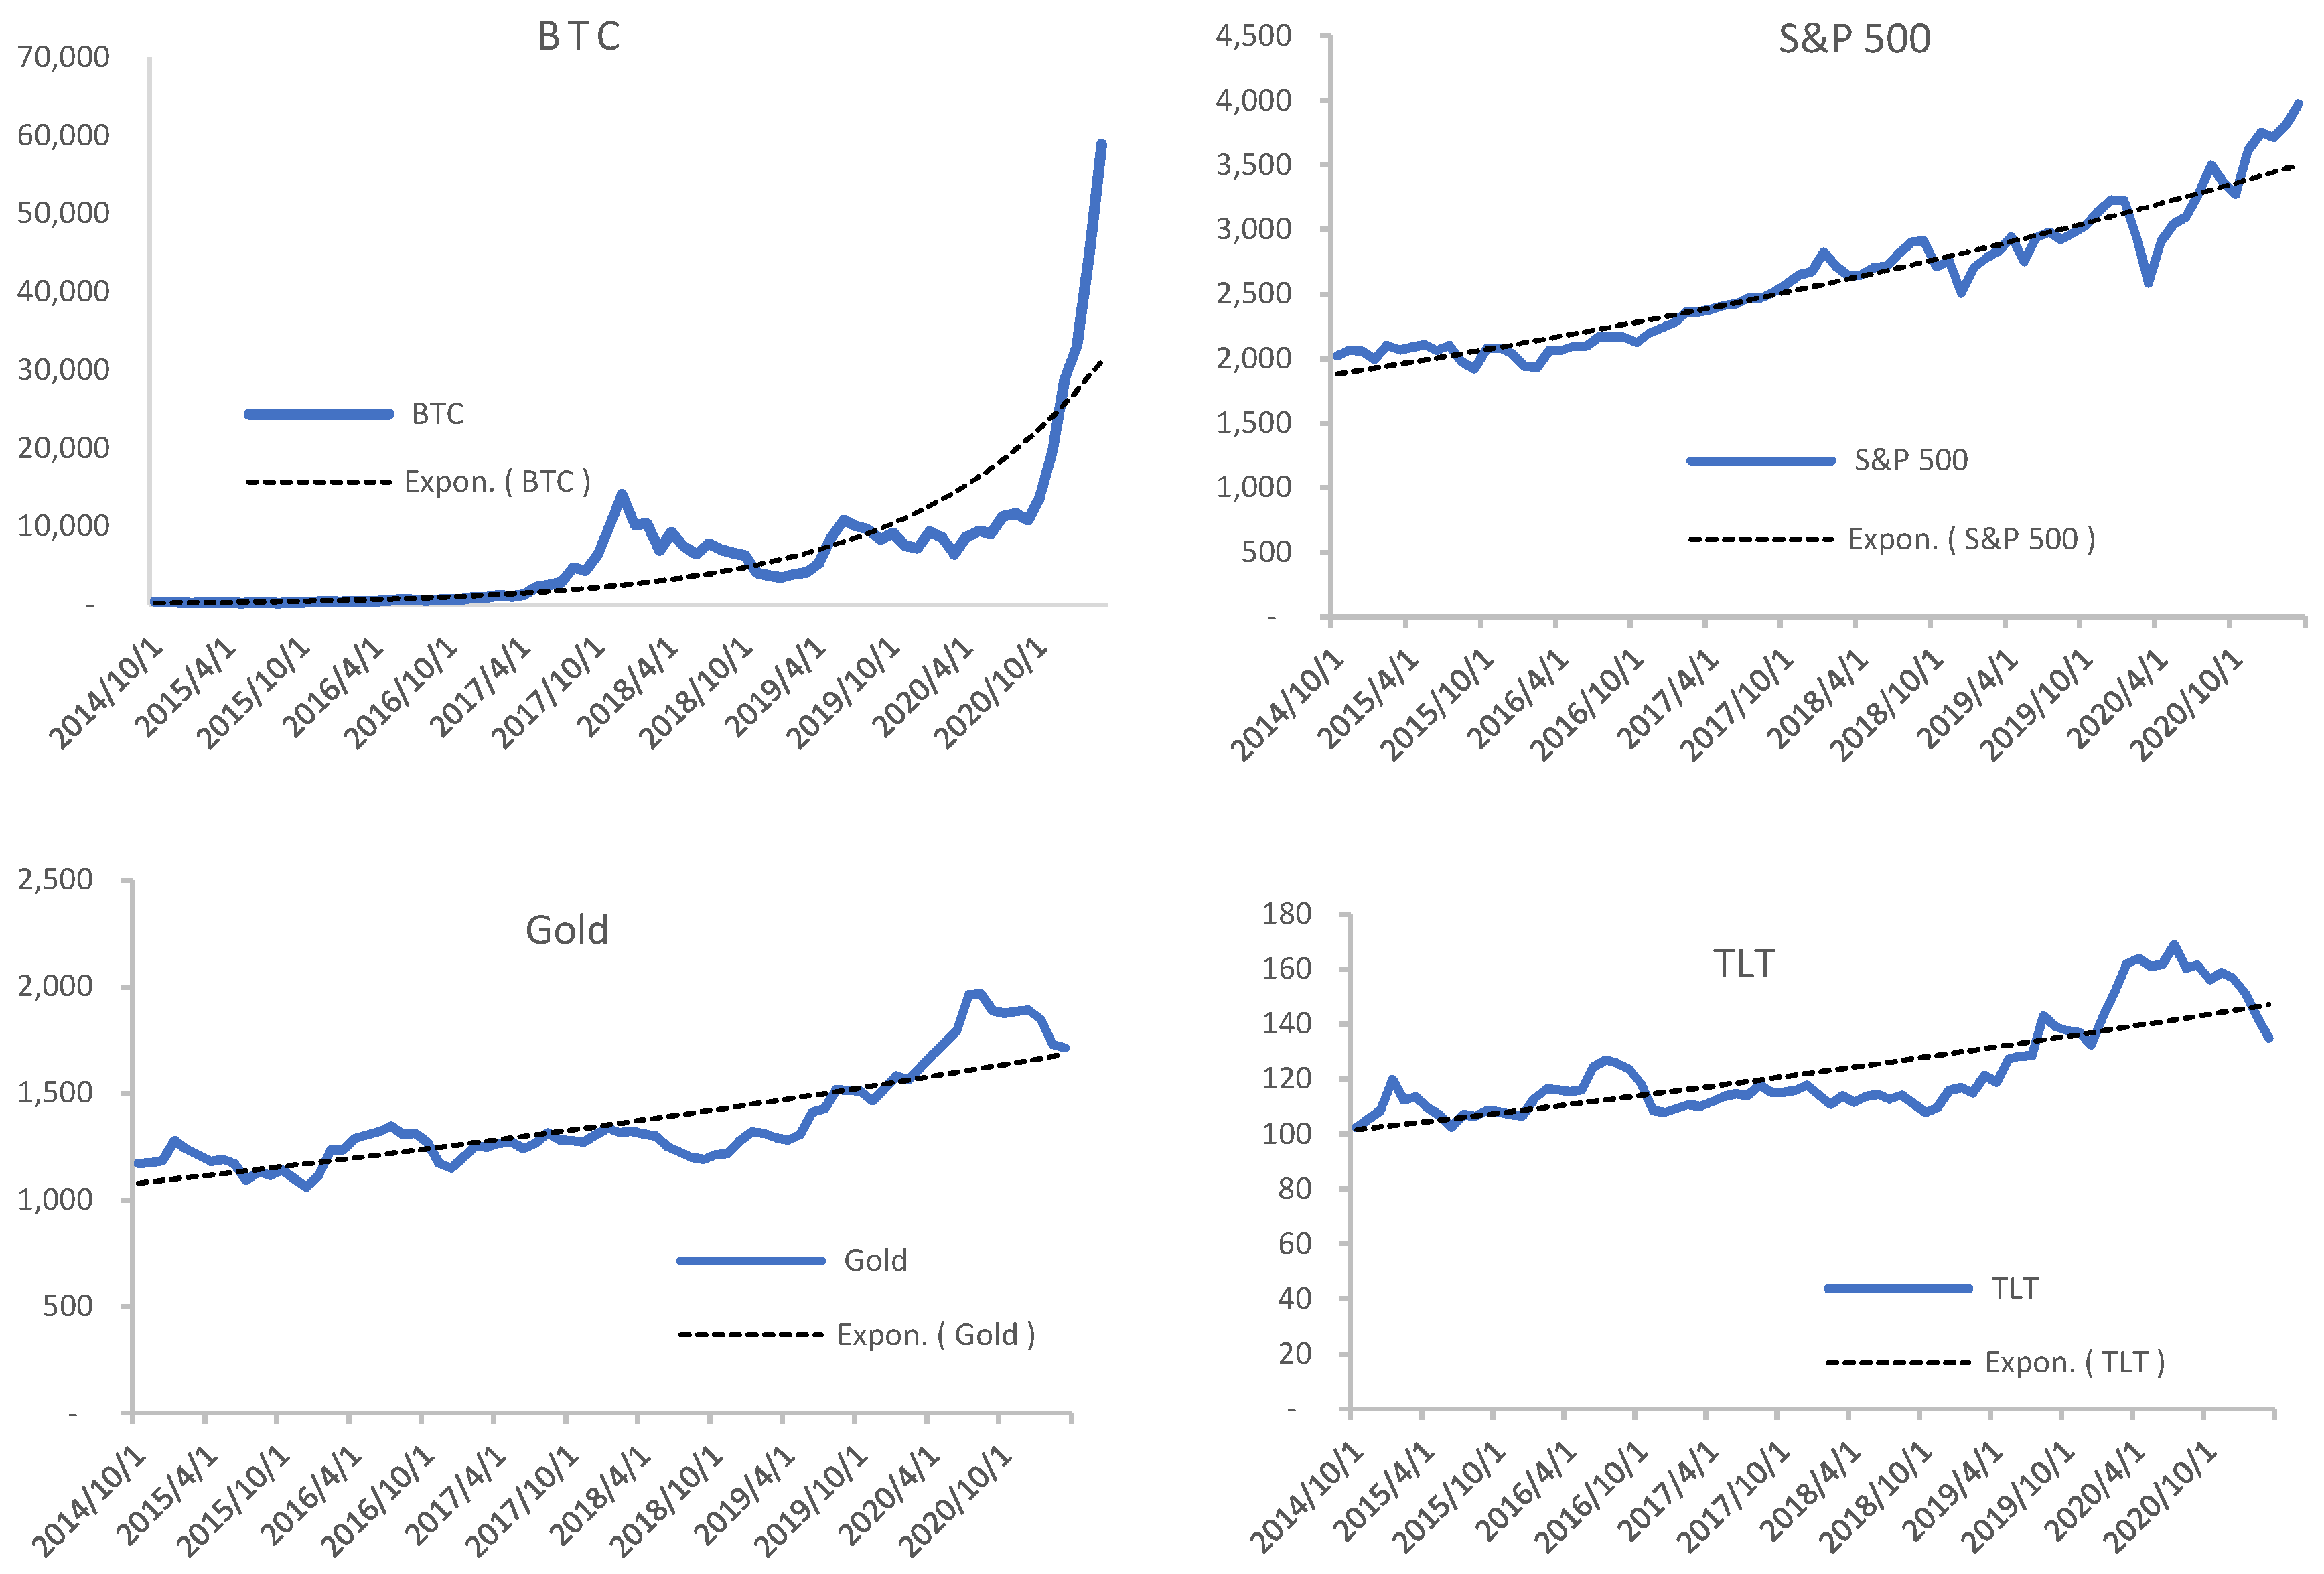
Figure 4 demonstrates the results of the actual price and predicted price (by the proposed model) of four financial assets. We can see in
Figure 4 that the predicted price has a curve going up in Bitcoin as compared to the other three financial assets. Moreover, according to
Figure 4, Bitcoin compared to the other three financial assets increased dramatically at the end after September 2021 during the COVID-19 pandemic.
Institutional demand has become more active in the past year. While there is no single way to split Bitcoin demand.
Table 2 demonstrates recent Institutional announcements of Bitcoin adoption.
As explained in
Figure 4, we show the results of the actual price and predicted price (by the proposed model) of four financial assets. In
Table 3, we show the actual and forecasted prices for all four financial assets. The results indicate that the proposed model has the best forecasting accuracy. Moreover, we show the evaluation indicators before and during the COVID-19 outbreak in
Table 4. The MAPE by 433.22% before COVID-19 is much higher than during COVID-19 (about 78.39%). The result shows that the smaller the MAPE, the better the forecast.
Also, we carry out various interpretations and properties of this data for analysis purposes. Some are custom-made and some tools are inbuilt: 60-day rolling volatility at various points of time, correlation in price movement of various assets were used from them in chart format.
The nature of data, whether they are time-series or cross-sectional or both, is discrete, continuous or categorical decides which techniques may be used for the analysis. In this case, the data are continuous time-series data, hence the following methods have been used for investigation and forming conclusions.
Pearson’s correlation is an empirical technique, to understand the interrelation between two variables, and is a time-tested one. It helps to explain not only the direction of correlation but also the strength of correlation, subsequently used. In this case, while evaluating cryptocurrencies as an asset class helps compare Bitcoin with other major asset classes like gold, equity (S&P 500 index), debt, etc., its price movements and correlation with that of those other assets indicate its utility as a hedge in an investment portfolio or as a diversifier.
Table 5, shows the Pearson correlation between Bitcoin and the other three financial assets.
According to the result in
Table 5, there is a positive correlation between Bitcoin, and S&P 500 (0.818,
p-value < 0.001). Also, the correlation between Bitcoin and Gold is positive and significant (0.297,
p-value < 0.001). Similarly, the correlation between Bitcoin and TLT is positive and significant (0.507,
p-value < 0.001). Correspondingly, Gold and S&P 500 has a positive correlation (0.324,
p-value < 0.001). The result of
Table 5, strongly supports hypothesis three which indicates that a positive correlation between Bitcoin, S&P 500, Gold and TLT exists.
4.1. Reyscale Bitcoin Trust—The Largest Known Investor
Bitcoin’s market capitalisation remains small in comparison to gold and the Fed’s balance sheet. According to
Table 6, the market capitalisation of Bitcoin is approximately less than 10% that of gold and the Fed’s balance sheet, and much less than the value of the US equity market (
Market Cap 2021).
4.2. Response of Financial Institutions
Banks have been observing the development of cryptocurrencies as in essence cryptocurrencies challenge banks’ existence as financial intermediaries. Hence, they are more interested to look through ways to coexist with it if cryptocurrency adoption increases. Jamie Dimon CEO of JP Morgan famously said cryptocurrency is a fraud; that caused a 10% drop in Bitcoin price and he threatened to sack any employee trading into it (
Waters 2017). Miles Johnson, in a
Financial Times article titled “Wall Street finds it harder to dismiss Bitcoin”, explains the phenomenon known as “FOMO”, or fear of missing out, in which people take unnecessary risks to avoid being left behind. “Bitcoin appears to have graduated to even being discussed as a fully-fledged asset in some of the more rarefied offices of Wall Street and the City of London” (
Johnson 2017). Once again, this investment is viewed as an asset in this context and is thus added to their portfolio in the same way that stocks and other money market instruments are.
The three most important questions for banks, according to Huw van Steenis, global head of strategy at Schroders and a member of the World Economic Forum’s fintech group are: Will new entrants weaken the banks? Will banks become less important as lending evolves? Could banks lose control of payments if private digital currencies gain traction? (
Schroders 2017). Big banks overall, so far, just like JP Morgan have not viewed cryptocurrencies favourably. They have actively not promoted it to their investors or employees as it is clear that cryptocurrencies challenge most of their roles as financial intermediaries in the current economic setup. However, investors willing to take a risk have gone ahead with their investments in it has compelled banks to look at cryptocurrencies so as not to lose business and see if there are ways for both to coexist.
4.3. Central Bank Digital Currencies (CBDC)
According to the ECB’s “The Digital Euro” think piece, a CBDC is “not a crypto-asset”. It claims that the digital euro would be a risk-free form of central bank money (i.e., a digital representation of cash), which means that it would be issued by the central bank and would always be its liability. By contrast, commercial bank money and electronic money are liabilities of supervised private entities. Private money issuance must adhere to regulations, and the issuing private institution is subject to public authorities’ supervision or oversight. While such entities could theoretically default and become unable to satisfy their customers’ claims to, say, convert their holdings into central bank money. Their customers are protected by a legally binding regulatory framework that requires the supervised private issuer to take measures to protect the value of their liabilities. Aside from its supervisory role, the central bank acts as a lender of last resort to prevent commercial banks from defaulting in exceptional circumstances (
European Central Bank 2021).
5. Conclusions
Bitcoin is often identified as new gold and it is visualised similar to golden capital “B” as digital (
Shiller 2020). It is often called a new digital gold due to its similarity with gold (
Baur et al. 2018a,
2018b;
Gkillas and Longin 2019). However, as seen from the observations from subjective as well as objective data analysis, cryptocurrencies (Bitcoin) do not appear to perform their function as currency, as a medium of exchange or store of value. They have been too volatile that may lead to deflation in the economy. Also, under the ESG framework, it is quite costly due to high power consumption, being too technology-intensive for masses to adopt, and non-transparency in the exchange mechanism with no redress system. Bitcoin’s price movement compared with that of gold which has acted as a hedge over centuries shows no relationship. Nevertheless, our result indicates that Bitcoin has very high volatility as compared to S&P 500, gold and TLT. Bitcoin’s price volatility even though has decreased over the years, hence Bitcoin is acting more as a speculative asset rather than a steady store of value. This can be drawn from the comparison with the debt market i.e., TLT ETF that invests in long-dated (30 years) US Treasury bonds with which Bitcoin shows no relationship.
Obviously, between Bitcoin, S&P 500, gold and TLT, there are some similarities such as distribution mining and ownership. However, there also exist some differences between Bitcoin and other financial assets. For example, there are some differences regarding the age and maturity of Bitcoin versus gold. In reality, gold is a physical asset and Bitcoin is a digital asset. Despite similarities between Bitcoin and other finical assets, previous studies show that there is no correlation between Bitcoin and other financial assets such as gold. The recent study by
Baur and Hoang (
2021) estimates the correlation of Bitcoin and gold as financial assets across different return frequencies, quantiles and across time. They found that there is a near-zero correlation, inconsistent with the claimed similarity. Following the above study, we tested the correlation between Bitcoin and S&P 500, gold and TLT and found a similar result in line with previous studies. Our findings indicate that Bitcoin pricing is dynamic and it has not has seen a shift in correlations to financial assets.
Also, in this study, we considered the Dickey-Fuller test to test the null hypothesis that a unit root is present in an autoregressive time series model. According to this model, four statistical evaluation indicators MAE, MAPE, RMSE and SDE are utilised to compare the performance of related models (
Liu and Long 2020).
Our findings show Bitcoin in comparison with S&P 500, gold and TLT, gold experienced an increase in average returns accompanied by high volatility. This finding is in line with the first hypothesis and confirms that the volatility of Bitcoin is higher than that of other financial assets. Also, the result of the Dickey-Fuller test supports the second hypothesis of this study. More important is our correlation test, and unlike the previous study, our result indicates of existing correlation between Bitcoin and the other three financial assets. This finding strongly supports the third hypothesis of the current study.


