1. Introduction
Although some might see technology as a disruption to the norm, it provides opportunities for growth and development. It also provides opportunities for deception, theft, and fraud. On the other hand, automation can make it easier to identify and protect from threats. Therefore, information technology (IT) risk management regulations are vital for assurance and reliability for today’s work environment, none the least, insurance undertakings and markets.
Operational resilience is important for consumers, firms, and financial markets. Operational disruptions can cause extensive harm to consumers, cause instability in the financial system, threaten the sustainability of firms, and pose a risk to market integrity. It is the next phase in the evolution of financial services’ regulatory policies (
Council of the European Union 2020).
Expectations are increasing, hence regulators are increasing pressures as part of this evolution. More specifically, with this increasingly complex networking web of a digitalised society, disruption is inevitable, and at some point, it will affect the whole of the operation, be it financial, people, regulatory, structures, and systems. Insurance undertakings are called upon to “join the dots” across a range of IT risk management and governance activities (
Biggs and Richardson 2014).
Insurance undertakings are expected to have the ability and resources to ensure operational resilience, meaning they should be capable of preventing, adapting, responding to, recovering, and learning from operational disruptions. They must prepare mitigations for the expected impacts of future incidents and build a framework that incorporates appetite and tolerances for internal and external triggers to ensure an efficient and sustainable business that can respond promptly to risks and pursue opportunities (
Thomadakis 2007).
The insurance market is all about trust and reliability of information and processes. Therefore, protecting both the technical risks and the storage and process tools IT provides should be the order of the day for everyone within the insurance market. The rapid pace with which the IT environment changes and develops exposes the insurance market and its environment to fast-paced emergent risks. Proactive risk controls must be continuously evaluated to ensure they are still valid and effective in identifying and managing the risks within the appetite and tolerance of the insurance undertaking.
Increased digitalisation and the subsequent increase in the number and sophistication of cyber threats and ICT incidents highlight the importance and urgency to address the incidence and impact(s) of such risks proactively since this can result in a source of systemic risk. Prudential supervisors should make sure that the assessment and monitoring of ICT is a major mandate to preserve and build a harmonised approach with international standards to effectively address digital operational resilience issues and to increase trust and motivate digital innovation.
Therefore, if there is a need for regulation, this must be enacted, and be seen as being enacted, in the public interest. However, it has to account for the different and often competing aims and objectives. The objective to ensure digital resilience is attained by the European Union (EU) Commission through a dedicated regulation, namely the Digital and Operational Resilience Act (DORA). This is a proposal through a diverse set of rules, including governance requirements, information communication technology (ICT) risk management and incident reporting requirements, digital resilience testing, and detailed regulation third-party provider (TPP) risk and oversight
The European Commission (EC) launched a public consultation on DORA on 19 December, 2019, by putting forward 62 questions on topics relating to (1) information and communication technology (ICT) risk management frameworks, (2) ICT and security incident reporting requirements, (3) resilience testing framework, (4) oversight of third-party providers, (5) information sharing, and risk transfer. Specifically, they are proposing legislative changes (1) in the requirements on security risk management and ICT, (2) to streamline the existing incident reporting, (3) to set a framework for cyber resilience testing, and (4) to establish oversight over third-party providers of ICT (
European Commission 2020). The proposed DORA regulation will accelerate the digital transformation of insurance firms within the EU and make them more efficient and effective. However, if there are unclear and potentially overlapping provisions in this proposal, there is the risk of dramatically hindering the attainment of this objective. Moreover, since the financial sector is a major user of ICT, accounting for approximately one-fifth of the worlds’ expenditure on ICT, global operational resilience depends largely on ICT. Additionally, with the increased use of distributed ledger technology (DLT) and artificial intelligence (AI), this dependence is expected to mushroom further, and the need for stronger operational resilience and ensuring adequate and timely supervision is obligatory (
European Commission 2020).
However, when enacting new regulations, there is a risk of overregulating or regulating just for the sake of regulation without really taking stock to determine whether the regulation adds value or is needed. Therefore, it is important to determine the characteristics of good and effective regulation and ensure the proposed regulation fits these characteristics so as not to run the risk of overspilling the market with useless regulations, which would burden stakeholders (which include regulators) with unnecessary requirements, creating regulatory risks and keeping them away from focussing on what is important to ensure sustainability (i.e., a balance between the economy, culture, and the environment) and appropriate risk management.
The problem of overspilling of regulation, believing that ICT can solve problems and that an enacted regulation is fit for purpose has been going on persistently for several decades. That is why the world has gone through periods of deregulations and reregulations. This attests to the fact that the systems used to ensure the effectiveness of regulation before it is enacted are not working. Regulators will always rethink regulations “till angels govern” (
Barth et al. 2005). However, there is a need for a regulatory effectiveness model to determine the effectiveness before being enacted.
3. Methodology
To do this, we first determined from the literature the characteristics that an effective regulation should have. We followed the theoretical framework suggested by
Yin (
2002,
2014),
Yazan (
2015), and
Stake (
2000); analysed the literature using the thematic analysis approach, as suggested by
Braun and Clarke (
2006); and determined 8 propositions for these characteristics, listed in
Table 1, that an effective regulation should have. Then, we tested using the proposed DORA as our case to determine through a survey whether these propositions for characteristics are perceived by the insurance market as characteristics that ensure effective regulation.
3.1. Determining Propositions
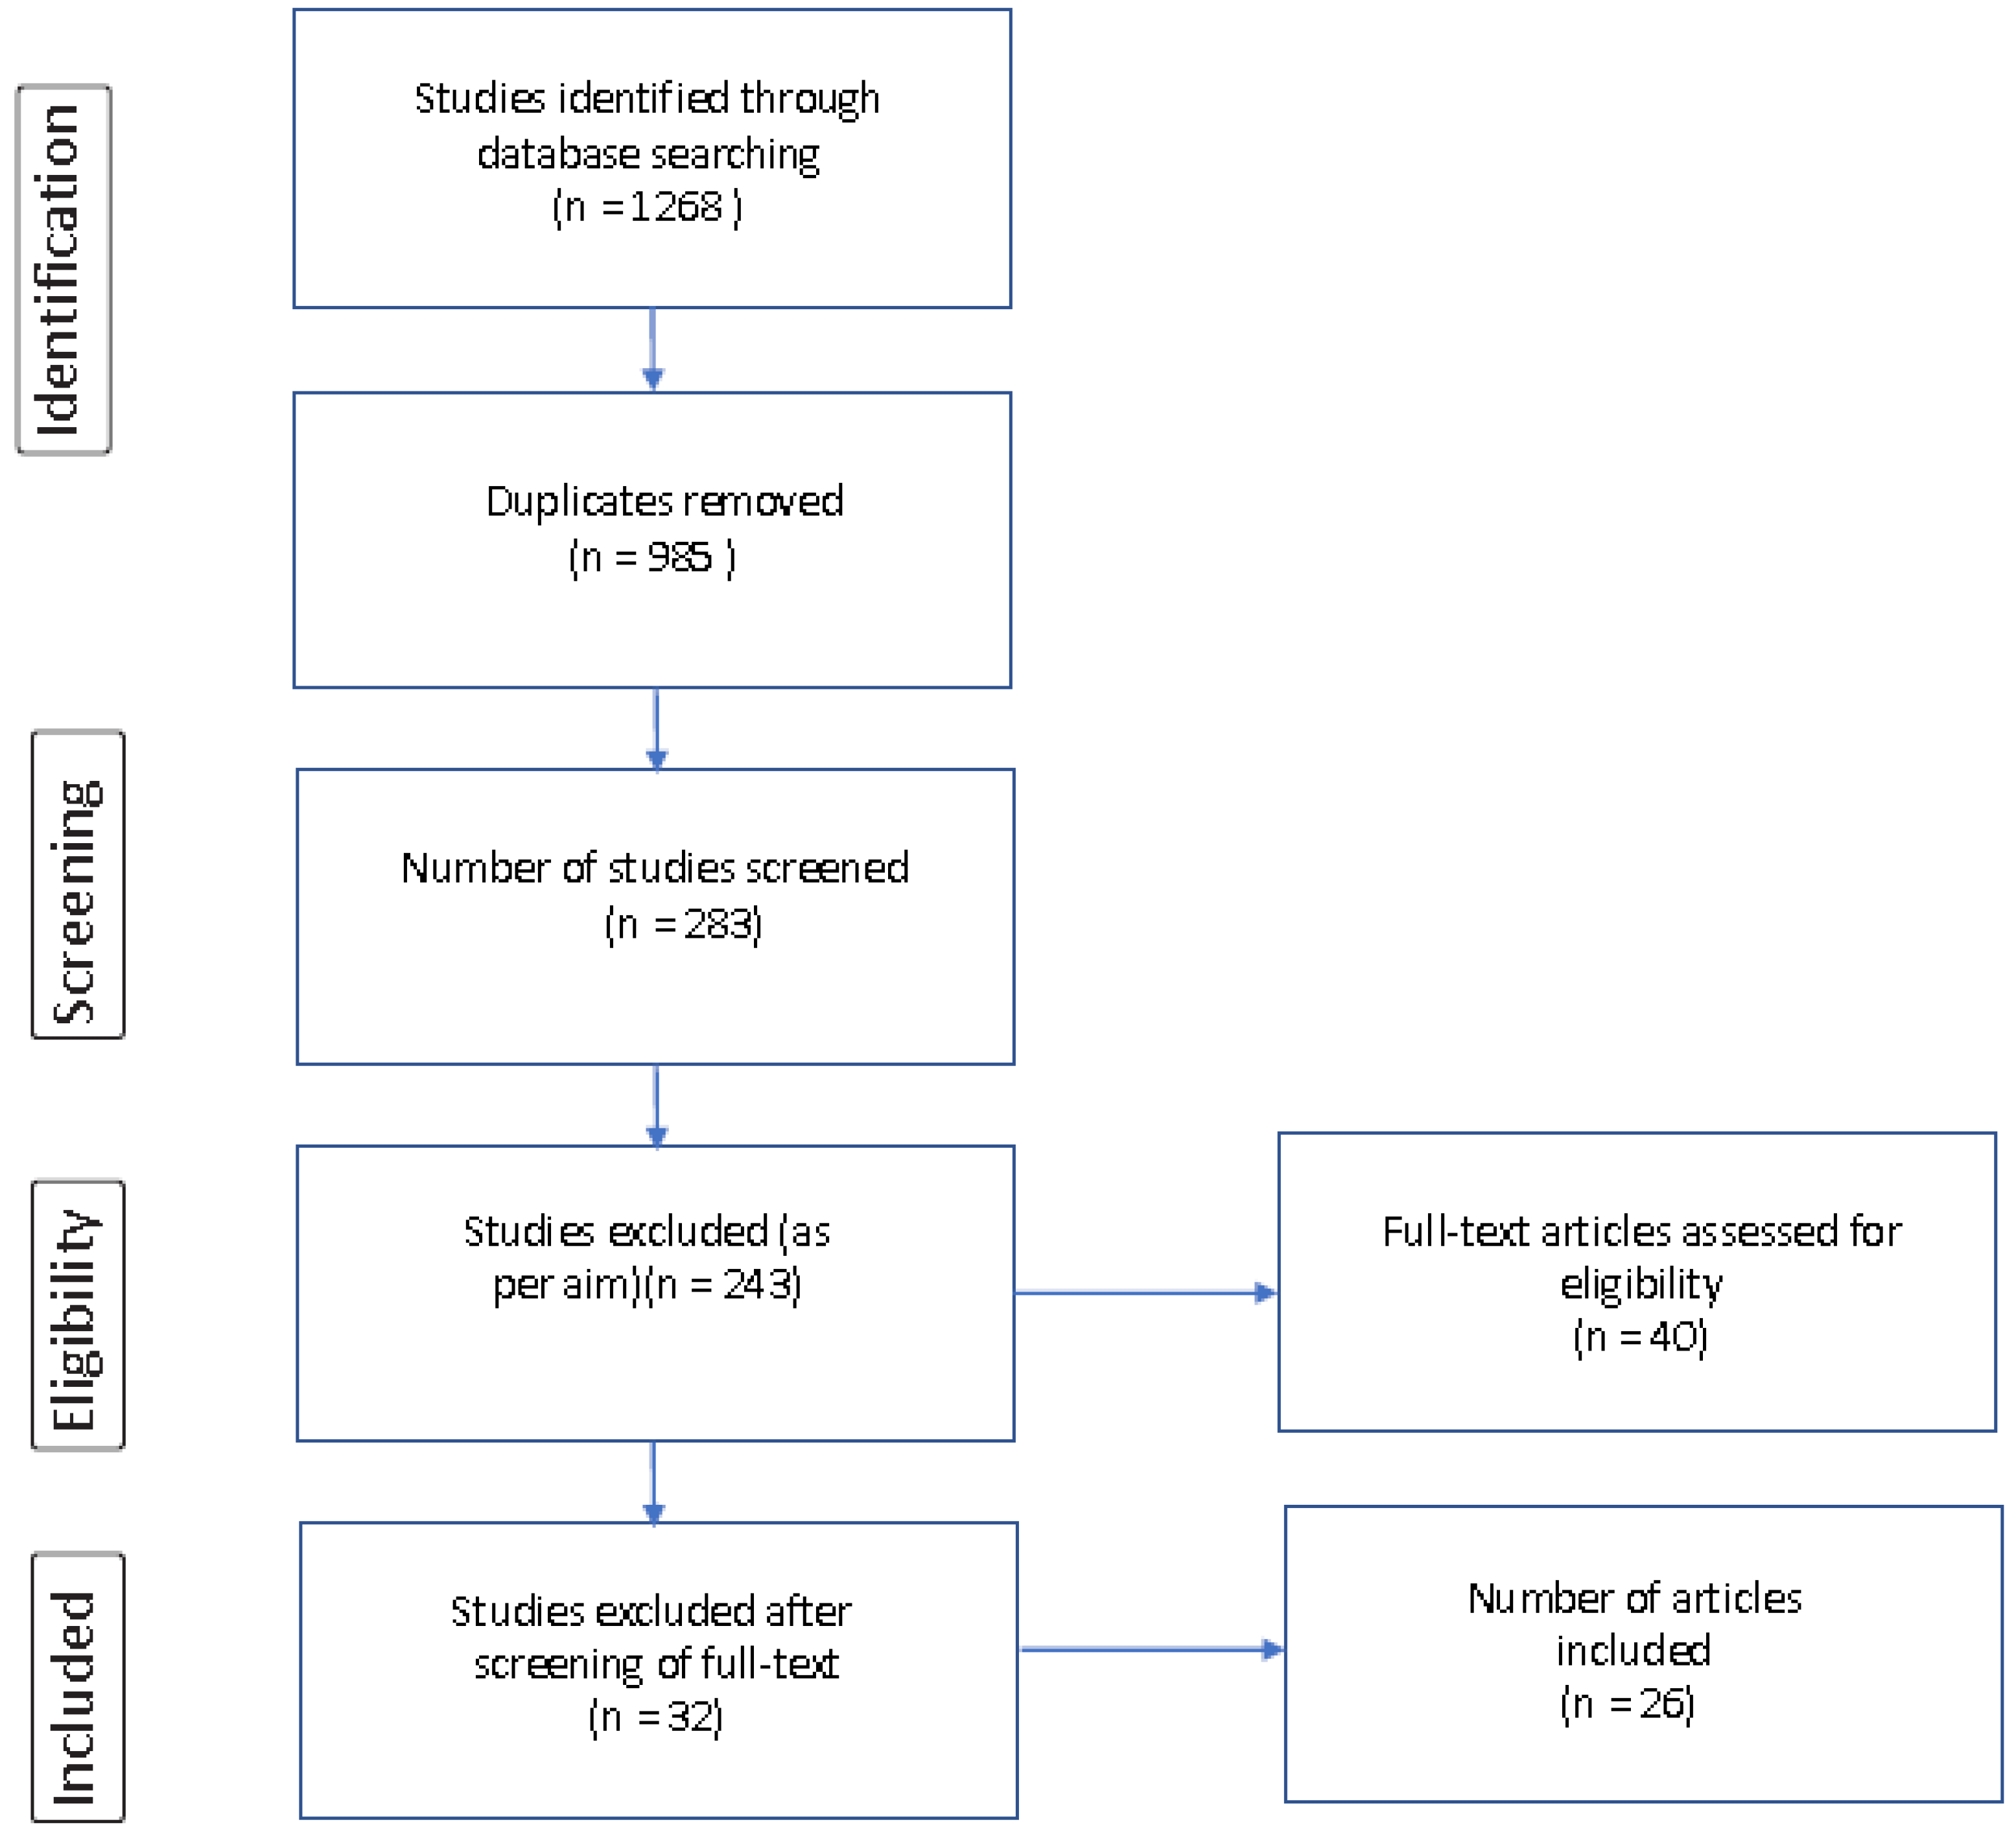
To determine these propositions, which is what constitutes effective regulation, we first carried out a wide literature search, which generated 1268 valid records. We then reviewed the results for duplicates and filtered this sample by applying inclusion/exclusion criteria and the Preferred Reporting Items for Systematic Reviews and Meta-Analysis (PRISMA) search strategy. We created tables to classify the chosen articles (n = 26) and organise our findings and results. The following databases were utilised for our search: Scopus, EBSCO, JSTOR, CiteFactor, RePEc, ResearchGate, Academia, Google Scholar, Loop, EU regulations, and the University of Malta online library, Hydi and Web of Science. The search was carried out during January 2020 and covered literature ranging from 1990 to 2020. The above-mentioned databases were selected based on their strength and prominence in our research arena. The keywords used were: “Good” AND “Efficient” AND “Regulation” AND “Effective”. Each of the above keywords (or a combination of keywords) was applied to the different databases specified above. The resulting search lists were compared and contrasted manually. By doing this, we could eliminate from this search studies that were not aligned with our review aims (by referring to whether the article was relevant to our aim). Moreover, any repeated search items were rejected.
The PRISMA flow diagram below (
Figure 1) depicts the representation of our obtained search results and the manner in which findings were filtered to determine the pertinent articles (
Moher et al. 2009). The final set of articles (
n = 26) selected for full review met the specified review criteria (i.e., our aim) for determining our propositions.
It was determined that the proposed regulation should be reliable (Proposition 1) in terms of achieving proactive prudential resilience is essential. Regulations must maintain sensitivity to the needs of investors and should maintain objectivity and accountability with respect to insurance market participants and policymakers. Effective regulation should be the main driving force of a high-quality reliable service (
NSW Government 2019) (
Shleifer 2010) (
CFA Institute 2020). It should be flexible (Proposition 2) enough to enable it to integrate and fit in with the rapid changing world of digitalisation with the least effort and disruption (
Bennear and Coglianese 2012) (
Smart Grid Task Force 2015).
The timeliness (Proposition 3) of its integration should be appropriate since the changes in logical systems are fast and time friction to address operational risks leads to rapid innovative opportunities for deception, theft, and fraud. Therefore, it is important that the requirements can be processed in a timely manner and are appropriate for the processes and activities of the time (
Brown and Scott 2009). The cost (Proposition 4) of maintaining the regulation should be congruent with the needs and value added in terms of both prudence and effectiveness. Compliance can be challenging in terms of qualitative resources. One needs to consider keeping cost—in terms of compliance costs, fees and other enforced burdens on issuers, registrants and investors—to a minimum (
Regulation Taskforce 2006;
Scott 2018;
Kira et al. 2007;
CFA Institute 2020;
OECD n.d.;
Beales et al. 2017).
It should be able to integrate (Proposition 5) the requirement easily within the environment, culture, system, and market. To achieve results, a requirement should consider current policies, standards, institutions, and tools across the sector and understand the culture and recognise and consider the specific impact. The question asked here is whether the requirements can achieve the intended and expected objective/s (
OECD 2012;
Radia 2011;
Boothe 2013). Relevance (Proposition 6) and proportionality (Proposition 7) in terms of applicability to the undertakings and their operations needs to be ensured. The regulation should be able to allow for its applicability in relation to the different sizes and complexity of insurers. An effective regulatory system should recognise that statutory regulation is not always required, or even the most appropriate approach and relevant and accepted self-regulatory entities may be the most appropriate manner to address certain issues (
Fiennes 2016). However, regulation and enforcement must be consistent for similar transactions and activities. Regulations should not be enacted just for the sake of justifying the regulators’ importance (
Deighton-Smith et al. 2016;
Armstrong and Sappington 2006;
OECD n.d.). The regulation should ensure that any burden or restriction imposed is proportionate to the benefits expected (
Financial Conduct Authority 2020).
Transparency (Proposition 8) in the development stages of regulation is closely associated with accountability and inclusiveness. It should be ensured that all stakeholders are consulted about the regulation. There should be a clearly established framework of the flow of the exposure, criticism, and consultation during the development phase, that is, clear objectives and methods for achieving the regulation need to be debated, and all parties having a stake in it should be able to provide input (
Better Regulation Task Force 1998;
European Commission 2015;
OECD n.d.). The regulation must provide enough objective and appropriate information (
Financial Conduct Authority 2020;
Baldwin et al. 2011;
Boothe 2013).
The objective of regulators and any regulatory reform is to improve the sustainability of the economies in line with the cultural aspects and the environmental needs and enhance the ability to cope and adapt to a changing playing field. In order for this to work, regulation and structural reforms need to complement sound macroeconomic and fiscal policies. Therefore, continuous and expansive social, economic, and technological disruption requires that regulators consider the interrelated effects of regulatory regimes to guarantee that these regulatory structures and processes have the 8 characteristics mentioned above. Regulatory reform is dynamic and by far not a one-off effort. It is a long-term, multidisciplinary process (
OECD n.d.).
3.2. Survey
We then designed a survey as described in
Section 3.3 below and administered it between February 2020 and June 2020 by (1) using social networks, such as LinkedIn©, Twitter©, and Facebook©; (2) verbal face-to-face meetings and over the phone; and (3) online communication using Zoom©, Microsoft Teams©, and GoTo© applications. The sample consisted of participants who worked within the insurance industry and professionals in the field who were filtered based on their response regarding the level of experiences they held, qualifications attained, area of expertise, and knowledge in/of digital operations and DORA. Filtering was performed by asking prospective participants in the survey to answer on a Likert scale from 1 to 5, with 5 being the highest level and 1 being the lowest, the level of expertise and knowledge on ICT use in insurance operations and DORA. Only in the case where the answer was 3 and above were the participant answers considered valid data for our analysis. Although as a starting point we went specifically to our contacts (nonprobability purposive sampling method), we requested the participants to invite also their contacts to participate in this survey, creating a snowballing sampling effect (nonprobability snowballing sampling), therefore adding another layer of control to eliminate selection bias. Our expertise and networks in the area were used to start the participation and not to select persons. We highlighted the administration of the questionnaire as nonprobability purposive sampling because the survey was started on our social networks, and therefore, we assumed that the first participants would be limited to our friends on our networks, which run into thousands, but the participants answered anonymously using the Qualtrics XM
® application software. We could not have known who answered us and to whom the possible participants passed on this link (snowballing sampling).
As already noted, for the data collection process, we use a dedicated online application software Qualtrics XM
® (
Suen et al. 2014). This helped both in the structuring of our survey and enabled its efficiency and flexible administration. Although we administered approximately over 2000 contacts, we received a total of 1807 valid responses (216 responses were eliminated since their knowledge and expertise fell below 3). These responses provided the confidence that we had a representative sample, which allowed us to continue with our analysis (
Cochran 2007;
Naderifar et al. 2017).
3.3. Survey Design
We then developed 21 statements derived from these propositions, reflecting the variables for the characteristics of effective regulation (
n = 21), as noted in the above literature and
Table 1 (which also shows references to the appropriate literature). We used these statements to construct our survey in three sections. The first section was related to the participants’ demographic factors, where participants were asked to provide details on their age, gender, level of education and occupation status, grouped as shown in
Table 2.
The second section consisted of the 21 statements, which were derived/adapted from the literature referenced in
Table 1, to which the survey participants were asked to answer using a 5-point Likert scale with “1” being strongly disagree, “2” being disagree, “3” being neutral, “4” being agree, and “5” being strongly agree. Since the second section of this survey could have led to the identified variables in a form of a “self-fulfilling prophecy”, meaning that a statement might have been biased towards our propositions, we kept an open mind and included an open-ended comment box in the third section. Here, participants were able to include anything they felt had not emerged from their previous answers. This guaranteed the capture of factors that might not have been determined through the literature review (
Farrugia and Grima 2021).
3.4. Data Analysis
Only 31 participants made comments in the third section of the survey, and most were received from those who participated face to face, over the phone, or using the online communication applications systems as explained above. These data were transcribed onto Microsoft Word
®, analysed, and grouped into common themes determined through a thematic analysis approach, as explained by
Braun and Clarke (
2006). However, these only resulted in explaining the characteristics further and did not add anything more than what was already determined through literature.
Using the IBM SPSS® (version 26) application software, we applied descriptive statistics to analyse the participants’ demographics. Exploratory factor analysis (EFA) was then applied to the quantitative data to determine the characteristic variables for effective regulations. To measure the consistency of these characteristic variables, we used the Cronbach alpha.
3.5. Limitations of the Methods Used
Although we tried our utmost to eliminate as much as possible the limitations of this study, no studies and models are without limitations and assumptions. We are aware that the results relate to one case study DORA, the literature sampled, and the participants answering the survey. Therefore, it is important to carry out further studies using other regulatory examples and maybe carry out a confirmatory factor analysis of this model.
Moreover, EFA assumes that in the collection of observed variables, there are a set of underlying factor variables, which are smaller than the observed variables that can explain the interrelationships among those variables. Additionally, the thematic analysis approach is phrase based and sometimes phrases cannot capture the meaning correctly.
4. Results and Discussion
4.1. Participants’ Demographics
The majority of the respondents (642) were aged between 55 and 64 years. Precisely 88% of these were either consultants (427), nonexecutive directors (139), and top management (76). This was mainly since we targeted and filtered for experienced and knowledgeable (in the area of both technology and regulations) participants, as noted in
Section 3.2. The other age groups of participants included those in the age bracket: (1) 18 to 24 (322), of which (254) worked with ICT-related consultancy firms and the rest (68) in supervisory roles; (2) 25 to 34 (251), of which (184) worked with ICT-related consultancy firms and (67) in middle management operational roles; (3) 35 to 44 (356), of which (196) worked with ICT-related consultancy firms and the rest (133) in top management roles and (27) in supervisory roles; (4) 45–54 (171), of which all worked in top management roles; and 65+ (65), all working in nonexecutive roles. In total, 594 of the respondents were female, and 1212 were male.
Most respondents (1587) had a first degree or an EQF level 7 standing or above. The largest group of participants was nonexecutives or consultants (1344). The rest were top management (328), middle management (129), and the least lower management (6), which again, reflects the fact that expertise was looked for through purposive and snowballing sampling.
4.2. Exploratory Factor Analysis
EFA was used to determine and group under the characteristics for an effective regulation (Research Question 1 (RQ1)). EFA “summarises and groups variables into a set of clusters so that relationships and patterns can be easily interpreted and understood. This helps one to understand better the data obtained from the self-administered questionnaires, by reducing it, into meaningful categories” (
Yong and Sean 2013).
EFA was determined as the best method to address our aim since in general it is used to determine “the factor structure of a measure and to examine its internal reliability. It is a multivariate statistical method that attempts to identify the smallest number of hypothetical constructs/factors/dimensions/latent variables/synthetic variables/internal attributes that can parsimoniously explain the covariation observed” (
Hair 1998).
For EFA, equamax rotation (orthogonal rotation) was used via principal components extraction and with Kaiser normalisation. The scope of rotation is to find an arrangement in which each variable loads high on a factor and low on others, for ease of interpretation. The Kaiser–Meyer–Olkin (KMO) statistic is a measure of sampling adequacy for the appropriateness of applying factor analysis and fell within the acceptable range (above 0.6), with a value of 0.873. It indicates the degree to which each variable in a set is predicted without error by the other variables. This further supported the continuance of factor analysis.
Using EFA, we determined that one of the statements explaining the characteristic variables was to be eliminated from the model, PC4—“DORA recognises that the regulation is not always needed or even the best approach and that deferral to, and support of, relevant and recognised self-regulatory entities may be the best way to address certain issues”. This was because this characteristic variable did not explain much of the variance and therefore was unstable and unreliable due to the fact that they were defined by other variables. This left us with the 20 statements explaining the characteristic variables included in the model.
Based on this analysis, EFA loaded best on 4 factors and 20 statements explaining the characteristic variables, which, in combination, explained 75.69% of the variance.
Table 2 shows the statements that are grouped under each of the four factors. Factor 1 represents the characteristics “
Flexibility and Integration”, and it explains 31.67% of the variance, which comprises seven items. Factor 2 represents the characteristics “
Proportionality and Cost”, and it explains 20.76% of the total variance, which comprises five items. Factor 3 represents the characteristics “
Reliability and Transparency”, and it explains 17.40% of the total variance, which comprises four items. Factor 4 represents the characteristics “
Relevance and Timeliness”, and it explains 5.87% of the total variance, which comprises four items (
Hair 1998).
4.3. Cronbach Alpha
As already noted above, we used the Cronbach alpha to assess the reliability and the internal consistency of each of the factors determined through EFA. It is utilised to determine how much the items on a scale are measuring the same underlying dimension. The Cronbach alpha coefficients of this scale were between 0.55 and 0.92, as shown in
Table 3.
The results of the Cronbach alpha are higher than 0.5 and therefore are acceptable.
Hulin et al. (
2001) “claim that as a rule of thumb a Cronbach alpha value of 0.6–0.7 indicates an acceptable level of reliability, with 0.8 and above producing a very good level”. However,
Hinton et al. (
2004) note that a Cronbach alpha value between 0.5 and 0.7 shows moderate reliability. Therefore, it can be concluded that this scale of the perceived effective regulation model (PERM) is reliable (
Taber 2016).
Therefore, we are now able to compute an inventory of characteristics that an effective regulation should have using EFA by using DORA as our case study. From these four characteristics (Variables F1 to F4) and twenty statements, we computed the PERM (research question (RQ)).
4.4. Discussion
The outcomes delivered by the survey and processed as described above show a general appreciation of the proposed DORA for effective risk management in the insurance market.
Respondents view DORA as flexible and easily integrable within operational systems, and it can be adapted to the ongoing changes in these systems. The ICT risk management framework set forth by Article 5 of DORA allows financial entities to build their framework, while ICT systems, protocols, and tools to be used and maintained updated must be appropriate to the nature, variety, complexity, and magnitude of operations supporting the conduct of their activities (
European Commission 2020, Article 6, Paragraph 1) Nonetheless, some concerns arise from the impact of DORA on the current standards and policies, which need to embed the proposed regulation and its adaptability to the culture and environment of the EU insurance market.
Respondents also believe that DORA allows for proportionality and is cost efficient. Article 25 of DORA (
European Commission 2020) sets forth as a general principle that financial entities’ management of ICT third parties shall be implemented considering proportionality. Moreover, the requested use of qualitative and quantitative assessment criteria can be tailored to the risks and needs of the financial entity and, ultimately, based on its size and business profile. Additionally, rules on ICT risk management, oversight of critical ICT third-party service providers, reporting of major ICT-related incidents, and digital resilience testing embedded the principle of proportionality. Such a principle has likely affected the perception of the costs from respondents who consider DORA keeping the cost at a minimum. DORA aims at introducing a comprehensive set of rules on digital operational resilience at the UE level. The purpose should reduce uncoordinated national initiatives, duplicative requirements, inconsistencies and, ultimately, high administrative and compliance costs for entities operating cross-border. Moreover, DORA expressly requires financial entities to weigh the benefits and costs of alternative solutions, when they perform the identification and assessment of ICT concentration risks (
European Commission 2020, in Article 26).
Regarding reliability and transparency, DORA is perceived as an asset ensuring prudential risk resilience in the operation of insurance, maintaining sensitivity to the needs of stakeholders and objectivity to market participants. DORA comes from several stakeholder consultations, including the two joint technical advice by the ESAs. Confidential input, publicly available reports from supervisory authorities, international standard-setting bodies, and leading research institutes have complemented DORA, in addition to quantitative and qualitative input from identified stakeholders across the global financial sector. Thus, all stakeholders were consulted about the proposed regulation, including the insurance market participants.
Lastly, respondents agreed on the relevance and timeliness of DORA, which addresses the issue of digital resilience by providing a comprehensive and harmonised framework to protect the ICT system and requiring financial entities to use state-of-the-art ICT technology and processes ((
European Commission 2020, Article 8). Additionally, DORA requires financial entities to have in place internal governance and control frameworks that ensure effective and prudent management of all ICT risks (
European Commission 2020, Article 4). This forward-looking approach is in line with the one introduced under the Solvency II prudential regime. Thus, insurers should be well positioned to embed the new framework within the governance of the undertakings in a timely manner.
5. Conclusions
The use of DORA as our case study confirms our proposition that an effective regulation should have the eight characteristics integrated under four main characteristics, specifically (1) “Flexibility and Integration”, (2) “Proportionality and Cost”, (3) “Reliability and Transparency”, and (4) “Relevance and Timeliness”, to form the PERM model. These statements grouped under the themes in this model, determining the effectiveness of regulation, can be used by stakeholders such as policymakers, regulators, and reformists within countries as a measure to determine whether a proposed regulatory requirement is effective.
The PERM can be used similarly to a managerial scorecard to test other proposed regulations to ensure that they are effective prior to being enacted and also to determine when there is a need for a revamp in specified areas of current regulations and requirements.
In fact, using the PERM, one can reliably test any regulation prior to it being enacted by giving a score to the statements under all the four factors, from “1” to “5” and dividing each factor variable by the number of statements and then adding all the resultant “4” scores given to the “4” factor variables and dividing by “4” to come up with a resultant single score. The closer the result is to “5”, the more effective is the relative regulation and vice versa. In this way regulators, risk managers, policyholders, can use it equally to determine and confirm proactively whether a regulation will be fit for purpose, adds value, and will meet its objectives.


