1. Introduction
In recent years, small and medium-sized enterprises (SMEs) have made great contributions to increasing employment, promoting economic growth, advancing scientific and technological innovation, and maintaining social harmony and stability (
Hamzani and Achmad 2018). In China, SMEs account for more than 90% of all enterprises, pay more than 50% of tax revenue, create products and services worth more than 60% of the GDP, finish more than 70% of invention patents, and provide more than 80% of urban employment opportunities (
Liu 2018). Therefore, vigorously developing SMEs is essential for a steady and healthy economy and represents a powerful way for commercial banks to occupy more shares in the increasingly competitive market.
The national economy is heavily dependent on SMEs, but the support that SMEs receive from credit markets for further development is far from adequate (
Moro et al. 2015). Since January 2020, due to the COVID-19 pandemic, the urgency of financing for SMEs has increased and the demand for medium- and long-term loans has also risen significantly. On the one hand, if SMEs do not have sufficient liquidity, they will miss out on many development opportunities. On the other hand, if credit operations of SMEs are not properly managed, it will make it difficult for commercial banks to recover the funds, resulting in bad debts and financial losses. This issue is more pronounced under the pressure of the increasing global economic uncertainty.
Currently, the financing difficulties faced by SMEs are mainly manifested in two aspects—limited financing channels and high financing costs. The main reasons why banks are not motivated to provide loans to SMEs are as follows. First, the root cause is the information asymmetry between SMEs and credit markets, including financial system records and information opacity (
D’Aurizio et al. 2015;
Chen et al. 2015). Second, SMEs are small in scale and lack complete financial data, so they generally have low credibility (
Wong et al. 2016). These defects make it difficult for banks to build a credit risk control mechanism. Third, banks tend to require collateral with higher value, but SMEs often lack fixed assets that can be pledged. Finally, the current guarantee system is inadequate, and the guarantee institutions in the market that match SMEs are few.
Altman and Sabato (
2007) stated that accurate credit scoring models in the market for SME loans are potentially beneficial. Moreover,
Tsai and Wu (
2008) suggested that even a slight improvement in credit scoring accuracy might reduce credit risks. Some famous credit reporting agencies have tried to integrate multi-party information, extract new characteristic variables, employ advanced ML models, and develop new credit risk evaluation systems. For example, Zest Finance, an American big data credit company, considers both the decision variables in the traditional credit system and other factors that affect credit risk. Therefore, establishing a reasonable credit risk assessment model is an effective way to solve the financing difficulties of SMEs. More accurate credit risk evaluation can strengthen the competitive advantage of financial institutions in the market and reduce the financing difficulties for SMEs.
In this study, because soft voting can improve the prediction accuracy of statistical methods and ML, we propose a new credit evaluation framework for Chinese SMEs using the soft voting integrated learning strategy and emphasize the combination of financial and non-financial data. This soft voting fusion model is based on five base classifiers: logistic regression, SVM, RF, XGBoost, and LightGBM. After training each base classifier, the majority and weighting principles in soft voting are used to obtain the final predicted results and the Comprehensive Accuracy and AUC value are employed to verify the applicability and effectiveness of the model for the credit risk evaluation of SMEs.
The remainder of the paper is organized as follows.
Section 2 reviews the literature on the methods of forecasting SMEs credit risk.
Section 3 explains the theory of base classifiers and describes the proposed framework of the soft voting fusion model.
Section 4 introduces the case study with information about the data sources and variable definitions.
Section 5 discusses the results of the simulation.
Section 6 presents conclusions and related suggestions for the financing of SMEs.
2. Literature Review
Various methods for SMEs’ credit risk evaluation have been applied in previous research, and they can be classified into traditional statistical methods and artificial intelligence (AI) approaches.
Statistical methods include linear discriminate analysis and logistic regression.
Myers and Forgy (
1963) were the first to apply linear regression in credit risk evaluation. Discriminant analysis was proposed by
Fisher (
1936), and
Durand (
1941) used it to evaluate credit risk. After that, many researchers have applied this approach in their studies about credit risk (
Abdou and Pointon 2011;
Hand et al. 1998;
Mahmoudi and Duman 2015). Nevertheless, one drawback of linear discriminate analysis is that it is biased by extreme data points or satisfaction of the equal group covariance assumption (
Malhotra and Malhotra 2003). The logistic regression model for credit risk estimation was first introduced by
Wiginton (
1980).
Emekter et al. (
2015) built the credit risk evaluation model using binary logistic regression, and the results are consistent with the Cox Proportional Hazard test.
Lin (
2009) integrated logistic regression with neural networks to construct a two-stage credit risk assessment model, thus providing an alternative in handling credit risk modeling. However, the logistic regression model requires a large sample size to improve the predictive accuracy, and multicollinearity can easily occur when there are many variables.
With the rapid development of AI and computer technology, many new ML algorithms have been applied in the financial field. After comparing traditional methods and ML algorithms,
Hajek and Michalak (
2013) pointed out that although the results obtained by traditional methods are easy to explain, they should be based on various assumptions, whereas ML has a stronger predictive ability. AI approaches include SVM (
Kim and Ahn 2012), artificial neural network (ANN) (
Malhotra and Malhotra 2002), decision tree (
Tian et al. 2020), and Bayesian network (BN) (
Abid et al. 2017). To improve accuracy, scholars usually combine models for research. For instance,
Huang et al. (
2006) combined SVM and genetic programming to establish a credit risk assessment model, and the model incorporated the advantages of the IF–THEN rules and the discriminant function.
Shen et al. (
2019) introduced an ensemble model based on Adaptive Boosting (AdaBoost) and ANN to classify imbalanced credit data.
Rao et al. (
2020) presented a syncretic cost-sensitive random forest (RF) model to evaluate the credit risk of borrowers.
Ma et al. (
2018) coupled LightGBM and XGBoost algorithms to quantitatively assess credit rating.
Masmoudi et al. (
2019) proposed a new discrete BN model relying on a customized Expectation Maximization (EM) algorithm for assessing credit risk.
Voting has been proven to be an effective mechanism to improve prediction performance of a single classifier through combining the advantages of each algorithm (
Mahabub 2020;
Kieu et al. 2020). It can compensate for the errors made by the individual classifiers. Further, soft voting has better accuracy than hard voting due to its flexibility in weight determination (
Cruz 2021). Therefore, this study aims to establish a more accurate credit risk assessment system using soft voting.
Each algorithm has its own unique advantage. For base classifiers, we select logistic regression because it is the most commonly used statistical method in traditional credit risk evaluations. In addition, SVM is a classic ML algorithm. RF is a representative bagging ensemble approach. XGBoost and LightGBM are up-to-date boosting ensemble approaches.
3. Construction of Soft Voting Fusion Model
Voting is one of the most widely used ensemble learning algorithms, and there are two main types—hard and soft voting. Both hard and soft voting are based on the majority principle, but in soft voting, the weight of base classifiers can be defined according to different scientific problems. When there is a big difference among the base classifiers, the base classifiers with better performance can be given more weight to optimize the simulation results (
Moreno-Seco et al. 2006).
In this study, logistic regression, SVM, RF, XGBoost, and LightGBM are employed as base classifiers. Next, the classification problem is mapped to the [0, 1] probability problem to quantify the credit risk of SMEs.
3.1. Base Classifiers
3.1.1. Logistic Regression
Logistic regression is a traditional assessment method of credit risk. The linear expression of a disordered multiple logistic regression model that considers eight evaluation indicators (
Section 4) is as follows:
where
are nine coefficients, and
denote eight credit risk evaluation indicators.
3.1.2. SVM
SVM is a classical ML model. Compared with ANN, which is prone to fall into local optimal solutions, SVM has stronger generalization ability and global optimality.
In this study, Radial Basis Function (RBF) (
Min and Lee 2005) is selected for SVM, and the expression is as follows:
where
is the width parameter of the function.
The dual expression of the objective function is as follows:
where
is the Lagrange multiplier,
,
i = 1, 2, ⋯,
m.
is the penalty factor.
denotes the value for the class that
belongs.
When constructing SVM, the optimal
and
can be sought out. In addition, the decision function can be obtained by solving the optimal
with the Sequence Minimum Optimization (SMO) algorithm:
3.1.3. RF
RF is an algorithm based on ensemble learning. It integrates multiple decision trees to obtain final results using the bagging method. In RF,
K training samples are extracted from
N original samples using the Bootstrap Sampling approach. Then, the
K selected training samples undergo machine learning, and each of them generates a classification and regression tree (CART). The generation of CARTs follows the top-down principle, and the Gini index is used as the splitting criterion in this process. Assuming the dataset contains
m categories, the expression of the Gini index is as follows:
where
is the emergence probability of elements belonging to the
j category.
After
K rounds of training,
K CARTs are generated, that is,
⋯,
, and the corresponding predicted values are
, ⋯,
. The RF ensemble model can be built through a voting mechanism, and the result is as follows:
where
denotes a single decision tree.
I is the indicative function, which can be either 0 or 1.
Y is the target variable.
3.1.4. XGBoost
XGBoost (
Chen and Guestrin 2016) is an algorithm based on boosting decision trees, which is an extension and improvement algorithm of the Gradient Boosting Decision Tree (GBDT). XGBoost can carry out multi-thread parallel computing and generate new regression trees through iteration. Moreover, it can combine multiple weak learners with low performance into a strong learner with high accuracy. The model for XGBoost established by
K trees is as follows:
where
denotes a single decision tree.
is the input sample
i.
indicates the predicted values calculated through mapping.
The objective function of XGBoost is as follows:
where
l is a function that reflects the deviation between the predicted and real values.
is a regularized penalty function to prevent overfitting.
and
are the penalty coefficients.
T denotes the number of trees.
is the weight of the leaf node
j.
3.1.5. LightGBM
LightGBM is another efficient implementation of GBDT. It also builds a learning model by coupling
K trees. Because of its better predictive ability, high efficiency, and parallel computing, it is widely used to deal with regression or other complex problems. Compared with GBDT, LightGBM has the following improvements (
Ke et al. 2017).
First, to overcome the overfitting and slow training speed, LightGBM optimizes traditional algorithms by adopting a growth strategy with depth limitation for decision trees, called leaf-wise strategy. During each iteration, among all the leaf nodes, the leaf node with the maximum gain splits, thus reducing errors. Second, to solve the problem of large time consumption, LightGBM employs a histogram algorithm, which is used to transform continuous values into K values and performs statistics with width K. Third, because samples with a large gradient have a greater influence on the information gain, LightGBM uses the Gradient-based One-side Sampling (GOSS) to reserve a small part of samples with a large gradient and conduct random sampling for most of the samples with a small gradient in each iteration. Finally, due to the sparsity of high-dimensional data, LightGBM adopts an Exclusive Feature Building (EFB) algorithm for dimensionality reduction. This can reduce time complexity and improve training speed when constructing histogram features.
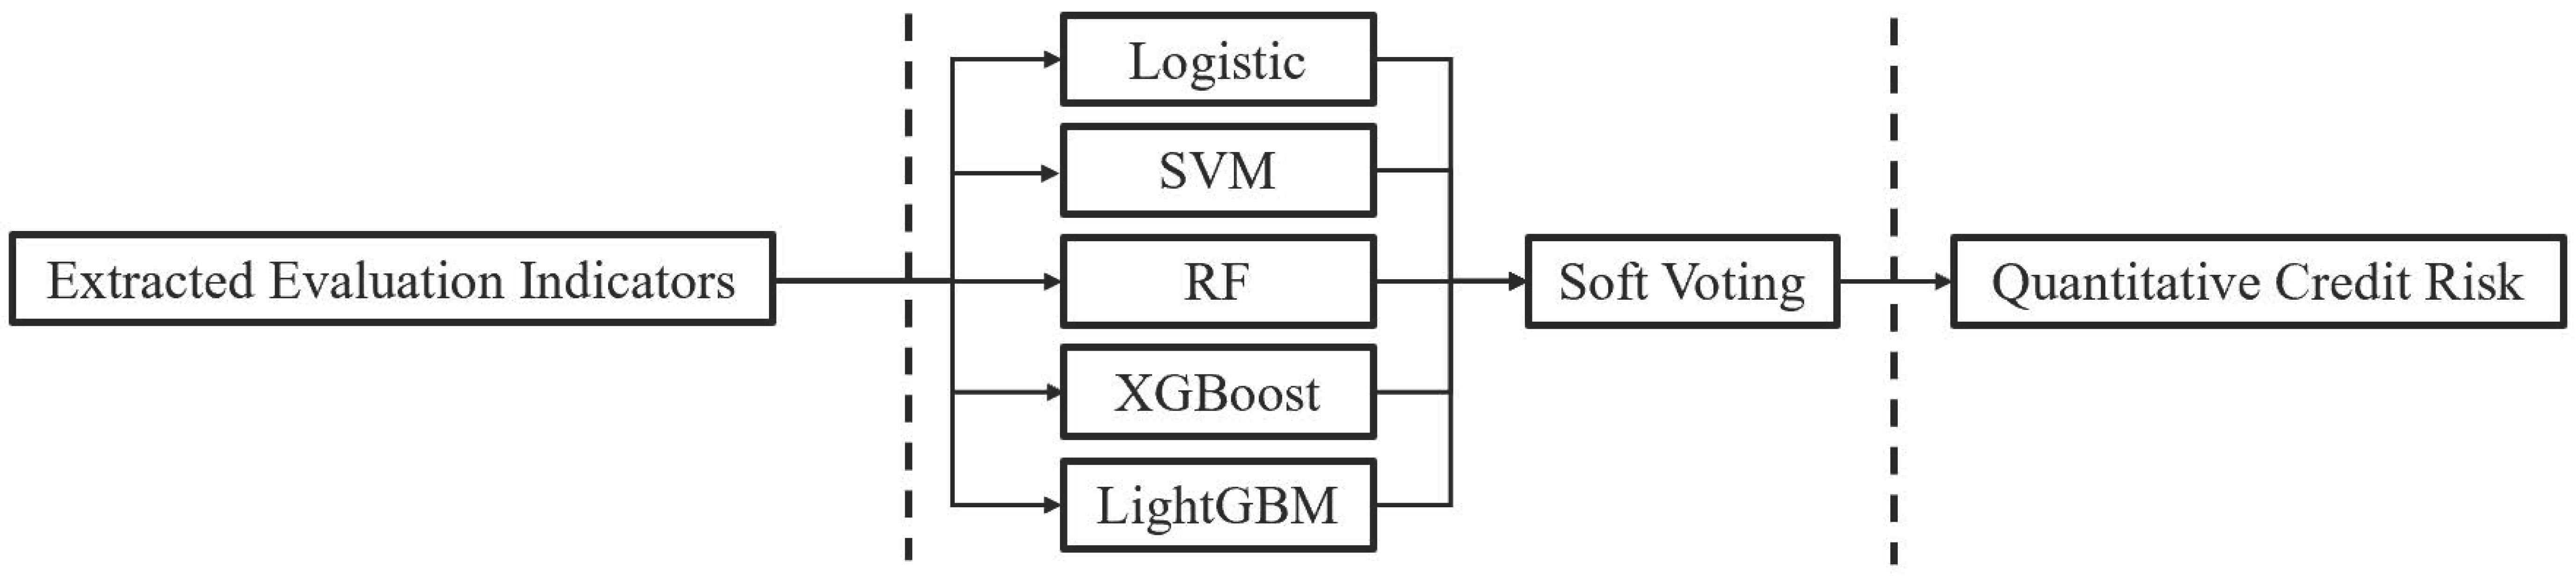
3.2. Model Building
As shown in
Figure 1, the building process of the soft voting fusion model is as follows:
Step 1: Select the characteristic variables for SMEs’ credit risk evaluation.
Step 2: In the training stage, for five base classifiers, use Bayesian optimization and k-fold cross-validation to optimize the model parameters and obtain the optimal combination.
Step 3: During the tests, input the data of characteristic variables into five base classifiers.
Step 4: Obtain the final quantitative results through weighting and voting.
Then, the simulation effect of each base classifier is different. Therefore, the weight of each base classifier is determined according to its
Accuracy, as shown in Equation (9):
Accuracy is one of the commonly used evaluation indices in fusion models, but it is biased to determine the quantitative results only from the Accuracy. Therefore, this study also selects the AUC (area under the ROC curve) to assess the model performance. Generally, when the AUC is above 0.8, the model is considered acceptable.
4. Data and Descriptive Statistic
In this study, data from 123 representative SMEs nationwide that worked with a Chinese bank from 2016 to 2020, including income, expenditure, invoice status, credit ratings, and default records, are used. There are 373,554 total observations in the sample. These enterprises cover all types of SMEs in China. This period is not only a period of rapid development for SMEs, but also a period when financing difficulties are prominent. The characteristic variables can be extracted from credit records and transaction data to measure the credit risk of SMEs. Many studies have shown that credit risk evaluation indicators should consider both financial and non-financial factors (
Psillaki et al. 2010;
Tobback et al. 2017;
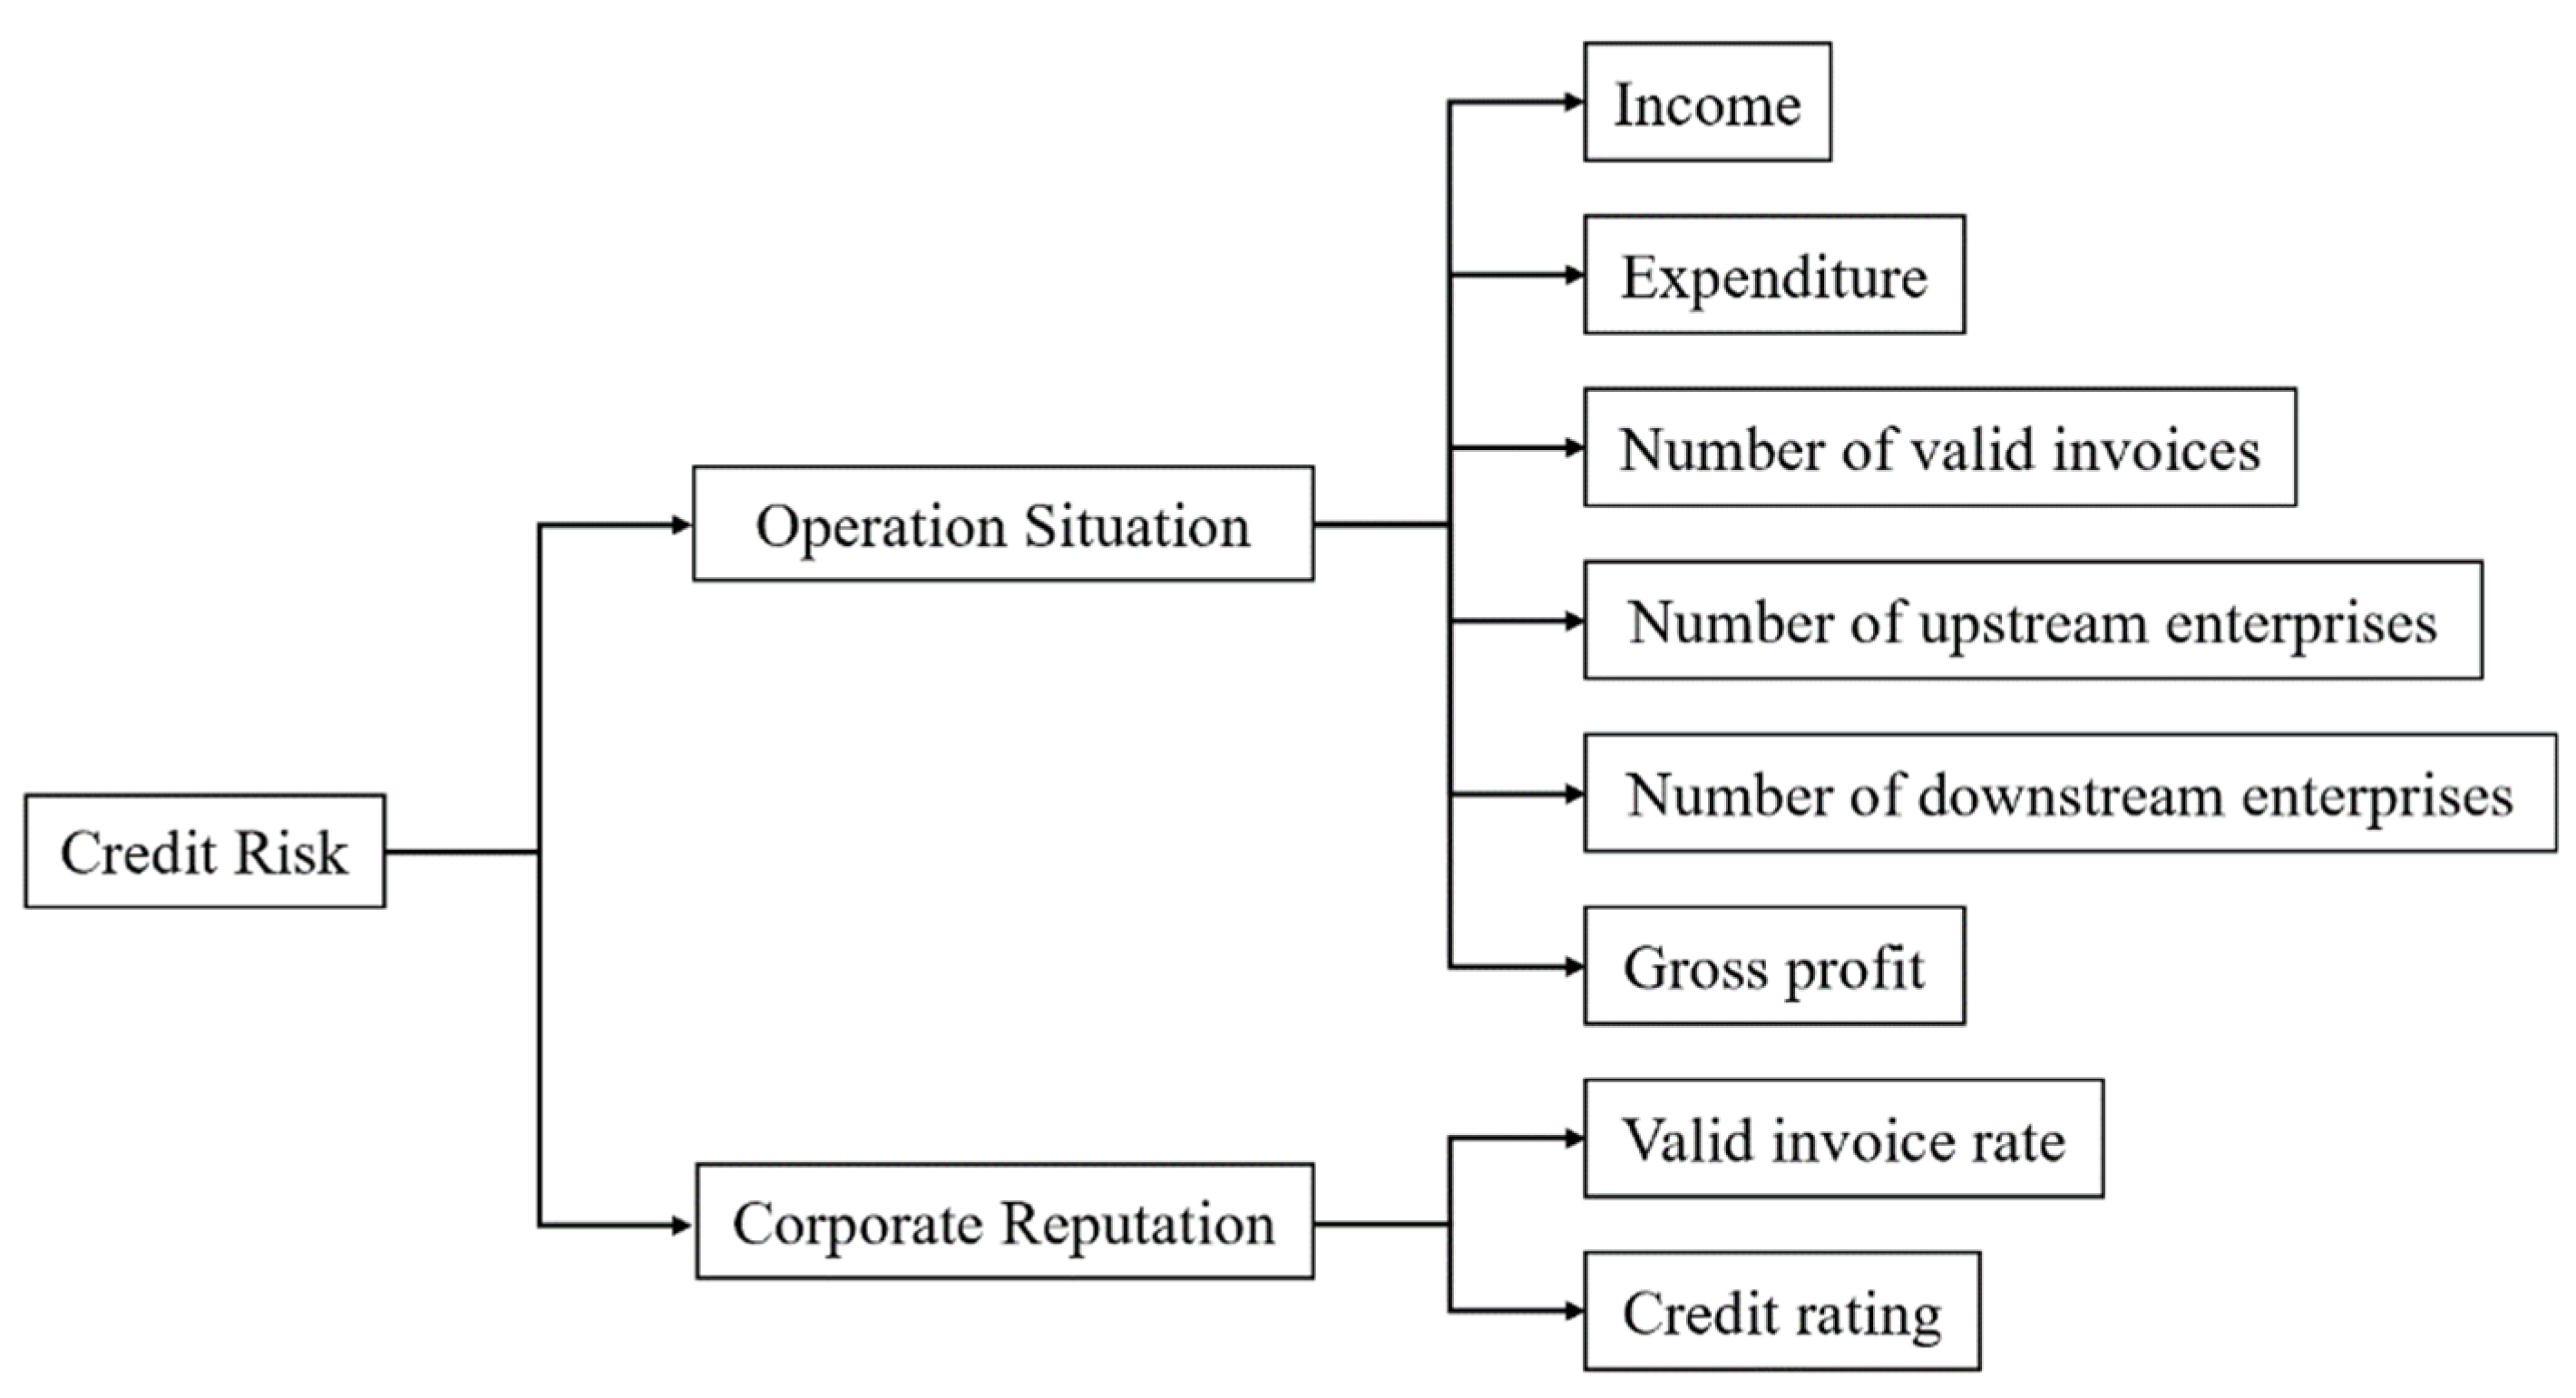
Grunert et al. 2005). Thus, this study selects evaluation indicators from two aspects—operation situation and corporate reputation.
Figure 2 depicts eight credit risk evaluation indicators.
4.1. Operation Situation
4.1.1. Income and Expenditure
Income is the total inflow of economic benefits over a period and expenditure refers to the total outflow of economic benefits over a period. In general, the higher the income of an enterprise, the larger the scale of its production and the stronger its solvency. Expenditure also reflects the scale of production and debt-paying ability to some extent.
4.1.2. Number of Valid Invoices
The number of valid invoices is the sum of valid invoices of a business over a period. More valid invoices imply more instances of effective transactions and better operations.
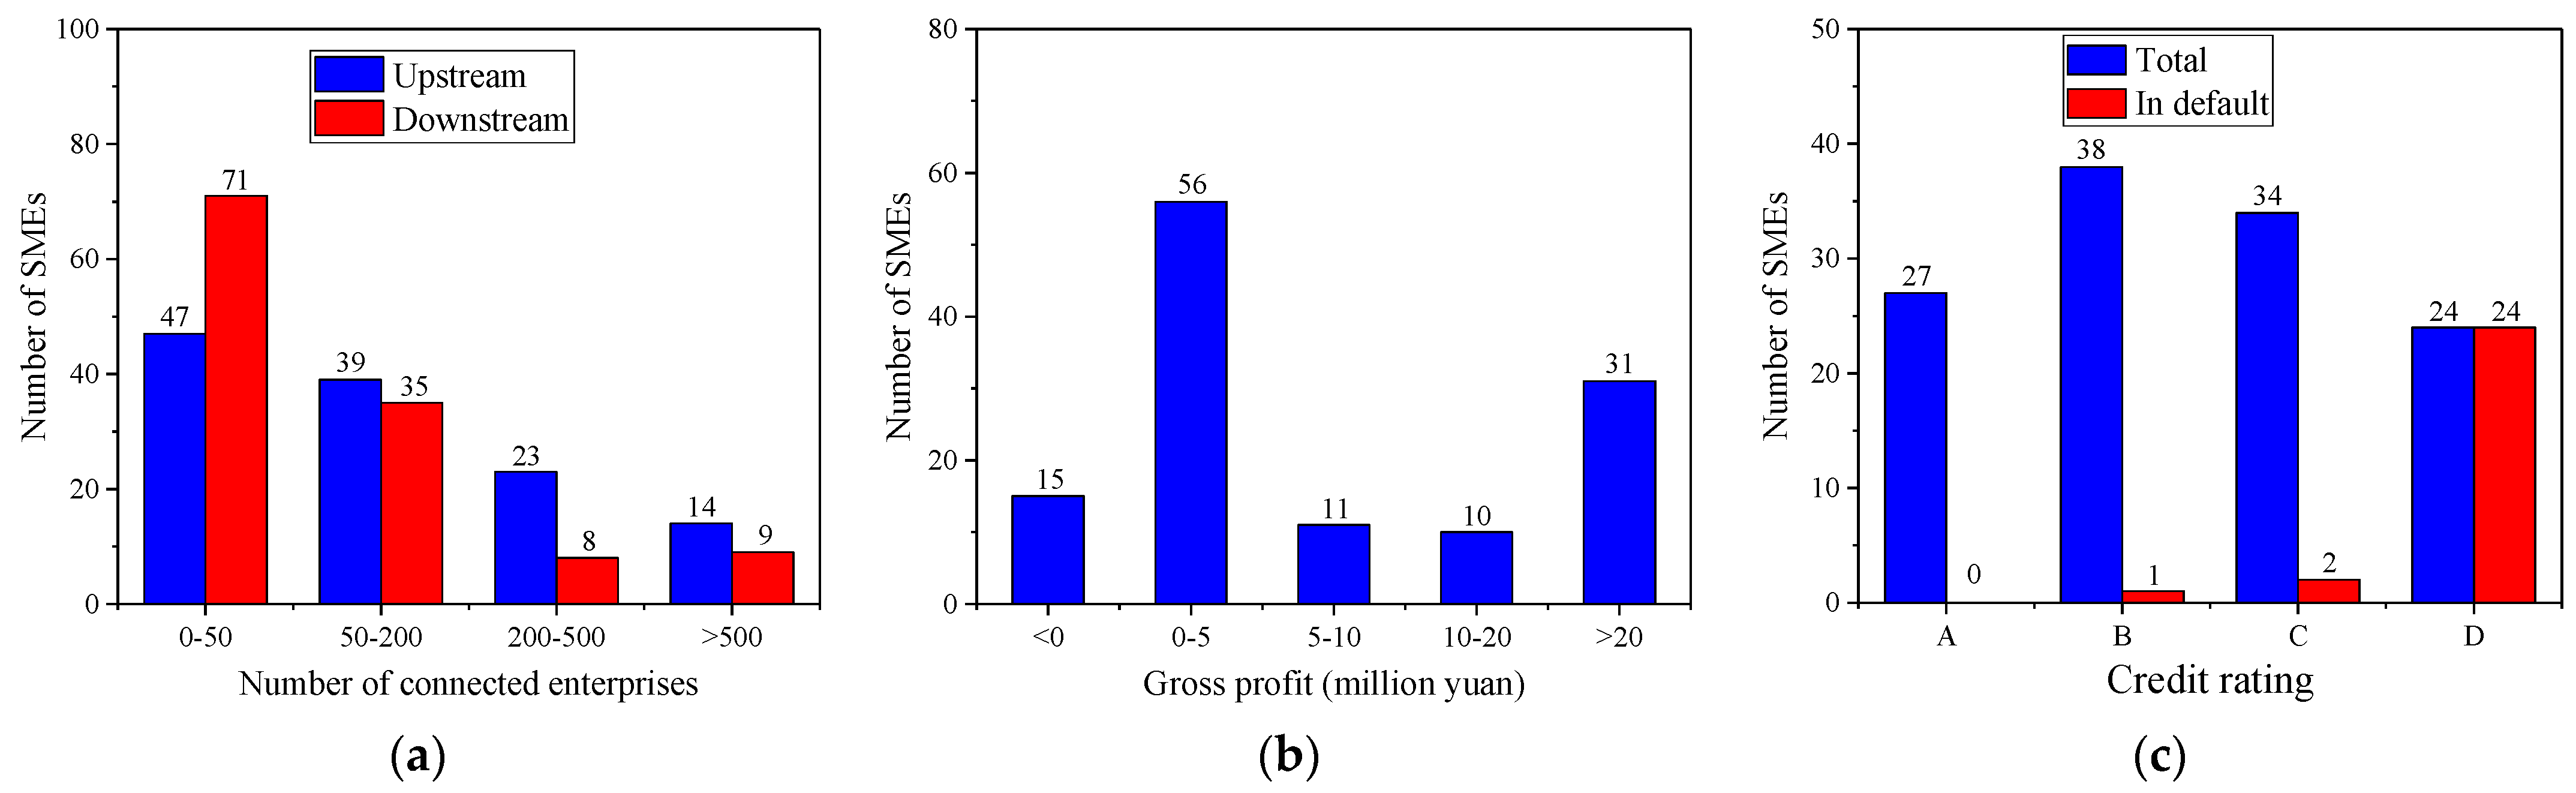
4.1.3. Number of Upstream and Downstream Enterprises
The number of upstream and downstream enterprises of SMEs reflects the stability of supply and distribution. The more the upstream and downstream enterprises are connected, the more channels there will be for SMEs to purchase raw materials and sell products.
Figure 3a depicts the number of upstream and downstream enterprises connected with each SME. The figure shows that the number of upstream and downstream enterprises connected with each enterprise varies greatly, but most of them are less than 200.
4.1.4. Gross Profit
The gross profit of an enterprise is directly related to its profitability. Only an enterprise that can maintain its sustainable profitability is able to repay its loans. Therefore, gross profit is a concentrated reflection of corporate strength and solvency.
Figure 3b depicts the gross profit distribution of the 123 SMEs. The figure reveals that the gross profit of each enterprise varies greatly, but most of them are profitable.
4.2. Corporate Reputation
Corporate reputation is the likelihood of an enterprise to abide by the contract and is the most important determinant of credit risk. Enterprises with a higher reputation have relatively lower credit risk.
4.2.1. Valid Invoice Rate
The valid invoice rate is the ratio of the number of valid invoices to the total invoices. If an enterprise cancels the transaction after issuing the invoice, the valid invoice rate may be relatively low and the corporate reputation will be worse. Conversely, if the corporate reputation is good, the valid invoice rate will be high.
4.2.2. Credit Rating
Credit rating is a credit index evaluated by banks based on various comprehensive indicators (e.g., the number of defaults and delays in repayments), which can effectively measure credit and have a strong predictive effect (
Tsolas 2015).
Figure 3c depicts the credit rating distribution of the 123 SMEs. The figure reveals the following:
First, there are four types of credit ratings (A, B, C, and D), and the credit rating distribution of SMEs is relatively balanced. Second, the number of SMEs in Class B is the largest, which is 38. Third, SMEs with a credit rating above D are more than 80% of the total, which implies that most of them have a good reputation. Finally, 27 SMEs have defaulted, and the overall default rate is 21.951%. All A-level SMEs have not defaulted, whereas all D-level SMEs (24 in total) have defaulted.
To facilitate the analysis, the four credit ratings (A, B, C, and D) are converted into scores (4, 3, 2, and 1), and SMEs with a record of default are downgraded. The descriptive statistics of the evaluation indicators are presented in
Table 1.
5. Quantitative Results
5.1. Performance of Base Classifiers
This paper first explores the prediction performance of each base classifier when it is applied alone.
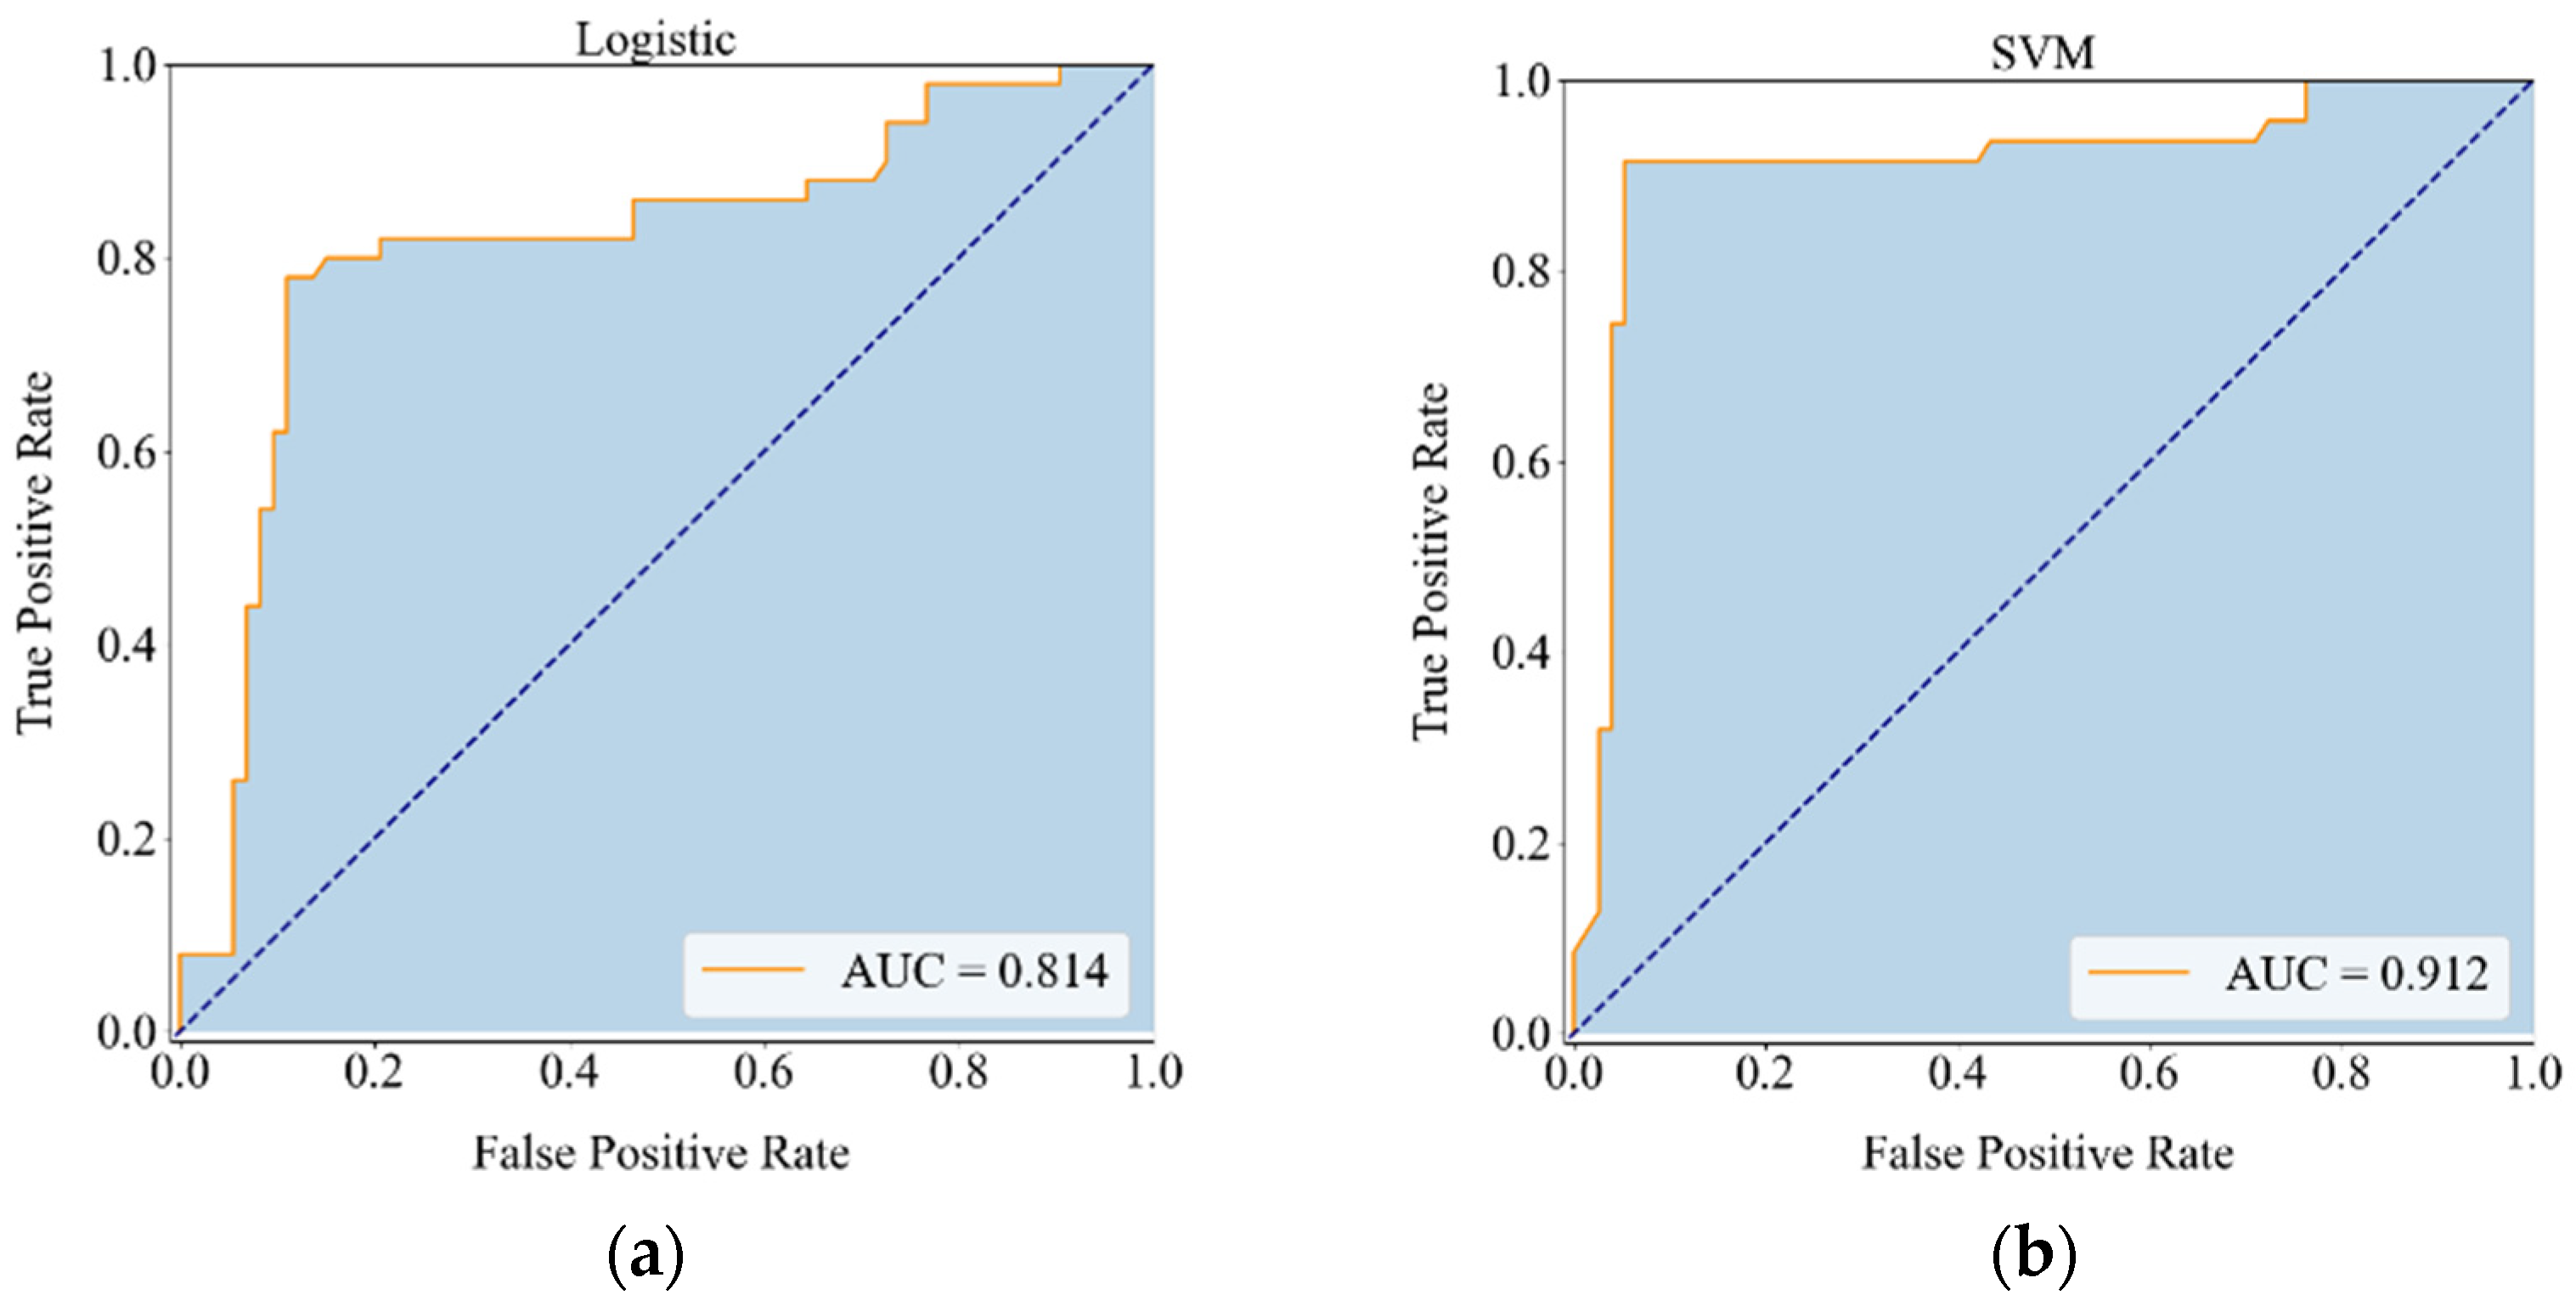
Table 2 presents the simulation effects of five base classifiers under optimal parameters.
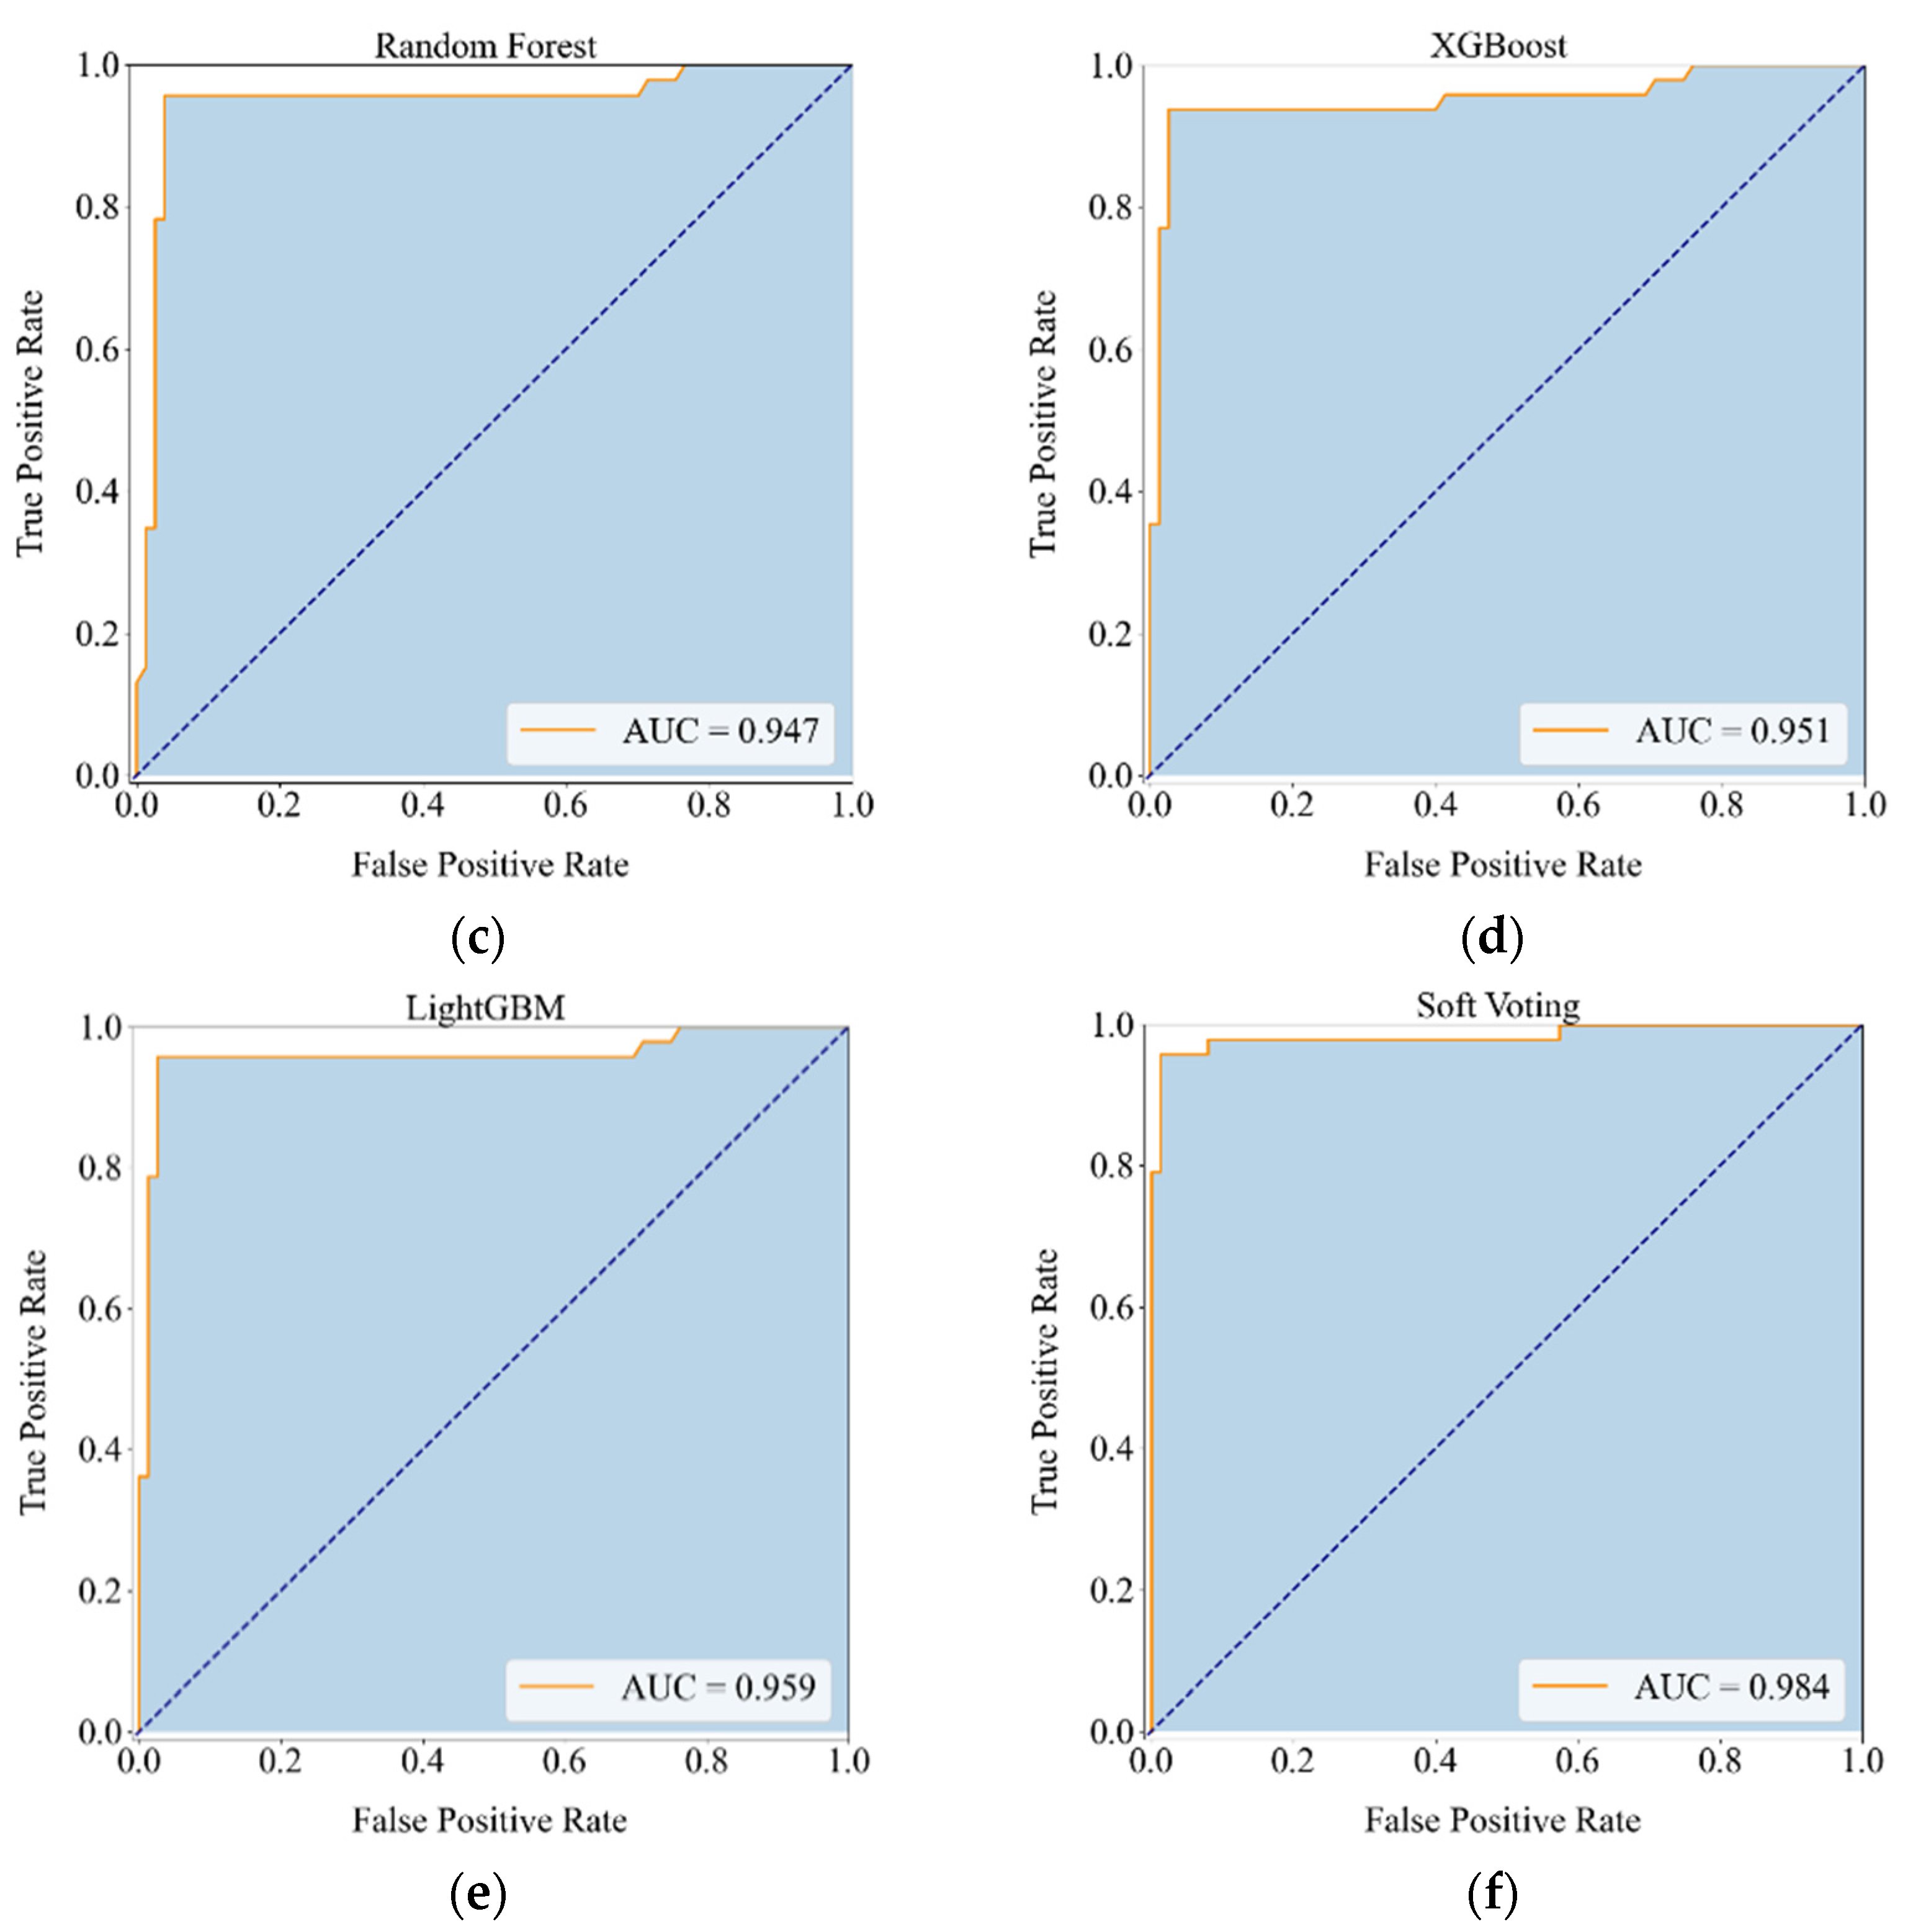
Figure 4 depicts the ROC curve of the classifiers. According to the performance of each base classifier, the AUC of logistic regression is only 0.814, and the simulation effect is inferior to others. The AUCs of SVM and RF are 0.912 and 0.947, respectively, which are significantly improved compared to those of the logistic regression. XGBoost and LightGBM have the best simulation results, and their results are close, with AUC above 0.950.
5.2. Performance of Soft Voting Fusion Model
To take advantage of each algorithm and further improve the accuracy of the prediction, this study employs soft voting to establish a fusion model. First, in the training stage, the training dataset is used to train each base classifier. After fitting and adjusting, base classifiers can have a combination of optimal parameters. Then, during the tests, the test dataset is input to base classifiers to predict the results. By combining
Accuracy of training set and test set,
Comprehensive Accuracy can be obtained. Next, based on the
Comprehensive Accuracy in
Table 2, the weight of logistic regression (0.177), SVM (0.199), RF (0.207), XGBoost (0.208), and LightGBM (0.209) is calculated via Equation (9). Finally, through the principles of soft voting, the predicted results are obtained. The performance of the fusion model is presented in
Table 2, and the ROC curve is shown in
Figure 4. The performance of the soft voting fusion model is better than that of the five base classifiers, and the AUC reaches 0.984, which is very close to a perfect classifier, indicating that this ensemble learning algorithm is feasible and effective.
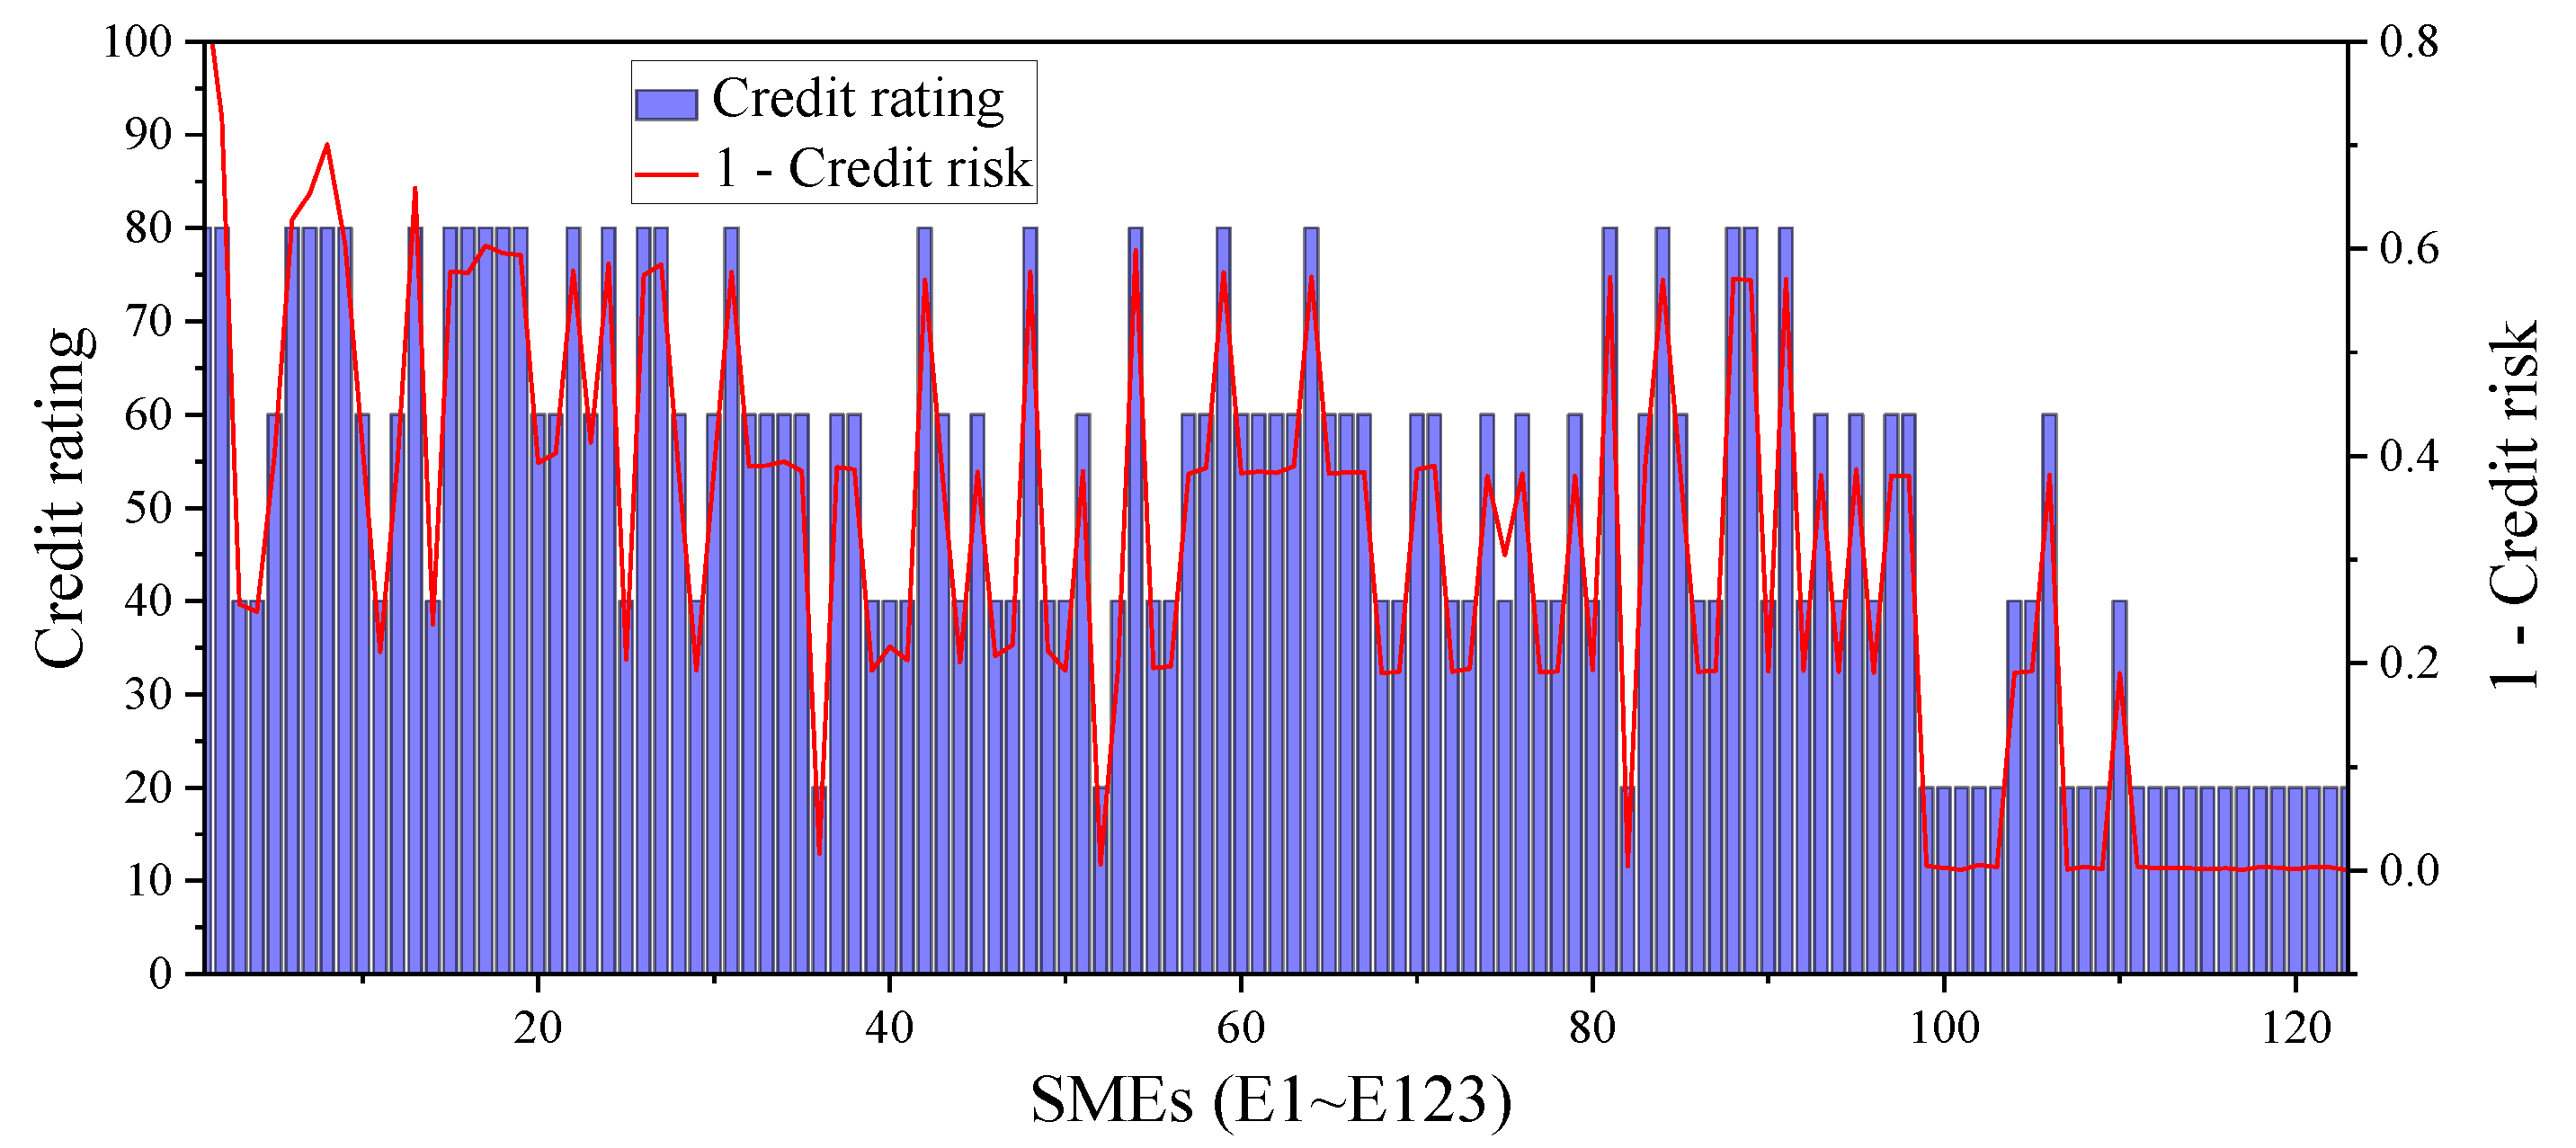
The quantitative SMEs’ credit risk can be obtained using the soft voting fusion model, as shown in
Figure 5. Furthermore, this study employs the given credit ratings to verify the reliability of the results. The figure indicates that the tendencies of the two variables (Credit rating and 1—Credit risk) are basically the same, and there is a high degree of fitting.
6. Conclusions and Suggestions
Reasonably predicting the credit risk of SMEs has become an important task for banks or financial institutions. The purpose of this study is to present a novel soft voting fusion model for SMEs’ credit risk assessment, thus providing a theoretical basis for the government to control credit risk and offering important references for banks to make credit decisions.
The main contributions of this paper are as follows. First, the application of soft voting integrated learning strategy is the biggest difference between this study and previous ones. Through majority voting and weighting, the soft voting fusion model can utilize the advantages of each algorithm and improve the prediction performance of a single classifier. Second, the selection of base classifiers is also different from previous studies. In this paper, we select classical statistical methods (logistic regression) and commonly used or advanced ML algorithms (SVM, RF, XGBoost, and LightGBM) to construct the soft voting fusion model. Third, data from 123 SMEs nationwide that worked with a Chinese bank from 2016 to 2020 are employed, and both financial and non-financial characteristic variables are considered. In the empirical analysis, we compare base classifiers with the soft voting fusion model and find that the fusion model can obtain better results than any single ML algorithm. Because even a slight enhancement in the accuracy of credit scoring models can minimize evaluation errors, the proposed model will bring huge savings.
From the perspective of banks and financial institutions, they can make more reasonable quantification decisions using the predicted credit risk results obtained by the fusion model. With the goal of maximizing loan income and minimizing default probability of customers, they can make decisions on whether to loan, the loan interest rate, and the loan amount. From the perspective of SMEs, the construction of the credit risk evaluation model can also prompt them to pay more attention to the maintenance of corporate reputation and the improvement of product quality. From the perspective of the government, with the advent of the era of big data, the government can couple big data with this fusion model and provide information coverage for SMEs, banks, and financial institutions, thus helping to solve financing difficulties.
The proposed soft voting fusion model has been proved to be effective in China, but financial markets vary from nation to nation. In the future, we will develop a credit risk evaluation model using data from different countries to improve the feasibility and effectiveness. Moreover, non-financial indicators have some one-sidedness, and subjectivity still exists to some extent. Therefore, other factors that may affect the credit risk of SMEs, such as behavioral characters, can be combined with financial characteristics.
Author Contributions
Conceptualization, H.W.; methodology, G.G.; software, G.G. and P.G.; resources, G.G. and H.W.; data curation, H.W.; writing—original draft preparation, G.G.; writing—review and editing, G.G.; funding acquisition, P.G. All authors have read and agreed to the published version of the manuscript.
Funding
This research was funded by the Ministry of Education Research Project of Humanities and Social Sciences, Grant No. 20YJC630022.
Institutional Review Board Statement
Not applicable.
Informed Consent Statement
Not applicable.
Data Availability Statement
The data presented in this study are available on request from the corresponding author.
Conflicts of Interest
The authors declare no conflict of interest.
References
- Abdou, Hussein A., and John Pointon. 2011. Credit scoring, statistical techniques and evaluation criteria: A review of the literature. Intelligent Systems in Accounting, Finance and Management 18: 59–88. [Google Scholar] [CrossRef] [Green Version]
- Abid, Lobna, Soukeina Zaghdene, Afif Masmoudi, and Sonia Zouari Ghorbel. 2017. Bayesian network modeling: A case study of credit scoring analysis of consumer loans default payment. Asian Economic and Financial Review 7: 846–57. [Google Scholar] [CrossRef] [Green Version]
- Altman, Edward I., and Gabriele Sabato. 2007. Modelling credit risk for SMEs: Evidence from the US market. Abacus 43: 332–57. [Google Scholar] [CrossRef]
- Chen, Tianqi, and Carlos Guestrin. 2016. XGBoost: A scalable tree boosting system. Paper present at the 22nd ACM SIGKDD International Conference on Knowledge Discovery and Data Mining, San Francisco, CA, USA, August 13–17. [Google Scholar]
- Chen, Yehning, Rachel J. Huang, John Tsai, and Larry Y. Tzeng. 2015. Soft information and small business lending. Journal of Financial Services Research 47: 115–33. [Google Scholar] [CrossRef]
- Cruz, Jose Francisco Hernández Santa. 2021. An ensemble approach for multi-stage transfer learning models for COVID-19 detection from chest CT scans. Intelligence-Based Medicine 5: 100027. [Google Scholar] [CrossRef]
- D’Aurizio, Leandro, Tommaso Oliviero, and Livio Romano. 2015. Family firms, soft information and bank lending in a financial crisis. Journal of Corporate Finance 33: 279–92. [Google Scholar] [CrossRef] [Green Version]
- Durand, David. 1941. Risk Elements in Consumer Installment Financing. New York: National Bureau of Economic Research. [Google Scholar]
- Emekter, Riza, Yanbin Tu, Benjamas Jirasakuldech, and Min Lu. 2015. Evaluating credit risk and loan performance in online Peer-to-Peer (P2P) lending. Applied Economics 47: 54–70. [Google Scholar] [CrossRef]
- Fisher, Ronald A. 1936. The use of multiple measurements in taxonomic problems. Annals of Human Genetics 7: 179–88. [Google Scholar] [CrossRef]
- Grunert, Jens, Lars Norden, and Martin Weber. 2005. The role of non-financial factors in internal credit ratings. Journal of Banking & Finance 29: 509–31. [Google Scholar]
- Hajek, Petr, and Krzysztof Michalak. 2013. Feature selection in corporate credit rating prediction. Knowledge-Based Systems 51: 72–84. [Google Scholar] [CrossRef]
- Hamzani, Umiaty, and Dinarjad Achmad. 2018. Bankruptcy Prediction: SMEs Case Study in Pontianak, Indonesia. Accounting and Finance Review 3: 9–15. [Google Scholar]
- Hand, David J., Jonathan J. Oliver, and A. Daniel Lunn. 1998. Discriminant analysis when the classes arise from a continuum. Pattern Recognition 31: 641–50. [Google Scholar] [CrossRef]
- Huang, Jih-Jeng, Gwo-Hshiung Tzeng, and Chorng-Shyong Ong. 2006. Two-stage genetic programming (2SGP) for the credit scoring model. Applied Mathematics and Computation 174: 1039–53. [Google Scholar] [CrossRef] [Green Version]
- Ke, Guolin, Qi Meng, Thomas Finley, Taifeng Wang, Wei Chen, Weidong Ma, Qiwei Ye, and Tie-Yan Liu. 2017. LightGBM: A highly efficient gradient boosting decision tree. Advances in Neural Information Processing Systems 30: 3146–54. [Google Scholar]
- Kieu, Le-Minh, Yuming Ou, Long T. Truong, and Chen Cai. 2020. A class-specific soft voting framework for customer booking prediction in on-demand transport. Transportation Research Part C: Emerging Technologies 114: 337–90. [Google Scholar] [CrossRef]
- Kim, Kyoung-jae, and Hyunchul Ahn. 2012. A corporate credit rating model using multi-class support vector machines with an ordinal pairwise partitioning approach. Computers & Operations Research 39: 1800–11. [Google Scholar]
- Lin, Shu Ling. 2009. A new two-stage hybrid approach of credit risk in banking industry. Expert Systems with Applications 36: 8333–41. [Google Scholar] [CrossRef]
- Liu, He. 2018. Study and Make Arrangements to Promote High-Quality Development of Small and Medium-Sized Enterprises. The First Meeting of the State Council Leading Group on Promoting the Development of Small and Medium-Sized Enterprises. Available online: http://www.gov.cn/guowuyuan/2018-08/20/content_5315204.htm (accessed on 20 August 2018).
- Ma, Xiaojun, Jinglan Sha, Dehua Wang, Yuanbo Yu, Qian Yang, and Xueqi Niu. 2018. Study on a prediction of P2P network loan default based on the machine learning LightGBM and XGboost algorithms according to different high dimensional data cleaning. Electronic Commerce Research and Applications 31: 24–39. [Google Scholar] [CrossRef]
- Mahabub, Atik. 2020. A robust technique of fake news detection using Ensemble Voting Classifier and comparison with other classifiers. SN Applied Sciences 2: 525. [Google Scholar] [CrossRef] [Green Version]
- Mahmoudi, Nader, and Ekrem Duman. 2015. Detecting credit card fraud by modified Fisher discriminant analysis. Expert Systems with Applications 42: 2510–16. [Google Scholar] [CrossRef]
- Malhotra, Rashmi, and D.K. Malhotra. 2002. Differentiating between good credits and bad credits using neuro-fuzzy system. European Journal of Operational Research 136: 190–211. [Google Scholar] [CrossRef]
- Malhotra, Rashmi, and D. K. Malhotra. 2003. Evaluating consumer loans using neural networks. Omega 31: 83–96. [Google Scholar] [CrossRef]
- Masmoudi, Khalil, Lobna Abid, and Afif Masmoudi. 2019. Credit risk modeling using Bayesian network with a latent variable. Expert Systems with Applications 127: 157–66. [Google Scholar] [CrossRef]
- Min, Jae H., and Young-Chan Lee. 2005. Bankruptcy prediction using support vector machine with optimal choice of kernel function parameters. Expert Systems with Applications 28: 603–14. [Google Scholar] [CrossRef]
- Moreno-Seco, Francisco, José M. Iñesta, Pedro J. Ponce de León, and Luisa Micó. 2006. Comparison of classifier fusion methods for classification in pattern recognition tasks. Structural, Syntactic, and Statistical Pattern Recognition 4109: 705–13. [Google Scholar]
- Moro, Andrea, Matthias Fink, and Daniela Maresch. 2015. Reduction in information asymmetry and credit access for small and medium-sized enterprises. Journal of Financial Research 38: 121–43. [Google Scholar] [CrossRef]
- Myers, James H., and Edward W. Forgy. 1963. The development of numerical credit evaluation systems. Journal of the American Statistical Association 58: 799–806. [Google Scholar] [CrossRef]
- Psillaki, Maria, Ioannis E. Tsolas, and Dimitris Margaritis. 2010. Evaluation of credit risk based on firm performance. European Journal of Operational Research 201: 873–81. [Google Scholar] [CrossRef]
- Rao, Congjun, Ming Liu, Mark Goh, and Jianghui Wen. 2020. 2-stage modified random forest model for credit risk assessment of P2P network lending to “Three Rurals” borrowers. Applied Soft Computing Journal 95: 106570. [Google Scholar] [CrossRef]
- Shen, Feng, Xingchao Zhao, Zhiyong Li, Ke Li, and Zhiyi Meng. 2019. A novel ensemble classification model based on neural networks and a classifier optimisation technique for imbalanced credit risk evaluation. Physica A: Statistical Mechanics and its Applications 526: 121073. [Google Scholar] [CrossRef]
- Tian, Zhenya, Jialiang Xiao, Haonan Feng, and Yutian Wei. 2020. Credit Risk Assessment based on Gradient Boosting Decision Tree. Procedia Computer Science 174: 150–60. [Google Scholar] [CrossRef]
- Tobback, Ellen, Tony Bellotti, Julie Moeyersoms, Marija Stankova, and David Martens. 2017. Bankruptcy prediction for SMEs using relational data. Decision Support Systems 102: 69–81. [Google Scholar] [CrossRef] [Green Version]
- Tsai, Chih-Fong, and Jhen-Wei Wu. 2008. Using neural network ensembles for bankruptcy prediction and credit scoring. Expert Systems with Applications 34: 2639–49. [Google Scholar] [CrossRef]
- Tsolas, Ioannis E. 2015. Firm credit risk evaluation: A series two-stage DEA modeling framework. Annals of Operations Research 233: 483–500. [Google Scholar] [CrossRef]
- Wiginton, John C. 1980. A note on the comparison of logit and discriminant models of consumer credit behavior. Journal of Financial and Quantitative Analysis 15: 757–70. [Google Scholar] [CrossRef]
- Wong, Alfred, Wei Lu, Dean Tjosvold, and Jie Yang. 2016. Extending credit to small and medium size companies: Relationships and conflict management. International Journal of Conflict Management 27: 331–52. [Google Scholar] [CrossRef]
| Publisher’s Note: MDPI stays neutral with regard to jurisdictional claims in published maps and institutional affiliations. |
© 2021 by the authors. Licensee MDPI, Basel, Switzerland. This article is an open access article distributed under the terms and conditions of the Creative Commons Attribution (CC BY) license (https://creativecommons.org/licenses/by/4.0/).


