Abstract
India is home to over one-third of all undernourished children worldwide, and it ranks 94th out of 107 nations in the Global Hunger Index 2020. Instability in production and market risks make agriculture a risky business and directly affect farmers’ income levels, thereby impacting food security. This review aimed to understand various features of different crop insurance policies in India and to analyze the Pradhan Mantri Fasal Bima Yojana’s (PMFBY) impacts on Indian farmers. A literature search was performed in all popular databases, including Scopus, Web of Science, ProQuest, AGRICOLA, AGRIS, and Google search engines, as well as annual Indian government reports. The keywords “Crop Insurance” OR “Pradhan Mantri Fasal Bima Yojana” OR “National Agriculture Schemes” AND “India” were searched to obtain relevant articles. By using cumulative data, we conducted a multiple regression analysis and a model was developed to estimate the effects of insurance characteristics on farmer coverage for the years 2017–2018 and 2018–2019. Agricultural insurance coverage under PMFBY remained low in terms of the number of farmers insured, the area insured, claims paid, and total farmers benefited. Compared to other schemes, the beneficiary and claim premium ratios were substantially lower under the PMFBY. The multiple regression analysis showed that farmers’ premiums have a significant effect on the number of farmers insured over time, although the subsidies do not have a significant influence in farmers’ insurance participation. Delays in claim settlement, the complexity of the system, and a lack of awareness among farmers are the major weaknesses of the PMFBY. Greater use of digital media could help spread awareness of these schemes among farmers.
1. Introduction
India is home to over one-third of all undernourished children worldwide, and it ranks 94th out of 107 nations in the Global Hunger Index 2020 study (Global Hunger Index 2020). Instability in production and market risks make agriculture a risky business and directly affect farmers’ income levels (Gulati et al. 2018). The predominance of rain-fed agriculture adds to the riskiness of agriculture, on which 58 percent of the Indian population is dependent (IBEF 2021). According to the United Nations Committee on World Food Security, food security means that all people have physical, social, and economic access to sufficient, safe, and nutritious food that always fits their food preferences and dietary needs for an active and healthy life (IFPRI 2021). It is projected for the next decades that due to the changing climate, an increasing global population, rising food prices, and other environmental stressors will all have substantial yet uncertain effects on food security (Indian Council of Food and Agriculture n.d.; IFPRI 2021). One option available to farmers to hedge against income instability is crop insurance. Since independence, efforts have been made both at the central- as well as state-level to introduce a crop insurance scheme for Indian farmers. The first crop insurance pilot programme was started in 1972 with little coverage. In 1978, it was replaced by the Pilot Crop Insurance Scheme. In 1985, the first nationwide crop insurance scheme, the Comprehensive Crop Insurance Scheme, was implemented based on the area approach.1 The National Agriculture Insurance Scheme replaced the scheme in 1999, which was later changed to the Modified National Agriculture Insurance Scheme. Apart from these schemes, the Government of India has introduced other crop insurance pilot projects and schemes, such as the Pilot Scheme on Crop Insurance (2000), the Farm Insurance Scheme (2003), and the Weather-Based Crop Insurance Scheme (2007). The repeated modifications in insurance schemes were introduced to provide better results regarding claims, premium rates, and other factors (Gulati et al. 2018). At present, two crop insurance schemes—the Pradhan Mantri Fasal Bima Yojana and the Restricted Weather-Based Crop Insurance Scheme—are operational.
The ‘Pradhan Mantri Fasal Bima Yojana’ was launched by the Government of India in kharif in 2016 and replaced previous schemes such as the National Agriculture Insurance Scheme (NAIS) and Modified National Agriculture Insurance Scheme (MNAIS). The insurance scheme operated on an “area approach”. The scheme was compulsory for farmers who took a loan from any financial source and voluntary for non-loanee farmers, but the scheme was made optional for loanee farmers from kharif 2020 (Tiwari et al. 2020). Various public and private insurance companies implemented the scheme, but under the overall control of the Ministry of Agriculture and Farmers’ Welfare, Government of India. The Weather-Based Crop Insurance remains in place, but the name has been changed to the Restructured Weather-Based Crop Insurance Scheme. As such, the Indian Council of Social Sciences Research (ICSSR) launched a major project entitled “An Evaluation of Pradhan Mantri Fasal Bima Yojana for Haryana and Punjab: The Way Forward for Diversification”; thus, this study is undertaken to evaluate the project and study the impacts of the schemes on the farmers. The objectives of this paper are (1) to review the various crop insurance schemes and (2) to evaluate the performance of the Pradhan Mantri Fasal Bima Yojana and the challenges it faces; therefore, the present paper is divided into five sections, including an introduction. The second section deals with the materials and methods used in this research. The third part reviews various crop insurance schemes in India, while the fourth section deals with the main results and provides a discussion of the research objectives. The last section includes the conclusions of the study with some recommendations.
2. Materials and Methods
A literature search was conducted in all major databases, including Scopus, Web of Science, ProQuest, AGRICOLA, AGRIS, and Google search engines. Information was also collected from annual reports of the Ministry of Agriculture and Farmers Welfare, Government of India. The keywords for the search included “Crop Insurance” OR “Agriculture Loans” OR “National Agriculture Schemes” AND “India” to include the Indian context, and the relevant articles were collected. The duplicates were excluded, and to ensure quality, the articles were reviewed independently by two researchers who are part of this study. Critical information from the websites of government ministries and annual reports were gathered, and the findings are discussed in the results and discussion section. To evaluate the performance of the Pradhan Mantri Fasal Bima Yojana and the challenges it faced in the farmer community, by using cumulative data, we conducted a multiple regression analysis and developed a model to estimate the effects of insurance characteristics on farmer coverage for the years 2017–2018 and 2018–2019.
The effects of insurance characteristics on farmers coverage under Pradhan Mantri Fasal Bima Yojana were estimated through multiple regression analysis by using cumulative data for 2017–2018 and 2018–2019 as:
where u is the error term and i refers to various states.
Farmer’s coverage(insured) under PMFBY = α + β1(Subsidyt,i) + β2(Claims paidt,i) + β3(Farmers Premiumt,i) + u,
3. Review of Various Crop Insurance Schemes in India
The major findings are discussed in two subsections, namely (1) the various crop insurance schemes adopted in India and (2) the state-wise performance of PMFBY.
3.1. Various Crop Insurance Schemes in India
A review of various crop insurance schemes is summarized below, along with Table 1.

Table 1.
Comparison of various crop insurance schemes in India.
3.1.1. Individual Indemnity-Based Experimental Crop Insurance Scheme
After independence, for the first time, the General Insurance Corporation of India introduced the Individual Indemnity-Based Experimental Crop Insurance Scheme on H-4 cotton in Gujarat. Afterwards, the scheme was extended to three other crops—groundnut, wheat, and potato. It was introduced in six states—Gujarat, Tamil Nadu, West Bengal, Maharashtra, Andhra Pradesh, and Karnataka. The scheme was based on the “individual approach”2 and was discontinued in 1979. Participation in this scheme was voluntary. The premium rates were between 5 and 10 percent. The insurance scheme covered a small number of farmers, i.e., 3110, for a premium of 4.54 lakh against a claim of 37.78 lakh during 1972–1978 (Agriculture Insurance Company of India Ltd. 2021). The implementation of the scheme led to the realization that the individual farm-based crop insurance scheme had too many drawbacks for it to be sustainable (Raju and Chand 2008).
3.1.2. Pilot Crop Insurance Scheme
The Pilot Crop Insurance Scheme (PCIS) was introduced in 1979. Prof V.M Dandekar of the Indian School of Political Economy, known as the father of crop insurance in India, recommended the homogeneous area approach as an alternative. The recommendations were accepted by the General Insurance Corporation of India, which introduced the PCIS, covering crops such as cereals, millets, cotton, potato, gram, oilseeds, and barley (Raju and Chand 2008). The scheme was voluntary, and the risk was shared by both the General Insurance Corporation of India and local state governments at a ratio of 2:1. The premium rate was between 5 and 10 percent of the sum insured (Dandekar 1985). This scheme continued until 1984. A total of 6.91 lakh hectares were insured during 1979–1984 (Raju and Chand 2008). A total of 6.22 lakh farmers from 12 states were insured, and a total premium of Rs. 195.01 lakh was collected. Total claims during the period amounted to Rs. 155.68 lakh (Tripathi 1987). The main drawback of the scheme was that it was directly linked to loans that banks or other financial institutions gave. Most of the small and marginal farmers could not participate in this scheme because they had poor access to institutional credit (Raju and Chand 2008).
3.1.3. Comprehensive Crop Insurance Scheme
In 1985, the scheme was replaced by the Comprehensive Crop Insurance Scheme (CCIS), the first nationwide crop insurance scheme implemented in India. The scheme was based on the homogeneous area approach, and the scheme was compulsory for loanee farmers. The insurance scheme was adopted in 15 states and 2 union territories and the insurance was linked to credit institutions (Mishra 1994). The premium rate was 2 percent for cereals (rice, wheat) and millets and 1 percent for pulses and oilseeds. For small and marginal farmers, a 50 percent subsidy was provided under the scheme and claims, and premiums for all farmers were shared by the central government and state governments at a ratio of 2:1 (Tripathi 1987). The insurance scheme continued up to kharif 1999. Over 763 lakh farmers were insured for a premium of Rs. 402.81 crore; total claims amounted to Rs. 2305.04 crore between 1985–1986 and 1999–2000 (Agriculture Insurance Company of India Ltd. 2021). A total of 59.78 lakh farmers benefited. The maximum claims were paid in Gujarat, i.e., Rs. 1336.93 crore and the least at Rs. 322.70 crore in Andhra Pradesh state during the period (Raju and Chand 2008). The northeastern states and highly irrigated states such as Punjab and Haryana did not participate in this scheme. The major drawbacks of the scheme were the area approach, the limited number of crops covered, the uniform premium rate for all farmers, and delays in premium payments (Jain 2004).
3.1.4. National Agriculture Insurance Scheme
In rabi 1999, the Comprehensive Crop Insurance Scheme was replaced by the National Agriculture Insurance Scheme (NAIS), implemented by the Agriculture Insurance Company of India Limited. The scheme covered all farmers, both loanee and non-loanee, against losses due to crop failure on account of natural calamities. The main feature of this scheme was that it covered all food grains and non-food grain crops, such as cereals, millets, pulses, oilseeds, and horticulture crops, for which data on the yield for the past year were available. The scheme was based on the area approach, whereby each state is assured of the unit of insurance (Mahajan and Bobade 2012). The premium rate was 3.5 percent for bajra and oilseeds, 1.5 percent for wheat, 2.5 percent for other kharif crops, and 2.0 percent for rabi crops. Initially, a 50 percent subsidy was provided on the premium to small and marginal farmers by the central and state governments (Raju and Chand 2008).
The NAIS scheme was implemented by 25 states and 2 union territories from 1999–2000 to 2016–2017. The scheme continued up to 2016, and a total of 2712.2 lakh farmers over an area of 3599.3 lakh hectares were insured for a sum amounting to Rs. 467,504.76 crore; total claims during the period amounted to Rs. 56,453.77 crore. Around 781.02 lakh farmers benefited from this scheme. Maharashtra had the highest number of total farmers insured (517.71 lakh) and the highest number of beneficiaries (248.1 lakh) (Agriculture Insurance Company of India Ltd. 2021) (Appendix A; Table A1).
3.1.5. Weather-Based Crop Insurance Scheme
The Weather-Based Crop Insurance Scheme (WBCIS) introduced in 2007–2008 included a weather index, which covered losses due to unexpected weather, i.e., high or low temperatures, excess or deficit rainfall. At that time, private sector insurance companies came into the market (Nair 2010b). The scheme is a repackaged version of a rainfall insurance scheme introduced as an experiment by ICICI Lombard in 2003 for groundnut and caster sugar farmers from Mahboobnagar district in Andhra Pradesh. Later, IFFCO-Tokio General Insurance Company and the public sector Agricultural Insurance Company of India (AIC) introduced similar schemes (Nair 2010a). The scheme was based on the “area approach”, and the premium rates were high, i.e., 8–10 percent for food crops and oilseeds and 12 percent for commercial crops, and was shared equally by the central and state governments. Participation in the scheme was compulsory for loanees and voluntary for non-loanee farmers. In 2007–2008, the scheme was implemented in selected states, such as Bihar, Chhattisgarh, Haryana, Madhya Pradesh, Punjab, Rajasthan, and Uttar Pradesh, respectively (Raju and Chand 2008). It was later extended to 21 states and Union Territories. The scheme continued up until 2016. A total of 720.2 lakh farmers over an area of 886.62 lakh hectares were insured for a sum amounting to Rs. 122,941.03 crore from 2007–2008 to 2015–2016. The gross premium was Rs. 12,161.4 crore, while claims amounted to Rs. 9665.47 crore. A total of 511.04 lakh farmers benefited from this scheme. Rajasthan and Bihar states were among the major beneficiaries of this scheme (Agriculture Statistics at a Glance 2019) (Appendix A; Table A2).
3.1.6. Modified National Agriculture Insurance Scheme
The Modified National Agriculture Insurance Scheme (MNAIS) was introduced in 2010 and replaced the NAIS, although several states continued the NAIS scheme and MNAIS through rabi 2015–2016. The main objectives of the new scheme were to provide insurance coverage and financial support to farmers in the event of crop failure of any of the notified crops in the notified area. The scheme encouraged the farmers to adopt the best innovative technology and high-value inputs in agriculture. Both loanee and non-loanee farmers were insured under this scheme, and it covered crop losses from the pre-sowing period to the post-harvest period. The participation was compulsory for loanee farmers and voluntary for non-loanee farmers, covering cereals, pulses, millets, oilseeds, horticulture, and commercial crops for which data for the past year were available. Another feature of this scheme was that it was based on an individual assessment, and a subsidy of 75 percent on the premium was provided to all category farmers, the cost of which was shared equally by the central and state governments. The MNAIS scheme was implemented in 21 states and union territories. The Modified National Agriculture Insurance Scheme continued up to 2016. A total of 276.62 lakh farmers and an area of 297.59 lakh hectares were insured for a sum of Rs. 62,079.32 crore over the period 2010–2011 to 2015–2016. The gross premium collected was Rs. 4935.77 crore, with claims amounting to Rs. 5578.42 crore. A total of 99.26 lakh farmers benefited from this scheme (Agriculture Statistics at a Glance 2019) (Appendix A; Table A3).
3.1.7. Restructured Weather-Based Crop Insurance Scheme
On 18 February 2016, the Weather-Based Crop Insurance Scheme was renamed the Restructured Weather-Based Crop Insurance Scheme (RWBCIS) to provide monetary support to farmers against crop loss to natural calamities. Initially, the scheme was implemented in 12 states during kharif 2016 and nine states during rabi 2016–2017 (Department of Financial Services 2021). The scheme was administered by the Ministry of Agriculture and Farmers’ Welfare. The scheme was based on the weather-index-based area approach. The insurance scheme covers cereals, millets, pulses, oilseeds, annual husbandry, horticultural, and commercial crops. This insurance scheme covered all farmers, including sharecroppers and tenants. Participation was compulsory for loanee farmers and voluntary for non-loanee farmers. The scheme covered risks from the pre-sowing period to the majority period.3 The premium rate ranged from 2.0 percent for kharif crops to 1.5 percent for rabi crops and 5.0 percent for horticultural and commercial crops. The progress of the RWBCIS is shown in Appendix A under Table A4. The scheme was implemented by 13 states from 2016–2017 to 2018–2019. A total of 62.48 farmers insured, out of which 43.96 lakh farmers were insured during kharif, 18.51 lakh farmers were insured under the rabi season over an area of 57.47 lakh hectares during 2016–2017 to 2018–2019. The sum insured was Rs. 38,770.72 crores during 2016–2017 to 2018–2019. The gross premium collected was Rs. 6886.56 crores, with claims amounted to Rs. 6186.32 crore during 2016–2017 to 2018–2019. Over 47.05 lakh farmers benefited from this scheme during 2016–17 to 2018–19 (Agriculture Statistics at a Glance 2019).
3.1.8. Pradhan Mantri Fasal Bima Yojana
In 2016, Pradhan Mantri Fasal Bima Yojana (PMFBY) was introduced by the government with new features, and an initial amount of Rs. 5500 crore was allocated in the 2016–2017 union budget (Rai 2019). This scheme provides a comprehensive risk solution at the lowest uniform premium rate across India. This scheme has replaced other crop insurance schemes, such as the National Agriculture Insurance Scheme and Modified National Agriculture Insurance Scheme, which had some inherent drawbacks. The insurance scheme operates on an area approach. The scheme covers all farmers, including loanee, non-loanee, tenants, and sharecroppers. Initially, the scheme was compulsory for loanee farmers who had taken a loan from any financial institution and voluntary for non-loanee farmers, but it was made optional for loanee farmers from kharif 2020 (Government of India 2020). Various public and private insurance companies implement the scheme under the overall control of the Ministry of Agriculture and Farmers’ Welfare. The main feature of this scheme is ‘one premium, one season’. It covers agricultural risks from the pre-sowing period to the post-harvest period and encourages the use of modern techniques such as global positioning systems (GPS), remote sensing, smartphones, and drones for accurate measurement of crops yields and losses for easy and fast settlements of claims. The scheme covers all kharif and rabi crops, as well as annual horticultural and commercial crops. The premium rate charged from farmers is uniform at 2.0 percent for kharif crops, 1.50 percent for rabi crops, and 5.0 percent for annual horticultural and commercial crops, with the remaining share of the premium paid equally by the central and state governments. Several changes were introduced in the scheme after it was first implemented to broaden coverage of both the number of farmers and the area. The major changes that the government has made so far are presented in Table 2. In 2017–2018, the new crop insurance portal www.agriinsurance.gov.in (accessed on 18 March 2021) was launched, then a further new crop insurance portal www.pmfby.gov.in (accessed on 15 March 2021) was launched for all states in 2018–2019. The Aadhar card has been compulsory since 2017–2018 under this scheme. In 2018–2019, crop losses caused by wild animals were covered by the scheme. In 2020–2021, several changes were made by the Government of India as suggested by various policymakers, which included the voluntary participation of all farmers, business allocation to insurance companies for three years instead of one year during 2016–2017 to 2019–2020, limited premium subsidies (i.e., 30 percent for unirrigated areas and 25 percent for irrigated areas), an increase of the premium subsidy from 50 percent to 90 percent for the northeastern states, fixed cut-off dates for the states to release the premium subsidy payments (i.e., 31 March and 30 September for the kharif and rabi seasons, respectively), flexibility for states to choose crop loss parameters, and new provisions made for insurance companies (i.e., 0.5 percent of total premium to be spent on information and education).
Table 2.
Salient changes made under PMFBY from 2016–2017 to 2020–2021.
3.2. State-Wise Performance of the PMFBY
Table 3 shows the state-wise coverage of PMFBY during 2016–2017 to 2017–2018. A total of 572.50 lakh farmers were insured in 2016–2017, while 481.58 lakh were insured in 2017–2018; thus, there was a 14.87 percent decrease in the number of farmers insured. Out of 26 states, 7 states4 showed an increase in the number of farmers insured in 2017–2018. The remaining 19 states5 showed a decrease in the number of farmers insured. The total area insured also decreased by about 12.88 percent in 2017–2018 compared to 2016–2017. Out of 26 states, the area insured in eight states6 increased in 2017–2018 compared to 2016–2017. There was a decrease in the area insured in 18 states7 during the same period.
Table 3.
State-wise coverage of PMFBY from 2016–2017 to 2017–2018.
The gross premium collection increased from Rs. 16,369.62 crore in 2016–2017 to Rs. 19,156.1 crore in 2017–2018, increasing by 14.54 percent. Claims paid by insurance companies amounted Rs. 11,412.53 crore in 2016–2017, which declined by 20.70 percent to Rs. 9455.12 crore in 2017–2018, mainly because of a reduction in the number of insured farmers. The claims amount increased only in 4 states8 during 2017–2018. The data reveal that the gross premium collection amount by insurance companies was greater than the claims paid out, showing that the insurance companies are making profits.
The number of farmers benefiting from the scheme fell from 289.44 lakh in 2016–2017 to 102.26 lakh in 2017–2018, a decrease of 64.66 percent. Out of a total of 481.58 lakh farmers insured, only 21.34 percent of farmers benefitted. The number of farmers who benefited rose in only four states9 during 2017–2018; thus, some states performed better regarding the number of farmers insured, total area insured, and gross premium collection.
4. Results and Discussion
4.1. Assessment of Various Crop Insurance Policies in India
4.1.1. Farmers and Areas Insured
Table 4 shows the season-wise comparison of coverage under crop insurance schemes during 2000–2001 to 2018–2019. Farmers insured found an increase under the National Agriculture Insurance Scheme (NAIS) (129.92 lakh) as compared to the WBCIS (1.65 lakh) in kharif 2008–2009. Similarly, the area insured under the NAIS (176.36 lakh hectares) was greater than the area insured under the Weather-Based Crop Insurance Scheme (WBCIS) (1.78 lakh hectares). In rabi season, a similar trend was found for numbers of farmers insured and area insured.
Table 4.
Season-wise comparison of farmers numbers of and areas insured under crop insurance schemes during 2000–2001 to 2018–2019.
The comparison of the Modified National Agriculture Insurance Scheme (MNAIS) and Weather-based Crop Insurance Scheme (WBCIS) shows that more farmers were insured under WBCIS (53.99 lakh) than under MNAIS (48.12 lakh) in kharif 2015–16. Similarly, the area insured under WBCIS (62.94 lakh hectares) was greater than the area insured under MNAIS (55.30 lakh hectares); however, in the rabi season, the trend was reversed. On the other hand, the comparison of RWBCIS and PMFBY shows that more farmers were insured under PMFBY (329.49 lakh) than under RWBCIS (14.01 lakh) in kharif 2018–2019. Similarly, the area insured under PMFBY (304.42 lakh hectares) was greater than the area insured under RWBCIS (14.72 lakh hectares) in the same season. In rabi season, a similar trend was found for numbers of farmers and areas insured; thus, the data revealed that both the numbers of farmers and areas insured were greater in PMFBY than under other crop insurance schemes.
4.1.2. Gross Premium Collection Amounts and Claims Paid
Table 5 shows the season-wise gross premium collection amounts and claims paid under crop insurance schemes during 2000–2001 to 2018–2019. The gross premium collection amount under NAIS (Rs. 511.94 crore) was more than the gross premium collection amount under WBCIS (Rs. 31.68 crore) during kharif 2008–2009. Similarly, the total amount of claims paid under NAIS (Rs. 176,361.9 crore) was more than the total amount of claims paid under WBCIS (Rs. 14.39 crore) in the same season. In the rabi season, a similar trend was found for gross premium collection and total amount of claims paid. This shows that gross premium amount and total amount of claims paid were highest under NAIS rather than WBCIS during 2008–2009.
Table 5.
Season-wise comparison of gross premium collection amounts and claims paid under crop insurance schemes during 2000–2001 to 2018–2019.
The gross premium collection amount under WBCIS (Rs. 986.56 crore) was greater than gross premium collection amount under MNAIS (Rs. 807.16 crore) during kharif 2015–2016. Similarly, the total amount of claims paid under WBCIS (Rs. 1314.11 crore) was greater than the total amount of claims paid under MNAIS (Rs. 1127.16 crore) in the same season. In the rabi season, a similar trend was found for the gross premium collection amounts and claims paid. This shows that the gross premium amount and claims paid were higher under WBCIS compared to MNAIS during 2015–2016. The gross premium collection amount under PMFBY (Rs. 13,179.91 crore) was greater than for RWBCIS (Rs. 1720.99 crore) during 2018–2019. Similarly, the total amount of claims paid under PMFBY (Rs. 4179.3 crore) was greater than under RWBCIS (Rs. 935.22 crore) in the same season. In the rabi season, a similar trend was found for gross premium collection amounts and claims paid; thus, the data show that both the gross premium collection amount and claim paid were greater under PMFBY than RWBCIS from 2015–2016 to 2018–2019.
Figure 1 and Figure 2 show the gross premium collection amounts and claims paid under the PMFBY for kharif and rabi seasons from 2016 to 2018. In the kharif and rabi seasons, the gross premium collection amount increased during the time period. In 2016–2017, the total amount of claims paid was lower during the kharif season than the rabi season, but in 2017–2018 more claims were paid during the kharif season compared to the rabi season; thus, the figures below show that the gross premium collection amount was greater than total amount of claims paid under PMFBY during 2016–2017 to 2018–2019.
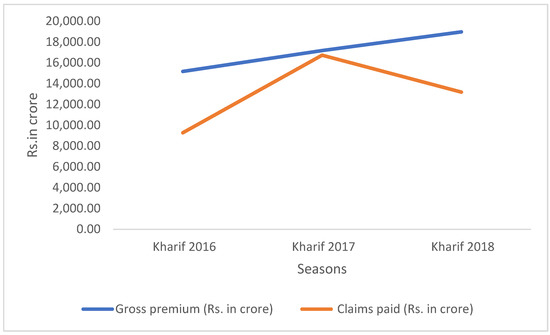
Figure 1.
Gross premium collection amount and total amount of claims paid under PMFBY for kharif seasons (2016–2018). Source: Agriculture Statistics at a Glance (2017, 2018, 2019).
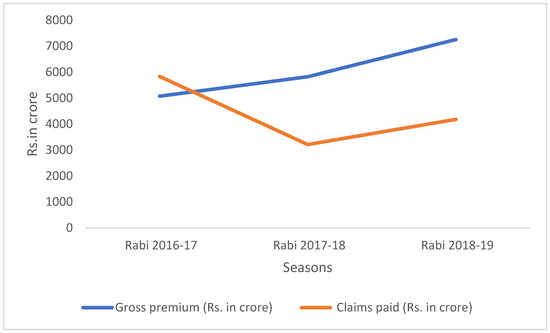
Figure 2.
Gross premium collection amount and total amount of claims paid under PMFBY for rabi seasons (2016–2017 to 2018–2019). Source: Agriculture Statistics at a Glance (2017, 2018, 2019).
4.1.3. Beneficiary Ratio and Claim Premium Ratio
The beneficiary and claim premium ratios have also been used to evaluate various crop insurance plans. The beneficiary ratio is derived by dividing the total number of farmers who benefited by the total number of farmers who were insured under a specific scheme. The claim premium ratio, on the other hand, is computed as the ratio of claims paid out versus the gross premium collection amount under a specific scheme. Table 6 displays the beneficiary and claim premium ratios for various crop insurance schemes in India from 2000–2001 to 2018–2019. The beneficiary ratios under all schemes were less than unity; however, when we compared the beneficiary ratios of different crop insurance schemes, the ratio was greater under RWBCIS than PMFBY. The ratios ranged between 0.65 and 0.81 during 2016–2019 for RWBCIS, while they ranged between 0.23 and 0.3 for PMFBY during the same period.
Table 6.
Assessment of various crop insurance schemes in India (2000–2019).
On the other hand, the claim/premium ratios were greater than unity under NAIS (i.e., 5.37, 2.56, 4.43 during 2000–2001, 2005–2006, and 2009–2010), indicating that the total amount of claims paid by the insurance companies was greater than the premium collection amount. The claim premium ratios were less than unity under WBCIS (ranging between 0.59 and 0.75 during 2007-2016). The claim premium ratios were found to be less than unity for RWBCIS and PMFBY. The ratio was 0.66 in 2018–2019 under PMFBY, which was less than the ratio for RWBCIS (0.91 in 2018–2019), indicating that the total amount of claims paid by insurance companies was lower than the premium collection amount; thus, insurance companies received more profits under PMFBY during 2016–2017 to 2018–2019.
Table 7 shows the state-wise pending claims to the farmers under PMFBY during 2019–2020. The data show that a total of 13 states have not received claims under PMFBY due to delays of claims by insurance companies. The data show that a total of Rs. 21,160.07 crore claims were reported, of which Rs. 8419.22 crore claims were paid, while the remaining Rs. 9364.5 crore claims are pending due to a share of the subsidies being paid by the states during 2019–2020; thus, the data show that insurance companies have held the claims due to the states’ pending share of the subsidies. The data shows that the claims are delayed by more than one year; however, according to PMFBY guidelines, claims must be settled by the insurance company within 30 days after the crop loss assessment. Since farmers have been waiting for claims for more than one year, with the majority of the farmers belonging to small and marginal categories, the delayed claims process is not in favor of farmers; therefore, delayed claims are a major weakness of PMFBY. Descriptive statistics for the variables selected for the regression analysis are shown in Table 8. The numbers of farmers insured ranged from 0.0014 lakh to 217.31 lakh, with an average of 38.44 lakh for the cumulative 2017–2018 period, and ranging from 0.014 lakh to 362.33 lakh with an average of 59.89 lakh for the cumulative 2018–2019 period.
Table 7.
State-wise pending claims under PMFBY in 2019–2020 (Rs. in crore).
Table 8.
Descriptive statistics.
Using cumulative data, a multiple regression model was developed to estimate the effects of insurance characteristics on farmer coverage for the years 2017–2018 and 2018–2019 (Table 9). The results indicate that the farmers’ premium has a significant effect on the farmers insured over the time period. The claims paid by the insurance companies had a negative impact in the initial years, although in later years, it had a positive impact on the farmers’ insurance. The subsidy did not play much of a role in the farmers’ participation in the insurance scheme.
Table 9.
Effects of insurance characteristics on farmers covered under PMFBY.
As mentioned above, the Pradhan Mantri Fasal Bima Yojana has been facing many challenges. The coverage of the yojana is the most challenging task. Although the data in the study showed that in the initial year of PMFBY 2016–2017, coverage of agriculture insurance in terms of farmers insured, area insured, claims paid, and farmers benefited increased in kharif 2016 as compared to kharif 2015, in kharif 2017 it decreased (Bhushan and Kumar 2017; Ghosh 2018; Rai 2019). A lack of awareness is the main reason for the lower coverage in the scheme. The state governments, central government, and insurance companies need to start an awareness campaign regarding the PMFBY in rural areas (Mukherjee and Pal 2017; Rai 2019). Given the penetration of social media platforms in rural areas, greater use of digital media could help spread awareness of these schemes among farmers. There should be proper updating of data regularly on the PMFBY portal, and this portal must have social media accounts, which would help further increase the awareness of this yojana.
The other major challenge that the PMFBY faces is the slew of competing schemes launched by state governments, in which the state governments bear the entire premium costs on behalf of the farmers. These include schemes such as the Bihar government’s Bihar Rajya Fasal Sahayata Yojana, the Gujarat government’s Mukhya Mantri Kisan Sahay Yojana, West Bengal’s Bangla Shasya Bima scheme, and the Andhra Pradesh government’s YSR Free Crop Insurance scheme (Hussain 2020; Tiwari et al. 2020). The share of these states due to the high actuarial premium rate10 under PMFBY was much higher, so these states initiated their own crop insurance policies.
Delays in claim settlement and the complexity of the system are other weaknesses of the PMFBY. This is one major reason why farmers refuse to adopt the policy (Mukherjee and Pal 2017; Ghosh 2019; Tiwari et al. 2020). Under the newly revamped guidelines for the PMFBY in 2020, state governments are required to release the subsidy share to the insurance companies within the stipulated timeframe; otherwise, the states will lose the chance to participate in the scheme in upcoming seasons. This is a major improvement to the guidelines for the yojana, requiring strict vigilance. Given India’s fast-rising population, resource restrictions, and climate change issues, as well as the effects of the COVID-19 epidemic, it is critical that food security be prioritized as a core policy objective.
5. Conclusions
Since independence, the Government of India has launched various crop insurance schemes intermittently to sustain the farmers’ income levels. Currently, two crop insurance schemes are operating in India, i.e., Pradhan Mantri Fasal Bima Yojana (PMFBY) and the Restructured Weather-Based Crop Insurance Scheme (RWBCIS). As compared to previous schemes, the PMFBY has come up with modified features, i.e., one premium, one season; coverage of all kharif and rabi seasons and all annual commercial and horticulture crops; risks covered from the pre-sowing period to the post-harvesting period; use of modern technology for assessment of crop losses, such as drones and GPS; claim paid directly into farmers accounts; three levels of indemnity offered, namely 70 percent, 80 percent, and 90 percent. To make it more successful and farmer-friendly, some new features have been added, such as voluntary participation for all farmers, business allocation to insurance companies for three years rather than one, linking with the Aadhaar card, mandatory requirements for states to pay subsidies on time, and flexibility for states to decide on additional risk coverage; however, we found that PMFBY showed limited success during 2016–2017 to 2017–2018.
Further, we found that the agriculture insurance coverage under PMFBY is still low in terms of the farmers insured, areas insured, claims paid, and farmers benefited. The data showed a decrease in the number of farmers insured from 572.50 lakh in 2016–2017 to 481.58 lakh in 2017–2018, a decrease of 14.87 percent for the years for which data are available. The areas covered by the scheme were reduced by roughly 12.88 percent in 2017–2018 compared to 2016–2017, as were the claims paid by insurance firms, which fell by 20.70 percent from Rs. 11,412.53 crore in 2016–2017 to Rs. 9455.12 crore in 2017–2018. The number of benefitted farmers also fell from 289.44 lakh farmers in 2016–2017 to102.26 lakh in 2017–2018, a steep decline of 64.66 percent in 2017–2018. The beneficiary and claim premium ratios were found to be much lower under the PMFBY for the period of 2016–2017 to 2018–2019 as compared to the ratios under the National Agriculture Insurance Scheme (NAIS), Weather-Based Crop Insurance Scheme (WBCIS), Modified National Agriculture Insurance Scheme (MNAIS), and Restructured Weather-Based Crop Insurance Scheme (RWBCIS).
Through the multiple regression model, the effects of the characteristics of the PMFBY on the farmers’ coverage were studied, showing that the farmers’ premium had a significant effect on the number of farmers insured over the time period, although the subsidy did not play much of a role in farmers’ participation in insurance scheme.
Author Contributions
Conceptualization, S.K.; methodology, S.K. and V.K.C.; literature review, S.K., H.R., and H.S.; software, S.K. and H.R.; validation, S.K., H.R., and H.S.; formal analysis, S.K., H.R., and H.S.; investigation, S.K.; resources, S.K.; data curation, H.R. and H.S.; writing—original draft preparation, S.K. and H.R.; writing—review and editing, V.K.C.; supervision, S.K. and V.K.C.; project administration, S.K. All authors have read and agreed to the published version of the manuscript.
Funding
This paper is from the ICSSR funded project An Evaluation of Pradhan Mantri Fasal Bima Yojana for Haryana and Punjab: The Way Forward for Diversification.
Data Availability Statement
The data presented in this study are available on request from the corresponding author.
Acknowledgments
This paper is from ICSSR major project entitled “An Evaluation of Pradhan Mantri Fasal Bima Yojana for Haryana and Punjab: The Way Forward for Diversification”. We thank all those involved directly and indirectly in this project.
Conflicts of Interest
The authors declare no conflict of interest.
Appendix A
Table A1.
State-wise cumulative performance of NAIS in India (rabi 1999–2000 to rabi 2015–2016).
Table A1.
State-wise cumulative performance of NAIS in India (rabi 1999–2000 to rabi 2015–2016).
| States/UTs | Farmers Insured (in lakh) | Area Insured (in lakh ha) | Sum Insured (Rs. in Crore) | Gross Premium (Rs. in Crore) | Claims Paid (Rs. in Crore) | Farmers Benefitted (in lakh) |
|---|---|---|---|---|---|---|
| Andhra Pradesh | 306.72 | 464.68 | 65,766.96 | 1887.49 | 5197.45 | 70.30 |
| Assam | 4.226 | 3.09 | 908.22 | 25.31 | 16.93 | 0.66 |
| Bihar | 107.07 | 117.10 | 28,298.79 | 629.05 | 4065.24 | 45.59 |
| Chhattisgarh | 118.025 | 235.40 | 15,049.99 | 381.76 | 1107.39 | 23.89 |
| Goa | 0.082 | 0.13 | 3.18 | 0.06 | 0.02 | 0.0070 |
| Gujarat | 154.96 | 351.95 | 49,318.71 | 2026.73 | 8803.9 | 55.0092 |
| Haryana | 6.35 | 7.69 | 834.96 | 24.14 | 43.36 | 1.29 |
| Himachal Pradesh | 3.72 | 2.92 | 785.33 | 16.57 | 22.52 | 1.147 |
| Jharkhand | 69.31 | 42.47 | 4596.85 | 111.68 | 738.89 | 25.82 |
| Karnataka | 143.59 | 225.90 | 20,139.8 | 579.13 | 2887.66 | 61.002 |
| Kerala | 4.61 | 4.15 | 871.66 | 18.82 | 30.63 | 0.85 |
| Madhya Pradesh | 438.00 | 1032.01 | 100,114.7 | 2679.18 | 10,279.18 | 99.88 |
| Maharashtra | 517.71 | 408.71 | 39,722.97 | 1694.73 | 9840.56 | 248.12 |
| Manipur | 0.35 | 0.57 | 148.12 | 3.69 | 12.26 | 0.29 |
| Meghalaya | 0.36 | 0.36 | 74.73 | 3.2 | 0.68 | 0.03 |
| Mizoram | 0.001 | 0.00 | 0.23 | 0.01 | 0.11 | 0.0011 |
| Orissa | 199.75 | 194.60 | 36,237.95 | 907.12 | 3877.32 | 44.08 |
| Rajasthan | 150.58 | 313.80 | 16,203.09 | 457.54 | 2621.66 | 52.005 |
| Sikkim | 0.020 | 0.01 | 3.52 | 0.08 | 0.01 | 0.00086 |
| Tamil Nadu | 83.088 | 105.60 | 25,845.58 | 672.89 | 3506.33 | 32.60 |
| Telangana | 13.35 | 15.80 | 6791.6 | 194.09 | 343.35 | 5.39 |
| Tripura | 0.212 | 0.14 | 33.02 | 0.9 | 0.58 | 0.03 |
| Uttar Pradesh | 234.260 | 0.70 | 33,537.82 | 684.82 | 1169.38 | 45.176 |
| Uttarakhand | 3.991 | 3.73 | 870.98 | 19.78 | 41.88 | 1.19 |
| West Bengal | 151.154 | 74.28 | 21,097.29 | 1093.12 | 1725.68 | 35.943 |
| A and N Islands | 0.0477 | 0.07 | 23 | 0.64 | 116.41 | 0.011 |
| Puducherry | 0.4325 | 0.60 | 116.7 | 2.28 | 3.13 | 0.072 |
| Jammu and Kashmir | 0.490 | 0.69 | 109.02 | 2.14 | 1.26 | 0.044 |
| Grand Total | 2712.54 | 3599.30 | 467,504.76 | 14,116.95 | 56,453.77 | 781.02 |
Source: Agriculture Insurance Company of India, New Delhi.
Table A2.
State-wise cumulative performance of WBCIS in India (2007–2008 to 2015–2016).
Table A2.
State-wise cumulative performance of WBCIS in India (2007–2008 to 2015–2016).
| States/UTs | Farmers Insured (in lakh) | Area Insured (in lakh ha) | Sum Insured (Rs. in Crore) | Gross Premium (Rs. in Crore) | Claims Paid (Rs. in Crore) | Farmers Benefitted (in lakh) |
|---|---|---|---|---|---|---|
| Andhra Pradesh | 36.17 | 29.03 | 15127.91 | 1510.46 | 1077.06 | 23.87 |
| Assam | 0.676 | 0.389 | 236.21 | 23.90 | 7.34 | 0.46 |
| Bihar | 127.98 | 130.24 | 30,231.44 | 2641.72 | 1484.53 | 106.34 |
| Chhattisgarh | 12.81 | 22.35 | 4421.91 | 420.57 | 318.73 | 8.42 |
| Gujarat | 4.976 | 4.13 | 223.95 | 22.39 | 8.57 | 1.70 |
| Haryana | 3.58 | 5.99 | 1894.24 | 167.05 | 64.67 | 2.49 |
| Himachal Pradesh | 3.90 | 1.118 | 1415.68 | 152.92 | 106.21 | 2.75 |
| Jammu and Kashmir | 0.013 | 0.008 | 4.61 | 0.46 | 0.24 | 0.01 |
| Jharkhand | 5.849 | 5.614 | 1208.13 | 106.57 | 76.25 | 5.26 |
| Karnataka | 9.790 | 12.13 | 2336.25 | 265.08 | 186.37 | 7.92 |
| Kerala | 1.628 | 1.19 | 369.82 | 36.17 | 32.76 | 1.28 |
| Madhya Pradesh | 13.654 | 18.8 | 5023.04 | 495.17 | 317.77 | 11.5 |
| Maharashtra | 29.081 | 29.32 | 7832.7 | 952.52 | 111.11 | 25.46 |
| Orissa | 3.157 | 4.56 | 657.81 | 56.56 | 32.10 | 2.15 |
| Punjab | 0.00017 | 0.00095 | 0.19 | 0.02 | 0.00 | 0 |
| Rajasthan | 445.60 | 572.38 | 47,097.58 | 4691.25 | 4048.76 | 293.19 |
| Tamil Nadu | 1.303 | 1.697 | 843.49 | 29.96 | 23.29 | 0.727 |
| Telangana | 1.666 | 1.74 | 530.89 | 52.60 | 122.61 | 1.577 |
| Uttar Pradesh | 15.436 | 13.18 | 2653.04 | 454.83 | 542.47 | 13.94 |
| Uttarakhand | 1.778 | 1.54 | 631.02 | 62.01 | 91.93 | 1.160 |
| West Bengal | 1.13 | 1.074 | 201.12 | 19.23 | 12.69 | 0.71 |
| Grand Total | 720.22 | 886.62 | 122,941.03 | 12,161.4 | 9665.47 | 511.04 |
Source: Agriculture Statistics at a Glance (2019).
Table A3.
State-wise cumulative performance of MNAIS in India (2010–2011 to 2015–2016).
Table A3.
State-wise cumulative performance of MNAIS in India (2010–2011 to 2015–2016).
| States/UTs | Farmers Insured (in lakh) | Area Insured (in lakh ha) | Sum Insured (Rs. in Crore) | Gross Premium (Rs. in Crore) | Claims Paid (Rs. in Crore) | Farmers Benefitted (in lakh) |
|---|---|---|---|---|---|---|
| Andhra Pradesh | 18.002 | 18.812 | 81.37 | 772.055 | 861.75 | 6.38 |
| Andaman and Nicobar | 0.007 | 0.0123 | 4.6 | 0.16 | 0.05 | 0.001 |
| Assam | 0.199 | 0.156 | 65.05 | 2.4873 | 0.69 | 0.018 |
| Bihar | 13.82 | 15.706 | 2628.32 | 532.25 | 177.04 | 3.22 |
| Chhattisgarh | 0.0001 | 0.0003 | 0.05 | 0.0022 | 0 | 0 |
| Goa | 0.002 | 0.0029 | 0.78 | 0.0194 | 0.14 | 0.0008 |
| Gujarat | 0.170 | 0.0059 | 2.61 | 0.2823 | 0 | 0 |
| Haryana | 2.626 | 4.46 | 1847.69 | 61.92 | 50.21 | 0.463 |
| Jharkhand | 1.175 | 1.18 | 266.71 | 26.11 | 4.04 | 0.089 |
| Karnataka | 15.66 | 22.65 | 3716.78 | 394.05 | 246.8 | 4.579 |
| Kerala | 0.474 | 0.640 | 238.94 | 12.0 | 5.67 | 0.042 |
| Madhya Pradesh | 2.18 | 3.590 | 510.89 | 19.89 | 8.73 | 0.12 |
| Maharashtra | 0.519 | 0.049 | 76.21 | 13.61 | 0 | 0 |
| Mizoram | 0.0051 | 0.004 | 0.99 | 0.06 | 0.09 | 0.005 |
| Orissa | 4.25 | 2.80 | 1032.17 | 34.78 | 247.98 | 2.048 |
| Rajasthan | 126.20 | 13.190 | 10,634.28 | 1166.33 | 1334.52 | 46.91 |
| Tamil Nadu | 4.76 | 5.22 | 1349.36 | 140.41 | 266.86 | 2.44 |
| Telangana | 9.231 | 12.57 | 5358.1 | 181.38 | 99.97 | 1.43 |
| Uttar Pradesh | 55.70 | 60.61 | 20,528.78 | 1097.56 | 1989.81 | 26.77 |
| Uttarakhand | 2.17 | 1.836 | 661.47 | 14.51 | 17.314 | 0.42 |
| West Bengal | 19.43 | 9.614 | 5017.98 | 465.74 | 266.64 | 4.28 |
| Grand Total | 276.62 | 297.59 | 62,079.32 | 4935.77 | 5578.42 | 99.26 |
Source: Agriculture Statistics at a Glance (2019).
Table A4.
Season-wise performance of RWBCIS in India (2016–2017 to 2018–2019).
Table A4.
Season-wise performance of RWBCIS in India (2016–2017 to 2018–2019).
| Season | Farmers Insured (in lakh) | Area Insured (in lakh ha) | Sum Insured (Rs. in Crore) | Gross Premium (Rs. in Crore | Claims Paid (Rs. in Crore) | Farmers Benefitted (in lakh) |
|---|---|---|---|---|---|---|
| Kharif 2016 | 15.44 | 13.184 | 6654.64 | 837.52 | 1289.26 | 14.25 |
| Rabi 2016–2017 | 5.55 | 4.0001 | 3406.078 | 794.25 | 369.024 | 2.95 |
| Total | 20.99 | 17.18 | 10,060.72 | 1631.78 | 1658.29 | 17.21 |
| Kharif 2017 | 14.52 | 16.54 | 8833.832 | 1657.58 | 1303.75 | 11.73 |
| Rabi 2017–2018 | 5.701 | 3.797 | 3817.016 | 705.63 | 568.061 | 4.16 |
| Total | 20.22 | 20.33 | 12,650.85 | 2363.22 | 1871.82 | 15.89 |
| Kharif 2018 | 14.0003 | 14.72 | 9364.251 | 1947.63 | 1720.99 | 11.19 |
| Rabi 2018–2019 | 7.264 | 5.229 | 6694.901 | 943.92 | 935.22 | 2.74 |
| Total | 21.264 | 19.94 | 16,059.15 | 2891.56 | 2656.21 | 13.94 |
| Kharif Season Total | 43.96 | 44.44 | 24,852.73 | 4442.74 | 4314.01 | 37.18 |
| Rabi Season Total | 18.51 | 13.02 | 13,917.99 | 2443.82 | 1872.31 | 9.86 |
| Grand Total | 62.48 | 57.47 | 38,770.72 | 6886.56 | 6186.32 | 47.05 |
Source: www.Indiastat.com (accessed on 10 April 2021).
Table A5.
State-wise performance of PMFBY—cumulative up to 2017–2018.
Table A5.
State-wise performance of PMFBY—cumulative up to 2017–2018.
| State/UTs | Farmers Insured (in lakh) | Farmers Premium (Rs. in Crore) | Total Subsidy (Rs. in Crore) | Claims Paid (Rs. in Crore) |
|---|---|---|---|---|
| Andhra Pradesh | 20.7091 | 281.76 | 885.72 | 536.534 |
| Andaman and Nicobar Islands | 0.00688 | 0.0094 | 0.0365 | 0.1456 |
| Assam | 0.65808 | 6.2342 | 8.0098 | 0.6778 |
| Bihar | 47.0876 | 361.3029 | 1842.03 | 717.776 |
| Chhattisgarh | 30.066 | 271.4406 | 403.9008 | 1527.52 |
| Goa | 0.00143 | 0.0127 | 0.0018 | 0.0023 |
| Gujarat | 33.6725 | 552.5389 | 4463.706 | 2137.71 |
| Haryana | 26.8961 | 405.0081 | 411.8253 | 1159.84 |
| Himachal Pradesh | 4.91405 | 9.2454 | 19.1834 | 17.1659 |
| Jammu and Kashmir | 1.52143 | 8.9994 | 31.9864 | 9.91 |
| Jharkhand | 20.7768 | 68.4096 | 420.7315 | 70.5186 |
| Karnataka | 42.125 | 423.46 | 2643.886 | 2397.31 |
| Kerala | 0.3411 | 5.7225 | 6.4396 | 7.2966 |
| Madhya Pradesh | 133.585 | 1404.101 | 6923.876 | 7148.05 |
| Maharashtra | 217.313 | 985.1494 | 6311.142 | 4604.39 |
| Manipur | 0.17475 | 1.4854 | 4.0484 | 2.4554 |
| Meghalaya | 0.03034 | 1.0222 | 0.4398 | 175.593 |
| Orissa | 33.9938 | 269.1787 | 988.2482 | 2152.13 |
| Puducherry | 0.08537 | 0.2249 | 2.65 | 7.5721 |
| Rajasthan | 175.701 | 825.2964 | 4129.576 | 3393.5 |
| Sikkim | 0.01238 | 0.0189 | 0.004 | 0.1077 |
| Tamil Nadu | 29.2009 | 250.7248 | 3891.902 | 4067.05 |
| Telangana | 17.3535 | 195.1286 | 832.257 | 307.026 |
| Tripura | 0.24434 | 0.8851 | 1.2718 | 1.6604 |
| Uttar Pradesh | 115.935 | 831.6563 | 1541.612 | 877.424 |
| Uttarakhand | 3.81318 | 16.1976 | 8.48 | 7.7216 |
| West Bengal | 81.908 | 493.5472 | 937.5828 | 638.662 |
| Grand Total | 1038.73 | 7668.53 | 36,707.89 | 31,953.3 |
Source: Agriculture Statistics at a Glance (2018).
Table A6.
State-wise performance of PMFBY—cumulative up to 2018–2019.
Table A6.
State-wise performance of PMFBY—cumulative up to 2018–2019.
| States/UTs | Farmers Insured (in lakh) | Farmers Premium (Rs. in Crore) | Total Subsidy (Rs. in Crore) | Claims Paid (Rs. in Crore) |
|---|---|---|---|---|
| Andhra Pradesh | 37.4 | 464.235 | 1383.254 | 1032.82 |
| Andaman and Nicobar Islands | 0.014 | 0.0606 | 0.2283 | 0.14 |
| Assam | 1.38 | 11.8254 | 14.422 | 1.48 |
| Bihar | 50.17 | 382.456 | 2061.116 | 747.88 |
| Chhattisgarh | 45.6 | 420.779 | 1089.644 | 2585.89 |
| Goa | 0.016 | 0.1488 | 0.0092 | 0.12 |
| Gujarat | 59.13 | 1044.2 | 7633.318 | 4940.87 |
| Haryana | 41.34 | 658.546 | 999.6125 | 2121.6 |
| Himachal Pradesh | 6.48 | 11.3462 | 25.5968 | 25.56 |
| Jammu and Kashmir | 3.12 | 25.8828 | 91.7728 | 16.71 |
| Jharkhand | 33.65 | 117.294 | 744.5136 | 91.14 |
| Karnataka | 64.43 | 577.895 | 3802.136 | 4817.37 |
| Kerala | 0.5 | 8.2568 | 9.662 | 16.91 |
| Madhya Pradesh | 203.89 | 2203.51 | 11454.35 | 7403.44 |
| Maharashtra | 362.33 | 1598.77 | 10,648.94 | 8929.84 |
| Manipur | 0.18 | 1.5899 | 4.1522 | 2.63 |
| Meghalaya | 0.037 | 1.119 | 0.449 | 0.043 |
| Orissa | 57.9 | 456.497 | 1980.793 | 3254.8 |
| Puducherry | 0.19 | 1.1257 | 4.8686 | 8.024 |
| Rajasthan | 247.65 | 1421.85 | 3899.246 | 6508.91 |
| Sikkim | 0.02 | 0.0947 | 0.004 | 0.143 |
| Tamil Nadu | 50.11 | 355.571 | 3559.038 | 7265.85 |
| Telangana | 24.36 | 291.73 | 580.2628 | 368.84 |
| Tripura | 0.24 | 0.9065 | 0.2558 | 1.7 |
| Uttar Pradesh | 188.22 | 1319.45 | 2759.386 | 1392.58 |
| Uttarakhand | 5.18 | 24.0373 | 14.7784 | 15.84 |
| West Bengal | 133.68 | 699.5 | 1374.949 | 861.43 |
| Grand Total | 1617.31 | 12,098.7 | 54,142.75 | 52,412.7 |
Source: Agriculture Statistics at a Glance (2019).
Notes
| 1 | Area approach means the defined area is at the village panchayat level for each notified crop for natural calamities. All the farmers under the notified area pay the same premium rate and receive the same claim amount. |
| 2 | The individual approach means individual crop loss is covered under the scheme. |
| 3 | Majority period means the period when the crop is ready for harvest. |
| 4 | Out of 26 states, 7 states showed increased numbers of farmers insured during 2017–2018 as compared to 2016–2017. These states were Andhra Pradesh, Karnataka, Maharashtra, Manipur, Orissa, Sikkim, and West Bengal. |
| 5 | Out of 26 states, 19 states showed decreased numbers of farmers insured during 2017–2018 as compared to 2016–2017. These states were Assam, Bihar, Chhattisgarh, Goa, Andaman Nicobar, Gujarat, Haryana, Himachal Pradesh, Jammu and Kashmir, Jharkhand, Kerala, Madhya Pradesh, Meghalaya, Telangana, Rajasthan, Tamil Nadu, Tripura, Uttar Pradesh, and Uttarakhand. |
| 6 | Out of 26 states, 8 states showed increases in the total area insured during 2017–2018 compared to 2016–2017. These states were Andhra Pradesh, Karnataka, Maharashtra, Manipur, Orissa, Sikkim, West Bengal, and Madhya Pradesh. |
| 7 | Out of 26 states, 18 states showed decreases in the total area insured during 2017–2018 as compared to 2016–2017. These states were Andaman Nicobar, Assam, Bihar, Chhattisgarh, Goa, Gujarat, Haryana, Himachal Pradesh, Jammu and Kashmir, Jharkhand, Kerala, Meghalaya, Rajasthan, Tamil Nadu, Tripura, Uttar Pradesh, Telangana, and Uttarakhand. |
| 8 | Claims paid increased in four states, i.e., Karnataka, Maharashtra, Orissa, and Uttar Pradesh. |
| 9 | The numbers of farmers that benefitted from PMFBY increased in only four states, i.e., Karnataka, Maharashtra, Orissa, and Chhattisgarh. |
| 10 | Actuarial premium rate is the projected value of a future loss. The estimate is performed on past losses; it is not wholly accurate. The actual premium rates are higher in Bihar, Gujarat, Rajasthan, and Maharashtra under PMFBY (Bhushan and Kumar 2017; Dey and Debasish 2017; Ghosh 2019). |
References
- Agriculture Insurance Company of India Ltd. 2021. Evolution of Crop Insurance. Available online: https://www.aicofindia.com (accessed on 15 February 2021).
- Agriculture Statistics at a Glance. 2017. Directorate of Economics and Statistics; New Delhi: Ministry of Agriculture and Farmers Welfare, Government of India.
- Agriculture Statistics at a Glance. 2018. Directorate of Economics and Statistics; New Delhi: Ministry of Agriculture and Farmers Welfare, Government of India.
- Agriculture Statistics at a Glance. 2019. Directorate of Economics and Statistics; New Delhi: Ministry of Agriculture and Farmers Welfare, Government of India.
- Bhushan, Chandra, and Vineet Kumar. 2017. Pradhan Mantri Fasal Bima Yojana: An Assessment. New Delhi: Centre for Science and Environment. [Google Scholar]
- Dandekar, Vinayak Mahadeo. 1985. Crop insurance in India: A review, 1976–1977 to 1984–1985. Economic and Political Weekly. pp. A46–A59. Available online: https://www.epw.in/journal/1985/25-26/review-agriculture-uncategorised/crop-insurance-india-review-1976-77-1984-85.html (accessed on 25 February 2021).
- Department of Financial Services. 2021. Restructured Weather Based Crop Insurance Scheme (2021). Available online: https://financialservices.gov.in/insurance-divisions/Government-Sponsored-Socially-Oriented-Insurance-Schemes/Restructured-Weather-Based-Crop-Insurance-Scheme-(RWBCIS) (accessed on 20 June 2021).
- Dey, Kushankur, and Maitra Debasish. 2017. Agriculture Insurance in India: Promise, Pitfalls, and the way forward. Economic and Political Weekly 52: 89–96. [Google Scholar]
- Ghosh, Ranjan Kumar. 2018. Performance Evaluation of Pradhan Mantri Fasal Bima Yojana (PMFBY): Part I: “Governance Analysis”. Ahmedabad: Indian Institute of Management Ahmedabad (IIMA). [Google Scholar]
- Ghosh, Sumit. 2019. An Analysis of Pradhan Mantri Fasal Bima Yojana: Expectations and Reality. International Journal of Advanced Science and Technology 28: 788–94. [Google Scholar]
- Global Hunger Index. 2020. India: Making Food a Right for All. Available online: https://www.globalhungerindex.org/case-studies/2016-india.html (accessed on 15 June 2021).
- Government of India. 2016. Pradhan Mantri Fasal Bima Yojana: Operational Guidelines; New Delhi: Department of Agriculture, Cooperation and Farmers’ Welfare, Ministry of Agriculture and Farmers Welfare, Government of India.
- Government of India. 2018. Pradhan Mantri Fasal Bima Yojana: Revamped Operational Guidelines; New Delhi: Department of Agriculture, Co-Operation and Farmers’ Welfare, Ministry of Agriculture and Farmers Welfare, Government of India.
- Government of India. 2020. Pradhan Mantri Fasal Bima Yojana: Revamped Operational Guidelines; New Delhi: Department of Agriculture, Cooperation and Farmers’ Welfare, Ministry of Agriculture and Farmers Welfare, Government of India.
- Gulati, Ashok, Prerna Terway, and Siraj Hussain. 2018. Crop Insurance in India: Key Issues and Way Forward. Available online: https://www.think-asia.org/handle/11540/8052 (accessed on 15 June 2021).
- Hussain, Siraj. 2020. What Can the Centre Learn from How States Are Managing Their Own Crop Insurance Schemes? July 31. Available online: https://thewire.in/agriculture/pm-fasal-bima-yojana-centre-states-crop-insurance (accessed on 15 July 2021).
- India Brand Equity Foundation (IBEF). 2021. Agriculture in India: Information about Indian Agriculture and Its Importance. Available online: https://www.ibef.org/industry/agriculture-india.aspx (accessed on 5 May 2021).
- IFPRI. 2021. International Food Policy Research Institute. Available online: https://www.ifpri.org/topic/food-security (accessed on 15 July 2021).
- Indian Council of Food and Agriculture. n.d. Crop Insurance. Available online: https://www.icfa.org.in/assets/doc/reports/crop-insurance-in-india.pdf (accessed on 22 February 2021).
- Jain, R. C. A. 2004. Challenges in Implementing Agriculture Insurance and Re-Insurance in Developing Countries. The Journal 2004: 14–23. Available online: https://www.insuranceinstituteofindia.com/downloads/Forms/III/Journal-2004-05-06/Cha%20pter6.pdf (accessed on 15 February 2021).
- Mahajan, Shrikrishna, and Amol Bobade. 2012. Growth of NAIS: A study of crop insurance in India. Bauddhik 3: 1–15. [Google Scholar]
- Mishra, Pramod K. 1994. Crop insurance and crop credit: Impact of the comprehensive crop insurance scheme on co-operative credit in Gujarat. Journal of International Development 6: 529–67. [Google Scholar] [CrossRef]
- Mukherjee, Subhankar, and Parthapratim Pal. 2017. Impediments to the spread of crop insurance in India. Economic and Political Weekly 52. [Google Scholar]
- Nair, Reshmy. 2010a. Weather-based Crop Insurance in India: Towards a sustainable crop Insurance Regime? Economic and Political Weekly 45: 73–81. [Google Scholar]
- Nair, Reshmy. 2010b. Crop Insurance in India: Changes and Challenges. Economic and Political Weekly 45: 19–22. [Google Scholar]
- Rai, Ruchbah. 2019. Pradhan Mantri Fasal Bima Yojana: An assessment of India’s crop insurance scheme. ORF Issue Brief 16: 296. [Google Scholar]
- Raju, S. S., and Ramesh Chand. 2008. Agricultural Insurance in India: Problems and Prospects; NCAP Working Paper 8. National Center for Agriculture Economics and Policy Research. Available online: https://www.farm-d.org/app/uploads/2012/09/oth_15.pdf (accessed on 10 February 2021).
- Tiwari, Rajesh, Khem Chand, and Bimal Anjum. 2020. Crop Insurance in India: A Review of Pradhan Mantri Fasal Bima Yojana (PMFBY). FIIB Business Review 9: 249–55. [Google Scholar] [CrossRef]
- Tripathi, S. L. 1987. Crop Insurance in India with special reference to Comprehensive Crop Insurance Scheme. In A Note Prepared for Induction Training Programme in Crop Insurance for Newly Recruited Assistant Administrative Officers of General Insurance Corporation of India. Pune: Vaikunth Mehata National Institute of Cooperative Management, pp. 9–28. [Google Scholar]
Publisher’s Note: MDPI stays neutral with regard to jurisdictional claims in published maps and institutional affiliations. |
© 2021 by the authors. Licensee MDPI, Basel, Switzerland. This article is an open access article distributed under the terms and conditions of the Creative Commons Attribution (CC BY) license (https://creativecommons.org/licenses/by/4.0/).