Article

Pricing with Variance Gamma Information

by
Lane P. Hughston
1,* and
Leandro Sánchez-Betancourt
2
1
Department of Computing, Goldsmiths University of London, New Cross, London SE14 6NW, UK
2
Mathematical Institute, University of Oxford, Oxford OX2 6GG, UK
*
Author to whom correspondence should be addressed.
Risks 2020, 8(4), 105; https://doi.org/10.3390/risks8040105
Submission received: 11 September 2020 / Revised: 30 September 2020 / Accepted: 30 September 2020 / Published: 10 October 2020
(This article belongs to the Special Issue Risks: Feature Papers 2020)

Abstract

:
In the information-based pricing framework of Brody, Hughston & Macrina, the market filtration { F t } t 0 is generated by an information process { ξ t } t 0 defined in such a way that at some fixed time T an F T -measurable random variable X T is “revealed”. A cash flow H T is taken to depend on the market factor X T , and one considers the valuation of a financial asset that delivers H T at time T. The value of the asset S t at any time t [ 0 , T ) is the discounted conditional expectation of H T with respect to F t , where the expectation is under the risk neutral measure and the interest rate is constant. Then S T = H T , and S t = 0 for t T . In the general situation one has a countable number of cash flows, and each cash flow can depend on a vector of market factors, each associated with an information process. In the present work we introduce a new process, which we call the normalized variance-gamma bridge. We show that the normalized variance-gamma bridge and the associated gamma bridge are jointly Markovian. From these processes, together with the specification of a market factor X T , we construct a so-called variance-gamma information process. The filtration is then taken to be generated by the information process together with the gamma bridge. We show that the resulting extended information process has the Markov property and hence can be used to develop pricing models for a variety of different financial assets, several examples of which are discussed in detail.

1. Introduction

The theory of information-based asset pricing proposed by Brody et al. (2007, 2008a, 2008b) and Macrina (2006) is concerned with the determination of the price processes of financial assets from first principles. In particular, the market filtration is constructed explicitly, rather than simply assumed, as it is in traditional approaches. The simplest version of the model is as follows. We fix a probability space Ω , F , P . An asset delivers a single random cash flow H T at some specified time T > 0 , where time 0 denotes the present. The cash flow is a function of a random variable X T , which we can think of as a “market factor” that is in some sense revealed at time T. In the general situation there will be many factors and many cash flows, but for the present we assume that there is a single factor X T : Ω R such that the sole cash flow at time T is given by H T = h ( X T ) for some Borel function h : R R + . For simplicity we assume that interest rates are constant and that P is the risk neutral measure. We require that H T should be integrable. Under these assumptions, the value of the asset at time 0 is
S 0 = e r T E h ( X T ) ,
where E denotes expectation under P and r is the short rate. Since the single “dividend” is paid at time T, the value of the asset at any time t 0 is of the form
S t = e r ( T t ) 𝟙 t < T E h ( X T ) | F t ,
where { F t } t 0 is the market filtration. The task now is to model the filtration, and this will be done explicitly.
In traditional financial modelling, the filtration is usually taken to be fixed in advance. For example, in the widely-applied Brownian-motion-driven model for financial markets, the filtration is generated by an n-dimensional Brownian motion. A detailed account of the Brownian framework can be found, for example, in Karatzas and Shreve (1998). In the information-based approach, however, we do not assume the filtration to be given a priori. Instead, the filtration is constructed in a way that specifically takes into account the structures of the information flows associated with the cash flows of the various assets under consideration.
In the case of a single asset generating a single cash flow, the idea is that the filtration should contain partial or “noisy” information about the market factor X T , and hence the impending cash flow, in such a way that X T is F T -measurable. This can be achieved by allowing { F t } to be generated by a so-called information process { ξ t } t 0 with the property that for each t such that t T the random variable ξ t is σ { X T } -measurable. Then by constructing specific examples of cádlàg processes having this property, we are able to formulate a variety of specific models. The resulting models are finely tuned to the structures of the assets that they represent, and therefore offer scope for a useful approach to financial risk management. In previous work on information-based asset pricing, where precise definitions can be found that expand upon the ideas summarized above, such models have been constructed using Brownian bridge information processes (Brody et al. (2007, 2008a, 2009, 2010, 2011), Filipović et al. (2012), Hughston and Macrina (2012), Macrina (2006), Mengütürk (2013), Rutkowski and Yu (2007)), gamma bridge information processes (Brody et al. (2008b)), Lévy random bridge information processes (Hoyle (2010), Hoyle et al. (2011, 2015, 2020), Mengütürk (2018)) and Markov bridge information processes (Macrina (2019)). In what follows we present a new model for the market filtration, based on the variance-gamma process. The idea is to create a two-parameter family of information processes associated with the random market factor X T . One of the parameters is the information flow-rate σ . The other is an intrinsic parameter m associated with the variance gamma process. In the limit as m tends to infinity, the variance-gamma information process reduces to the type of Brownian bridge information process considered by Brody et al. (2007, 2008a) and Macrina (2006).
The plan of the paper is as follows. In Section 2 we recall properties of the gamma process, introducing the so-called scale parameter κ > 0 and shape parameter m > 0 . A standard gamma subordinator is defined to be a gamma process with κ = 1 / m . The mean at time t of a standard gamma subordinator is t. In Theorem 1 we prove that an increase in the shape parameter m results in a transfer of weight from the Lévy measure of any interval [ c , d ] in the space of jump size to the Lévy measure of any interval [ a , b ] such that b a = d c and c > a . Thus, roughly speaking, an increase in m results in an increase in the rate at which small jumps occur relative to the rate at which large jumps occur. This result concerning the interpretation of the shape parameter for a standard gamma subordinator is new as far as we are aware.
In Section 3 we recall properties of the variance-gamma process and the gamma bridge, and in Definition 1 we introduce a new type of process, which we call a normalized variance-gamma bridge. This process plays an important role in the material that follows. In Lemmas 1 and 2 we work out various properties of the normalized variance-gamma bridge. Then in Theorem 2 we show that the normalized variance-gamma bridge and the associated gamma bridge are jointly Markov, a property that turns out to be crucial in our pricing theory. In Section 4, at Definition 2, we introduce the so-called variance-gamma information process. The information process carries noisy information about the value of a market factor X T that will be revealed to the market at time T, where the noise is represented by the normalized variance-gamma bridge. In Equation (58) we present a formula that relates the values of the information process at different times, and by use of that we establish in Theorem 3 that the information process and the associated gamma bridge are jointly Markov.
In Section 5, we consider a market where the filtration is generated by a variance gamma information process along with the associated gamma bridge. In Lemma 3 we work out a version of the Bayes formula in the form that we need for asset pricing in the present context. Then in Theorem 4 we present a general formula for the price process of a financial asset that at time T pays a single dividend given by a function h ( X T ) of the market factor. In particular, the a priori distribution of the market factor can be quite arbitrary, specified by a measure F X T ( d x ) on R , the only requirement being that h ( X T ) should be integrable. In Section 6 we present a number of examples, based on various choices of the payoff function and the distribution for the market factor, the results being summarized in Propositions 1–4. We conclude with comments on calibration, derivatives, and how one determines the trajectory of the information process from market prices.

2. Gamma Subordinators

We begin with some remarks about the gamma process. Let us as usual write R + for the non-negative real numbers. Let κ and m be strictly positive constants. A continuous random variable G : Ω R + on a probability space Ω , F , P will be said to have a gamma distribution with scale parameter κ and shape parameter m if
P G d x = 𝟙 x > 0 1 Γ [ m ] κ m x m 1 e x / κ d x ,
where
Γ [ a ] = 0 x a 1 e x d x
denotes the standard gamma function for a > 0 , and we recall the relation Γ [ a + 1 ] = a Γ [ a ] . A calculation shows that E G = κ m , and Var [ G ] = κ 2 m . There exists a two-parameter family of gamma processes of the form Γ : Ω × R + R + on Ω , F , P . By a gamma process with scale κ and shape m we mean a Lévy process { Γ t } t 0 such that for each t > 0 the random variable Γ t is gamma distributed with
P Γ t d x = 𝟙 x > 0 1 Γ [ m t ] κ m t x m t 1 e x / κ d x .
If we write ( a ) 0 = 1 and ( a ) k = a ( a + 1 ) ( a + 2 ) ( a + k 1 ) for the so-called Pochhammer symbol, we find that E [ Γ t n ] = κ n ( m t ) n . It follows that E [ Γ t ] = μ t and Var [ Γ t ] = ν 2 t , where μ = κ m and ν 2 = κ 2 m , or equivalently m = μ 2 / ν 2 , and κ = ν 2 / μ .
The Lévy exponent for such a process is given for α < 1 by
ψ Γ ( α ) = 1 t log E exp ( α Γ t ) = m log 1 κ α ,
and for the corresponding Lévy measure we have
ν Γ ( d x ) = 𝟙 x > 0 m 1 x e x / κ d x .
One can then check that the Lévy-Khinchine relation
ψ Γ ( α ) = R e α x 1 𝟙 | x | < 1 α x ν Γ ( d x ) + p α
holds for an appropriate choice of p (Kyprianou 2014, Lemma 1.7).
By a standard gamma subordinator we mean a gamma process { γ t } t 0 for which κ = 1 / m . This implies that E [ γ t ] = t and Var [ γ t ] = m 1 t . The standard gamma subordinators thus constitute a one-parameter family of processes labelled by m. An interpretation of the parameter m is given by the following:
Theorem 1.
Let { γ t } t 0 be a standard gamma subordinator with parameter m. Let ν m [ a , b ] be the Lévy measure of the interval [ a , b ] for 0 < a < b . Then for any interval [ c , d ] such that c > a and d c = b a the ratio
R m ( a , b ; c , d ) = ν m [ a , b ] ν m [ c , d ]
is strictly greater than one and strictly increasing as a function of m.
Proof. 
By the definition of a standard gamma subordinator we have
ν m [ a , b ] = a b m 1 x e m x d x .
Let δ = c a > 0 and note that the integrand in the right hand side of (10) is a decreasing function of the variable of integration. This allows one to conclude that
ν m [ a + δ , b + δ ] = a + δ b + δ m 1 x e m x d x < a b m 1 x e m x d x ,
from which it follows that 0 < ν m [ c , d ] < ν m [ a , b ] and hence R m ( a , b ; c , d ) > 1 . To show that R m ( a , b ; c , d ) is strictly increasing as a function of m we observe that
ν m [ a , b ] = m a 1 x e m x d x m b 1 x e m x d x = m E 1 [ m a ] E 1 [ m b ] ,
where the so-called exponential integral function E 1 ( z ) is defined for z > 0 by
E 1 ( z ) = z e x x d x .
See Abramowitz and Stegun (1972), Section 5.1.1, for properties of the exponential integral. Next, we compute the derivative of R m ( a , b ; c , d ) , which gives
m R m ( a , b ; c , d ) = 1 m E 1 [ m c ] E 1 [ m d ] e m a 1 e m Δ R m ( a , b ; c , d ) e m ( c a ) ,
where
Δ = d c = b a .
We note that
1 m E 1 [ m c ] E 1 [ m d ] e m a 1 e m Δ > 0 ,
which shows that the sign of the derivative in (14) is strictly positive if and only if
R m ( a , b ; c , d ) > e m ( c a ) .
But clearly
0 Δ m e u u + a m d u > 0 Δ m e u u + c m d u
for c > a , which after a change of integration variables and use of (15) implies
e m a a m b m e x x d x > e m c c m d m e x x d x ,
which is equivalent to (17), and that completes the proof. □
We see therefore that the effect of an increase in the value of m is to transfer weight from the Lévy measure of any jump-size interval [ c , d ] R + to any possibly-overlapping smaller-jump-size interval [ a , b ] R + of the same length. The Lévy measure of such an interval is the rate of arrival of jumps for which the jump size lies in that interval.

3. Normalized Variance-Gamma Bridge

Let us fix a standard Brownian motion { W t } t 0 on Ω , F , P and an independent standard gamma subordinator { γ t } t 0 with parameter m. By a standard variance-gamma process with parameter m we mean a time-changed Brownian motion { V t } t 0 of the form
V t = W γ t .
It is straightforward to check that { V t } is itself a Lévy process, with Lévy exponent
ψ V ( α ) = m log 1 α 2 2 m .
Properties of the variance-gamma process, and financial models based on it, have been investigated extensively in Madan (1990), Madan and Milne (1991), Madan et al. (1998), Carr et al. (2002) and many other works.
The other object we require going forward is the gamma bridge (Brody et al. (2008b), Emery and Yor (2004), Yor (2007)). Let { γ t } be a standard gamma subordinator with parameter m. For fixed T > 0 the process { γ t T } t 0 defined by
γ t T = γ t γ T
for 0 t T and γ t T = 1 for t > T will be called a standard gamma bridge, with parameter m, over the interval [ 0 , T ] . One can check that for 0 < t < T the random variable γ t T has a beta distribution (Brody et al. 2008b, pp. 6–9). In particular, one finds that its density is given by
P γ t T d y = 𝟙 { 0 < y < 1 } y m t 1 ( 1 y ) m ( T t ) 1 B [ m t , m ( T t ) ] d y ,
where
B [ a , b ] = Γ [ a ] Γ [ b ] Γ [ a + b ] .
It follows then by use of the integral formula
B [ a , b ] = 0 1 y a 1 ( 1 y ) b 1 d y
that for all n N we have
E γ t T n = B [ m t + n , m ( T t ) ] B [ m t , m ( T t ) ] ,
and hence
E γ t T n = ( m t ) n ( m T ) n .
Accordingly, one has
E [ γ t T ] = t / T , E [ γ t T 2 ] = t ( m t + 1 ) / T ( m T + 1 )
and therefore
Var [ γ t T ] = t ( T t ) T 2 ( 1 + m T ) .
One observes, in particular, that the expectation of γ t T does not depend on m, whereas the variance of γ t T decreases as m increases.
Definition 1.
For fixed T > 0 , the process Γ t T t 0 defined by
Γ t T = γ T 1 2 W γ t γ t T W γ T
for 0 t T and Γ t T = 0 for t > T will be called a normalized variance gamma bridge.
We proceed to work out various properties of this process. We observe that Γ t T is conditionally Gaussian, from which it follows that E Γ t T γ t , γ T = 0 and E Γ t T 2 γ t , γ T = γ t T 1 γ t T . Therefore E [ Γ t T ] = 0 and E [ Γ t T 2 ] = E [ γ t T ] E [ γ t T 2 ] ; and thus by use of (28) we have
Var [ Γ t T ] = m t ( T t ) T ( 1 + m T ) .
Now, recall (Yor (2007), Emery and Yor (2004)) that the gamma process and the associated gamma bridge have the following fundamental independence property. Define
G t * = σ γ s / γ t , s [ 0 , t ] , G t + = σ γ u , u [ t , ) .
Then, for every t 0 it holds that G t * and G t + are independent. In particular γ s t and γ u are independent for 0 s t u and t > 0 . It also holds that γ s t and γ u v are independent for 0 s t u v and t > 0 . Furthermore, we have:
Lemma 1.
If 0 s t u and t > 0 then Γ s t and γ u are independent.
Proof. 
We recall that if a random variable X is normally distributed with mean μ and variance ν 2 then
P X < x = N x μ ν ,
where N : R ( 0 , 1 ) is defined by
N ( x ) = 1 2 π x exp 1 2 y 2 d y .
Since Γ t T is conditionally Gaussian, by use of the tower property we find that
F Γ s t , γ u ( x , y ) = E 𝟙 { Γ s t x } 𝟙 { γ u y } = E E 𝟙 { Γ s t x } 𝟙 { γ u y } | γ s , γ t , γ u = E 𝟙 { γ u y } E 𝟙 { Γ s t x } | γ s , γ t , γ u = E 𝟙 { γ u y } N x γ s t 1 γ s t 1 2 = E 𝟙 { γ u y } E N x γ s t 1 γ s t 1 2 ,
where the last line follows from the independence of γ s t and γ u . □
By a straightforward extension of the argument we deduce that if 0 s t u v and t > 0 then Γ s t and γ u v are independent. Further, we have:
Lemma 2.
If 0 s t u v and t > 0 then Γ s t and Γ u v are independent.
Proof. 
We recall that the Brownian bridge { β t T } 0 t T defined by
β t T = W t t T W T
for 0 t T and β t T = 0 for t > T is Gaussian with E β t T = 0 , Var β t T = t ( T t ) / T , and Cov β s T , β t T = s ( T t ) / T for 0 s t T . Using the tower property we find that
F Γ s t , Γ u v ( x , y ) = E 𝟙 { Γ s t x } 𝟙 { Γ u v y } = E E 𝟙 { Γ s t x } 𝟙 { Γ u v y } | γ s , γ t , γ u , γ v = E E 𝟙 { Γ s t x } | γ s , γ t , γ u , γ v E 𝟙 { Γ u v y } | γ s , γ t , γ u , γ v = E N x 1 γ s t γ s t 1 2 E N y 1 γ u v γ u v 1 2 ,
where in the final step we use (30) along with properties of the Brownian bridge. □
A straightforward calculation shows that if 0 s t u and t > 0 then
Γ s u = γ t u 1 2 Γ s t + γ s t Γ t u .
With this result at hand we obtain the following:
Theorem 2.
The processes { Γ t T } 0 t T and { γ t T } 0 t T are jointly Markov.
Proof. 
To establish the Markov property it suffices to show that for any bounded measurable function ϕ : R × R R , any n N , and any 0 t n t n 1 t 1 t T , we have
E ϕ ( Γ t T , γ t T ) | Γ t 1 T , γ t 1 T , Γ t 2 T , γ t 2 T , , Γ t n T , γ t n T = E ϕ ( Γ t T , γ t T ) | Γ t 1 T , γ t 1 T .
We present the proof for n = 2 . Thus we need to show that
E ϕ ( Γ t T , γ t T ) | Γ t 1 T , γ t 1 T , Γ t 2 T , γ t 2 T = E ϕ ( Γ t T , γ t T ) | Γ t 1 T , γ t 1 T .
As a consequence of (38) we have
E ϕ ( Γ t T , γ t T ) | Γ t 1 T , γ t 1 T , Γ t 2 T , γ t 2 T = E ϕ ( Γ t T , γ t T ) | Γ t 1 T , γ t 1 T , Γ t 2 t 1 , γ t 2 t 1 .
Therefore, it suffices to show that
E ϕ ( Γ t T , γ t T ) | Γ t 1 T , γ t 1 T , Γ t 2 t 1 , γ t 2 t 1 = E ϕ ( Γ t T , γ t T ) | Γ t 1 T , γ t 1 T .
Let us write
f Γ t T , γ t T , Γ t 1 T , γ t 1 T , Γ t 2 t 1 , γ t 2 t 1 ( x , y , a , b , c , d )
for the joint density of Γ t T , γ t T , Γ t 1 T , γ t 1 T , Γ t 2 t 1 , γ t 2 t 1 . Then for the conditional density of Γ t T and γ t T given Γ t 1 T = a , γ t 1 T = b , Γ t 2 t 1 = c , γ t 2 t 1 = d we have
g Γ t T , γ t T ( x , y , a , b , c , d ) = f Γ t T , γ t T , Γ t 1 T , γ t 1 T , Γ t 2 t 1 , γ t 2 t 1 ( x , y , a , b , c , d ) f Γ t 1 T , γ t 1 T , Γ t 2 t 1 , γ t 2 t 1 ( a , b , c , d ) .
Thus,
E ϕ ( Γ t T , γ t T ) | Γ t 1 T , γ t 1 T , Γ t 2 t 1 , γ t 2 t 1 = R R ϕ ( x , y ) g Γ t T , γ t T ( x , y , Γ t 1 T , γ t 1 T , Γ t 2 t 1 , γ t 2 t 1 ) d x d y .
Similarly,
E ϕ ( Γ t T , γ t T ) | Γ t 1 T , γ t 1 T = R R ϕ ( x , y ) g Γ t T , γ t T ( x , y , Γ t 1 T , γ t 1 T ) d x d y ,
where for the conditional density of Γ t T and γ t T given Γ t 1 T = a , γ t 1 T = b we have
g Γ t T , γ t T ( x , y , a , b ) = f Γ t T , γ t T , Γ t 1 T , γ t 1 T ( x , y , a , b ) f Γ t 1 T , γ t 1 T ( a , b ) .
Note that the conditional probability densities that we introduce in formulae such as those above are “regular” conditional densities (Williams 1991, p. 91). We shall show that
g Γ t T , γ t T ( x , y , Γ t 1 T , γ t 1 T , Γ t 2 t 1 , γ t 2 t 1 ) = g Γ t T , γ t T ( x , y , Γ t 1 T , γ t 1 T ) .
Writing
F Γ t T , γ t T , Γ t 1 T , γ t 1 T , Γ t 2 t 1 , γ t 2 t 1 ( x , y , a , b , c , d ) = E 𝟙 Γ t T < x 𝟙 γ t T < y 𝟙 Γ t 1 T < a 𝟙 γ t 1 T < b 𝟙 Γ t 2 t 1 < c 𝟙 γ t 2 t 1 < d
for the joint distribution function, we see that
F Γ t T , γ t T , Γ t 1 T , γ t 1 T , Γ t 2 t 1 , γ t 2 t 1 ( x , y , a , b , c , d ) = E 𝟙 Γ t T < x 𝟙 γ t T < y 𝟙 Γ t 1 T < a 𝟙 γ t 1 T < b 𝟙 Γ t 2 t 1 < c 𝟙 γ t 2 t 1 < d = E E 𝟙 Γ t T < x 𝟙 γ t T < y 𝟙 Γ t 1 T < a 𝟙 γ t 1 T < b 𝟙 Γ t 2 t 1 < c 𝟙 γ t 2 t 1 < d | γ t 2 , γ t 1 , γ t , γ T = E 𝟙 γ t T < y 𝟙 γ t 1 T < b 𝟙 γ t 2 t 1 < d E 𝟙 Γ t T < x 𝟙 Γ t 1 T < a 𝟙 Γ t 2 t 1 < c | γ t 2 , γ t 1 , γ t , γ T = E [ E 𝟙 Γ t T < x 𝟙 γ t T < y 𝟙 Γ t 1 T < a 𝟙 γ t 1 T < b | γ t 1 , γ t , γ T × N c 1 γ t 2 t 1 γ t 2 t 1 𝟙 γ t 2 t 1 < d ] ,
where the last step follows as a consequence of Lemma 2. Thus we have
F Γ t T , γ t T , Γ t 1 T , γ t 1 T , Γ t 2 t 1 , γ t 2 t 1 ( x , y , a , b , c , d ) = E 𝟙 Γ t T < x 𝟙 γ t T < y 𝟙 Γ t 1 T < a 𝟙 γ t 1 T < b N c 1 γ t 2 t 1 γ t 2 t 1 𝟙 γ t 2 t 1 < d = E 𝟙 Γ t T < x 𝟙 γ t T < y 𝟙 Γ t 1 T < a 𝟙 γ t 1 T < b E N c 1 γ t 2 t 1 γ t 2 t 1 𝟙 γ t 2 t 1 < d = F Γ t T , γ t T , Γ t 1 T , γ t 1 T ( x , y , a , b ) × F Γ t 2 t 1 , γ t 2 t 1 ( c , d ) ,
where the next to last step follows by virtue of the fact that Γ s t and γ u v are independent for 0 s t u v and t > 0 . Similarly,
F Γ t 1 T , γ t 1 T , Γ t 2 t 1 , γ t 2 t 1 ( a , b , c , d ) = E 𝟙 Γ t 1 T < a 𝟙 γ t 1 T < b 𝟙 Γ t 2 t 1 < c 𝟙 γ t 2 t 1 < d = E E 𝟙 Γ t 1 T < a 𝟙 γ t 1 T < b 𝟙 Γ t 2 t 1 < c 𝟙 γ t 2 t 1 < d | γ t 2 , γ t 1 , γ T = E 𝟙 γ t 1 T < b 𝟙 γ t 2 t 1 < d E 𝟙 Γ t 1 T < a 𝟙 Γ t 2 t 1 < c | γ t 2 , γ t 1 , γ T ,
and hence
F Γ t 1 T , γ t 1 T , Γ t 2 t 1 , γ t 2 t 1 ( a , b , c , d ) = E N a 1 γ t 1 T γ t 1 T 𝟙 γ t 1 T < b N c 1 γ t 2 t 1 γ t 2 t 1 𝟙 γ t 2 t 1 < d = E N a 1 γ t 1 T γ t 1 T 𝟙 γ t 1 T < b E N c 1 γ t 2 t 1 γ t 2 t 1 𝟙 γ t 2 t 1 < d = F Γ t 1 T , γ t 1 T ( a , b ) × F Γ t 2 t 1 , γ t 2 t 1 ( c , d ) .
Thus we deduce that
f Γ t T , γ t T , Γ t 1 T , γ t 1 T , Γ t 2 t 1 , γ t 2 t 1 ( x , y , a , b , c , d )
= f Γ t T , γ t T , Γ t 1 T , γ t 1 T ( x , y , a , b ) × f Γ t 2 t 1 , γ t 2 t 1 ( c , d ) ,
and
f Γ t 1 T , γ t 1 T , Γ t 2 t 1 , γ t 2 t 1 ( a , b , c , d ) = f Γ t 1 T , γ t 1 T ( a , b ) × f Γ t 2 t 1 , γ t 2 t 1 ( c , d ) ,
and the theorem follows. □

4. Variance Gamma Information

Fix T > 0 and let { Γ t T } be a normalized variance gamma bridge, as defined by (30). Let { γ t T } be the associated gamma bridge defined by (22). Let X T be a random variable and assume that X T , { γ t } t 0 and { W t } t 0 are independent. We are led to the following:
Definition 2.
By a variance-gamma information process carrying the market factor X T we mean a process { ξ t } t 0 that takes the form
ξ t = Γ t T + σ γ t T X T
for 0 t T and ξ t = σ X T for t > T , where σ is a positive constant.
The market filtration is assumed to be the standard augmented filtration generated jointly by { ξ t } and { γ t T } . A calculation shows that if 0 s t T and t > 0 then
ξ s = Γ s t γ t T 1 2 + ξ t γ s t .
We are thus led to the following result required for the valuation of assets.
Theorem 3.
The processes { ξ t } 0 t T and { γ t T } 0 t T are jointly Markov.
Proof. 
It suffices to show that for any n N and 0 < t 1 < t 2 < < t n we have
E ϕ ( ξ t , γ t T ) | ξ t 1 , ξ t 2 , , ξ t n , γ t 1 T , γ t 2 T , , γ t n T = E ϕ ( ξ t , γ t T ) | ξ t 1 , γ t 1 T .
We present the proof for n = 2 . Thus, we propose to show that
E ϕ ( ξ t , γ t T ) | ξ t 1 , ξ t 2 , γ t 1 T , γ t 2 T = E ϕ ( ξ t , γ t T ) | ξ t 1 , γ t 1 T .
By (58), we have
E ϕ ( ξ t , γ t T ) | ξ t 1 , ξ t 2 , γ t 1 T , γ t 2 , T = E ϕ ( ξ t , γ t T ) | ξ t 1 , ξ t 2 , γ t 1 T , γ t 2 t 1 = E ϕ ( ξ t , γ t T ) | ξ t 1 , Γ t 2 t 1 , γ t 1 T , γ t 2 t 1 = E ϕ ( Γ t T + γ t T σ X T , γ t T ) | Γ t 1 T + γ t 1 T σ X T , Γ t 2 t 1 , γ t 1 T , γ t 2 t 1 .
Finally, we invoke Lemma 2, and Theorem 2 to conclude that
E ϕ ( ξ t , γ t T ) | ξ t 1 , ξ t 2 , γ t 1 T , γ t 2 , T = E ϕ ( Γ t T + γ t T σ X T , γ t T ) | Γ t 1 T + γ t 1 T σ X T , γ t 1 T = E ϕ ( ξ t , γ t T ) | ξ t 1 , γ t 1 T .
The generalization to n > 2 is straightforward. □

5. Information Based Pricing

Now we are in a position to consider the valuation of a financial asset in the setting just discussed. One recalls that P is understood to be the risk-neutral measure and that the interest rate is constant. The payoff of the asset at time T is taken to be an integrable random variable of the form h ( X T ) for some Borel function h, where X T is the information revealed at T. The filtration is generated jointly by the variance-gamma information process { ξ t } and the associated gamma bridge { γ t T } . The value of the asset at time t [ 0 , T ) is then given by the general expression (2), which on account of Theorem 3 reduces in the present context to
S t = e r ( T t ) E h ( X T ) | ξ t , γ t T ,
and our goal is to work out this expectation explicitly.
Let us write F X T for the a priori distribution function of X T . Thus F X T : x R F X T ( x ) [ 0 , 1 ] and we have
F X T ( x ) = P X T x .
Occasionally, it will be typographically convenient to write F X T ( x ) in place of F X T ( x ) , and similarly for other distribution functions. To proceed, we require the following:
Lemma 3.
Let X be a random variable with distribution { F X ( x ) } x R and let Y be a continuous random variable with distribution { F Y ( y ) } y R and density { f Y ( y ) } y R . Then for all y R for which f Y ( y ) 0 we have
F X | Y = y ( x ) = u ( , x ] f Y | X = u ( y ) d F X ( u ) u ( , ) f Y | X = u ( y ) d F X ( u ) ,
where F X | Y = y ( x ) denotes the conditional distribution P X x Y = y , and where
f Y | X = u ( y ) = d d y P Y y X = u .
Proof. 
For any two random variables X and Y it holds that
P X x , Y y = E 𝟙 { X x } 𝟙 { Y y } = E E 𝟙 { X x } | Y 𝟙 { Y y } = E F X | Y ( x ) 𝟙 { Y y } .
Here we have used the fact that for each x R there exists a Borel measurable function P x : y R P x ( y ) [ 0 , 1 ] such that E 𝟙 { X x } | Y = P x ( Y ) . Then for y R we define
F X | Y = y ( x ) = P x ( y ) .
Hence
P X x , Y y = v ( , y ] F X | Y = v ( x ) d F Y ( v ) .
By symmetry, we have
P X x , Y y = u ( , x ] F Y | X = u ( y ) d F X ( u ) ,
from which it follows that we have the relation
u ( , x ] F Y | X = u ( y ) d F X ( u ) = v ( , y ] F X | Y = v ( x ) d F Y ( v ) .
Moving ahead, let us consider the measure F X | Y = y ( d x ) on ( R , B ) defined for each y R by setting
F X | Y = y ( A ) = E 𝟙 { X A } | Y = y
for any A B . Then F X | Y = y ( d x ) is absolutely continuous with respect to F X ( d x ) . Indeed, suppose that F X ( B ) = 0 for some B B . Now, F X | Y = y ( B ) = E 𝟙 { X B } | Y = y . But if E 𝟙 { X B } = 0 , then E E 𝟙 { X B } | Y = 0 , and hence E 𝟙 { X B } | Y = 0 , and therefore E 𝟙 { X B } | Y = y = 0 . Thus F X | Y = y ( B ) vanishes for any B B for which F X ( B ) vanishes. It follows by the Radon-Nikodym theorem that for each y R there exists a density { g y ( x ) } x R such that
F X | Y = y ( x ) = u ( , x ] g y ( u ) d F X ( u ) .
Note that { g y ( x ) } is determined uniquely apart from its values on F X -null sets. Inserting (73) into (71) we obtain
u ( , x ] F Y | X = u ( y ) d F X ( u ) = v ( , y ] u ( , x ] g v ( u ) d F X ( u ) d F Y ( v ) ,
and thus by Fubini’s theorem we have
u ( , x ] F Y | X = u ( y ) d F X ( u ) = u ( , x ] v ( , y ] g v ( u ) d F Y ( v ) d F X ( u ) .
It follows then that { F Y | X = x ( y ) } x R is determined uniquely apart from its values on F X -null sets, and we have
F Y | X = x ( y ) = v ( , y ] g v ( x ) d F Y ( v ) .
This relation holds quite generally and is symmetrical between X and Y. Indeed, we have not so far assumed that Y is a continuous random variable. If Y is, in fact, a continuous random variable, then its distribution function is absolutely continuous and admits a density { f Y ( y ) } y R . In that case, (76) can be written in the form
F Y | X = x ( y ) = v ( , y ] g v ( x ) f Y ( v ) d v ,
from which it follows that for each value of x the conditional distribution function { F Y | X = x ( y ) } y R is absolutely continuous and admits a density { f Y | X = x ( y ) } y R such that
f Y | X = x ( y ) = g y ( x ) f Y ( y ) .
The desired result (65) then follows from (73) and (78) if we observe that
f Y ( y ) = u ( , ) f Y | X = u ( y ) d F X ( u ) ,
and that concludes the proof. □
Armed with Lemma 3, we are in a position to work out the conditional expectation that leads to the asset price, and we obtain the following:
Theorem 4.
The variance-gamma information-based price of a financial asset with payoff h ( X T ) at time T is given for t < T by
S t = e r ( T t ) x R h ( x ) e σ ξ t x 1 2 σ 2 x 2 γ t T 1 γ t T 1 y R e σ ξ t y 1 2 σ 2 y 2 γ t T 1 γ t T 1 d F X T ( y ) d F X T ( x ) .
Proof. 
To calculate the conditional expectation of h ( X T ) , we observe that
E h ( X T ) | ξ t , γ t T = E E h ( X T ) | ξ t , γ t T , γ T | ξ t , γ t T ,
by the tower property, where the inner expectation takes the form
E h ( X T ) | ξ t = ξ , γ t T = b , γ T = g = x R h ( x ) d F X T | ξ t = ξ , γ t T = b , γ T = g ( x ) .
Here by Lemma 3 the conditional distribution function is
F X T | ξ t = ξ , γ t T = b , γ T = g ( x ) = u ( , x ] f ξ t | X T = u , γ t T = b , γ T = g ( ξ ) d F X T | γ t T = b , γ T = g ( u ) u R f ξ t | X T = u , γ t T = b , γ T = g ( ξ ) d F X T | γ t T = b , γ T = g ( u ) = u ( , x ] f ξ t | X T = u , γ t T = b , γ T = g ( ξ ) d F X T ( u ) u R f ξ t | X T = u , γ t T = b , γ T = g ( ξ ) d F X T ( u ) = u ( , x ] e σ ξ u 1 2 σ 2 u 2 b 1 b 1 d F X T ( u ) R e σ ξ u 1 2 σ 2 u 2 b 1 b 1 d F X T ( u ) .
Therefore, the inner expectation in Equation (81) is given by
E h ( X T ) | ξ t , γ t T , γ T = x R h ( x ) e σ ξ t x 1 2 σ 2 x 2 γ t T 1 γ t T 1 y R e σ ξ t y 1 2 σ 2 y 2 γ t T 1 γ t T 1 d F X T ( y ) d F X T ( x ) .
But the right hand side of (84) depends only on ξ t and γ t T . It follows immediately that
E h ( X T ) | ξ t , γ t T = x R h ( x ) e σ ξ t x 1 2 σ 2 x 2 γ t T 1 γ t T 1 y R e σ ξ t y 1 2 σ 2 y 2 γ t T 1 γ t T 1 d F X T ( y ) d F X T ( x ) ,
which translates into Equation (80), and that concludes the proof. □

6. Examples

Going forward, we present some examples of variance-gamma information pricing for specific choices of (a) the payoff function h : R R + and (b) the distribution of the market factor X T 
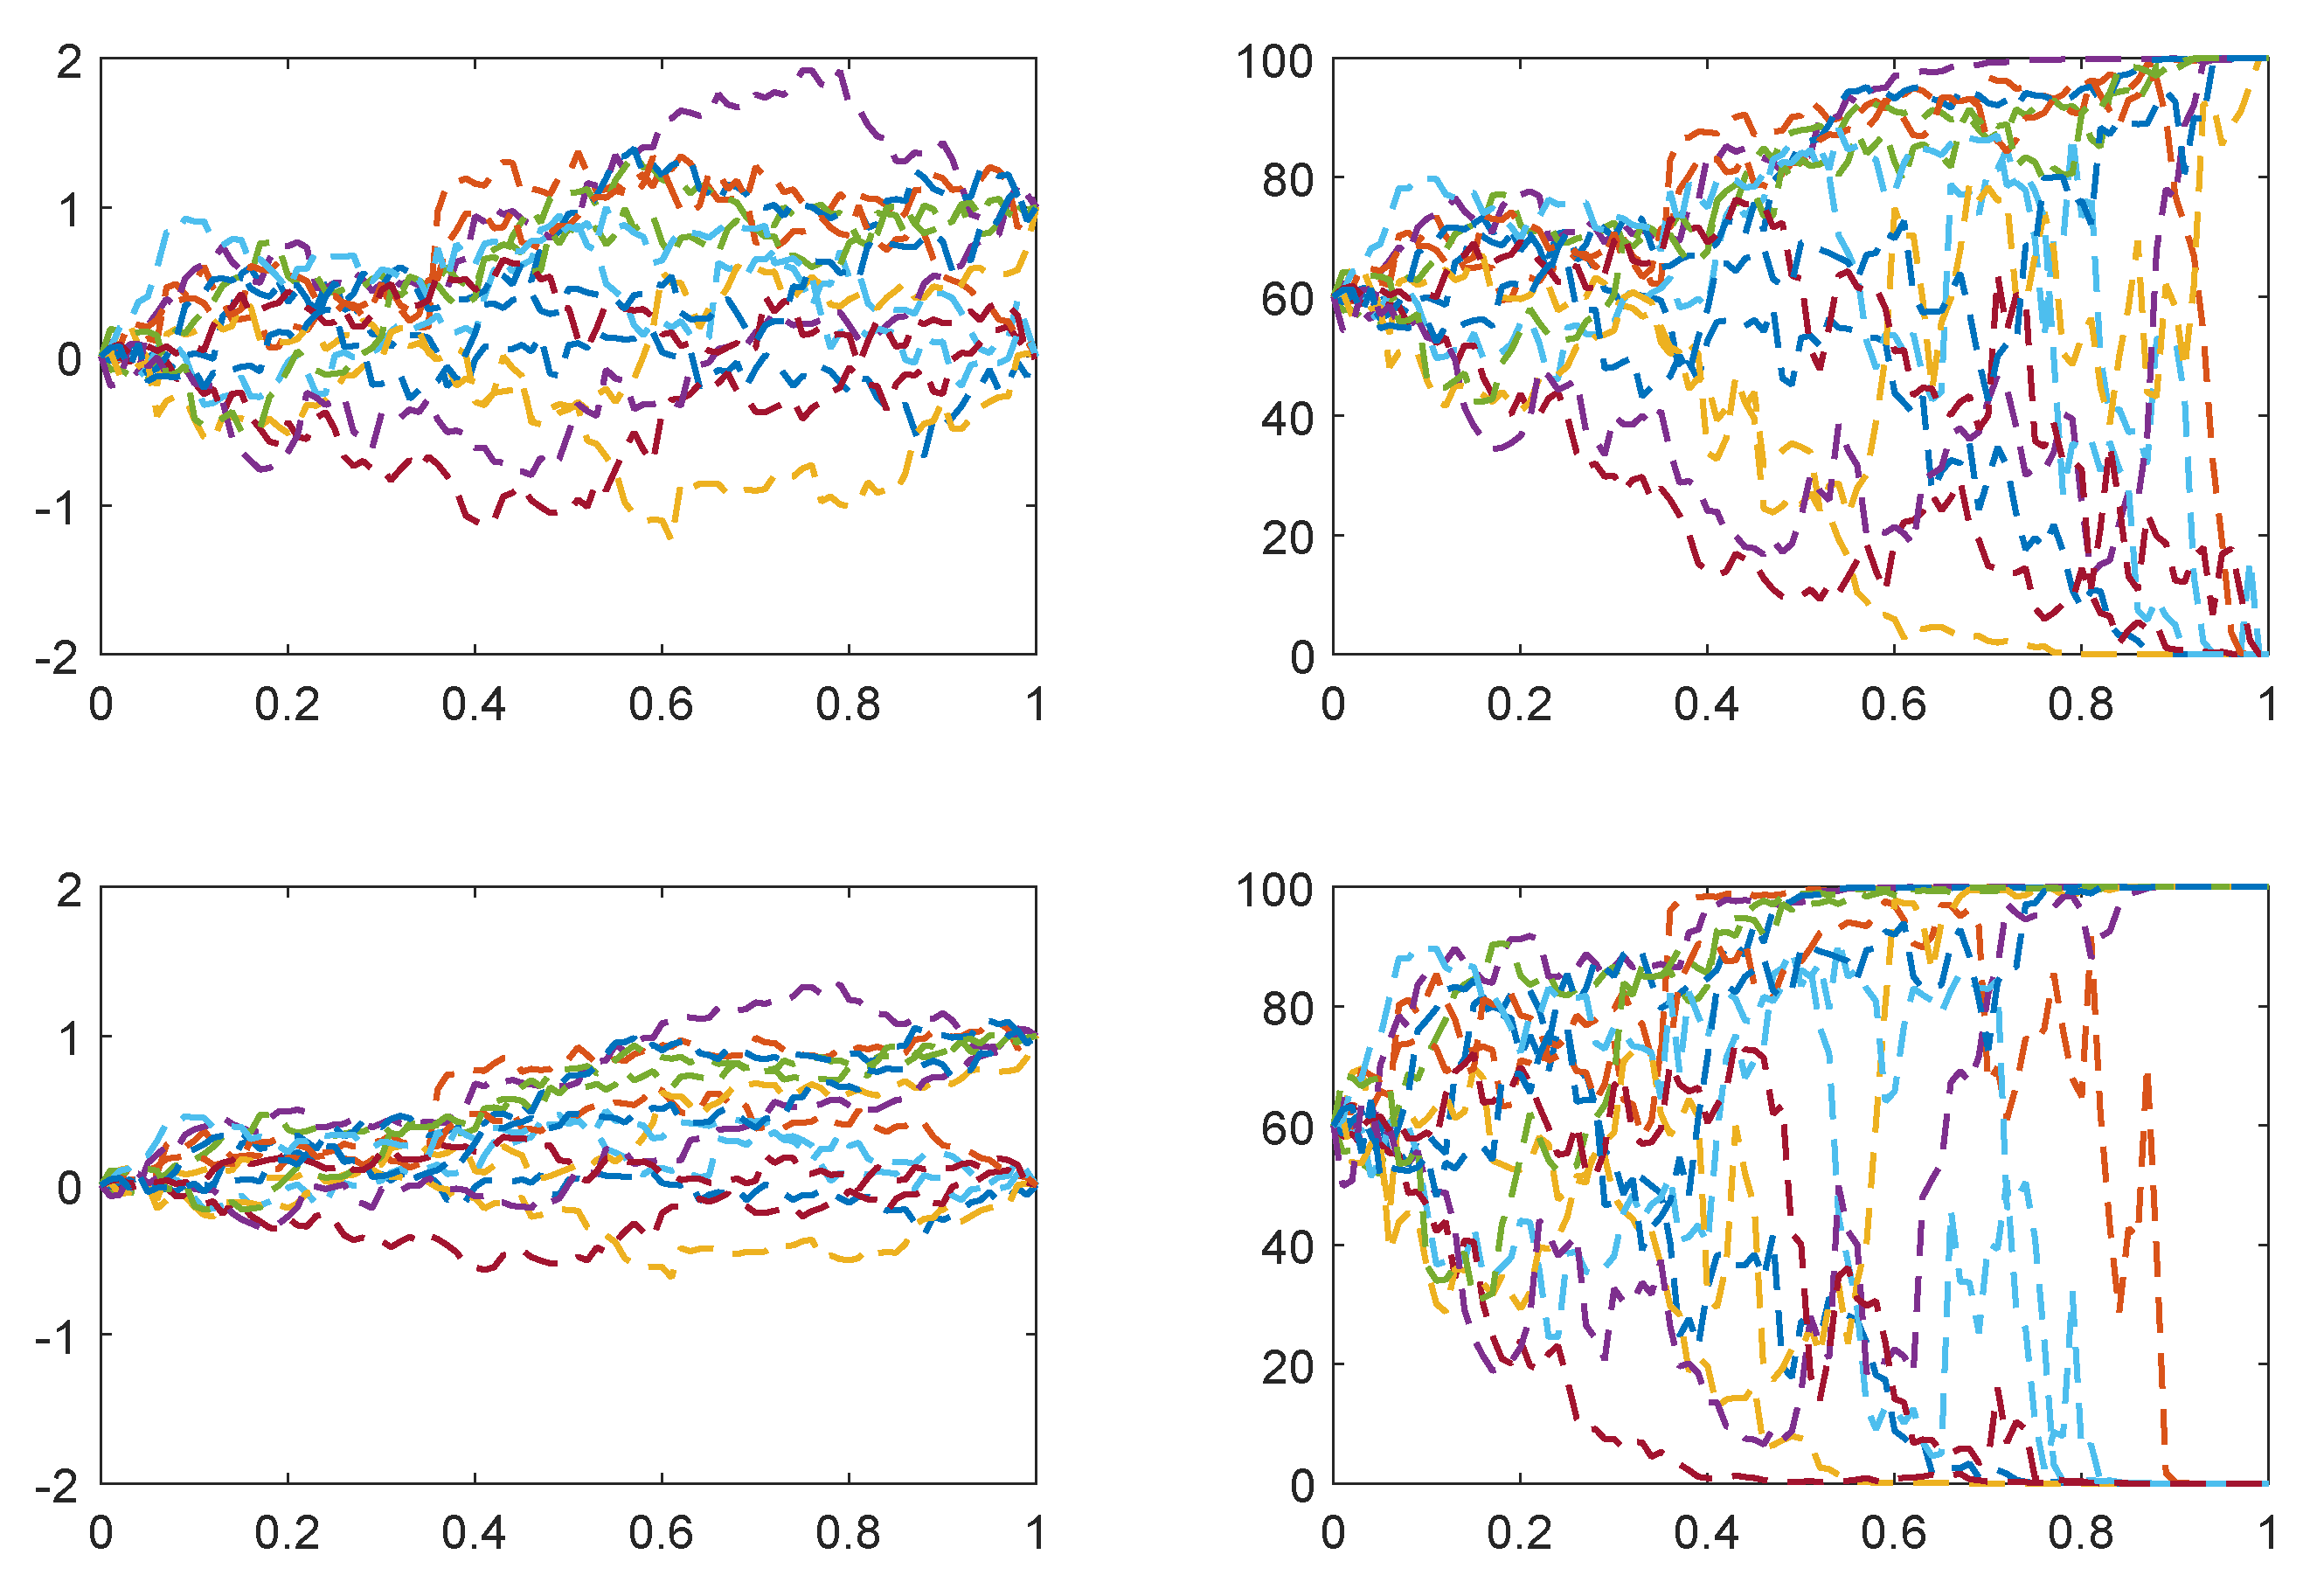
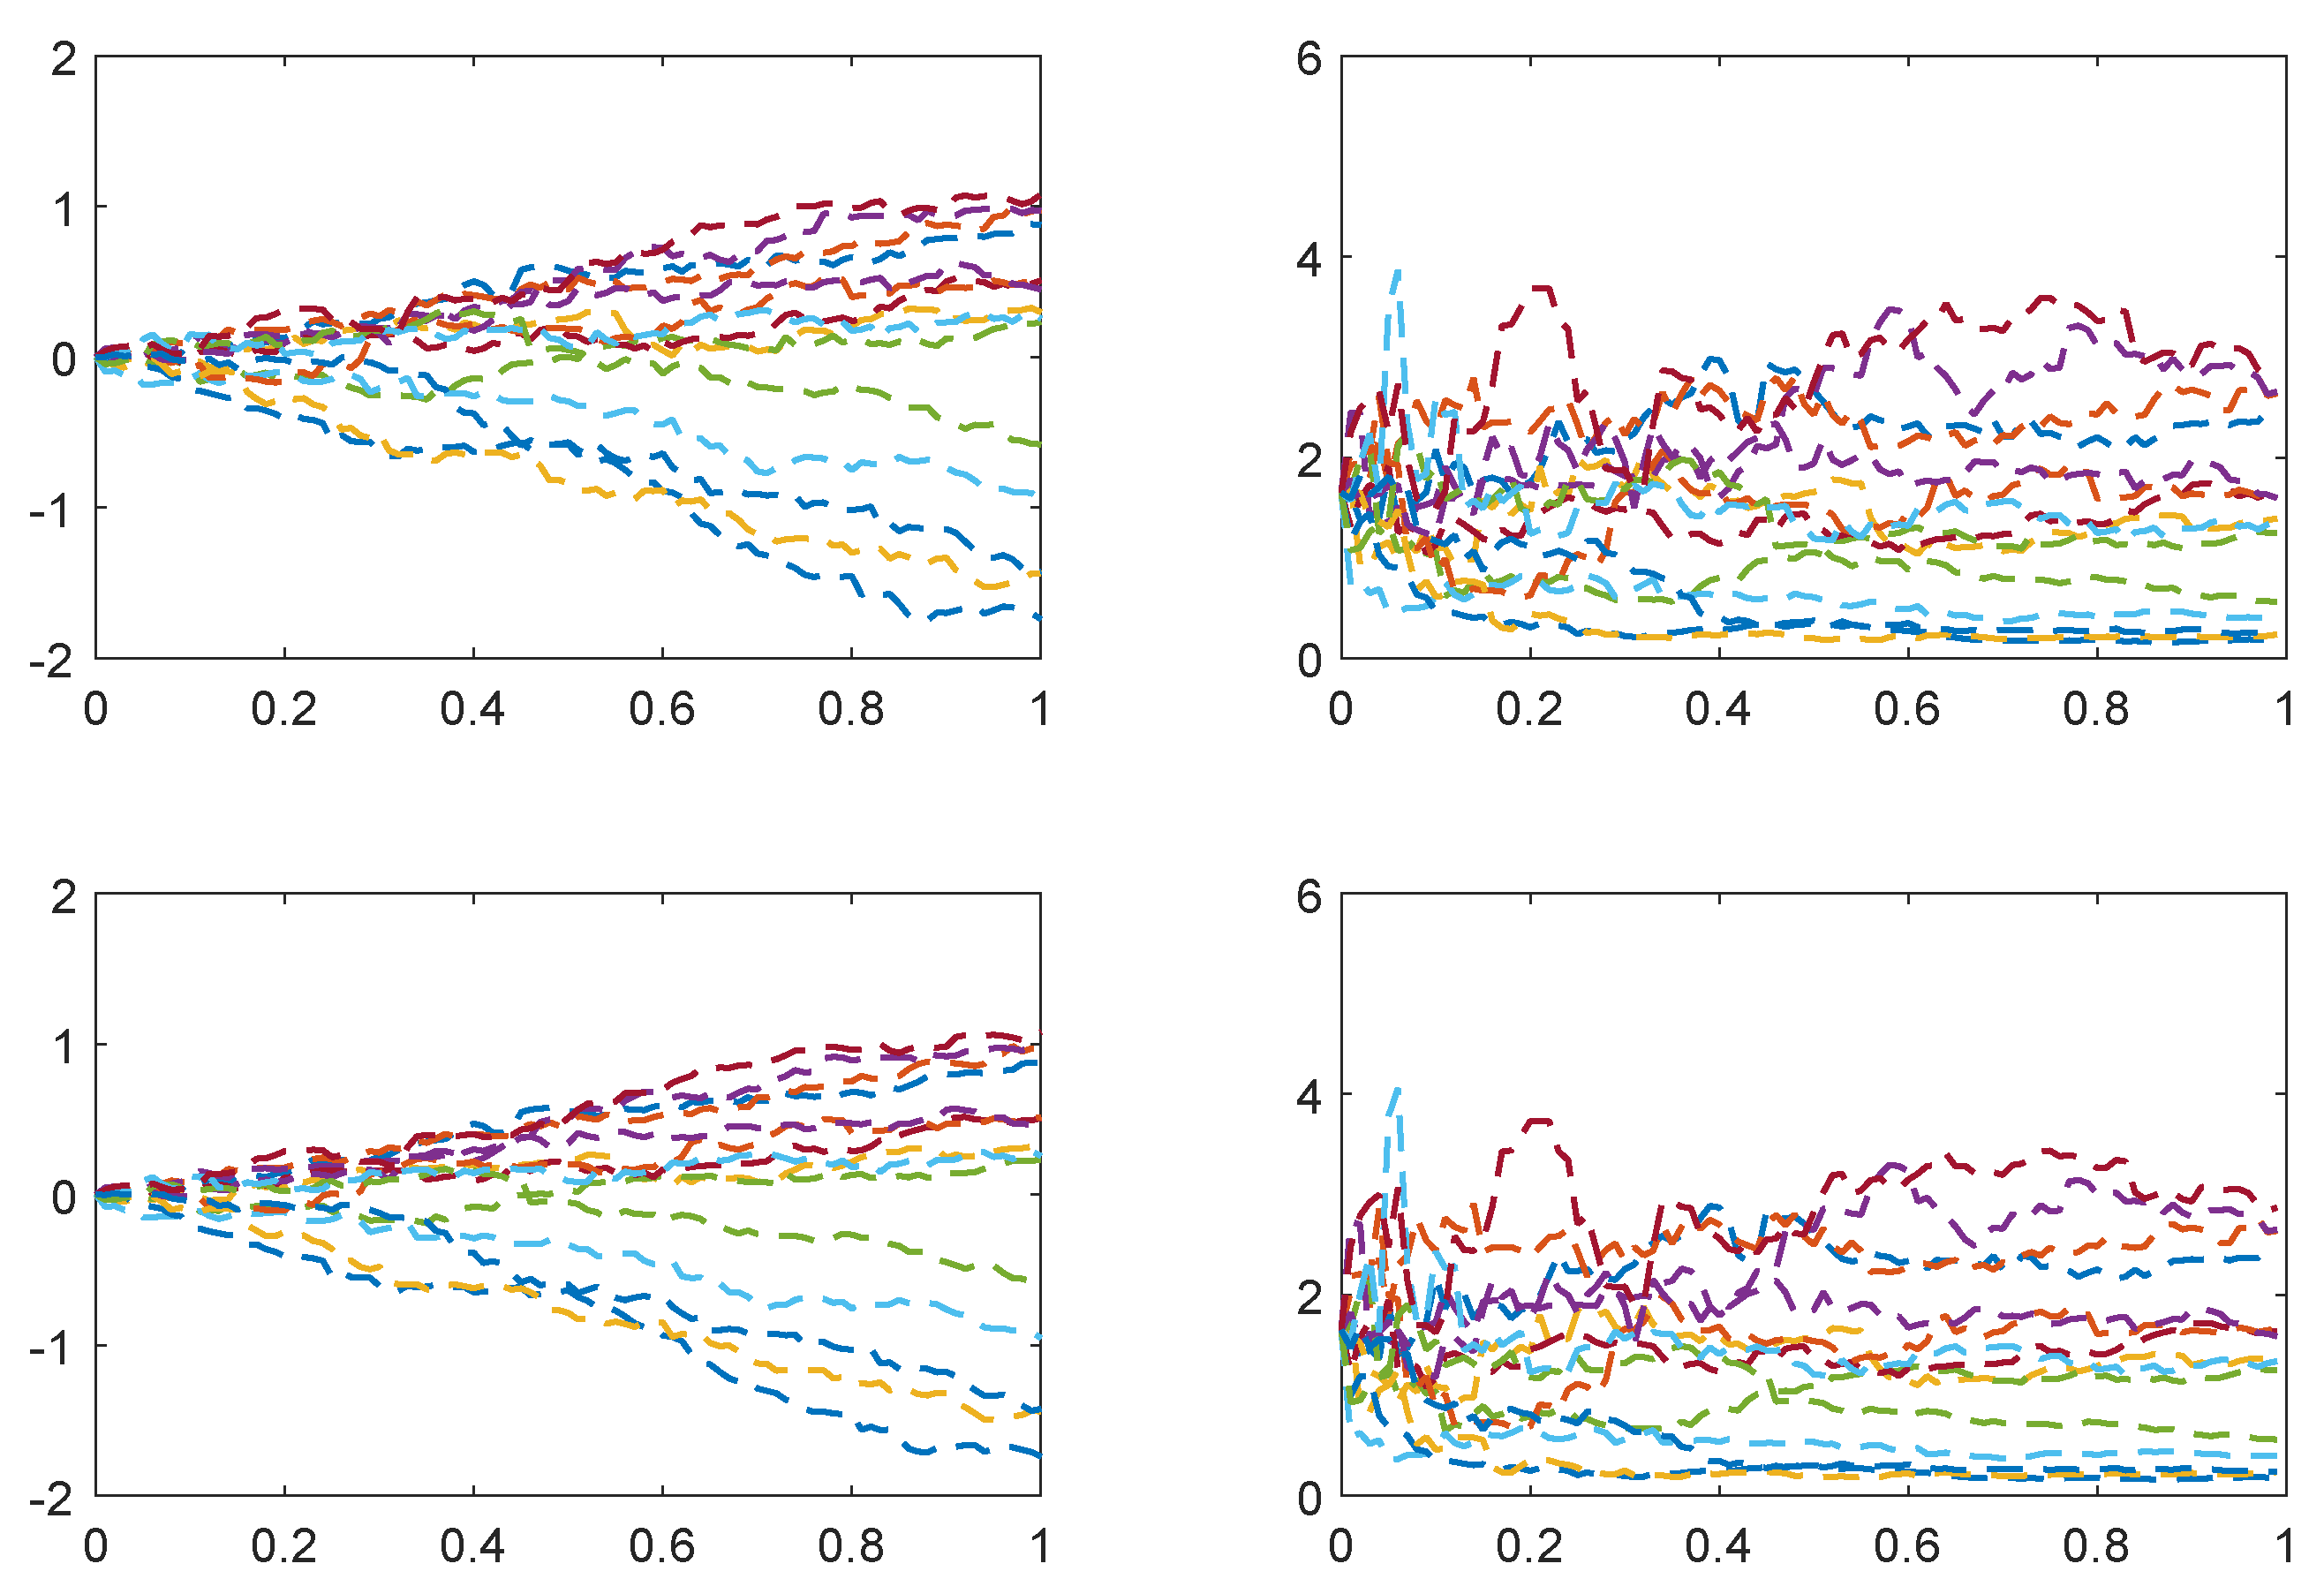
. In the figures, we display sample paths for the information processes and the corresponding prices. These paths are generated as follows. First, we simulate outcomes for the market factor X T . Second, we simulate paths for the gamma process { γ t } t 0 over the interval [ 0 , T ] and an independent Brownian motion { W t } t 0 . Third, we evaluate the variance gamma process { W γ t } t 0 over the interval [ 0 , T ] by subordinating the Brownian motion with the gamma process, and we evaluate the resulting gamma bridge { γ t T } 0 t T . Fourth, we use these ingredients to construct sample paths of the information processes, where these processes are given as in Definition 2. Finally, we evaluate the pricing formula in Equation (80) for each of the simulated paths and for each time step.
Example 1: Credit risky bond. We begin with the simplest case, that of a unit-principal credit-risky bond without recovery. We set h ( x ) = x , with P ( X T = 0 ) = p 0 and P ( X T = 1 ) = p 1 , where p 0 + p 1 = 1 . Thus, we have
F X T ( x ) = p 0 δ 0 ( x ) + p 1 δ 1 ( x ) ,
where
δ a ( x ) = y ( , x ] δ a ( d y ) ,
and δ a ( d x ) denotes the Dirac measure concentrated at the point a, and we are led to the following:
Proposition 1.
The variance-gamma information-based price of a unit-principal credit-risky discount bond with no recovery is given by
S t = e r ( T t ) p 1 e σ ξ t 1 2 σ 2 γ t T 1 γ t T 1 p 0 + p 1 e σ ξ t 1 2 σ 2 γ t T 1 γ t T 1 .
Now let ω Ω denote the outcome of chance. By use of Equation (57) one can check rather directly that if X T ( ω ) = 1, then lim t T S t = 1 , whereas if X T ( ω ) = 0, then lim t T S t = 0 . More explicitly, we find that
S t | X T ( w ) = 0 = e r ( T t ) p 1 exp σ γ T 1 / 2 W γ t γ t T W γ T 1 2 σ γ t T ( 1 γ t T ) 1 p 0 + p 1 exp σ γ T 1 / 2 W γ t γ t T W γ T 1 2 σ γ t T ( 1 γ t T ) 1 ,
whereas
S t | X T ( w ) = 1 = e r ( T t ) p 1 exp σ γ T 1 / 2 W γ t γ t T W γ T + 1 2 σ γ t T ( 1 γ t T ) 1 p 0 + p 1 exp σ γ T 1 / 2 W γ t γ t T W γ T + 1 2 σ γ t T ( 1 γ t T ) 1 ,
and the claimed limiting behaviour of the asset price follows by inspection. In Figure 1 and Figure 2 we plot sample paths for the information processes and price processes of credit risky bonds for various values of the information flow-rate parameter. One observes that for σ = 1 the information processes diverge, thus distinguishing those bonds that default from those that do not, only towards the end of the relevant time frame; whereas for higher values of σ the divergence occurs progressively earlier, and one sees a corresponding effect in the price processes. Thus, when the information flow rate is higher, the final outcome of the bond payment is anticipated earlier, and with greater certainty. Similar conclusions hold for the interpretation of Figure 3 and Figure 4.
Example 2: Random recovery. As a somewhat more sophisticated version of the previous example, we consider the case of a defaultable bond with random recovery. We shall work out the case where h ( x ) = x and the market factor X T takes the value c with probability p 1 and X T is uniformly distributed over the interval [ a , b ] with probability p 0 , where 0 a < b c . Thus, for the probability measure of X T we have
F X T ( d x ) = p 0 𝟙 { a x < b } d x + p 1 δ c ( d x ) ,
and for the distribution function we obtain
F X T ( x ) = p 0 x 𝟙 { a x < b } + 𝟙 { x c } .
The bond price at time t is then obtained by working out the expression
S t = e r ( T t ) p 0 a b x e σ ξ t x 1 2 σ 2 x 2 γ t T 1 γ t T 1 d x + p 1 c e σ ξ t 1 2 σ 2 γ t T 1 γ t T 1 p 0 a b e σ ξ t x 1 2 σ 2 x 2 γ t T 1 γ t T 1 d x + p 1 e σ ξ t 1 2 σ 2 γ t T 1 γ t T 1 ,
and it should be evident that one can obtain a closed-form solution. To work this out in detail, it will be convenient to have an expression for the incomplete first moment of a normally-distributed random variable with mean μ and variance ν 2 . Thus we set
N 1 ( x , μ , ν ) = 1 2 π ν 2 x y exp 1 2 ( y μ ) 2 ν 2 d y ,
and for convenience we set
N 0 ( x , μ , ν ) = 1 2 π ν 2 x exp 1 2 ( y μ ) 2 ν 2 d y .
Then we have
N 1 ( x , μ , ν ) = μ N x μ ν ν 2 π exp 1 2 ( x μ ) 2 ν 2 ,
and of course
N 0 ( x , μ , ν ) = N x μ ν ,
where N ( · ) is defined by (34). We also set
f ( x , μ , ν ) = 1 2 π ν 2 exp 1 2 ( x μ ) 2 ν 2 .
Finally, we obtain the following:
Proposition 2.
The variance-gamma information-based price of a defaultable discount bond with a uniformly-distributed fraction of the principal paid on recovery is given by
S t = e r ( T t ) p 0 N 1 ( b , μ , ν ) N 1 ( a , μ , ν ) + p 1 c f ( c , μ , ν ) p 0 N 0 ( b , μ , ν ) N 0 ( a , μ , ν ) + p 1 f ( c , μ , ν ) ,
where
μ = 1 σ ξ t γ t T , ν = 1 σ 1 γ t T γ t T .
Example 3: Lognormal payoff. Next we consider the case when the payoff of an asset at time T is log-normally distributed. This will hold if h ( x ) = e x and X T Normal ( μ , ν 2 ) . It will be convenient to look at the slightly more general payoff obtained by setting h ( x ) = e q x with q R . If we recall the identity
1 2 π exp 1 2 A x 2 + B x d x = 1 A exp 1 2 B 2 A ,
which holds for A > 0 and B R , a calculation gives
I t ( q ) : = e q x 1 2 π ν exp 1 2 ( x μ ) 2 ν 2 + 1 1 γ t T σ ξ t x 1 2 σ 2 x 2 γ t T d x = 1 ν A t exp 1 2 B t 2 A t C ,
where
A t = 1 γ t T + ν 2 σ 2 γ t T ν 2 ( 1 γ t T ) , B t = q + μ ν 2 + σ ξ t 1 γ t T , C = 1 2 μ 2 ν 2 .
For q = 1 , the price is thus given in accordance with Theorem 4 by
S t = e r ( T t ) I t ( 1 ) I t ( 0 ) .
Then clearly we have
S 0 = e r T exp μ + 1 2 ν 2 ,
and a calculation leads to the following:
Proposition 3.
The variance-gamma information-based price of a financial asset with a log-normally distributed payoff such that log S T Normal ( μ , ν 2 ) is given for t ( 0 , T ) by
S t = e r t S 0 exp ν 2 σ 2 γ t T ( 1 γ t T ) 1 1 + ν 2 σ 2 γ t T ( 1 γ t T ) 1 1 σ γ t T ξ t μ 1 2 ν 2 .
More generally, one can consider the case of a so-called power-payoff derivative for which
H T = S T q ,
where S T = lim t T S t is the payoff of the asset priced above in Proposition 3. See Bouzianis and Hughston (2019) for aspects of the theory of power-payoff derivatives. In the present case if we write
C t = e r ( T t ) E t S T q
for the value of the power-payoff derivative at time t, we find that
C t = e r t C 0 exp ν 2 σ 2 γ t T ( 1 γ t T ) 1 1 + ν 2 σ 2 γ t T ( 1 γ t T ) 1 q σ γ t T ξ t q μ 1 2 q 2 ν 2 ,
where
C 0 = e r T exp q μ + 1 2 q 2 ν 2 .
Example 4: Exponentially distributed payoff. Next we consider the case where the payoff is exponentially distributed. We let X T exp ( λ ) , so P X T d x = λ e λ x d x , and take h ( x ) = x . A calculation shows that
0 x exp λ x + σ ξ t x 1 2 σ 2 x 2 γ t T 1 γ t T 1 d x = μ N 1 ( 0 , μ , ν ) f ( 0 , μ , ν ) ,
where we set
μ = 1 σ ξ t γ t T λ σ 2 1 γ t T γ t T , ν = 1 σ 1 γ t T γ t T ,
and
0 exp λ x + σ ξ t x 1 2 σ 2 x 2 γ t T 1 γ t T 1 d x = 1 N 0 ( 0 , μ , ν ) f ( 0 , μ , ν ) .
As a consequence we obtain:
Proposition 4.
The variance-gamma information-based price of a financial asset with an exponentially distributed payoff is given by
S t = μ N 1 ( 0 , μ , ν ) 1 N 0 ( 0 , μ , ν ) ,
where N 0 and N 1 are defined as in Example 2.

7. Conclusions

In the examples considered in the previous section, we have looked at the situation where there is a single market factor X T , which is revealed at time T, and where the single cash flow occurring at T depends on the outcome for X T . The value of a security S t with that cash flow is determined by the information available at time t. Given the Markov property of the extended information process { ξ t , γ t T } it follows that there exists a function of three variables F : R × [ 0 , 1 ] × R + R + such that S t = F ( ξ t , γ t T , t ) , and we have worked out this expression explicitly for a number of different cases, given in Examples 1–4. The general valuation formula is presented in Theorem 4.
It should be evident that once we have specified the functional dependence of the resulting asset prices on the extended information process, then we can back out values of the information process and the gamma bridge from the price data. So in that sense the process { ξ t , γ t T } is “visible” in the market, and can be inferred directly, at any time, from a suitable collection of prices. This means, in particular, that given the prices of a certain minimal collection of assets in the market, we can then work out the values of other assets in the market, such as derivatives. In the special case we have just been discussing, there is only a single market factor; but one can see at once that the ideas involved readily extend to the situation where there are multiple market factors and multiple cash flows, as one expects for general securities analysis, following the principles laid out in Brody et al. (2007, 2008a), where the merits and limitations of modelling in an information-based framework are discussed in some detail.
The potential advantages of working with the variance-gamma information process, rather than the highly tractable but more limited Brownian information process should be evident—these include the additional parametric freedom in the model, with more flexibility in the distributions of returns, but equally important, the scope for jumps. It comes as a pleasant surprise that the resulting formulae are to a large extent analytically explicit, but this is on account of the remarkable properties of the normalized variance-gamma bridge process that we have exploited in our constructions. Keep in mind that in the limit as the parameter m goes to infinity our model reduces to that of the Brownian bridge information-based model considered in Brody et al. (2007, 2008a), which in turn contains the standard geometric Brownian motion model (and hence the Black-Scholes option pricing model) as a special case. In the case of a single market factor X T , the distribution of the random variable X T can be inferred by observing the current prices of derivatives for which the payoff is of the form
H T = e r T 𝟙 X T K ,
for K R . The information flow-rate parameter σ and the shape parameter m can then be inferred from option prices. When multiple factors are involved, similar calibration methodologies are applicable.

Author Contributions

The authors have made equal contributions to the work. Both authors have read and agreed to the published version of the manuscript.

Funding

This research has received no external funding.

Acknowledgments

The authors wish to thank G. Bouzianis and J. M. Pedraza-Ramírez for useful discussions. LSB acknowledges support from (a) Oriel College, Oxford, (b) the Mathematical Institute, Oxford, (c) Consejo Nacional de Ciencia y Tenconología (CONACyT), Ciudad de México, and (d) LMAX Exchange, London. We are grateful to the anonymous referees for a number of helpful comments and suggestions.

Conflicts of Interest

The authors declare no conflict of interest.

References

  1. Abramowitz, Milton, and Irene A. Stegun, eds. 1972. Handbook of Mathematical Functions with Formulas, Graphs, and Mathematical Tables. United State Department of Commerce, National Bureau of Standards, Applied Mathematics Series 55; Washington: National Bureau of Standards. [Google Scholar]
  2. Bouzianis, George, and Lane P. Hughston. 2019. Determination of the Lévy Exponent in Asset Pricing Models. International Journal of Theoretical and Applied Finance 22: 1950008. [Google Scholar] [CrossRef]
  3. Brody, Dorje C., Lane P. Hughston, and Andrea Macrina. 2007. Beyond Hazard Rates: A New Framework for Credit-Risk Modelling. In Advances in Mathematical Finance. Edited by Michael C. Fu, Robert A. Jarrow, Ju-Yi J. Yen and Robert J. Elliot. Basel: Birkhäuser. [Google Scholar]
  4. Brody, Dorje C., Lane P. Hughston, and Andrea Macrina. 2008a. Information-Based Asset Pricing. International Journal of Theoretical and Applied Finance 11: 107–42. [Google Scholar] [CrossRef] [Green Version]
  5. Brody, Dorje C., Lane P. Hughston, and Andrea Macrina. 2008b. Dam Rain and Cumulative Gain. Proceeding of the Royal Society A 464: 1801–22. [Google Scholar] [CrossRef]
  6. Brody, Dorje C., Mark H. A. Davis, Robyn L. Friedman, and Lane P. Hughston. 2009. Informed Traders. Proceedings of the Royal Society A 465: 1103–22. [Google Scholar] [CrossRef] [Green Version]
  7. Brody, Dorje C., Lane P. Hughston, and Andrea Macrina. 2010. Credit Risk, Market Sentiment and Randomly-Timed Default. In Stochastic Analysis in 2010. Edited by Dan Crisan. Berlin: Springer-Verlag. [Google Scholar]
  8. Brody, Dorje C., Lane P. Hughston, and Andrea Macrina. 2011. Modelling Information Flows in Financial Markets. In Advanced Mathematical Methods for Finance. Edited by Giulia Di Nunno and Bernt Øksendal. Berlin: Springer-Verlag. [Google Scholar]
  9. Carr, Peter, Hélyette Geman, Dilip B. Madan, and Marc Yor. 2002. The Fine Structure of Asset Returns: An Empirical Investigation. Journal of Business 75: 305–32. [Google Scholar] [CrossRef] [Green Version]
  10. Émery, Michel, and Marc Yor. 2004. A Parallel between Brownian Bridges and Gamma Bridges. Publications of the Research Institute for Mathematical Sciences, Kyoto University 40: 669–88. [Google Scholar] [CrossRef] [Green Version]
  11. Filipović, Damir, Lane P. Hughston, and Andrea Macrina. 2012. Conditional Density Models for Asset Pricing. International Journal of Theoretical and Applied Finance 15: 1250002. [Google Scholar] [CrossRef]
  12. Hoyle, Edward. 2010. Information-Based Models for Finance and Insurance. Ph.D. Thesis, Imperial College, London, UK. [Google Scholar]
  13. Hoyle, Edward, Lane P. Hughston, and Andrea Macrina. 2011. Lévy Random Bridges and the Modelling of Financial Information. Stochastic Processes and their Applications 121: 856–84. [Google Scholar] [CrossRef] [Green Version]
  14. Hoyle, Edward, Lane P. Hughston, and Andrea Macrina. 2015. Stable-1/2 Bridges and Insurance. In Advances in Mathematics of Finance. Edited by Andrzej Palczewski and Lukasz Stettner. Warsaw: Polish Academy of Sciences. [Google Scholar]
  15. Hoyle, Edward, Andrea Macrina, and Levent A. Mengütürk. 2020. Modulated Information Flows in Financial Markets. International Journal of Theoretical and Applied Finance 23: 2050026. [Google Scholar] [CrossRef]
  16. Hughston, Lane P., and Andrea Macrina. 2012. Pricing Fixed-Income Securities in an Information-Based Framework. Applied Mathematical Finance 19: 361–79. [Google Scholar] [CrossRef] [Green Version]
  17. Karatzas, Ioannis, and Steven E. Shreve. 1998. Methods of Mathematical Finance. New York: Springer-Verlag. [Google Scholar]
  18. Kyprianou, Andreas E. 2014. Fluctuations of Lévy Processes with Applications, 2nd ed. Berlin: Springer-Verlag. [Google Scholar]
  19. Macrina, Andrea. 2006. An Information-based Framework for Asset Pricing: X-factor Theory and its Applications. Ph.D. Thesis, King’s College, London, UK. [Google Scholar]
  20. Macrina, Andrea, and Jun Sekine. 2019. Stochastic Modelling with Randomized Markov Bridges. Stochastics 19: 1–27. [Google Scholar] [CrossRef] [Green Version]
  21. Madan, Dilip, and Eugene Seneta. 1990. The Variance Gamma (VG) Model for Share Market Returns. Journal of Business 63: 511–24. [Google Scholar] [CrossRef]
  22. Madan, Dilip, and Frank Milne. 1991. Option Pricing with VG Martingale Components. Mathematical Finance 1: 39–55. [Google Scholar] [CrossRef] [Green Version]
  23. Madan, Dilip, Peter Carr, and Eric C. Chang. 1998. The Variance Gamma Process and Option Pricing. European Finance Review 2: 79–105. [Google Scholar] [CrossRef] [Green Version]
  24. Mengütürk, Levent A. 2013. Information-Based Jumps, Asymmetry and Dependence in Financial Modelling. Ph.D. Thesis, Imperial College, London, UK. [Google Scholar]
  25. Mengütürk, Levent A. 2018. Gaussian Random Bridges and a Geometric Model for Information Equilibrium. Physica A 494: 465–83. [Google Scholar] [CrossRef]
  26. Rutkowski, Marek, and Nannan Yu. 2007. An Extension of the Brody-Hughston-Macrina Approach to Modeling of Defaultable Bonds. International Journal of Theoretical and Applied Finance 10: 557–89. [Google Scholar] [CrossRef]
  27. Williams, David. 1991. Probability with Martingales. Cambridge, UK: Cambridge University Press. [Google Scholar]
  28. Yor, Marc. 2007. Some Remarkable Properties of Gamma Processes. In Advances in Mathematical Finance. Edited by Michel C. Fu, Robert A. Jarrow, Ju-Yi J. Yen and Robert J. Elliot. Basel: Birkhäuser. [Google Scholar]
Figure 1. Credit-risky bonds with no recovery. The panels on the left show simulations of trajectories of the variance gamma information process, and the panels on the right show simulations of the corresponding price trajectories. Prices are quoted as percentages of the principal, and the interest rate is taken to be zero. From top to bottom, we show trajectories having σ = 1 , 2 , respectively. We take p 0 = 0.4 for the probability of default and p 1 = 0.6 for the probability of no default. The value of m is 100 in all cases. Fifteen simulated trajectories are shown in each panel.
Risks 08 00105 g001
Figure 2. Credit-risky bonds with no recovery. From top to bottom we show trajectories having σ = 3 , 4 , respectively. The other parameters are the same as in Figure 1.
Risks 08 00105 g002
Figure 3. Log-normal payoff. The panels on the left show simulations of the trajectories of the information process, whereas the panels on the right show simulations of the corresponding price process trajectories. From the top to bottom, we show trajectories having σ = 1 , 2 , respectively. The value for m is 100. We take μ = 0 , ν = 1 , and show 15 simulated trajectories in each panel.
Risks 08 00105 g003
Figure 4. Log-normal payoff. From the top row to the bottom, we show trajectories having σ = 3 , 4 , respectively. The other parameters are the same as those in Figure 3.
Risks 08 00105 g004

