Article

The Determinants of Market-Implied Recovery Rates

Department of Finance, HEC Montréal, 3000 Chemin de la Côte-Ste-Catherine, Montreal, QC H3T 2A7, Canada
Risks 2019, 7(2), 57; https://doi.org/10.3390/risks7020057
Submission received: 1 April 2019 / Revised: 6 May 2019 / Accepted: 10 May 2019 / Published: 18 May 2019
(This article belongs to the Special Issue Advances in Credit Risk Modeling and Management)

Abstract

:
In the presence of recovery risk, the recovery rate is a random variable whose risk-neutral expectation can be inferred from the prices of defaultable instruments. I extract market-implied recovery rates from the term structures of credit default swap spreads for a sample of 497 United States (U.S.) corporate issuers over the 2005–2014 period. I analyze the explanatory factors of market-implied recovery rates within a linear regression framework and also within a Tobit model, and I compare them with the determinants of historical recovery rates that were previously identified in the literature. In contrast to their historical counterparts, market-implied recovery rates are mostly driven by macroeconomic factors and long-term, issuer-specific variables. Short-term financial variables and industry conditions significantly impact the slope of market-implied recovery rates. These results indicate that the design of a recovery risk model should be based on specific market factors, not on the statistical evidence that is provided by historical recovery rates.

1. Introduction

The management and pricing of credit risk rely on the accurate assessment of the likelihood of default and of the recovery upon default. To this end, credit risk models extract market information from the term structure of credit spreads, which can be estimated from corporate bond prices and, more recently, also from credit default swap (CDS) premiums. Early literature regarding credit risk (Merton 1974) established that, in the absence of arbitrage, the credit spread should equal the product of the default probability and the loss given default under the equivalent martingale measure. For several decades, much of the research effort has been dedicated to modelling the default event, while recovery was assumed to be constant. For example, Giesecke et al. (2011) estimate the relation between default rates and credit spreads while assuming a fixed 50% recovery in their 150-year sample period.
With the accumulated evidence of time-series and cross-sectional variations of historical recovery rates, more advanced credit risk models incorporate non-constant loss given default. However, mere calibration on historical recovery rates ignores the premium that the market may assign to recovery risk. Recent empirical literature has extracted recovery rates from the joint observation of different defaultable instruments issued by the same entity (Ünal et al. 2003; Das and Hanouna 2009; Doshi et al. 2018). These market-implied recovery rates lead to a substantial reevaluation of credit risk exposures (François and Jiang 2019). However, an analysis of the factors driving them and a comparison with the determinants of historical recovery rates remains, to the best of my knowledge, to be carried out. The paper aims at filling this gap.
Intuitively, one should expect the factors driving historical recovery rates and those driving the market-implied recovery rates to be different. Indeed, recovery rates are random variables and historical recoveries are their ex post realizations, whereas market-implied recoveries are their risk-neutral expectations. The way that the market assigns a recovery risk premium, on one hand, and the way that financial distress is eventually resolved, on the other, should induce distinct patterns for ex ante and ex post recovery.
I extract market-implied recovery rates from the term structure of CDS spreads for 497 United States (U.S.) corporate issuers over the 2005–2014 period. They exhibit a fairly symmetric distribution with clustered observations at zero—in sharp contrast with the typical bimodal distribution of historical recovery rates. I then proceed to a factor analysis using firm-specific, industry-specific, and macroeconomic determinants that are commonly identified in the bond recovery literature.
My contribution includes the following findings. Historical recovery rates have been shown to be affected by short-term, firm-specific variables, such as liquidity and profit margin. By contrast, I show that market-implied recovery rates are impacted by corporate factors that are more informative about the long run, such as leverage. In addition, while the effect of size is unclear on historical recovery rates, I unambiguously document a positive relation between size and market-implied recovery within a non-linear model. Similarly, the role of macroeconomic factors on historical recovery has received mixed support, except for default rates. I show that the strong negative relation with default rates also prevails for market-implied recovery rates. However, in contrast to their historical counterparts, macroeconomic factors, such as GDP growth and unemployment rate, also impact market-implied recovery rates. The slope of the term structure of market-implied recovery rates is affected by the same variables, short-term financial variables (such as liquidity and profit margin), and by the industry stock performance. The main implication of my results is the following. The design of a recovery risk model should be based on specific market factors, not on the statistical evidence that historical recovery rates provide.
I review the related literature in the next section. Section 3 addresses all aspects of the methodology (including the recovery model, the data and the model calibration, and a comparison with historical recovery rates). Section 4 presents the factor analysis and its results. I conclude in Section 5.

2. Related Literature

My study stands at the intersection of two streams of literature: (i) The determinants of historical recovery rates and (ii) the inference of recovery rates from market data. I shall briefly review these two research areas.

2.1. Factors Driving Historical Recovery Rates

Significant literature has examined the determinants of historical recovery rates. Two types of contributions can be distinguished. Most of the known determinants have been identified using standard linear regression models. These works include Frye (2000), Düllmann and Trapp (2004), Altman et al. (2005), Varma and Cantor (2005), Chava et al. (2011), among others. Subsequent contributions aim at improving the fit of original models using more sophisticated specifications. These include parametric models, such as fractional response regressions (Bastos 2009) or inverse Gaussian regressions (Qi and Zhao 2011), as well as non-parametric models, such as regression trees (Bastos 2009; Nazemi and Fabozzi 2018), neural networks (Qi and Zhao 2011; Loterman et al. 2012), and support vector regressions (Loterman et al. 2012; Nazemi et al. 2018).
The determinants identified by all these studies can be grouped into four categories.
  • Debt contract-specific variables: Coupon rate, seniority, collateral.
  • Firm-specific variables: Size, asset tangibility, market-to-book ratio, liquidity ratio, interest coverage ratio, profit margin, leverage, firm age.
  • Industry-specific variables: industry dummy, utilities dummy, industry sales growth, industry stock return.
  • Macroeconomic variables: Bond default rate, GDP growth, S&P500 index return, S&P500 index volatility, unemployment rate, Fama-French factors, economic uncertainty.
Table 1 provides a summary of the findings, relating the determinants and the sign of their effect to the various empirical studies. The seminal study of Altman and Kishore (1996) supports the economic intuition that secured debt and senior debt are associated with higher recovery. These relations have been documented in early studies using linear regressions, and they have been confirmed by recent work using more advanced models (Qi and Zhao 2011; Siao et al. 2016).
It is also natural to think that the characteristics of the issuing firm affect the eventual recovery on its distressed debt. All else equal, when assets are big (firm size), when they are tangible (mainly property, plant and equipment), and when they are mostly in place (low market-to-book ratio), creditors will obtain a higher recovery (Varma and Cantor 2005; Chava et al. 2011). In addition, the firm’s ability to repay (captured by various liquidity ratios, by profit margin, or by leverage) is also found to positively impact recovery (Acharya et al. 2007). It is also documented that the type of default (private workout versus formal bankruptcy) impacts on historical recovery rates (Franks and Torous 1994; Altman and Karlin 2009). All else equal, when the firm cannot resolve financial distress by means of private renegotiations (as in distressed exchanges), it is an indication that the default event is particularly severe and this negatively affects recovery.
Acharya et al. (2007) particularly put the role that is played by industry factors. In line with the argument made by Shleifer and Vishny (1992), recovery is negatively impacted when the industry of the defaulting firm performs poorly. This is because the specific assets of the defaulting firm cannot be sold at their fair price, since potential buyers are themselves under financial stress.
It is a well-established stylized fact that recoveries are inversely related to default rates (Frye 2000; Altman et al. 2005). The importance of additional macroeconomic variables has been emphasized in more recent studies. Nazemi and Fabozzi (2018) and Nazemi et al. (2018) mainly extract significant macroeconomic variables using Lasso and variable importance metrics from gradient boosting, respectively. Through different model specifications, including linear regressions, regression trees, and support vector regressions, they conclude that the stock index return, the corporate bond spread, and the unemployment rate are among the most salient determinants of historical recovery rates. Gambetti et al. (2019) identify economic uncertainty as an additional factor. They measure economic uncertainty using several proxies, including the VIX, survey-based, and news-based variables. They show that higher economic uncertainty lowers recovery rates, but it also affects their distribution (assuming they are generated from a beta distribution).

2.2. Inferring Recovery Rates from Market Data

The credit spread on a defaultable instrument reflects the product of the default probability and the loss given default, both under the equivalent martingale measure. Therefore, observing the credit spread leads to the identification problem of disentangling the default probability from the recovery rate. When discussing the implementation of their reduced-form credit risk model, Duffie and Singleton (1999) initially suggested working with defaultable instruments written by the same issuer but distinct in recovery.
In this line of reasoning, Ünal et al. (2003) apply a reduced-form credit risk model on the prices of senior and junior debts. Another possibility is to work with the term structure of CDS spreads. Jaskowski and McAleer (2012) estimate a reduced-form credit risk model with the Bayesian MCMC method. Doshi et al. (2018) extract the term structure of recovery rates from the joint observation of senior and subordinated CDS. Das and Hanouna (2009) and François and Jiang (2019) rely on the term structure of CDS spreads and on stock prices. In this latter approach, the default hazard rate is inversely related to the level of the stock price.

3. Methodology

3.1. The Recovery Model

Consider a reference firm with traded equity (stock price process is denoted by St) and a traded term structure of CDS contracts (the j-maturity CDS premium process is denoted by πt(j)). Assuming that the absolute priority rule is enforced, the equity-holders obtain zero recovery upon default. By contrast, the CDS offers compensation for the loss given default on the underlying reference bond. Consequently, the (risk-neutral) default probability of the issuing firm and the recovery rate on the reference bond affects the CDS premium. Therefore, it is possible to infer market-implied recovery rates from the joint observation of St and the collection of πt(j), since equity and CDS contracts are driven by the same default process, but exhibit distinct recovery rates.
I follow Das and Hanouna (2009) and François and Jiang (2019) to extract market-implied recovery rates. Specifically, the stock price process dynamics is modelled by Cox et al. (1979) binomial tree with a state of jumping to default. At each node on the tree, Sik denotes the stock price, where superscript k indexes time (from 0 to N periods) and subscript i indexes the level of the node at time k. In the kth period, i takes value 0 at the top and value k at the bottom.
In one time step, the stock price with return volatility σ can take on the following values
S i k + 1 = S i k exp ( σ h )   with   probability   q i k ( 1 λ i k ) ,
S i + 1 k + 1 = S i k exp ( σ h )   with   probability   ( 1 q i k ) ( 1 λ i k ) ,
0   with   probability   λ i k ,
where h is the time step, λik is the one-period probability of jumping to default (default intensity), and qik is the risk-neutral probability of an up move if the firm survives.
In the absence of arbitrage opportunities, the risk-neutral probability qik is given by
q i k = R k 1 λ i k exp ( σ h ) exp ( σ h ) exp ( σ h ) ,
where Rk is the one-period compound factor.
Das and Hanouna (2009) and François and Jiang (2019) posit a non-linear inverse relation between the default hazard rate εik and the level of the stock price
λ i k = 1 exp ( ε i k h ) = 1 exp ( ( S i k ) b h ) ,
where parameter b is the elasticity of the hazard rate with respect to the stock price. Such a specification results in time- and state-dependent default intensity.
In addition, they work with a logistic specification for the recovery rate φik on the defaultable reference bond
φ i k = 1 1 + exp ( a 0 + a 1 λ i k ) ,
where a₀ is a scale parameter and a₁ captures the dependence between the default intensity and the recovery rate.
Consider the CDS with settlement dates Tu, u = 1, …, j. For clarity of exposure, λkλk(Tk−1, Tk) denotes the probability of jumping to default between settlement dates Tk−1 and Tk. Likewise, φkφk(Tk−1, Tk) is the recovery rate prevailing between the settlement dates Tk−1 and Tk. The λk and φk are obtained from aggregation across all states of the binomial tree.1 In this framework, the no-arbitrage premium π(j) equalizes the two legs of the CDS2
π ( j ) = u = 1 j ( k = 1 u 1 ( 1 λ k ) λ u ( 1 φ u ) B ( T u ) ) u = 1 j ( k = 1 u ( 1 λ k ) B ( T u ) ) ,
where B(t) is the risk-free discount factor for horizon t.
I calibrate the model-implied CDS premiums on the observed term structure πobs(j) to extract the term structure of the market-implied recovery rates (φk). That is, for J available CDS maturities, I solve for
min a 0 , a 1 . b , σ j = 1 J ( π ( j ) π o b s ( j ) ) 2 ,
which yields the quadruplet of calibrated parameters Ω = (a₀, a₁, b, σ).

3.2. Data and Model Calibration

The initial sample contains monthly stock prices and seven-maturity CDS term structures for 542 firms traded on the U.S. market (NYSE or NASDAQ).3 The sample period begins in January 2005 and ends in June 2014 (114 months),4 which results in 52,021 terms structures and stock price observations. The sample period spans an entire business cycle with the 2008–2009 financial crisis being located in the middle. All of the discount factors are obtained from the smoothed Treasury yield curve reported by the Fed St-Louis website.
Table 2 reports statistics regarding the quality of the calibration on the CDS term structures. As far as the whole sample is concerned, the average relative fitting error is 10.2%. However, in some extreme cases, the fit is poor and the inferred market-implied recovery rate might not be accurate. Therefore, I restrict the analysis by excluding the 5% of cases of worst calibrations. Working with that restricted sample, I obtain an average fitting error of 9 bps (median is 2 bps) and an average relative fitting error of 7.2% (median is 4.4%).
I focus on the 10-year recovery rate, since long-term recovery rates more adequately capture all the impacts of a lengthy resolution of financial distress to analyze the level of market-implied recovery rates.5 However, the calibrated term structure also provides information about how the market expects the recovery rate to evolve. Consequently, I also examine the slope of market-implied recovery rates defined as the difference between the 10-year rate and the five-year rate.
From here on, I only retain quarterly observations of recovery rates (March, June, September, and December) to match with the highest frequency that is available for explanatory variables. The final sample comprises 16,062 observations. Figure 1 presents the distributions of the level and the slope of market-implied recovery rates. Not surprisingly, the level exhibits a unimodal distribution that is truncated at zero. That distribution is fairly symmetric, judging by the skewness (−0.05) and by the mean (33.60%) and the median (33.27%) being very close to one another. I find that the term structures of recovery rates are decreasing (mean slope is −0.17). Das and Hanouna (2009) and Doshi et al. (2018) also find downward sloping curves for the recovery rates. This indicates that firms experiencing a sudden default may obtain a greater resale value for their assets. By contrast, firms defaulting in the medium or long run are associated with slow financial health deterioration and the gradual loss of asset resale value.
Figure 2 represents the time series behavior of the level and the slope of market-implied recovery rates. Just like their historical counterparts, the market-implied recovery rates appear to be pro-cyclical, at least judging by the business cycle spanned by the sample period. One can also note that the dispersion around the median (i.e., the gap between the third and first quartiles) increased during the recession. The slope appears to be strongly negatively correlated with the level. Thus, the whole term structure of market-implied recovery rates went down and became more flat during the crisis.

3.3. Comparison with Historical Recoveries

The recovery rates that are inferred from the sample of CDS contracts reflect market anticipations about recoveries on senior unsecured bonds. Therefore, it is interesting to compare them with historical recoveries on the same bond category. However, that comparison is subject to the following caveats.
  • The actual recovery rates from CDS auctions are slightly lower than actual recovery rates on the underlying bonds. Chernov et al. (2013) and Gupta and Sundaram (2015) find a downward bias of about 15% of the bond price (which represents a smaller fraction of par) and attribute it to a liquidity premium.
  • Market-implied recovery rates from CDS might contain a premium for the CDS writer’s counterparty risk. That being said, Arora et al. (2012) find that the negative relation between CDS spreads and CDS writer credit quality is economically very small because of risk mitigation techniques, such as overcollateralization and bilateral netting.
  • Historical recovery rates (as reported by Moody’s for instance) are, by definition, calculated on a sample of defaulting firms. The market-implied recoveries are extracted from a sample of firms underlying a CDS contract. The difference in the two populations of firms could generate a bias in the comparison of recoveries.6
  • Most importantly, market-implied recoveries are risk-neutral expectations of random recovery rates. By contrast, historical recoveries are calculated once the default event has materialized. In some studies, the historical recovery rates are computed at the resolution of financial distress and they can be viewed as the realizations of random recovery. In other studies, the historical recovery rates are computed using 30-day post default bond prices. Such historical recovery rates are still expectations about ultimate recovery, but they are conditionally calculated on default having occurred.
While most credit risk models have been typically calibrated using historical recoveries, pricing credit risky instruments should require forward-looking recoveries (ex ante measures, i.e., prior to default) that may incorporate a risk premium. The aim of this paper is precisely to show how these ex ante and ex post measures exhibit distinct patterns, and how they are affected by different drivers.
Figure 3 shows a histogram of historical recovery rates that were reported by Moody’s over the 2005–2017 period. The distribution is clearly bimodal, which suggests that the resolution of financial distress leads to either limited losses (one mode is around 75%) or a severe write-off for creditors (the other mode is around 25%).7 The average rate of 43% is not representative of the heterogeneity in historical recoveries, as previously documented by Altman and Kishore (1996), Düllmann and Trapp (2004), Altman et al. (2005), or Bruche and Gonzalez-Aguado (2010), among others.

4. Factor Analysis

I retain the following explanatory variables, in line with the previous literature.8 Firm-specific variables are size, asset tangibility, liquidity, profit margin, leverage, and a dummy for investment grade firms. Industry-specific variables include dummies for the NAICS first digit and a dummy for industry stock underperformance. GDP growth, unemployment rate, S&P500 index return, and default rate are the macroeconomic variables. Table 3 presents the definitions of variables in detail.
Table 4 shows the correspondence between NAICS industries and their sectorial stock indices, which is used to assess industry stock performance and to ultimately build the dummy related to industry stress.
Observations with missing firm characteristics are simply removed from the analysis. The final sample contains 497 firms and 12,598 observations. After reporting descriptive statistics in the next subsection, I proceed to the factor analysis of market-implied recovery rates using the linear regression model. That specification is simple and allows for a direct comparison with the literature on historical recovery rates. It would be worth investigating more sophisticated approaches to improve the goodness-of-fit and possibly highlight additional significant relations in the same spirit that this literature evolved. This is left for future research. However, given the censored distribution of market-implied recovery rates, I complement the factor analysis with Tobit regressions in Section 4.3. These regressions can be viewed as a robustness check for the findings that are highlighted in the linear regression approach.

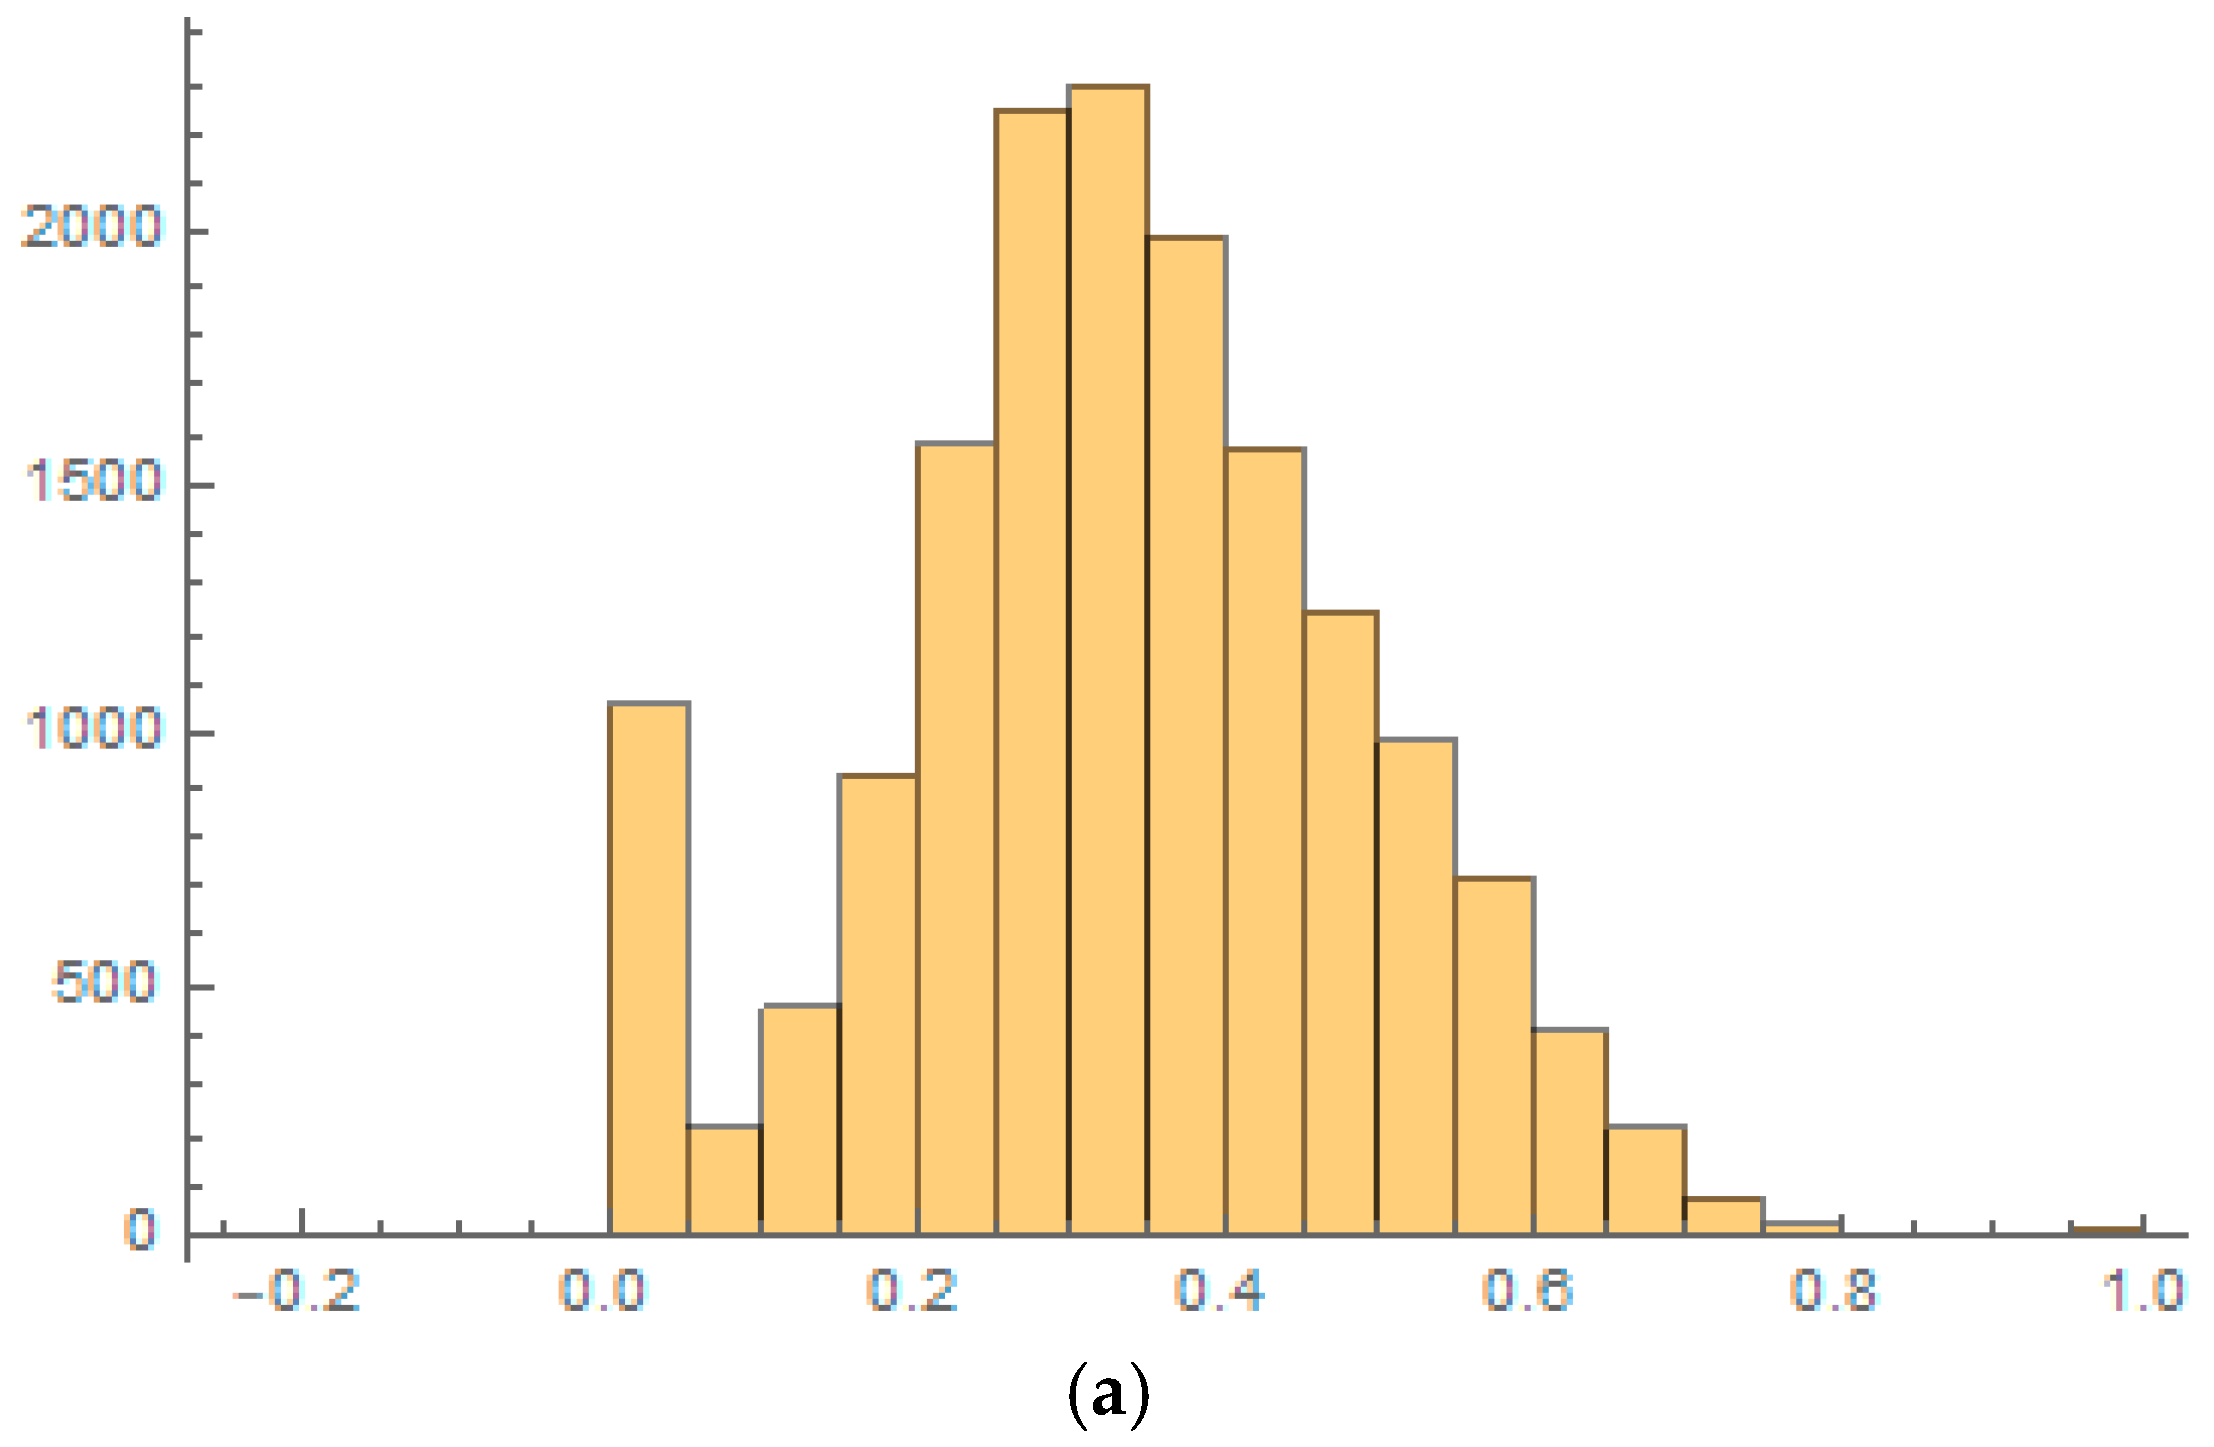
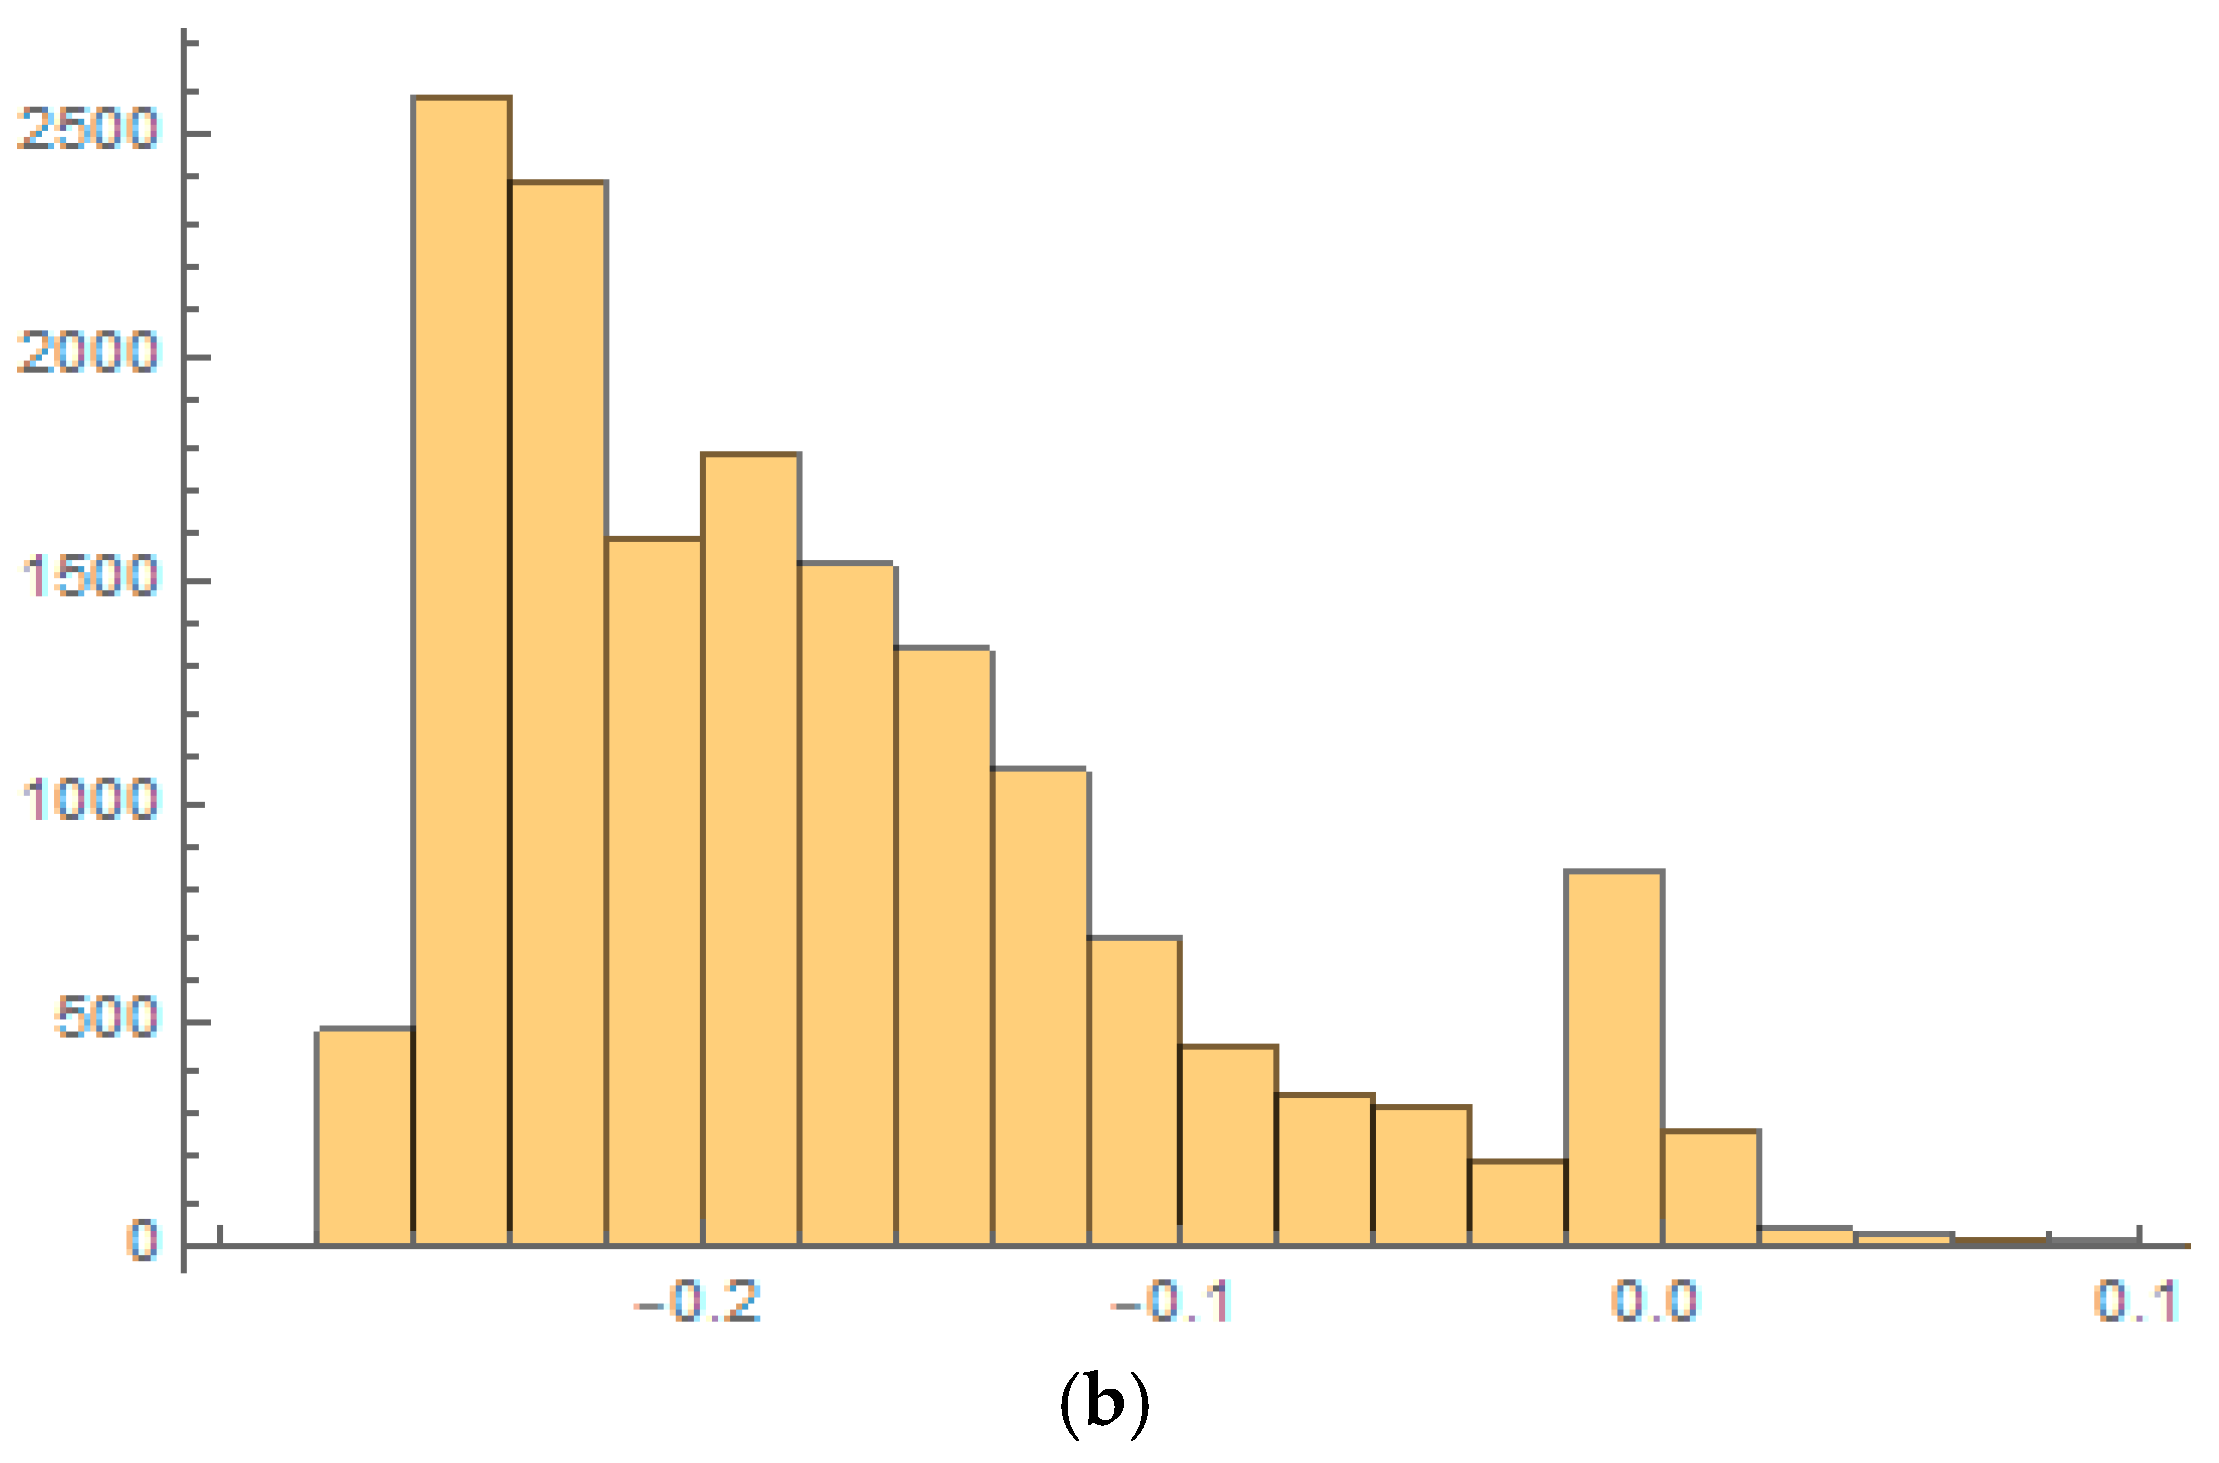
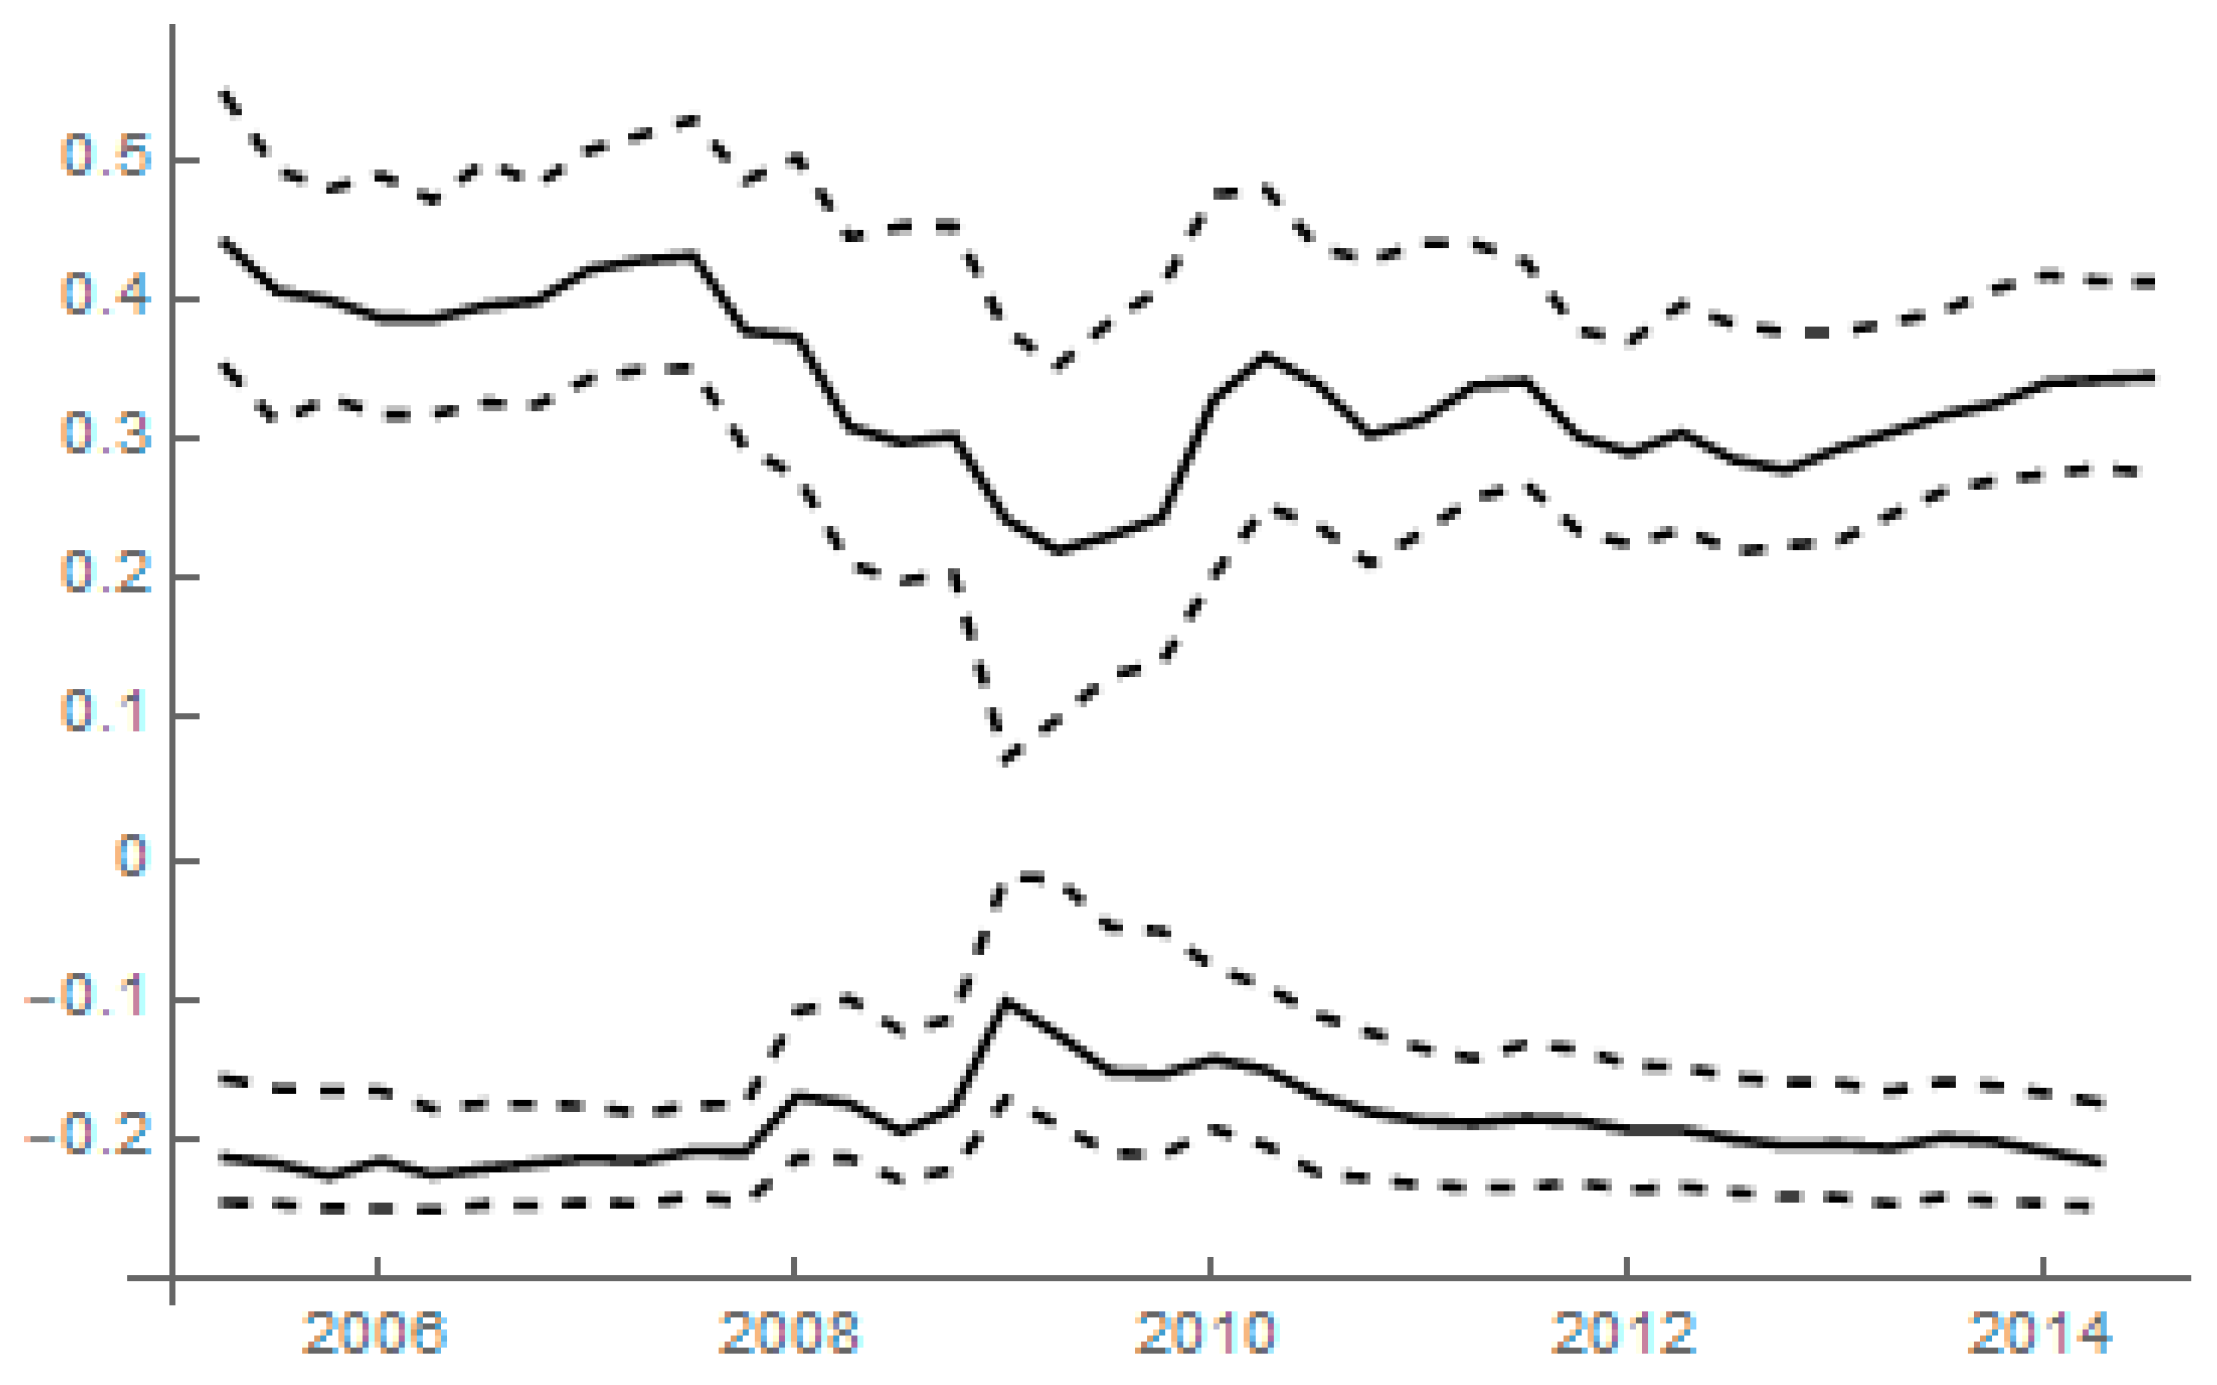
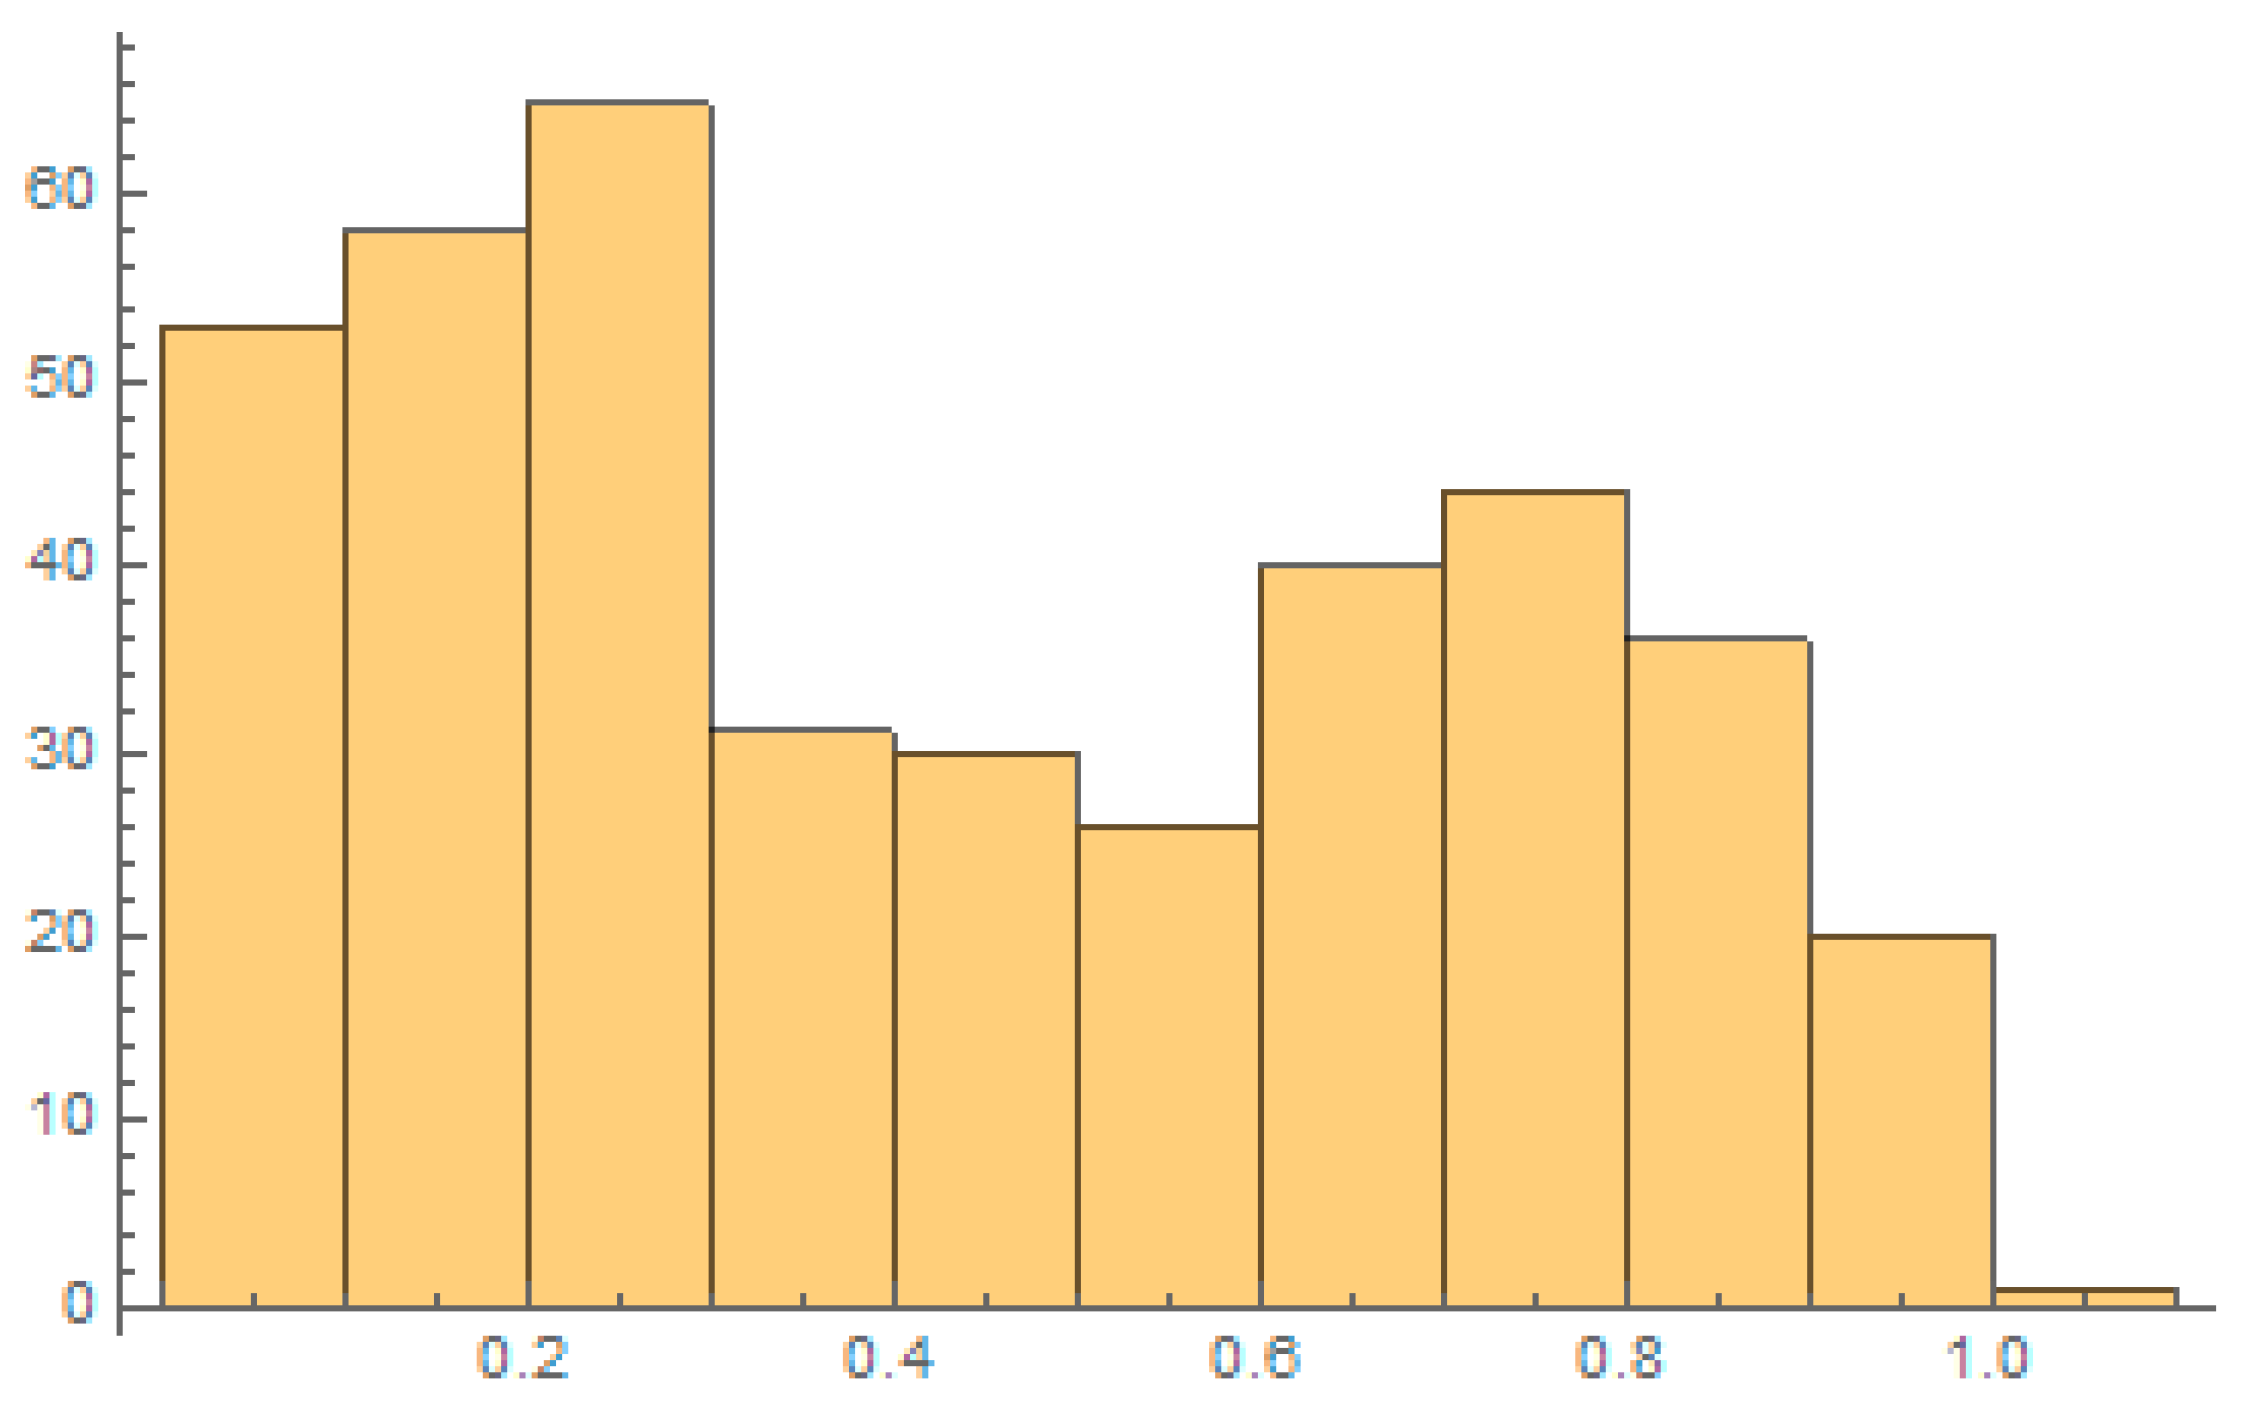
4.1. Descriptive Statistics

Table 5 reports the main descriptive statistics of the explanatory variables (excluding dummies).
By construction, studies regarding historical recovery rates report characteristics of defaulting firms. As expected, my sample of firms exhibits much different characteristics: mean profitability (20%), liquidity (16%), and leverage (28%) reflect an average firm in good financial health. As a matter of fact, the majority of sample firms are well rated (the rating dummy equals 1 for 53.9% of observations). In addition, the distribution of firms across industries is fairly representative of the economy, as shown in Table 6. The industry stress dummy only equals 1 for 3.6% of observations. This is because the threshold for industry underperformance (−30%) is meant to capture extreme liquidity shortage among competitors in the spirit of Shleifer and Vishny (1992). In my ex ante study of recovery rates, where most firms are far from the default state, such a scenario has much lower likelihood.

4.2. Linear Regression Results

I first investigate the determinants of market-implied recovery rates within a simple linear regression framework. Table 7 reports the results for the level using five different specifications. The first model includes all of the contemporaneous variables with industry fixed effects. The second model uses firm fixed effects instead. The third model considers macroeconomic variables lagged by one-quarter, as previous studies on historical recovery rates documented their superior explanatory power (Chava et al. 2011). To control for multicollinearity issues, the fourth model only retains those variables with a variance inflation factor (VIF) that is below 10. The fifth model is the same as the first one, but it is estimated by maximum likelihood. All of the specifications include time fixed effects and robust standard errors are adjusted for heteroscedasticity.
In previous empirical studies (Acharya et al. 2007; Jankowitsch et al. 2014; Siao et al. 2016), the standard determinants of historical recovery rates achieve a relatively high goodness-of-fit, with R2 typically ranging between 40% and 60%. Table 7 indicates that their explanatory power is much lower when applied to market-implied recovery rates. Macroeconomic variables keep playing an important role, which confirms the pro-cyclical behavior of recovery rates. GDP growth rate stands as the macroeconomic variable that passes the multicollinearity test while keeping a high significance level. Among the firm specific variables, only leverage significantly contributes across all specifications. A possible interpretation is that the market mostly relies on a long-term financial analysis to estimate forward-looking recovery rates. Thus, financial indicators, such as liquidity or profit margin, which may affect immediate recovery, lose their explanatory power when it comes to assessing the consequences of default in a distant future. By contrast, leverage is a financial decision that impacts investment and operating policies in the long run. Similar to the findings regarding historical recovery rates, the relation between firm size and market-implied recovery rates is ambiguous.
Table 8 presents the linear regression results for the slope of market-implied recovery rates using the same five different specifications. The slope is negative in most cases. Therefore, its steepness measures how fast the market believes the recovery will deteriorate in the future. Thus, a variable that is associated with a positive coefficient contributes to flattening the slope. By contrast, a negative relation indicates that the variable aggravates the decline in recovery.
Macroeconomic variables continue to be highly significant. They point towards a countercyclical behavior of the slope. That is, in times of recession, the term structure of market-implied recovery rates is low and flat, indicating high losses given default across all horizons. By contrast, in times of economic growth, all of the recovery rates increase, but those in the short run increase even more. This is consistent with the notion that immediate defaults during expansion lead to limited losses.
In contrast with the regression for the level, all of the firm characteristics (except for liquidity) significantly impact the slope. Leverage contributes to a low and flat term structure. However, size, profit margin, and the rating steepen the negative slope. Hence, the market believes that big, profitable firms with a good rating preserve a high recovery in the short run.
Another notable difference with results in Table 7 is that the industry distress variable is now significant. Consistent with the argument put forward by Shleifer and Vishny (1992), competitors in financial difficulty cannot offer the fair price to liquidated specific assets. The regression results suggest that this effect is only temporary, as it mainly lowers short-term recoveries and not long-term ones (thereby flattening the term structure). Additionally, this finding is in line with Shleifer and Vishny (1992), who argue that a delayed liquidation procedure helps in avoiding fire asset sales.

4.3. Tobit Regression Results

The empirical literature on historical recovery rates shows that, even if model sophistication improves the goodness-of-fit, it does not fundamentally affect the identification of factors. Indeed, the most relevant determinants have been detected in simple linear regressions.
However, the same result may not hold for market-implied recovery rates. As documented in Figure 1, the level of market-implied recovery rates exhibits a unimodal, symmetric distribution, with clustered observations at zero. Therefore, it is natural to analyze its determinants within a censored regression model. I run a Tobit model with random effects and a censor threshold at 0.01%, leaving 11,873 (94%) uncensored observations. Table 9 gathers the results. All specifications include time fixed effects. Specifications 1 and 2 only differ in the inclusion of industry fixed effects. Specification 3 uses lagged macroeconomic variables. Specification 4 only retains those variables with a VIF below 10.
The results are very similar to the ones from the linear regressions. Yet, the Tobit specification provides additional information regarding the factors driving market-implied recovery rates. It allows, in particular, to pick up the positive effects of size, rating, and, to a lesser extent, liquidity. Furthermore, the Tobit specification clarifies the firm size effect. Bigger firms are now unambiguously associated with larger market-implied recovery rates.

5. Conclusions

The goal of this study was to shed light on the determinants of market-implied recovery rates and to examine, in particular, the way that they differ with the well-identified drivers of historical recovery rates.
The link between historical recovery rates and the business cycle has clearly been established through the negative relation with default rates. However, the explicit contribution of macroeconomic factors has received mixed support (see Mora 2012). By contrast, this study shows that the forward-looking nature of market-implied recovery rates makes them very sensitive to macroeconomic variables, such as the GDP growth rate and the unemployment rate. A strong negative relation with default rates also prevails.
Other important differences arise when it comes to firm specific factors. The historical recovery rates are mostly affected by short-term financials, such as cash levels and profit margin, while size and leverage fail to be significant. Market-implied recovery rates are rather impacted by corporate factors that are more informative about the long run. They are strongly negatively related to leverage. The positive relation with size and rating quality can be captured in a non-linear model.
The Shleifer and Vishny (1992) industry effect also applies to historical and to market-implied recovery rates, but since this is a transitory effect, its impact mainly consists in flattening the term structure of market-implied recovery rates.
The major implication of this study is that the modelling of recovery risk in a credit risk pricing framework calls for specific factors and should not rely on the statistical evidence that is reported for historical recovery rates.

Funding

This research received no external funding.

Acknowledgments

The paper has benefitted from comments by Gunnar Grass, Weiyu Jiang, and three anonymous referees. Excellent research assistance by Jean-Michel Ostiguy is gratefully acknowledged. I am solely responsible for any remaining error.

Conflicts of Interest

The author declares no conflict of interest.

References

  1. Acharya, Viral, Sreedhar Bharath, and Anand Srinivasan. 2007. Does industry-wide distress affect defaulted firms? Evidence from creditor recoveries. Journal of Financial Economics 85: 787–821. [Google Scholar] [CrossRef]
  2. Altman, Edward, and Egon Kalotay. 2014. Ultimate recovery mixtures. Journal of Banking and Finance 40: 116–29. [Google Scholar] [CrossRef]
  3. Altman, Edward, and Brenda Karlin. 2009. The re-emergence of distressed exchanges in corporate restructurings. Journal of Credit Risk 5: 43–55. [Google Scholar] [CrossRef] [Green Version]
  4. Altman, Edward, and Vellore Kishore. 1996. Almost everything you wanted to know about recoveries on defaulted bonds. Financial Analyst Journal 52: 57–64. [Google Scholar] [CrossRef]
  5. Altman, Edward, Brooks Brady, Andrea Resti, and Andrea Sironi. 2005. The link between default and recovery rates: Theory, empirical evidence, and implications. The Journal of Business 78: 2203–28. [Google Scholar] [CrossRef]
  6. Arora, Navneet, Priyank Gandhi, and Francis Longstaff. 2012. Counterparty credit risk and the credit default swap market. Journal of Financial Economics 103: 280–93. [Google Scholar] [CrossRef]
  7. Bastos, Joao. 2009. Forecasting bank loan loss-given-default. Journal of Banking and Finance 34: 2510–17. [Google Scholar] [CrossRef]
  8. Bris, Arturo, Iwo Welch, and Ning Zhu. 2006. The costs of bankruptcy: Chapter 7 liquidation versus Chapter 11 reorganization. Journal of Finance 61: 1253–303. [Google Scholar] [CrossRef]
  9. Bruche, Max, and Carlos Gonzalez-Aguado. 2010. Recovery rates, default probabilities and the credit cycle. Journal of Banking and Finance 34: 713–23. [Google Scholar] [CrossRef]
  10. Chava, Sudheer, Catalina Stefanescu, and Stuart Turnbull. 2011. Modeling the loss distribution. Management Science 57: 1267–87. [Google Scholar] [CrossRef]
  11. Chernov, Mikhail, Alexander Gorbenko, and Igor Makarov. 2013. CDS auctions. Review of Financial Studies 26: 768–805. [Google Scholar] [CrossRef]
  12. Cox, John, Steven Ross, and Mark Rubinstein. 1979. Option pricing: A simplified approach. Journal of Financial Economics 7: 229–63. [Google Scholar] [CrossRef]
  13. Das, Sanjiv, and Paul Hanouna. 2009. Implied recovery. Journal of Economic Dynamics and Control 33: 1837–57. [Google Scholar] [CrossRef]
  14. Denis, Diane, and Kimberly Rodgers. 2007. Chapter 11: Duration, outcome, and post-reorganization performance. Journal of Financial and Quantitative Analysis 42: 101–18. [Google Scholar] [CrossRef]
  15. Doshi, Hitesh, Redouane Elkamhi, and Chayawat Ornthanalai. 2018. The term structure of expected recovery rates. Journal of Financial and Quantitative Analysis 53: 2619–61. [Google Scholar] [CrossRef]
  16. Duffie, Darrell, and Kenneth Singleton. 1999. Modeling term structures of defaultable bonds. Review of Financial Studies 12: 687–720. [Google Scholar] [CrossRef] [Green Version]
  17. Düllmann, Klaus, and Monika Trapp. 2004. Systematic Risk in Recovery Rates—An Empirical Analysis of U.S. Corporate Credit Exposures. Discussion Paper, Series 2: Banking and Financial Supervision, No. 2004,02; Frankfurt am Main: Deutsche Bundesbank Research Centre. [Google Scholar]
  18. François, Pascal, and Weiyu Jiang. 2019. Credit value adjustment with market-implied recovery. Journal of Financial Services Research. forthcoming. [Google Scholar]
  19. Franks, Julian, and Walter Torous. 1994. A comparison of financial recontracting in distressed exchanges and Chapter 11 reorganizations. Journal of Financial Economics 35: 349–70. [Google Scholar] [CrossRef]
  20. Frye, Jon. 2000. Collateral damage. RISK 13: 91–94. [Google Scholar]
  21. Gambetti, Paolo, Geneviève Gauthier, and Frédéric Vrins. 2019. Recovery Rates: Uncertainty Certainly Matters. Available online: https://papers.ssrn.com/sol3/papers.cfm?abstract_id=3366889 (accessed on 15 April 2019).
  22. Giesecke, Kay, Francis Longstaff, Stephen Schaefer, and Ilya Strebulaev. 2011. Corporate bond default risk: A 150-year perspective. Journal of Financial Economics 102: 233–55. [Google Scholar] [CrossRef]
  23. Gupta, Sudip, and Rangarajan Sundaram. 2015. Mispricing and arbitrage in CDS auctions. Journal of Derivatives 22: 79–91. [Google Scholar] [CrossRef]
  24. Jankowitsch, Rainer, Florian Nagler, and Marti Subrahmanyam. 2014. The determinants of recovery rates in the U.S. corporate bond market. Journal of Financial Economics 114: 155–77. [Google Scholar] [CrossRef]
  25. Jaskowski, Marcin, and Michael McAleer. 2012. Estimating Implied Recovery Rates from the Term Structure of CDS Spreads. Working paper. Amsterdam, The Netherlands: Tinbergen Institute. [Google Scholar]
  26. Loterman, Gert, Iain Brown, David Martens, Christophe Mues, and Bart Baesens. 2012. Benchmarking regression algorithms for loss given default modeling. International Journal of Forecasting 28: 161–70. [Google Scholar] [CrossRef]
  27. Merton, Robert. 1974. On the pricing of corporate debt: The risk structure of interest rates. Journal of Finance 29: 449–70. [Google Scholar]
  28. Mora, Nada. 2012. What determines creditor recovery rates? Federal Reserve Bank of Kansas City Economic Review 97: 79–109. [Google Scholar]
  29. Nazemi, Abdolreza, and Frank Fabozzi. 2018. Macroeconomic variable selection for creditor recovery rates. Journal of Banking and Finance 89: 14–25. [Google Scholar] [CrossRef]
  30. Nazemi, Abdolreza, Konstantin Heidenreich, and Frank Fabozzi. 2018. Improving corporate bond recovery rate prediction using multi-factor support vector regressions. European Journal of Operational Research 271: 664–75. [Google Scholar] [CrossRef]
  31. Qi, Min, and Xinlei Zhao. 2011. Comparison of modeling methods for loss given default. Journal of Banking and Finance 35: 2842–55. [Google Scholar] [CrossRef]
  32. Shleifer, Andrei, and Robert Vishny. 1992. Liquidation values and debt capacity: A market equilibrium approach. Journal of Finance 47: 1343–66. [Google Scholar] [CrossRef]
  33. Siao, Jhao-Siang, Ruey-Ching Hwang, and Chih-Kang Chu. 2016. Predicting recovery rates using logistic quantile regression with bounded outcomes. Quantitative Finance 16: 777–92. [Google Scholar] [CrossRef]
  34. Ünal, Haluk, Madan Dilip, and Levent Güntay. 2003. Pricing the risk of recovery in default with APR violation. Journal of Banking and Finance 27: 1001–25. [Google Scholar] [CrossRef]
  35. Varma, Praveen, and Richard Cantor. 2005. Determinants of recovery rates on defaulted bonds and loans for North American corporate issuers: 1983–2003. Journal of Fixed Income 14: 29–44. [Google Scholar] [CrossRef]
1
The aggregation is performed through a recursive algorithm. See Das and Hanouna (2009) for details.
2
The denominator is the expected present value of all the premiums to be paid. The numerator is the expected present value of the compensation for the loss given default.
3
All CDS are U.S. dollar denominated and senior unsecured single-name contracts.
4
Before September 2010, the data was provided by CMA via Datastream. After that date, the data is provided by Thomson Reuters. The data is combined from the two providers by using the function “SPLC” of Datastream.
5
For instance, empirical studies on U.S. bankruptcy filings (Bris et al. 2006; Denis and Rodgers 2007) report that firms in financial distress spend between two and three years on average under bankruptcy.
6
When regressing historical recovery rates, Jankowitsch et al. (2014) find a positive and significant coefficient for CDS availability.
7
Altman and Kalotay (2014) propose a mixture of normals to model the bimodal distribution of historical recovery rates. Siao et al. (2016) opt for a quantile-based regression.
8
Since CDS in the sample are written on the same type of bonds (senior unsecured), the factor analysis precludes those variables that are specific to the debt contract such as coupon, seniority, or collateral.
Figure 1. Histograms for the level and the slope of market-implied recovery rates. Panel (a) shows the distribution of the level (10-year recovery rate). Panel (b) shows the distribution of the slope (10-year rate minus five-year rate). The sample contains 16,062 quarterly observations and it spans the January 2005–June 2014 period.
Risks 07 00057 g001aRisks 07 00057 g001b
Figure 2. Time series of market-implied recovery rate level and slope. The level (slope) is shown in the top (bottom) curves. The solid line represents the median, the two dashed lines represent the first and third quartiles.
Risks 07 00057 g002
Figure 3. Distribution of historical recovery rates. Data is obtained from Moody’s credit reports and spans the 2005–2017 period.
Risks 07 00057 g003
Table 1. Review of the determinants of historical recovery rates. For each identified determinant, the table lists some studies documenting a significant relation with historical recovery rates. The next column indicates whether that relation is positive or negative. The method refers to linear regression (LR), probit regression (PR), logistic quantile regression (LQ), support vector regression (SVR), or regression trees (RT).
DeterminantExamples of StudiesEffectMethod
Panel A: Debt contract-specific variables
Coupon rateChava et al. (2011)+PR
CollateralFrye (2000)+LR
Qi and Zhao (2011)+RT
SeniorityVarma and Cantor (2005)+LR
Acharya et al. (2007)+LR
Siao et al. (2016)+LQ
RatingJankowitsch et al. (2014)+LR
Panel B: Firm-specific variables
SizeAcharya et al. (2007); Chava et al. (2011)+/−LR, PR
Market-to-bookChava et al. (2011)PR
Asset tangibilityVarma and Cantor (2005)+LR
Chava et al. (2011)+PR
LiquidityVarma and Cantor (2005)+LR
Profit marginAcharya et al. (2007)+LR
LeverageVarma and Cantor (2005)LR
Default event severityFranks and Torous (1994); Altman and Karlin (2009)LR
Panel C: Industry-specific variables
Industry dummiesAcharya et al. (2007); Chava et al. (2011)+/−LR, PR
Industry sales growth dummyAcharya et al. (2007)+PR
Industry stock return dummyAcharya et al. (2007)+PR
Industry default rateJankowitsch et al. (2014)LR
Panel D: Macroeconomic variables
Default rateFrye (2000); Altman et al. (2005)LR
GDP growthAltman et al. (2005); Chava et al. (2011)+LR, PR
Fed fund rateJankowitsch et al. (2014)+LR
Stock index returnNazemi et al. (2018)+SVR, RT
Corporate bond spreadNazemi et al. (2018)SVR, RT
Unemployment rateNazemi et al. (2018)SVR, RT
Table 2. Fitting the credit default swap (CDS) term structure. The table reports the calibration results on monthly term structures of CDS spreads. The root mean squared errors (RMSE) and the relative root mean squared errors (RRMSE) are expressed in basis points and in percentage points, respectively. The initial sample contains 52,021 firm-month observations. The restricted sample is obtained by excluding the 5% of observations with the worst fit.
StatisticInitial SampleRestricted Sample
RMSERRMSERMSERRMSE
Mean2310.2397.19
Median34.7624.44
Standard deviation22217.12177.58
Maximum9389440.089339.34
95% percentile9339.345124.59
Table 3. Definition of explanatory variables.
VariableDescription
SizeLogarithm of total assets.
Asset tangibilityProperty, plant and equipment/total assets.
Liquidity(Cash plus short-term investments)/total assets.
Profit marginEBITDA/sales.
LeverageLong-term debt/total assets.
RatingDummy = 1 if issuer is investment grade.
Industry stressDummy = 1 if quarterly industry index return is below −30%.
GDP growthSeasonally adjusted, quarterly growth rate of U.S. GDP.
UnemploymentSeasonally adjusted, quarterly U.S. unemployment rate.
Stock indexS&P500 index adjusted, quarterly return.
Default rateQuarterly default rate reported by Moody’s and S&P.
Table 4. NAICS industries and corresponding stock indices.
NAICSIndustryGICS Stock IndexTicker
11Agriculture, forestry and fishingAgricultureS5AGRI
21Minerals and gasesEnergySPN
22UtilitiesUtilitiesS5UTIL
23ConstructionConstruction and engineeringS5CSTEX
31Food manufacturingFood and beverageSPSIFBUP
32Wood and concrete manufacturingMaterialsS5MATR
33Metal manufacturingMetal and miningSPSIMM
42Wholesale tradeRetailSPSIRE
44Retail tradeRetailSPSIRE
45Sporting goods and book storesRetailSPSIRE
48Transportation and warehousingTransportationSPSITN
49Postal serviceTransportationSPSITN
51Information and newspaperMedia and entertainmentS5MEDA
52Finance and insuranceFinancialsSPF
53Real estate, rental and leasingReal estateS5RLST
54Professional and technical servicesCommercial and professional servicesS5COMS
56Administrative and support servicesConsumer servicesS5HOTR
62Health careHealth careS5HLTH
72Food servicesRestaurantsS5REST
81Other non-public servicesConsumer servicesS5HOTR
Table 5. Descriptive statistics for explanatory variables.
VariableMeanStd DevMinQ1Q2Q3Max
Size9.52831.35984.77918.58949.375510.280714.8302
Asset tangibility0.31200.24610.00000.10090.25340.50500.9530
Liquidity0.16190.22330.00000.03360.08770.19753.4089
Profit margin0.20150.3369−7.72140.10430.17350.277124.1566
Leverage0.27670.19730.00000.14450.24280.37142.3640
GDP growth0.01770.0267−0.08400.00500.02250.03600.0540
Unemployment0.06880.01870.04400.05000.06550.08800.1000
Stock index0.01530.0688−0.2356−0.02070.03350.06050.1314
Default rate0.00420.00390.00080.00200.00220.00470.0174
Table 6. Distribution of firms across industries (NAICS first digit).
IndustryCountIndustryCount
Agriculture1 (0.2%)Professional services149 (30.0%)
Minerals and gases80 (16.1%)Health care9 (1.8%)
Manufacturing186 (37.4%)Food services9 (1.8%)
Transportation and trade62 (12.5%)Other non-public services1 (0.2%)
Table 7. Regression results for the level of market-implied recovery rates. Robust standard errors are reported in parentheses. Variables preceded by “L_” are lagged by one quarter. Statistical significance at the 10%, 5%, and 1% level is indicated by superscript *, ** and ***, respectively.
Variable12345
Intercept0.5762 ***0.5762 ***0.4369 ***0.3977 ***0.3850 ***
(−0.0366)(0.1025)(0.1021)(0.0209)(0.0656)
Size−0.0137 ***−0.0137−0.0125-0.0077 **
(0.0021)(0.0104)(0.0104)-(0.0030)
Asset tangibility0.02860.02860.02540.03240.0210
(0.0589)(0.0486)(0.0486)(0.0491)(0.0174)
Liquidity0.02140.02140.01810.02580.0201 **
(0.0142)(0.0186)(0.0186)(0.0189)(0.0103)
Profit margin0.00320.00320.00310.00350.0037
(0.0070)(0.0065)(0.0067)(0.0068)(0.0034)
Leverage−0.1214 **−0.1214 ***−0.1220 ***−0.1223 ***−0.1202 ***
(0.0449)(0.0326)(0.0326)(0.0328)(0.0140)
Rating0.00910.00910.00980.00850.0220 ***
(0.0049)(0.0067)(0.0073)(0.0074)(0.0043)
Industry stress0.00460.0046−0.0068−0.00430.0039
(0.0058)(0.0067)(0.0064)(0.0063)(0.0062)
GDP growth0.1339 *0.1339 ***-0.1497 ***0.1362 **
(0.0595)(0.0485)-(0.0483)(0.0621)
Unemployment−0.8287−0.8287 ***--−0.7864 ***
(0.6827)(0.2794)--(0.2827)
Stock index−0.0353−0.0353 *-−0.0304 *−0.0356
(0.0208)(0.0182)-(0.0184)(0.0249)
Default rate−3.5229 ***−3.5229 ***--−3.4103 ***
(0.6149)(0.6956)--(0.6752)
L_ GDP growth--0.1401 ***--
--(0.0470)--
L_ Unemployment--1.2948 ***--
--(0.2692)--
L_ Stock index--−0.0183--
--(0.0161)--
L_ Default rate--3.7581 ***--
--(0.4939)--
Industry fixed effectsYesNoNoNoYes
Firm fixed effectsNoYesYesYesNo
R2 within0.11820.11820.11980.1142-
R2 between0.04580.04580.05980.1567-
R2 overall0.09280.09280.10130.1447-
Table 8. Regression results for the slope of market-implied recovery rates. Robust standard errors are reported in parentheses. Variables preceded by “L_” are lagged by one quarter. Statistical significance at the 10%, 5% and 1% level is indicated by superscript *, ** and ***, respectively.
Variable12345
Intercept−0.1164 **−0.1164 **−0.0740 **−0.1980 ***−0.1605 ***
(0.0435)(0.0585)(0.0335)(0.0116)(0.0340)
Size−0.0173 ***−0.0173 ***−0.0077 *** −0.0077 ***
(0.0044)(0.0059)(0.0015) (0.0016)
Asset tangibility0.0721 **0.0721 ***0.0404 ***0.1149 ***0.0392 ***
(0.0240)(0.0223)(0.0089)(0.0260)(0.0090)
Liquidity0.00310.00310.00530.01400.0044
(0.0114)(0.0129)(0.0053)(0.0124)(0.0052)
Profit margin−0.0111 *−0.0111 **−0.0113 ***−0.0122 **−0.0111 ***
(0.0050)(0.0049)(0.0017)(0.0056)(0.0017)
Leverage0.0624 ***0.0624 ***0.0614 ***0.0972 ***0.0602 ***
(0.0146)(0.0203)(0.0072)(0.0208)(0.0072)
Rating−0.0181 ***−0.0181 ***−0.0198 ***−0.0219 ***−0.0194 ***
(0.0040)(0.0042)(0.0022)(0.0047)(0.0022)
Industry stress0.00850.0085 **0.0200 ***0.0246 ***0.0087 ***
(0.0064)(0.0038)(0.0030)0.0036)(0.0031)
GDP growth0.01430.0143-−0.2603 ***0.0140
(0.0287)(0.0264)-(0.0301)(0.0316)
Unemployment1.0304 ***1.0304 ***--1.0447
(0.2230)(0.1548)--(0.1438)
Stock index−0.0445 ***−0.0445 ***-−0.0459 ***−0.0444 ***
(0.0109)(0.0090)-(0.0113)(0.0127)
Default rate2.0635 ***2.0635 ***--2.1315 ***
(0.4733)(0.3694)--(0.3434)
L_ GDP growth--−0.1958 ***--
--(0.0330)--
L_ Unemployment--−0.4481 ***--
--(0.1436)--
L_ Stock index--0.0327 ***--
--(0.0127)--
L_ Default rate--0.8050 **--
--(0.3444)--
Industry fixed effectsYesNoYesNoYes
Firm fixed effectsNoYesNoYesNo
R2 within0.21420.21420.20480.1543-
R2 between0.07220.07220.12740.0601-
R2 overall0.13770.13770.18480.0984-
Table 9. Tobit regression results for the level of market-implied recovery rates. Robust standard errors are reported in parentheses. Variables preceded by “L_” are lagged by one quarter. Statistical significance at the 10%, 5% and 1% level is indicated by superscript *, ** and ***, respectively.
Variable1234
Intercept0.3853 ***0.3775 ***0.2449 ***0.4329 ***
(0.0710)(0.0350)(0.0709)(0.0589)
Size0.0086 ***0.0077 **0.0091 ***-
(0.0032)(0.0032)(0.0033)-
Asset tangibility0.01290.00550.01050.0089
(0.0187)(0.0166)(0.0186)(0.0189)
Liquidity0.0212 **0.0206 *0.0182 *0.0188 *
(0.0108)(0.0109)(0.0108)(0.0108)
Profit margin0.00500.00490.00490.0058
(0.0036)(0.0036)(0.0036)(0.0036)
Leverage−0.1348 ***−0.1386 ***−0.1350 ***−0.1406 ***
(0.0150)(0.0150)(0.0150)(0.0150)
Rating0.0221 ***0.0228 ***0.0227 ***0.0241 ***
(0.0046)(0.0046)(0.0046)(0.0045)
Industry stress0.00470.0051−0.0072−0.0049
(0.0065)(0.0065)(0.0061)(0.0061)
GDP growth0.1268 *0.1264 *-0.1414 **
(0.0656)(0.0656)-(0.0656)
Unemployment−0.9115 ***−0.9145 ***--
(0.2998)−0.2998--
Stock index−0.0342−0.0342-−0.0273
(0.0263)(0.0263)-(0.0252)
Default rate−3.4702 ***−3.4672 ***--
(0.7143)(0.7143)--
L_ GDP growth--0.1497 **-
--(0.0681)-
L_ Unemployment--1.2966 ***-
--(0.2968)-
L_ Stock index--−0.0192-
--(0.0262)-
L_ Default rate--3.9085 ***-
--(0.7104)-
Industry fixed effectsYesNoYesYes
Log-likelihood7047.497043.207058.317020.83

