Abstract
‘Sustainable investment’—includes a variety of asset classes selected while caring for the causes of environmental, social, and governance (ESG). It is an investment strategy that seeks to combine social and/ or environmental benefits with financial returns, thus linking investor’s social, ethical, ecological and economic concerns Under certain conditions, these indices also help to attract foreign capital, seeking international participation in the local capital markets. The purpose of this paper is to study whether the sustainable investment alternatives offer better financial returns than the conventional indices from both developed and emerging markets. With an intent to maintain consistency, this paper comparatively analyzes the financial returns of the Thomson Reuters/S-Network global indices, namely the developed markets (excluding US) ESG index—TRESGDX, emerging markets ESG index—TRESGEX, US large-cap ESG index—TRESGUS, Europe ESG index—TRESGEU, and those of the usual markets, namely MSCI world index (MSCI W), MSCI All Country World Equity index (MSCI ACWI), MSCI USA index (MSCI USA), and MSCI Europe Australasia Far East index (MSCI EAFE), MSCI Emerging Markets index (MSCI EM) and MSCI Europe index (MSCI EU). The study also focusses on the inter-linkages between these indices. Daily closing prices of all the benchmark indices are taken for the five-year period of January 2013–December 2017. Line charts and unit-root tests are applied to check the stationary nature of the series; Granger’s causality model, auto-regressive conditional heteroskedasticity (ARCH)-GARCH type modelling is performed to find out the linkages between the markets under study followed by the Johansen’s cointegration test and the Vector Error Correction Model to test the volatility spillover between the sustainable indices and the conventional indices. The study finds that the sustainable indices and the conventional indices are integrated and there is a flow of information between the two investment avenues. The results indicate that there is no significant difference in the performance between sustainable indices and the traditional conventional indices, being a good substitute to the latter. Hence, the financial/investment managers can obtain more insights regarding investment decisions, and the study further suggests that their portfolios should consider both the indices with the perspective of diversifying the risk and hedging, and reap benefits of the same. Additionally, corporate executives shall use it to benchmark their own performance against peers and track news as well.
Keywords:
sustainability indices; socially responsible investment; index returns; financial markets; ARCH; Johansen’s cointegration; VECM JEL Classification:
G11; G15; G19; Q56; M14
1. Introduction
‘Sustainable investment’ includes a variety of asset classes selected while caring for the causes of environmental, social, and governance (ESG). It is an investment strategy that seeks to combine social and/or environmental benefits with financial returns, thus linking investor’s social, ethical, ecological, and economic concerns (Brzeszczynski and McIntosh 2014). Nowadays, corporate sustainability has become a crucial aspect of a company’s business strategy. Companies have begun to realize business benefits from the responsible practices, and even investors focus more on ‘value’ having realized that a company’s sustainability strategy may result in better risk-adjusted returns (Vives and Wadhwa 2012).
Sustainability indices differ from the conventional market indices and also assist analysts and investors in monitoring the firm’s sustainability performance, as only those companies that out-perform their peers in an in-depth analysis of economic, environmental, and social criteria are included in sustainability index categorizing as the industry sustainability leaders (del Mar Miralles-Quiros et al. 2017). Extant literature has studied the return and volatility linkages and comparisons among the general market indices and sustainability indices. For example, Charlo et al. (2015); Lopez et al. (2007); Santis et al. (2016); de Souza Cunha and Samanez (2013) and Tularam et al. (2010) study the sustainable indices in terms of their risks and returns, and their impact on the market as a whole. The sustainable and the conventional indices are also compared by evaluating the performance of the companies included in each of these indices based on their respective financial ratio analysis and overall business performance (Martinez-Ferrero and Valeriano Frias-Aceituno 2015; Pilar Marti et al. 2015; Ransariya and Bhayani 2015; Skare and Golja 2012).
The history of sustainable indices is considerably short, since Domini 400 social index launched in May 1990 by Kinder, Lydenberg, Domini, and Co., becoming the world’s first sustainability index. (Guerard 1997a, 1997b). The growing acceptance of sustainable indices, also known as socially responsible investments (SRIs), has led to the establishment of a number of other sustainable indices, which now includes offerings from the Dow Jones, E. Capital, Ethibel, FTSE4Good, Humanix, Jantzi, KLD Analytics, and Vigeo (Fowler and Hope 2007).
Most of the studies on socially responsible investments concentrate on the performance of sustainable or socially responsible mutual funds. The socially responsible mutual funds have been the focus of many researchers, while the sustainable indices have not received the same level of attention in academic research (Fowler and Hope 2007). The results of the academic research on the performance of socially responsible mutual funds are varied. A number of studies report minimal difference in risk-adjusted returns between ethical and conventional funds (Fowler and Hope 2007; Guerard 1997a). Sustainable investments can indeed provide diversification gains for conventional stock portfolios globally (Balcilar et al. 2017; Brzeszczynski and McIntosh 2014).
The present paper aims to study whether the returns from the sustainable indices are co-integrated with the returns from the conventional indices. This paper also studies the volatility and the volatility spillover between the two set of indices. Finally, it attempts to suggest if the investors and portfolio managers can reap the benefits by diversifying their investments among the conventional and sustainable indices. This paper is organized as follows—the present study, the second section reviews the literature, the third section elaborates the research methodology, the fifth section presents the empirical analysis, and the sixth section concludes.
2. Literature Review
The development of sustainable indices presages well for the growing interest in sustainable and societal issues. A good amount of research has studied the return and volatility linkages and comparisons among the general market indices and sustainability indices. For example, Charlo et al. (2015, 2017); Fowler and Hope (2007); Lopez et al. (2007); Mensi et al. (2017); Santis et al. (2016); Schmid et al. (2017); de Souza Cunha and Samanez (2013); la Torre et al. (2016), and Tularam et al. (2010) study the sustainable indices in terms of their risks and returns, and their impact on the market as a whole. Sustainable investment is a potential solution to social and ecological issues that transforms the financial markets to have more accountability of their impacts and hence, more research in this field is required to develop it as an applied field of investment (Talan and Sharma 2019).
On the methodological front, researchers employ simple methods like calculating correlations, exponential smoothening to more complex methods, such as different forms of auto-regressive conditional heteroskedasticity (ARCH), and various other econometric models (such as VaR). Some of their interesting applications are evident in the studies by Balcilar et al. (2017); Bianconi et al. (2013); Mensi et al. (2017); Ortas et al. (2014); Park and Jei (2010); Sadorsky (2014); Seo et al. (2009), and Tse (1999). Sadorsky (2014) employs multi-variate GARCH models to study the volatilities and conditional correlation between a stock price index comprising of socially responsible companies, oil prices, and gold prices and concludes that social and responsible investment exhibits similar results received on investing in the S&P 500. On the other hand, Tse (1999) examines the price discovery process and the volatility spillover between the Dow Jones Industrial Average (DJIA) index and the index futures, based on a bivariate EGARCH model, indicating a significant bi-directional flow of information between the two indices.
Some existing literature comparatively analyses the relationship of corporate social responsibility and financial performance of companies listed on sustainable indices and those listed on general indices. A recent study by Alshehhi et al. (2018) use content analysis to examine the literature concerning the impact of corporate sustainability on corporate financial performance and find that 78% of the publications opine a positive relationship between corporate social responsibility and financial performance. Lopez et al. (2007) study the difference in the performance indicators between European firms that have adopted corporate social responsibilities (CSR) and others that have not, selecting the firms listed on the Dow Jones Sustainability Index and others on the Dow Jones Global Index. On similar lines, Gallego-Alvarez et al. (2014); Patari et al. (2012); Pilar Marti et al. (2015); Rajnoha et al. (2016, 2017) and Skare and Golja (2012) analyze the financial performance of companies with respect to their adoption of social responsibilities. Santis et al. (2016) evaluate the performance of companies listed in the corporate sustainability index in comparison with the performance of companies listed in the Sao Paulo Stock Exchange Index. Similarly, Pilar Marti et al. (2015) analyze the firms listed on the Stoxx Europe 600 Index and the Stoxx Europe Sustainability Index. Considering the growth in the amount of funds invested in the Socially Responsible Investments globally to around US$6.5 trillion, while around US$55 billion is placed in the Australian market, Tularam et al. (2010) examine the relationship of the Australian SRI market with fourteen other markets, namely—Canada, Denmark, France, Germany, Hong Kong, Ireland, Japan, Netherlands, Norway, South Africa, Sweden, Switzerland, United Kingdom, and the United States during the period 1994–2009, using the DCC-GARCH model.
The relationship between social, environmental and financial performance in companies has been a subject of debate but the results obtained so far are not conclusive (Lassala et al. 2017). Stock exchanges have created indices for more sustainable business, with a growing number of companies joining them—the return generated by firms in this profile remains controversial. Santis et al. (2016) compare the companies listed in the corporate sustainability index with companies listed in the Sao Paulo Stock Exchange Index and conclude that characteristics such as the sectoral classification have more influence on firms’ financial performance than their investments in sustainable initiatives. Lo and Sheu (2007) and Skare and Golja (2012) examine the impact of the CSR practices on the financial performance of the firm and conclude that CSR firms, on average, perform better financially than the non-CSR firms, and by adopting sustainable practices, they are in a better position to be rewarded by the investors with a higher valuation. Charlo et al. (2015) study the Spanish sustainability index, the FTSE4Good IBEX (the sustainable market index created by partnership between Financial Times Stock Exchange (FTSE) Group and Bolsas y Mercados Espanoles, Spanish stock exchange market) and opine that socially responsible corporations obtain higher profits, for the same level of systematic risk and show greater sensitivity to market information. Likewise, Liket and Maas (2016), utilize the data from 2006–2009, for a sample of Dow Jones Sustainability Index and conclude that corporate social performance has little impact on the company’s financial performance, company size, and profitability. Additionally, Fowler and Hope (2007) highlight that the entry of the Dow Jones and FTSE (the FTSE4Good sustainable market indices launched by Financial Times Stock Exchange Group) in the market of sustainable responsible indices and the increase in index licensees, indicate the growing interest of companies and the fund managers using the money under management in the sustainable indices.
Considering the pre-crisis period from 2003–2007 that marked the increase in Socially Responsible Investment worldwide, Ortas and Moneva (2011) examined the market reaction to the company’s inclusion in, and exclusion from, the Dow Jones Sustainability Stoxx Index, and opine that investors value the non-excluded companies more in achieving a good level of corporate social performance and corporate financial performance. Consistently, Lopez et al. (2007) study the pre-crisis period from 1999–2004 and conclude that corporate social responsibility practices have a negative impact on the company’s financial performance over the short term, which eventually decreases over the longer time frame. With a post-crisis period from 2012–2016, Alexandre and De Francisco (2018) examine the sustainable practices of the firms listed on the Corporate Sustainability Index, with respect to the Brazilian stock market and find that environmental, human resource, and organizational management as the baseline for the implementation of the sustainable practices.
On the other hand, relating to the 2008–2013 time frame, involving the global financial crisis of 2008, Ortas et al. (2014) find that social and responsible investment strategies as less risky in comparison to the conventional investment avenues, specifically during the periods of maximum market instability. Studying the same crisis of 2008, del Mar Miralles-Quiros et al. (2017) find that investors value companies with sustainability leadership, which is proxied by its inclusion in the Dow Jones Sustainability Index Europe. Other studies considering the period of market crisis, include Antonakakis et al. (2016); Brzeszczynski and McIntosh 2014; Mensi et al. (2017); Ransariya and Bhayani (2015); Schmid et al. (2017); de Souza Cunha and Samanez (2013), and la Torre et al. (2016).
There is immense research on the U.S.’ Sustainability Indices (Antonakakis et al. 2016; Mensi et al. 2017; Giannarakis et al. 2011; Lopez et al. 2007; Mensi et al. 2017; Ortas and Moneva 2011 and la Torre et al. 2016), Europe’s Sustainability Index (Charlo et al. 2015, 2017; Lopez et al. 2007; del Mar Miralles-Quiros et al. 2017; Ortas et al. 2014; Pilar Marti et al. 2015; Stolowy and Paugam 2018), and Australian markets (Lokuwaduge and Heenetigala 2017; Tularam et al. 2010). However, not much of the literature is available on the economies of developing countries (Talan and Sharma 2019). Alshehhi et al. (2018) comment on the literature trends relating to the relationship between corporate sustainability and corporate financial performance, and opine that the number of similar publications from the developing countries lags behind those of the developed countries, indicating the need for more research in the economies of the developing economies. This paper incorporates this field of study.
An extensive survey of the literature reveals that, although there are papers that evaluate sustainable indices, namely the Dow Jones Sustainability Index (Antonakakis et al. 2016; Giannarakis et al. 2011; Hsu et al. 2008; Lopez et al. 2007; del Mar Miralles-Quiros et al. 2017; Skare and Golja 2012), FTSE4Good-IBEX (Charlo et al. 2015, 2017; Lassala et al. 2017; Ortas et al. 2014), and the IPC sustainability (IPCS) index (la Torre et al. 2016), corporate environmental sustainability reporting (CESR) index (Ortas et al. 2015); no studies have evaluated the relationship between the Thomson Reuters Sustainable Indices and their conventional alternatives namely the MSCI stock market indices worldwide.
Most of the published research has focused on the returns of the sustainable indices compared with the traditional market indices (Fowler and Hope 2007; Mensi et al. 2017; de Souza Cunha and Samanez 2013; la Torre et al. 2016; Vives and Wadhwa 2012), or the financial performance of the companies listed on the sustainability index relative to the companies listed on the conventional market indices. (Alexandre and De Francisco 2018; Alshehhi et al. 2018; Lassala et al. 2017; Santis et al. 2016). However, the extant literature does not include the understating of the volatility spillovers and the inter-dependency between the sustainable indices and the conventional market indices (Sadorsky 2014). Modelling and forecasting volatility is an essential component of the modern day financial market because precise estimates of volatility, and the information on the interdependency of the two set of indices, shall assist in derivative pricing, portfolio optimization, risk management, and hedging. (Balcilar et al. 2017; Mensi et al. 2017). Balcilar et al. (2017) opines that in comparison to the conventional stocks, sustainable investment options improve the risk/return profile of the portfolios. This raises the need for an understanding about the volatility dynamics and the inter-relatedness between the sustainable and the conventional indices. Hence, the novelty of this paper lies in the fact that it examines the financial returns and the volatility spillover between these afore-mentioned sustainable indices and the conventional market indices, thereby addressing an important gap in the literature.
3. Methodology
This article comparatively analyzes the financial returns of the S-Network global indices, namely the developed markets (excluding the US) ESG index (TRESGDX), emerging markets ESG index (TRESGEX), US large-cap ESG index (TRESGUS), and Europe ESG index (TRESGEU), and their reciprocating alternatives from both the developed and the emerging markets, namely MSCI World index (MSCI W), MSCI All Country World Equity index (MSCI ACWI), MSCI USA index (MSCI USA), MSCI Europe Australasia Far East index (MSCI EAFE), MSCI Emerging Markets index (MSCI EM), and MSCI Europe index (MSCI EU). The study also focusses on the volatility and volatility spillover between these indices. Daily closing prices of all the benchmark indices are taken for the five-year period from the 1 January 2013 to 31 December 2017, on the lines of the period selection in extant literature, which uses five year data (Alexandre and De Francisco 2018; Tse 1999; Ortas and Moneva 2011; Ortas et al. 2014; de Souza Cunha and Samanez 2013; la Torre et al. 2016).
The paper takes the log of the ten series and arrives at their respective daily returns. These return series are evaluated for their stationarity, and all further analysis are performed on their daily return values i.e., the log of the ten series. These variables are named as r_m_w, r m_acwi, r_m_usa, r_m_eafe, r_m_em, r_m_eu, r_ tdx, r_tex, r_tus, and r_teu. Data analysis starts with the computation of the descriptive statistics, which includes the presentation of mean, median, standard deviation, skewness, kurtosis, Jarque-Bera statistic, and coefficient of variation. The paper then proceeds with the econometric analysis, along with the respective line graphs of the series. Augmented Dickey-Fuller (ADF) unit root test is applied to examine whether or not the series are stationary. The following equation explains the basic concept of the unit root testing:
where are optional exogenous repressors, which consist of a constant, r and d are the parameters to be estimated, and is assumed to be white noise. If |p| ≥ 1, then y is a non-stationary series. If |p| ≤ 1, then y is a stationary series. Hence, we evaluate the hypothesis of stationary by testing whether the absolute value of |p| is less than one.
The standard Dicky-Fuller test is carried out by estimating Equation (2) after subtracting from both sides of the equation,
This is followed with the Granger causality check to assess the volatility of the series. The paper applies the auto-regressive conditional heteroscedasticity (ARCH) family model. The relevant ARCH family model is chosen, using Akaike Information Criterion (AIC) and Schwarz Information Criterion SIC as benchmarks, where the model with lowest AIC and SIC values is chosen to be applied in individual series, which is also evident in the studies by Bildirici and Ersin (2009); Su (2010); Dimitriou et al. (2013); Kalu (2015); Kenourgios and Dimitriou (2015); Tse (1999) and Wang and Moore (2008). To study the return linkages between both the set of indices, the Johansen’s cointegration test is applied. Finally, the vector error correction model (VECM) is applied to test the volatility spillover between the sustainable indices and their conventional alternatives, on the lines of extant literature which employs VECM model to test volatility spillover (Abdullah et al. 2016; Bellalah et al. 2016; Huo and Ahmed 2018; Sehgal et al. 2015; Humpe and Macmillan 2007).
The series are further tested for ARCH effect that is the serial correlation of the heteroscedasticity. The ARCH effect measures the risk of an asset while this while this helps detect the time-varying phenomenon in the conditional volatility, thereby suggesting different types of models (ARCH/GARCH) to capture these dynamics (Figure 1).

Figure 1.
Methodology to test the ARCH effect.
As detailed further in Section 4 of this paper, the p-value of the chi-square leads to the rejection of the null hypothesis—‘there is no ARCH effect’ indicates the presence of ACRH effect in all the series. Therefore, we proceed to apply the ARCH/GARCH modelling. The most appropriate ARCH family model is chosen on the basis of the AIC and SIC values. As per the AIC and SIC value criterion, the lower the values of AIC and SIC, the better the model. Out of the ARCH (5,0), GARCH (1,1), TARCH and EGARCH models, EGARCH reported the lowest AIC and SIC values for all the ten series. The EGARCH model, also known as the exponential GARCH model was proposed by Nelson (1991). The EGARCH model can be explained by the following equation (Su and Fleisher 1998; Brooks 2008; Su 2010):
EGARCH model is advocated for various reasons; first, since log is modelled, even if the parameters are negative, will be positive. Hence, there is no need to impose non-negativity constraints on the model parameters. Second, asymmetries are allowed. If the relationship between volatility and returns is negative, will be negative. The parameter represents a magnitude effect of the model, the “GARCH” effect. measures the conditional volatility. When is relatively large, then volatility takes a long time to die out. EGARCH model also exhibits the leverage effect, which is a negative correlation between the past return and future volatility of return.
The article further applies Johansen’s cointegration analysis on the series under reference to check for the cointegration among them. This test also enables the examination of the volatility spillover between the sustainability indices and the conventional indices in the market. The co-integration test is applied on the absolute series (which is of a non-stationarity nature), rather than the return series.
The co-integration test is followed up by the VECM. A VECM model is restricted VAR designed for use with non-stationary series that are cointegrated. The VECM has cointegration relations, so that the long run behavior of the extraneous variables can be eliminated from converging to their cointegrating relations while adjusting the short-run dynamics. VECM can be stated as:
If Π = 0, then there is no cointegration.
4. Results
In order to get comparative insights into the risks and returns from the sustainability indices and the conventional indices under reference, this paper computes descriptive statistics i.e., the mean, median, minimum, maximum, standard deviation, skewness, and kurtosis for understanding the behavior of the series, along with the p-value of Jarque-Bera statistic to check for the normality of the series.
Table 1 shows that the average daily returns of MSCI ACWI, MSCI EAFE, MSCI EM, MSCI EU, MSCI USA, MSCI W, TRESGDX, TRESGEU, TRESGEX, TRESGUS are 0.0317 per cent, 0.0185 per cent, 0.0068 per cent, 0.0163 per cent, 0.0480 per cent, 0.0347 per cent, 0.0186 per cent, 0.0197 per cent, 0.0051 per cent, and 0.0524 per cent respectively, concluding that MSCI USA gives the highest average return on a daily basis. Average annual returns for the ten indices are found to be 8.26 per cent, 4.84 per cent, 1.77 per cent, 4.24 per cent, 12.5 per cent, 9.04 per cent, 4.52 per cent, 5.15 per cent, 1.35 per cent, and 13.64 per cent, respectively. This depicts that on average, TRESGUS provides the highest return out of all the indices under reference. Additionally, the maximum and minimum value is the highest and lowest (both) in case of TRESGEU. Table 1 also reports the skewness and kurtosis values of the series under reference. The table also discusses the standard deviation of the various indices under the study and imply that MSCI ACWI is the series with the least variations, followed by MSCI World and MSCI USA, while on the other hand, TRESGEU exhibits the highest variation in its values. The Jarque-Bera probability value is 0.00000 for all ten indices, which indicates that the null hypothesis of normality can be rejected for all ten indices, concluding that the series under reference are non-normal. The application of the augmented-Dicky Fuller (ADF) unit root test on all the ten series reveal the rejection of the null hypothesis i.e., series have a unit root, concluding that the series under reference are stationary. As suggested by existing literature (see for example, Kuwornu and Owusu-Nantwi 2011; Sharma and Mishra 2015; Sharma and Gupta 2015), we proceed by applying the econometric analysis on the reference series.

Table 1.
Descriptive statistics of the sustainable and conventional indices.
The following are line graphs of the various indices, representing the stationarity of the series under study.
Figure 2 presents the combined graph of returns of all ten market indices during the study period from 2013–2017. It is evident that the indices are quite volatile and highly inter-dependent throughout the concerned time period.
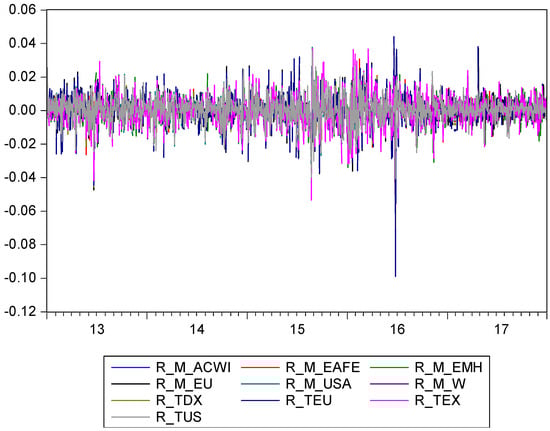
Figure 2.
Consolidated graph of the ten indices.
Further, Granger’s causality test is applied to check the causality between the reference series. In case of MSCI ACWI and MSCI EAFE, the results exhibited the rejection of the null hypothesis i.e., MSCI EAFE does not Granger cause MSCI ACWI and vice-versa, hence Granger causality runs both ways between MSCI EAFE and MSCI ACWI. This index exhibits the same behavior with certain other indices, namely MSCI USA and TRESGUS. MSCI World is seen to witness Granger causality running both ways, with the maximum indices under study namely with MSCI EU, MSCI USA, TRESGUS and TRESGEU. The same is the case for MSCI EM with MSCI EAFE, MSCI USA, and TRESGUS. The same phenomena are also evident between MSCI EAFE and MSCI USA. On the other hand, we accept the null hypothesis that MSCI EM does not Granger cause MSCI ACWI, but the other way around, results reveal rejection of the same hypothesis. The same phenomena are present where Granger causality runs one way from MSCI ACWI to MSCI EU, TRESGDX, TRESGEU, and TRESGEX. There is one way causality that runs from MSCI USA to MSCI EU, TRESGDX, TRESGEU, and TRESGEX. MSCI World Granger cause TRESGDX, TRESGEX, MSCI ACWI, MSCI EAFE, and MSCI EM, thereby resulting in one way causality. TRESGDX value reveals one way Granger causality with TRESGEU, MSCI EAFE, MSCI EM, and MSCI EU, while TRESGEU value causes one way Granger causality with MSCI EU, MSCI EAFE, and MSCI EM. The MSCI EU Index statistic reveals one way Granger causality with MSCI EAFE and MSCI EM. In case of the sustainable indices, TRESGEX statistic reveals one-way causality to MSCI EAFE, MSCI EM, MSCI EU, TRESGDX and TRESGEU, while TRESGUS value exhibits one way Granger causality to MSCI EU, MSCI EAFE, TRESGDX, TRESGEX, and TRESGEU. Clearly, MSCI World, MSCI ACWI, TRESGEX, and TRESGUS statistics reveal one way Granger causality on the maximum number of indices under reference.
To check for the volatility behavior of the index series, the ARCH family models are applied on the data series, the stationarity of which is already proven through the ADF unit root test.
In line with the discussion presented under Section 3 of this paper, we proceed with the EGARCH analysis.
Table 2 indicates that all the values of are statistically significant (at 95% level of confidence). The values of for all the series are more than 0.9 implying that volatility is quite high and takes a longer time to die out, with the value being relatively low for both the US indices i.e., MSCI USA and TRESGUS.
Table 2.
Auto-regressive conditional heteroskedasticity (ARCH) and GARCH Coefficients for the sustainable and conventional market indices.
All the values of in Table 2 are statistically significant (at 95% level of confidence) and relatively larger than 0.1 throughout the markets, except for the emerging market indices, namely MSCI EM and TRESGEX, and MSCI ACWI, which means that the volatility is sensitive to market events for these indices.
Additionally, the values of leverage effect as measured by are negative and statistically significant at 95% level of confidence throughout the markets, which indicates that good news generates less volatility in the market than the bad news.
The overall analysis of Table 2 indicates that both the sustainable indices and the conventional indices are volatile throughout the period under study, with the US indices being relatively less volatile, and hence taking time to die down. For majority of indices, the values report sensitivity to the market events, except in the case of both the emerging market indices and the MSCI ACWI. Also, the leverage effect is observed to be negative and is statistically significant for all the indices.
This paper further applies Johansen’s co-integration analysis on the series under reference to check for the co-integration among them. Table 3 tests the null hypothesis that no co-integrating equation exists between the series under reference. The trace statistic value of 3866.44 is observed to be greater than the corresponding critical value i.e., 239.23. Therefore, the H0 of no co-integrating equation is rejected, while results reveal the acceptance of H0 of ‘at most 10’ cointegrating equation at 0.05 level.
Table 3.
Results from Johansen’s cointegration analysis: Trace statistics.
Similarly, the results of the maximum eigenvalue statistic (Table 4) exhibit that at no cointegrating equation, maximum eigen statistic is 693.58 which is greater than the corresponding critical value 64.50. Therefore, the H0 of no co-integrating equation is rejected which means that there is at least one co-integrating equation. Clearly, the results indicate, at most, 10 co-integrating equation at the 0.05 level of significance. Hence, in both the tests, there is at most 10 co-integrating equations.
Table 4.
Results from Johansen’s co-integration analysis: Max Eigen value.
To further explain the co-integrating equations, the application of VECM model is adopted. The results of the VECM are summarized below in Table 5 and Table 6.
Table 5.
Results from vector error correction model applied for conventional and sustainable analysis.
Table 6.
Results from vector error correction model applied for conventional and sustainable analysis (cont.).
From the application of VECM, it is observed that the integration of the series with the other is established at 0.95 per cent confidence level, if the value in the table is more than 1.96. Table 6 exhibits that the returns at R_M_ACWI, at the lag of 1 highly influences the returns from all the four sustainable indices, as well as the R_M_USA, R_M_EAFE and R_M_EU. Additionally, it continues to impact the returns of the same indices at the lag of 2, but with a lower value. RM_EAFE affects all the indices, barring R_M_ACWI and R_M_EMH at the lag of 1, but the impact reduces to few indices at the second lag. R_M_EMH strongly controls the returns from R_M_EMH series, however at the second lag, the impact becomes disbursed to other indices. Similar to R_M_EAFE, the R_M_EU and R_M_USA series influence the returns of all the indices, barring returns from the R_M_W series at the lag of 1, and continues the impact with the same consistency at the second lag as well. The R_M_W series is observed to impact the returns from all the other indices at the lag of 1, barring only R_M_ACWI, R_M_EAFE and R_M_EMH in the second lag. R_TDX influences the returns from all the indices, except for R_M_EMH and R_M_W at lag 1, while its impacts become completed eroded from the sustainable indices in the second lag. The other sustainable indices, namely R_TEX, R_TEU, and R_TUS, continue to impact the returns from the sustainable indices at the second lag. Overall, it is observed that the returns from the sustainable indices are more influenced by the index series in comparison to the conventional indices. The degree of impact on the returns of the sustainable indices is also evident to be higher relative to the regular stock market indices.
5. Conclusions and Implications
Analysts and investors usually employ sustainability indices as an integrated measure of a firm’s sustainability performance, considering that only those companies that outperform their peers in an in-depth analysis of economic, environmental, and social criteria, are included in sustainability index. This thereby categorizes them as industry sustainability leaders (del Mar Miralles-Quiros et al. 2017).
This study concludes that over the period of five years, TRESGUS provides the highest return out of all the indices under reference on an average. On the other hand, MSCI ACWI is the least risky series, followed by MSCI World and MSCI USA, while TRESGEU exhibits the highest variation in its values. The study finds TRESGUS as a favourable investment option, offering the highest return with a convenient level of risk.
Additionally, the paper finds evidence of bi-directional volatility spillover between the sustainable indices and the conventional indices. The results from the sustainable indices impact their alternatives and vice-versa. In general, it is evident that there is a flow of information between the two sets of indices and hence, these markets are integrated with each other. The information from one index can be used to predict the behaviour of the other index. Accordingly, financial managers and professionals can obtain more insights regarding investment decisions, and the study further suggests that their portfolios should consider both the indices, with the perspective of diversifying the risk and hedging, and reap benefits of the same (Balcilar et al. 2017; Sadorsky 2014). Additionally, the government may use such information, while drafting public policies, and civil societies may employ them in monitoring and controlling the social and environmental responsibility of firms. Similar results are evident in the study by Charlo et al. (2017), where the findings exhibit no significant difference between the two groups of companies listed in the sustainability index and the traditional market index, and responsible companies provide similar returns to those of the conventional companies.
Theses finding contradict the popular belief (Hong and Kacperczyk 2009; Lee et al. 2010; Lopez et al. 2007; de Souza Cunha and Samanez 2013) that the sustainable investment options yield lower financial returns as against traditional investment options.
The results indicate that there is no significant difference in the performance between sustainable indices and the traditional conventional indices, being a good substitute to the latter, and this is partially similar to the findings of other studies for instance, Charlo et al. (2017); Santis et al. (2016) and la Torre et al. (2016).
Author Contributions
Conceptualization, G.D.S and M.J.; Methodology, M.J. and G.D.S.; Validation, G.D.S. and M.S.; Formal Analysis, G.D.S. and M.J.; Data Curation, M.J. and G.D.S.; Writing–Original Draft Preparation, M.J.; Writing – Review and Editing, M.J., M.S. and G.D.S.; and Supervision, G.D.S.
Funding
This research received no external funding.
Conflicts of Interest
The authors declare no conflict of interest.
References
- Abdullah, Ahmad Monir, Buerhan Saiti, and Mansur Masih. 2016. The impact of crude oil price on Islamic stock indices of South East Asian countries: Evidence from MGARCH-DCC and wavelet approaches. Borsa Istanbul Review 16: 219–32. [Google Scholar] [CrossRef]
- Alexandre, Alamo, and Antonio Carlos De Francisco. 2018. Organizational Sustainability Practices: A Study of the Firms Listed by the Corporate Sustainability Index. Sustainability 10: 226. [Google Scholar] [CrossRef]
- Alshehhi, Ali, Haitham Nobanee, and Nilesh Khare. 2018. The Impact of Sustainability Practices on Corporate Financial Performance: Literature Trends and Future Research Potential. Sustainability 10: 494. [Google Scholar] [CrossRef]
- Antonakakis, Nikolaos, Vassilios Babalos, and Clement Kyei. 2016. Predictability of sustainable investments and the role of uncertainty: Evidence from a non-parametric causality-in-quantiles test. Applied Economics 48: 4655–65. [Google Scholar] [CrossRef]
- Balcilar, Mehmet, Riza Demirer, and Rangan Gupta. 2017. Do Sustainable Stocks Offer Diversification Benefits for Conventional Portfolios? An Empirical Analysis of Risk Spillovers and Dynamic Correlations. Sustainability 9: 1799. [Google Scholar] [CrossRef]
- Bellalah, Makram, Mondher Bellalah, and Haifa Boussada. 2016. Modeling Transmissions of Volatility Shocks: Application to CDS Spreads during the Euro Area Sovereign Crisis. International Journal of Business 21: 1–25. [Google Scholar]
- Bianconi, Marcelo, Joe A Yoshino, and Mariana O Machado de Sousa. 2013. BRIC and the US financial crisis: An empirical investigation of stock and bond markets. Emerging Markets Review 14: 76–109. [Google Scholar] [CrossRef]
- Bildirici, Melike, and Özgür Ömer Ersin. 2009. Improving forecasts of GARCH family models with the artificial neural networks: An application to the daily returns in Istanbul Stock Exchange. Expert Systems with Applications 36: 7355–62. [Google Scholar] [CrossRef]
- Brooks, Chris. 2008. Introductory Econometrics for Finance. Finance. Cambridge: Cambridge University Press. [Google Scholar] [CrossRef]
- Brzeszczynski, Janusz, and Graham McIntosh. 2014. Performance of Portfolios Composed of British SRI Stocks. Journal of Business Ethics 120: 335–62. [Google Scholar] [CrossRef]
- Charlo, Maria J., Ismael Moya, and Ana M Munoz. 2015. Sustainable Development and Corporate Financial Performance: A Study Based on the FTSE4Good IBEX Index. Business Strategy and the Environment 24: 277–88. [Google Scholar] [CrossRef]
- Charlo, Maria J., Ismael Moya, and Ana M Munoz. 2017. Sustainable Development in Spanish Listed Companies: A Strategic Approach. Corporate Social Responsibility and Environmental Management 24: 222–34. [Google Scholar] [CrossRef]
- de Souza Cunha, F. A., and C. P. Samanez. 2013. Performance Analysis of Sustainable Investments in the Brazilian Stock Market: A Study About the Corporate Sustainability Index (ISE). Journal of Business Ethics 117: 19–36. [Google Scholar] [CrossRef]
- del Mar Miralles-Quiros, Maria, Jose Luis Miralles-Quiros, and Irene Guia Arraiano. 2017. Sustainable Development, Sustainability Leadership and Firm Valuation: Differences across Europe. Business Strategy and the Environment 26: 1014–28. [Google Scholar] [CrossRef]
- Dimitriou, Dimitrios, Dimitris Kenourgios, and Theodore Simos. 2013. Global Financial Crisis and Emerging Stock Market Contagion: A Multivariate FIAPARCH-DCC Approach. International Review of Financial Analysis 30: 46–56. [Google Scholar] [CrossRef]
- Fowler, Stephen J., and Chris Hope. 2007. A Critical Review of Sustainable Business Indices and their Impact. Journal of Business Ethics 76: 243–52. [Google Scholar] [CrossRef]
- Gallego-Alvarez, Isabel, Isabel M Garcia-Sanchez, and Cleber da Silva Vieira. 2014. Climate Change and Financial Performance in Times of Crisis. Business Strategy and the Environment 23: 361–74. [Google Scholar] [CrossRef]
- Giannarakis, Grigoris, Nikolaos Litinas, and Nikolaos Sariannidis. 2011. Evaluation of corporate social responsibility performance standards. African Journal of Business Management 5: 7367–74. [Google Scholar] [CrossRef]
- Guerard, John B, Jr. 1997a. Additional Evidence on the Cost of Being Socially Responsible in Investing. The Journal of Investing 6: 31–36. [Google Scholar] [CrossRef]
- Guerard, John B, Jr. 1997b. Is there a cost to being socially responsible in investing. The Journal of Investing 6: 11–18. [Google Scholar] [CrossRef]
- Hong, Harrison, and Marcin Kacperczyk. 2009. The price of sin: The effects of social norms on markets. Journal of Financial Economics 93: 15–36. [Google Scholar] [CrossRef]
- Hsu, Chih-Chiang, Chih-Ping Tseng, and Yaw-Huei Wang. 2008. Dynamic hedging with futures: A copula-based GARCH model. Journal of Futures Markets 28: 1095–116. [Google Scholar] [CrossRef]
- Humpe, Andreas, and Peter Macmillan. 2007. Can Macroeconomic Variables Explain Long Term Stock Market Movements? A Comparison of the US and Japan. Rochester: SSRN, vol. 44, Available online: https://www.st-andrews.ac.uk/~wwwecon/CDMA/papers/wp0720.pdf (accessed on 28 December 2018).
- Huo, Rui, and Abdullahi Dahir Ahm. 2018. Relationships between Chinese stock market and its index futures market: Evaluating the impact of QFII scheme. Research in International Business and Finance 44: 135–52. [Google Scholar] [CrossRef]
- Kalu, Emenike O. 2015. Dynamic Correlation between Stock Market Returns and Crude Oil Prices: Evidence from a Developing Economy. Indonesian Capital Market Review 7: 102–12. [Google Scholar] [CrossRef]
- Kenourgios, Dimitris, and Dimitrios Dimitriou. 2015. Contagion of the Global Financial Crisis and the real economy: A regional analysis. Economic Modelling 44: 283–93. [Google Scholar] [CrossRef]
- Kuwornu, John K. M., and Victor Owusu-Nantwi. 2011. Macroeconomic Variables and Stock Market Returns: Full Information Maximum Likelihood Estimation. Research Journal of Finance and Accounting 2: 49–64. [Google Scholar]
- la Torre, Oscar, Evaristo Galeana, and Dora Aguilasocho. 2016. The use of the sustainable investment against the broad market one. A first test in the Mexican stock market. European Research on Management and Business Economics 22: 117–23. [Google Scholar] [CrossRef]
- Lassala, Carlos, Andreea Apetrei, and Juan Sapena. 2017. Sustainability matter and financial performance of companies. Sustainability 9: 1498. [Google Scholar] [CrossRef]
- Lee, Darren D., Jacquelyn Humphrey, Karen L. Benson, and Jason Ahn. 2010. Socially Responsible Investment Fund Performance: The Impact of Screening Intensity. Accounting and Finance 50: 351–70. [Google Scholar] [CrossRef]
- Liket, Kellie, and Karen Maas. 2016. Strategic Philanthropy: Corporate Measurement of Philanthropic Impacts as a Requirement for a “Happy Marriage” of Business and Society. Business and Society 55: 889–921. [Google Scholar] [CrossRef]
- Lo, Shih-Fang, and Her-Jiun Sheu. 2007. Is corporate sustainability a value-increasing strategy for business? Corporate Governance-An International Review 15: 345–58. [Google Scholar] [CrossRef]
- Lokuwaduge, Chitra Sriyani De Silva, and Kumudini Heenetigala. 2017. Integrating Environmental, Social and Governance (ESG) Disclosure for a Sustainable Development: An Australian Study. Business Strategy and the Environment 26: 438–50. [Google Scholar] [CrossRef]
- Lopez, M Victoria, Arminda Garcia, and Lazaro Rodriguez. 2007. Sustainable development and corporate performance: A study based on the Dow Jones Sustainability Index. Journal of Business Ethics 75: 285–300. [Google Scholar] [CrossRef]
- Martinez-Ferrero, Jennifer, and Jose Valeriano Frias-Aceituno. 2015. Relationship Between Sustainable Development and Financial Performance: International Empirical Research. Business Strategy and the Environment 24: 20–39. [Google Scholar] [CrossRef]
- Mensi, Walid, Shawkat Hammoudeh, Idries Mohammad Wanas Al-Jarrah, Ahmet Sensoy, and Sang Hoon Kang. 2017. Dynamic risk spillovers between gold, oil prices and conventional, sustainability and Islamic equity aggregates and sectors with portfolio implications. Energy Economics 67: 454–75. [Google Scholar] [CrossRef]
- Nelson, Daniel B. 1991. Conditional heteroskedasticity in asset returns: A new approach. Econometrica 59: 347–70. [Google Scholar] [CrossRef]
- Ortas, Eduardo, and Jose M Moneva. 2011. Sustainability stock exchange indexes and investor expectations: Multivariate evidence from DJSI-Stoxx. Journal of Finance and Accounting 40: 395–416. [Google Scholar] [CrossRef]
- Ortas, Eduardo, Jose M Moneva, Roger Burritt, and Joanne Tingey-Holyoak. 2014. Does Sustainability Investment Provide Adaptive Resilience to Ethical Investors? Evidence from Spain. Journal of Business Ethics 124: 297–309. [Google Scholar] [CrossRef]
- Ortas, Eduardo, Isabel Gallego-Alvarez, and Igor Alvarez Etxeberria. 2015. Financial Factors Influencing the Quality of Corporate Social Responsibility and Environmental Management Disclosure: A Quantile Regression Approach. Corporate Social Responsibility and Environmental Management 22: 362–80. [Google Scholar] [CrossRef]
- Park, Sung Yong, and Sang Young Jei. 2010. Estimation and Hedging Effectiveness of Time-Varying Hedge Ration: Flexible Bivariate GARCH Approaches. Journal of Futures Markets 30: 71–99. [Google Scholar] [CrossRef]
- Patari, Satu, Ari Jantunen, Kalevi Kylaheiko, and Jaana Sandstrom. 2012. Does Sustainable Development Foster Value Creation? Empirical Evidence from the Global Energy Industry. Corporate Social Responsibility and Environmental Management 19: 317–26. [Google Scholar] [CrossRef]
- Pilar Marti, Carmen, Maria Rosa Rovira-Val, and Lisa Geneva Johanna Drescher. 2015. Are Firms that Contribute to Sustainable Development Better Financially? Corporate Social Responsibility and Environmental Management 22: 305–19. [Google Scholar] [CrossRef]
- Rajnoha, Rastislav, Petra Lesnikova, and Antonin Koraus. 2016. From Financial Measures To Startegic Performance Measurement System And Corporate Sustainability: Emperical Evidence From Slovakia. Economics and Sociology 9: 134–52. [Google Scholar] [CrossRef] [PubMed]
- Rajnoha, Rastislav, Petra Lesnikova, and Vladimir Krajcik. 2017. Influence of Business Performance Measuremnet Systems and Corporate Sustainability Concept To Overall Business Performance: “Save The Planet And Keep Your Performance”. E and M Ekonomie A Management 20: 111–28. [Google Scholar] [CrossRef]
- Ransariya, Shailesh N., and Sanjay J. Bhayani. 2015. Relationship between Corporate Social Responsibility and Financial Performance of RIL. Pacific Business Review International 7: 66–75. [Google Scholar]
- Sadorsky, Perry. 2014. Modeling volatility and conditional correlations between socially responsible investments, gold and oil. Economic Modelling 38: 609–18. [Google Scholar] [CrossRef]
- Santis, Paula, Andrei Albuquerque, and Fabiane Lizarelli. 2016. Do sustainable companies have a better financial performance? A study on Brazilian public companies. Journal of Cleaner Production 133: 735–45. [Google Scholar] [CrossRef]
- Schmid, Jochen, Marieta Olaru, and Ana-Maria Verjel. 2017. The effect of sustainable investments on the economic objectives of the company in relation to the total quality management. Amfiteatru Economic 19: 939–50. [Google Scholar]
- Sehgal, Sanjay, Wasim Ahmad, and Florent Deisting. 2015. An investigation of price discovery and volatility spillovers in India’s foreign exchange market. Journal of Economic Studies 42: 261–84. [Google Scholar] [CrossRef]
- Seo, Joo Hwan, Sung Yong Park, and Larry Yu. 2009. The analysis of the relationships of Korean outbound tourism demand: Jeju Island and three international destinations. Tourism Management 30: 530–43. [Google Scholar] [CrossRef]
- Sharma, Gagan Deep, and Mansi Gupta. 2015. Does the pre-open auction market improve efficiency of price discovery in stock markets? Evidence from India. Indian Journal of Finance 9. [Google Scholar] [CrossRef]
- S Sharma, Gagan Deep, and Namish Mishra. 2015. Return Linkages and Volatility Spillover Effect Between Stock Markets and Currency Markets. Review of Market Integration 7: 175–97. [Google Scholar] [CrossRef]
- Skare, Marinko, and Tea Golja. 2012. Corporate Social Responsibility and Corporate Financial Performance—Is There A Link? Ekonomska Istrazivanja-Economic Research 25: 215–42. [Google Scholar] [CrossRef]
- Stolowy, Herve, and Luc Paugam. 2018. The expansion of non-financial reporting: An exploratory study. Accounting and Business Research 48: 525–48. [Google Scholar] [CrossRef]
- Su, Chang. 2010. Application of EGARCH Model to Estimate Financial Volatility of Daily Returns: The Empirical Case of China. Gothenburg: University of Gothenburg. [Google Scholar]
- Su, Dongwei, and Belton M. Fleisher. 1998. Risk, Return and Regulation in Chinese Stock Markets. Journal of Economics and Business 50: 239–56. [Google Scholar] [CrossRef]
- Talan, Gaurav, and Gagan Sharma. 2019. Doing Well by Doing Good: A Systematic Review and Research Agenda for Sustainable Investment. Sustainability 11: 353. [Google Scholar] [CrossRef]
- Tse, Yiuman. 1999. Price Discovery and Volatility Spillovers in the DJIA Index and Futures Markets. J. Futures Mark. 19: 911–30. [Google Scholar] [CrossRef]
- Tularam, Gurudeo Anand, Eduardo Roca, and Victor S H Wong. 2010. Investigation of Socially Responsible Investment Markets (SRI) Using Dynamic Conditional Correlation (DCC) Method: Implications for Diversification. Journal of Mathematics and Statistics 6: 385–94. [Google Scholar] [CrossRef]
- Vives, Antonio, and Baljit Wadhwa. 2012. Sustainability indices in emerging markets: Impact on responsible practices and financial market development. Journal of Sustainable Finance and Investment 2: 318–37. [Google Scholar] [CrossRef]
- Wang, Ping, and Tomoe Moore. 2008. Stock market integration for the transition economies: Time-varying conditional correlation approach. The Manchester School 76: 116–33. [Google Scholar] [CrossRef]
© 2019 by the authors. Licensee MDPI, Basel, Switzerland. This article is an open access article distributed under the terms and conditions of the Creative Commons Attribution (CC BY) license (http://creativecommons.org/licenses/by/4.0/).