An Intersection–Union Test for the Sharpe Ratio


Abstract
1. Motivation
- (i)
- I derive closed-form expressions for the standard errors of the test statistics, instead of providing numerical results that have been obtained by bootstrapping, and
- (ii)
- I do this for the case but not (only) for .
2. The Intersection–Union Test
2.1. Gordin’s Condition
2.2. Asymptotic Properties of Sharpe Ratios
2.3. Empirical Study
3. Conclusions
Conflicts of Interest
Appendix A. Asymptotic Results
Appendix B. Correlograms


References
- Andrews, Donald W. K. 1991. Heteroskedasticity and autocorrelation consistent covariance matrix estimation. Econometrica 59: 817–58. [Google Scholar] [CrossRef]
- Berger, Roger L. 1997. Likelihood ratio tests and intersection–union tests. In Advances in Statistical Decision Theory and Applications. Edited by Subramanian Panchapakesan and Narayanaswamy Balakrishnan. Basel: Birkhäuser, pp. 225–37. [Google Scholar]
- Black, Fischer. 1976. Studies of stock price volatility changes. In Proceedings of the Business and Economics Section of the American Statistical Association. Washington: American Statistical Association, pp. 177–81. [Google Scholar]
- Bradley, Richard C. 2005. Basic properties of strong mixing conditions. A survey and some open questions. Probability Surveys 2: 107–44. [Google Scholar] [CrossRef]
- Brockwell, Peter J., and Richard A. Davis. 1991. Time Series: Theory and Methods, 2nd ed. Berlin/Heidelberg: Springer. [Google Scholar]
- Burgess, Andrew N. 2000. Statistical arbitrage models of the FTSE 100. In Computational Finance. Edited by Yaser S. Abu-Mostafa, Blake LeBaron, Andrew Lo and Andreas Weigend. Cambridge: MIT Press, pp. 297–12. [Google Scholar]
- Conrad, Jennifer, and Gautam Kaul. 1998. An anatomy of trading strategies. The Review of Financial Studies 11: 489–19. [Google Scholar] [CrossRef]
- DeMiguel, Victor, Lorenzo Garlappi, and Raman Uppal. 2009. Optimal versus naive diversification: How inefficient is the 1/N portfolio strategy? Review of Financial Studies 22: 1915–53. [Google Scholar] [CrossRef]
- Eagleson, Geoffrey K. 1975. On Gordin’s central limit theorem for stationary processes. Journal of Applied Probability 12: 176–79. [Google Scholar] [CrossRef]
- Federal Reserve Bank of St. Louis. 2018. Secondary Market 3-Month US Treasury Bill Rate. Available online: https://fred.stlouisfed.org (accessed on 25 February 2018).
- Fletcher, Jonathan. 2011. Do optimal diversification strategies outperform the 1/N strategy in U.K. stock returns? International Review of Financial Analysis 20: 375–85. [Google Scholar] [CrossRef]
- Frahm, Gabriel, and Uwe Jaekel. 2015. Tyler’s M-estimator in high-dimensional financial-data analysis. In Modern Nonparametric, Robust and Multivariate Methods. Edited by Klaus Nordhausen and Sara Taskinen. Berlin/Heidelberg: Springer, chp. 17. pp. 289–305. [Google Scholar]
- Frahm, Gabriel, Tobias Wickern, and Christof Wiechers. 2012. Multiple tests for the performance of different investment strategies. Advances in Statistical Analysis 96: 343–83. [Google Scholar] [CrossRef]
- Hamilton, James Douglas. 1994. Time Series Analysis. Princeton: Princeton University Press. [Google Scholar]
- Hanke, Michael, and Spiridon Penev. 2018. Comparing large-sample maximum Sharpe ratios and incremental variable testing. European Journal of Operational Research 265: 571–79. [Google Scholar] [CrossRef]
- Hayashi, Fumio. 2000. Econometrics. Princeton: Princeton University Press. [Google Scholar]
- Jobson, J. Dave, and Bob M. Korkie. 1981. Performance hypothesis testing with the Sharpe and Treynor measures. Journal of Finance 36: 889–908. [Google Scholar] [CrossRef]
- Jorion, Philippe. 1985. International portfolio diversification with estimation risk. Journal of Business 58: 259–78. [Google Scholar] [CrossRef]
- Ledoit, Olivier, and Michael Wolf. 2008. Robust performance hypothesis testing with the Sharpe ratio. Journal of Empirical Finance 15: 850–59. [Google Scholar] [CrossRef]
- Lo, Andrew W. 2002. The statistics of Sharpe ratios. Financial Analysts Journal 58: 36–52. [Google Scholar] [CrossRef]
- Low, Rand Kwong Yew, Robert Faff, and Kjersti Aas. 2016. Enhancing mean variance portfolio selection by modeling distributional asymmetries. Journal of Economics and Business 85: 49–72. [Google Scholar] [CrossRef]
- Memmel, Christoph. 2003. Performance hypothesis testing with the Sharpe ratio. Finance Letters 1: 21–23. [Google Scholar]
- Menkhoff, Lukas, Lucio Sarno, Maik Schmeling, and Andreas Schrimpf. 2012. Currency momentum strategies. Journal of Financial Economics 106: 660–84. [Google Scholar] [CrossRef]
- Mertens, Elmar. 2002. Comments on Variance of the iid Estimator in Lo. Technical Report. Basel: University of Basel. [Google Scholar]
- MSCI. 2018. End of day data, Country. Available online: https://www.msci.com/end-of-day-data-country (accessed on 25 February 2018).
- Muirhead, Robb J. 1982. Aspects of Multivariate Statistical Theory. Hoboken: John Wiley. [Google Scholar]
- Opdyke, John Douglas. 2007. Comparing Sharpe ratios: So where are the p-values? Journal of Asset Management 8: 308–36. [Google Scholar] [CrossRef]
- Politis, Dimitris N. 2003. The impact of bootstrap methods on time series analysis. Statistical Science 18: 219–30. [Google Scholar] [CrossRef]
- Romano, Joseph P., and Michael Wolf. 2005. Stepwise multiple testing as formalized data snooping. Econometrica 73: 1237–82. [Google Scholar] [CrossRef]
- Roy, Samarendra Nath. 1953. On a heuristic method of test construction and its use in multivariate analysis. Annals of Mathematical Statistics 24: 220–38. [Google Scholar] [CrossRef]
- Sawik, Bartosz. 2012. Downside risk approach for multi-objective portfolio optimization. In Operations Research Proceedings 2011. Edited by Klatte H.-J. Lüthi and K. Schmedders. Berlin/Heidelberg: Springer, pp. 191–96. [Google Scholar]
- Schmid, Friedrich, and Rafael Schmidt. 2009. Statistical inference for Sharpe’s ratio. In Interest Rate Models, Asset Allocation and Quantitative Techniques for Central Banks and Sovereign Wealth Funds. Edited by Arjan B. Berkelaar, Joachim Coche and Ken Nyholm. Basingstoke: Palgrave Macmillan, pp. 337–57. [Google Scholar]
- Sen, Pranab K., and Mervyn J. Silvapulle. 2002. An appraisal of some aspects of statistical inference under inequality constraints. Journal of Statistical Planning and Inference 107: 3–43. [Google Scholar] [CrossRef]
- Sharpe, William F. 1966. Mutual fund performance. Journal of Business 39: 119–38. [Google Scholar] [CrossRef]
- Shen, Qian, Andrew C. Szakmary, and Subhash C. Sharma. 2007. An examination of momentum strategies in commodity futures markets. Journal of Futures Markets 27: 227–56. [Google Scholar] [CrossRef]
- Szakmary, Andrew C., Qian Shen, and Subhash C. Sharma. 2010. Trend-following trading strategies in commodity futures: a re-examination. Journal of Banking and Finance 34: 409–26. [Google Scholar] [CrossRef]
- van der Vaart, Aad W. 1998. Asymptotic Statistics. Cambridge: Cambridge University Press. [Google Scholar]
- Vrugt, Evert B., Rob Bauer, Roderick Molenaar, and Tom Steenkamp. 2004. Dynamic Commodity Timing Strategies. Technical Report. Rochester: SSRN. [Google Scholar] [CrossRef]
- Zagrodny, Dariusz. 2003. An optimality of change loss type strategy. Optimization 52: 757–72. [Google Scholar] [CrossRef]
| 1. | A different question is whether some asset universe allows the investor to achieve a higher performance compared to another asset universe (Hanke and Penev 2018). |
| 2. | In order to identify the outperforming strategies, we would have to apply a multiple test. For more details on that topic, see Frahm et al. (2012) as well as Romano and Wolf (2005). |
| 3. | Any capital income that occurs during Period t is considered part of . |
| 4. | The total returns have been retrieved from the MSCI webpage (MSCI 2018). |
| 5. | The data have been obtained from the Federal Reserve Bank of St. Louis (FRED 2018). |
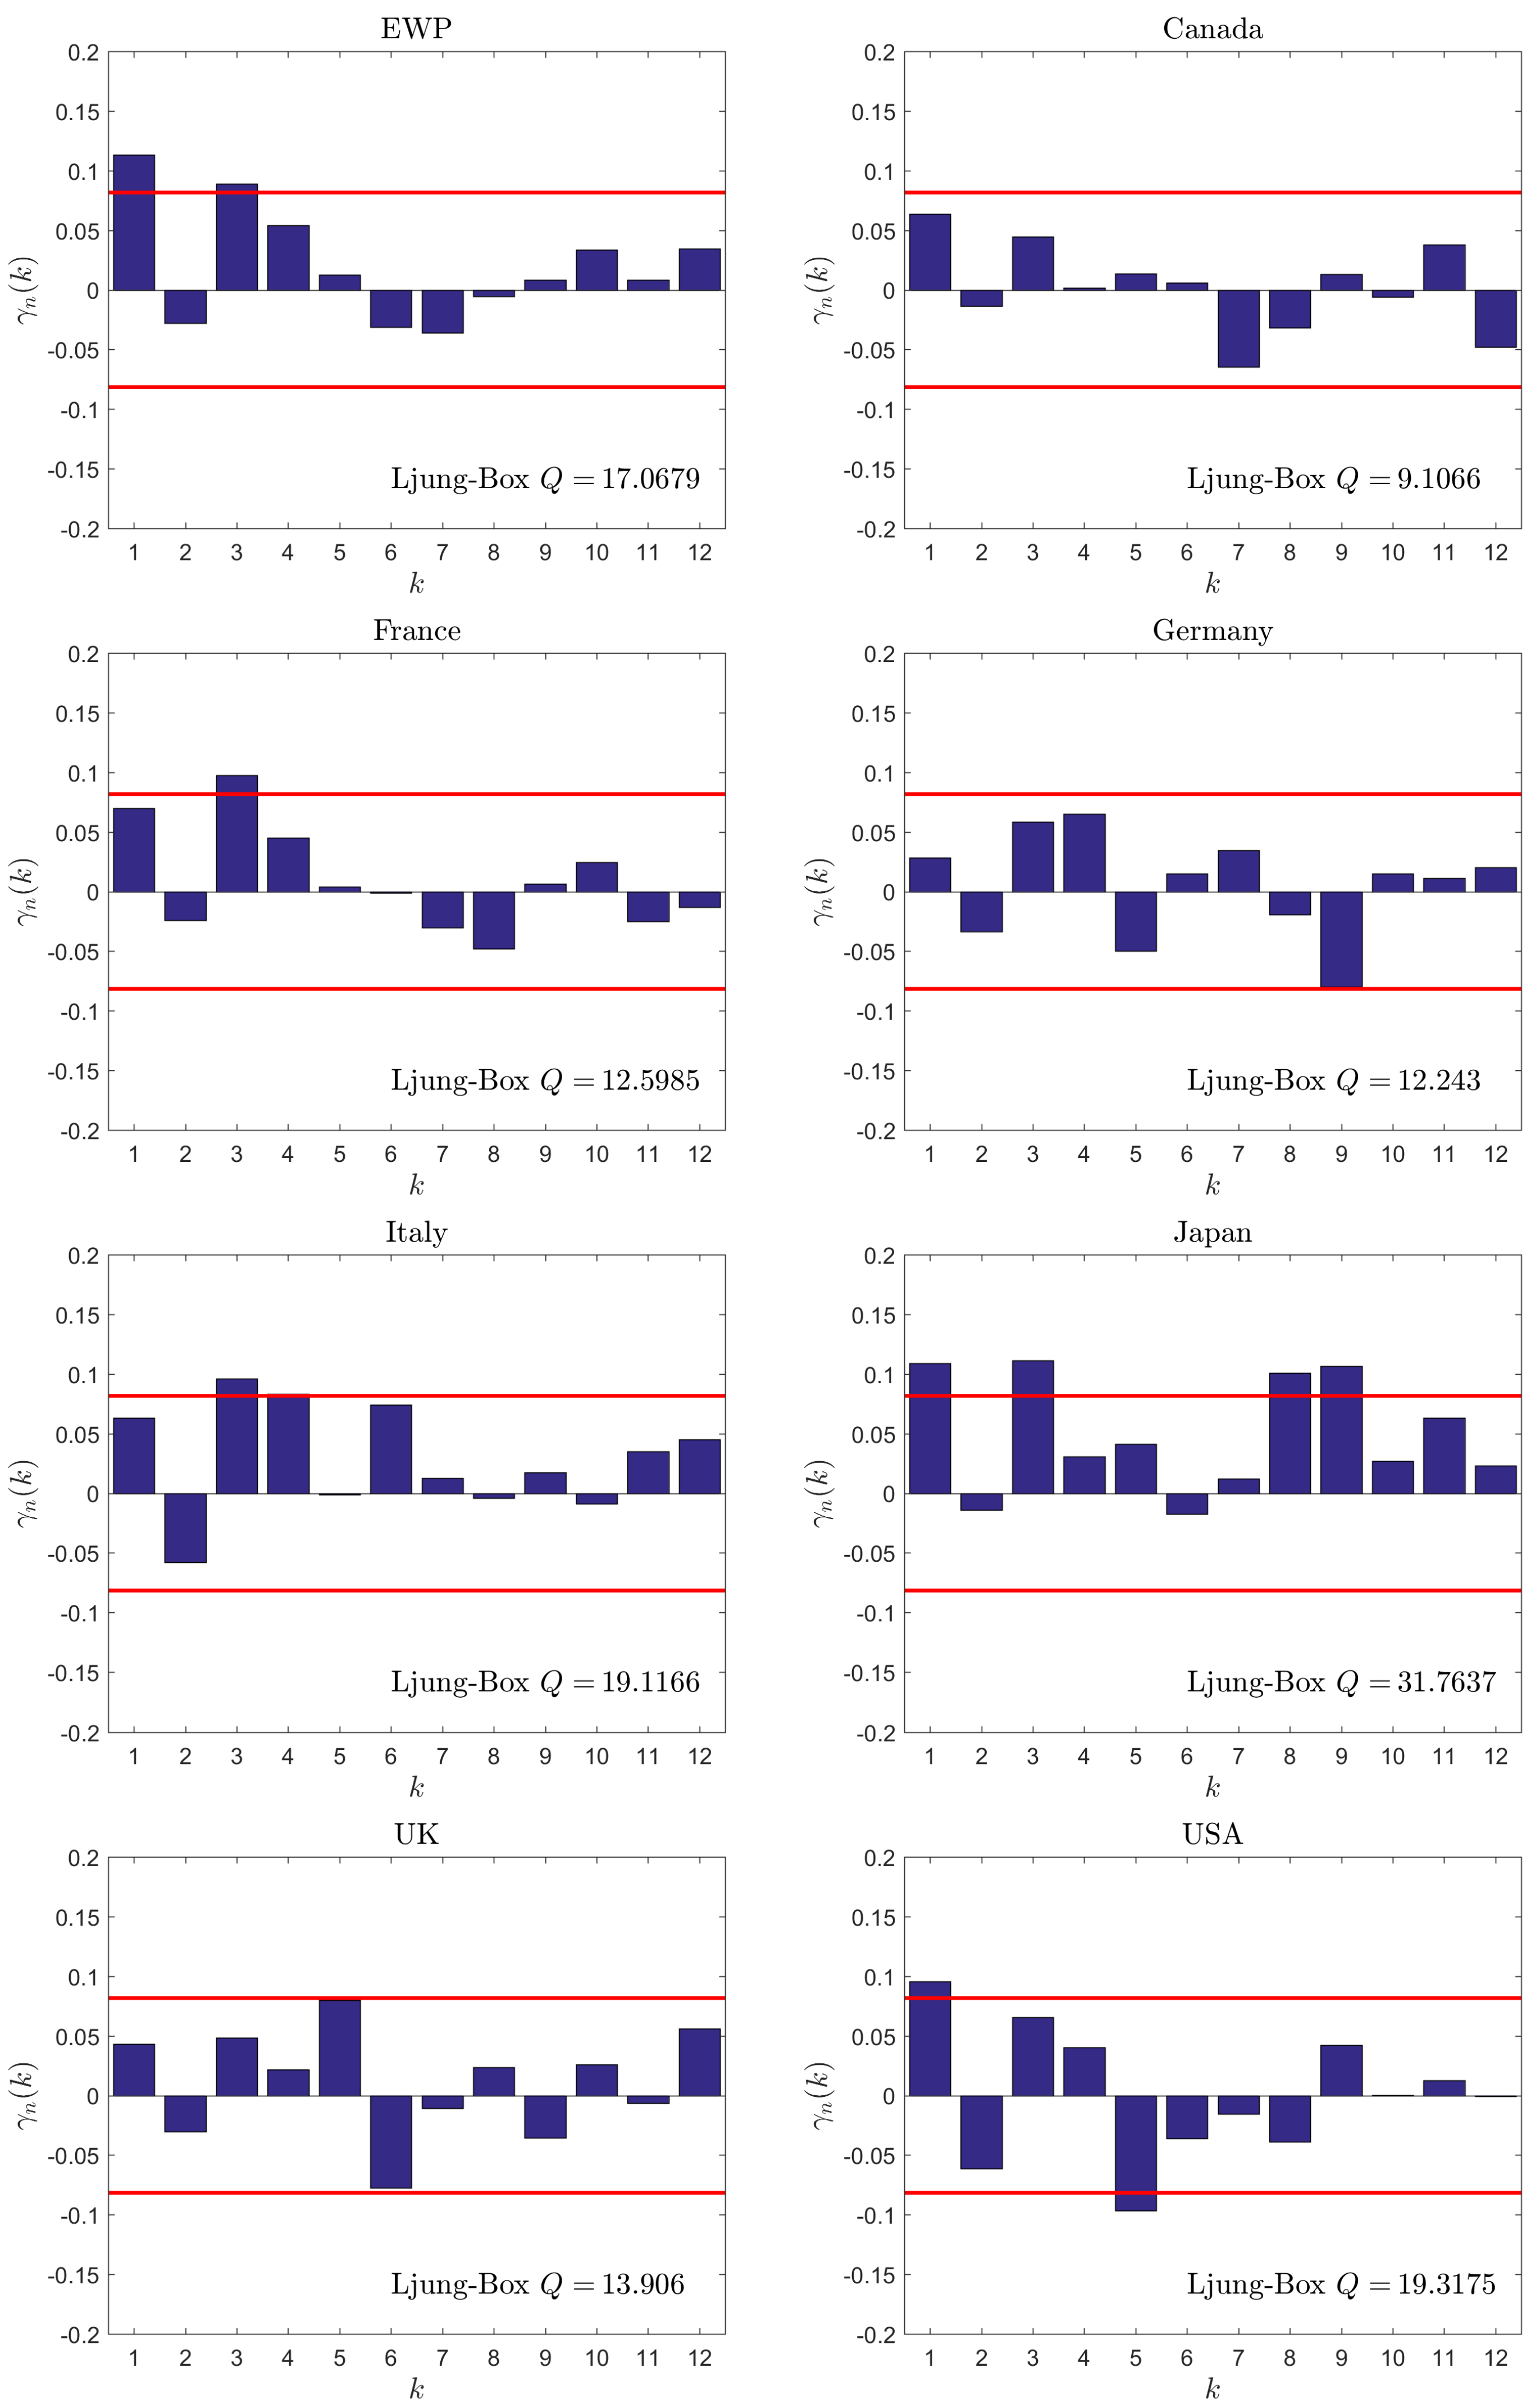
| 6. | The only exception is Japan, where we can find a relatively large Q-statistic of 31.7637. |

| EWP | Canada | France | Germany | Italy | Japan | UK | USA | |
|---|---|---|---|---|---|---|---|---|
| 1.4987 | 1.0299 | 1.2036 | 1.1255 | 1.6913 | 2.1828 | 1.2720 | 1.0118 | |
| 2.5962 | 2.7550 | 2.3081 | 2.9514 | 2.3707 | 2.8368 | 2.5027 | 2.6202 |
| EWP | Canada | France | Germany | Italy | Japan | UK | USA | |
|---|---|---|---|---|---|---|---|---|
| 0.0053 | 0.0052 | 0.0062 | 0.0060 | 0.0033 | 0.0054 | 0.0052 | 0.0057 | |
| 0.0023 | 0.0024 | 0.0029 | 0.0028 | 0.0040 | 0.0037 | 0.0020 | 0.0026 | |
| 0.0461 | 0.0560 | 0.0640 | 0.0627 | 0.0732 | 0.0599 | 0.0436 | 0.0620 | |
| 0.0030 | 0.0040 | 0.0037 | 0.0041 | 0.0038 | 0.0035 | 0.0028 | 0.0077 | |
| 0.1149 | 0.0923 | 0.0971 | 0.0961 | 0.0449 | 0.0898 | 0.1202 | 0.0927 | |
| 0.0581 | 0.0462 | 0.0492 | 0.0479 | 0.0537 | 0.0624 | 0.0548 | 0.0508 | |
| 0.0419 | 0.0417 | 0.0417 | 0.0417 | 0.0417 | 0.0417 | 0.0418 | 0.0417 |
| Canada | France | Germany | Italy | Japan | UK | USA | |
|---|---|---|---|---|---|---|---|
| 0.0226 | 0.0178 | 0.0187 | 0.0700 | 0.0251 | −0.0053 | 0.0222 | |
| 0.0213 | 0.0317 | 0.0419 | 0.0269 | 0.0374 | 0.0381 | 0.0376 | |
| t | 1.0635 | 0.5598 | 0.4472 | 2.6054 | 0.6718 | −0.1397 | 0.5891 |
| 0.0291 | 0.0227 | 0.0257 | 0.0299 | 0.0354 | 0.0290 | 0.0274 | |
| 0.7758 | 0.7821 | 0.7298 | 2.3420 | 0.7083 | −0.1833 | 0.8089 |
© 2018 by the author. Licensee MDPI, Basel, Switzerland. This article is an open access article distributed under the terms and conditions of the Creative Commons Attribution (CC BY) license (http://creativecommons.org/licenses/by/4.0/).
Share and Cite
Frahm, G. An Intersection–Union Test for the Sharpe Ratio. Risks 2018, 6, 40. https://doi.org/10.3390/risks6020040
Frahm G. An Intersection–Union Test for the Sharpe Ratio. Risks. 2018; 6(2):40. https://doi.org/10.3390/risks6020040
Chicago/Turabian StyleFrahm, Gabriel. 2018. "An Intersection–Union Test for the Sharpe Ratio" Risks 6, no. 2: 40. https://doi.org/10.3390/risks6020040
APA StyleFrahm, G. (2018). An Intersection–Union Test for the Sharpe Ratio. Risks, 6(2), 40. https://doi.org/10.3390/risks6020040