1. Introduction
The impact of climate change through greater extremes of heat and cold, sea level rise (SLR) and an increase in extreme weather events will have a significant effect on the built environment. These impacts will be physical, financial and social, and will place substantial burden on the nation’s economic stability. Property not only provides shelter and workplaces, it is a major industry in many countries, including Australia, where it currently employs more people than the mining and resources sector does (
Property Council of Australia 2015a). The total value of property in Australia is estimated to be A
$7.3 trillion (
CoreLogic 2017), with global estimates near US
$217 trillion (
Hackett 2016). In Australia, under a high-end scenario of 1.1 m in SLR by 2100, A
$226 billion worth of commercial, industrial, road, rail and residential properties are anticipated to be exposed to inundation and erosion hazard (
Department of Climate Change and Energy Efficiency 2011). However, a recent report by the United States (US) National Oceanic and Atmospheric Association (
NOAA 2017) suggests that current modelling now estimates a more likely scenario of 2.7 m. Further, if the Greenland ice sheet melts, it could lead to a 7 m increase, creating mass inundation and destruction of urban and natural areas globally, although it should be noted the time horizon for this scenario is beyond 2100 (Intergovernmental Panel on Climate Change (IPCC) 2014). The national and international property implications of these SLR scenarios would be substantial—economically, environmentally and socially. Despite this, limited research has focused on the challenges of risk identification and its impact on property development, retrofitting and ultimately, capital value. To begin to understand the implications for property stakeholders, owners, occupiers, planners and government, the first step requires an assessment of vulnerability and understanding of the extent of risk exposure, because, at present, although this is a developing research area, there is, as yet, no consensus on the ‘best practice’ approach (
Dundon et al. 2016). Globally, municipalities and governments situated in coastal areas will experience similar barriers, problems and challenges relating to coastal planning, paucity of data, and complicated legal and political landscapes. Further, a lack of skilled and educated professionals and managers will limit the technical capacity to meet these challenges and drive change. Consequently, raising awareness across various stakeholder groups will assist in driving a response and need for information, research and solutions.
If property is to remain resilient against the risks posed by SLR and climate change, these challenges should be addressed. However, identifying levers to drive change and action within the sector is difficult without mandatory legislation or government direction. Currently, in Australia, policy and legislation responsibility regarding SLR has been placed on local government authorities (
Walsh et al. 2004). This has produced varying effects and a lack of decisive action to drive change. Consequently, to raise the issue with property stakeholders, information regarding risk levels and potential value depreciation or loss is required. This research attempts to estimate the implications of SLR for the property industry. Through a case study of a Melbourne municipality, we demonstrate the potential consequences of SLR and the property risks that go beyond SLR examining properties on an individual basis.
This paper examines the existing literature relating to climate change, SLR and SLR modelling, risks to property and current approaches to management, in particular, in an Australian context, which supports the research approach and the adoption of existing modelling frameworks for the research. The research methods set out the data collection, analysis and modelling, with the results reported thereafter, which comprise the identification of the number of affected properties by SLR and additional flooding elements. Then, the types of properties affected are identified as well as the subsequent implications for property values and annual income generated by properties for the municipality, which have repercussions for long-term risk management for owners and government.
2. Background
2.1. Climate Change, Emissions and Sea Level Rise
SLR is a great concern for many of the world’s river- and coastline-adjacent major cities. Anticipated sea level changes and modelling are continually being updated and revised. The variability of greenhouse gas emissions modelling, both forecasted and actual, and its relationship with SLR, has created uncertainty around future sea level estimates. Today’s emission will affect global SLR for centuries; past emissions have already ‘locked in’ certain SLR implications, with current and future emissions set to worsen these impacts (
CSIRO 2015). Further, short-lived greenhouse gases, created at variable rates each year, are harder to reverse and can have a lingering effect on SLR for hundreds of years, even after they have cleared from the atmosphere (
Zickfeld et al. 2017). SLR forecast models make various assumptions about where emissions are expected to go, and whether they are likely to increase, reduce or stabilise. Many anticipate the maintenance of particular levels or declines; however, these predictions have not yet been reflected in actual global emissions.
In 2013, the IPCC’s AR5 (
IPCC 2013) projected a higher mean sea level rise between 0.26 and 0.98 m by 2100 across a range of scenarios modelled above the baseline mean over 1985–2005, than in the IPCC’s AR4 (
IPCC 2007), due to improved modelling. However, this report did not fully incorporate the implications of melting ice sheets (
Gilkson 2015); it was acknowledged in AR5, that if this occurred, the global mean SLR could be substantially above predicted levels (
IPCC 2013). Broader academic research by climate researchers and publications that model SLR under various scenarios often demonstrate greater rises in sea level than the IPCC reports do (
Hansen et al. 2016;
Gilkson 2015). SLR modelling considers multiple elements, including the global expansion of oceans, the melting of the polar icecaps and glaciers, lost ice sheets in Greenland and West Antarctica, and the loss of permafrost. A 2017 report by the US National Oceanic and Atmospheric Association (
NOAA 2017) has suggested that current modelling now estimates a SLR scenario of 2.7 m by 2100. Dire projections in
IPCC (
2013) AR5 indicate that there is potential for a rise of up to 7 m if the Greenland ice sheet melts (
Church et al. 2013b). Modelling by
Hansen et al. (
2016) also predicts that with the loss of Antarctic and Greenland ice sheets, SLR will be in the range of 6–7 m. SLR modelling should consider the ‘sea level at any moment as the sum of the mean sea level, plus the state of the tides, wave set-up, responses to air pressure and near shore winds’ (
Department of Climate Change 2009, p. 22). However, with an array of different models, assumptions and sensitivities in analyses, only experts will understand what is considered in reported SLR predictions and the potential implications for property that may drive change and inform decision-making.
2.2. Modelling the Extent of Sea Level Rise
Current modelling used by governments to address the risks posed by SLR are variable across locations in Australia (
Antarctic Climate and Ecosystem Cooperative Research Centre 2011). Further, SLR modelling and expected effects have an array of variabilities, limitations and consequences. This makes it difficult for government, industry, communities and individuals to understand the implications for property; thus, it is challenging to make decisions with any degree of certainty. However, there is a key issue with the modelling used to predict SLR in Australia. The calculations used in Australia currently rely on IPCC recommendations which focus mostly on the thermal expansion of ocean water, and not necessarily on the implications of ice sheets melting, due to the variability of calculating this factor. Problematically, these models assume a still-water scenario when, in reality, this is rare and potentially underestimates the real impact of SLR as tides, wave set-up and run-up, storm surge, responses to air pressure and near shore winds all have a cumulative and additional effect.
The IPCC discusses a range of SLR heights across greenhouse gas emission scenarios relating to business as usual, minimum likely, and worst-case scenarios; these demonstrate a range of global SLR predictions. In its fifth assessment report (AR5), the
IPCC (
2013) declared that projections are ‘larger than that of AR4’ because of improved modelling of land–ice contributions (
IPCC 2013, p. 1140). However, research by
Church et al. (
2013a) and
IPCC (
2013) highlights even more variation in SLR prediction models for regional effects and wave heights. Additionally, elements like sea variability, tide range, storm surges and storm tides, which were not considered in these assessments and are mostly due to local features, create further impact.
Hunter (
2010,
2012),
Hunter et al. (
2013) and
Le Cozannet et al. (
2015) investigated the statistical variance likely from the differing elements that would be attributable to local tides and storm surges. It is expected that these elements would need to be considered at different locations to determine how they might affect individual areas. For example, the IPCC’s AR5 (
IPCC 2013) states that Southern Ocean swells were likely to create an increase in mean wave height as a result of wind speed, which would have further implications for Australian coastlines. As pointed out by
Steffen et al. (
2014), factors relating to high tide and storm surge (comprising wind and wave set-up and run-up) substantially increase the heights of seawater inundation. Further, in the case of storms or heavy rainfall, increased precipitation levels lead to greater flooding of low-lying areas, which would be amplified due to SLR.
There are various simulations, geographic information system (GIS) maps and interactive maps that are now available to examine the potential impact of SLR. In an Australian context, there are several models used by the different layers of government (
Antarctic Climate and Ecosystem Cooperative Research Centre 2011). OzCoasts (
Geoscience Australia 2015a,
2015b) provided static imagery of SLR at certain levels for specific areas across Australia using a ‘bathtub’ modelling approach. However, this was recently superseded by CoastalRisk (
NGIS 2016), which provides an interactive map using Google maps and can have both standard SLR measures and sliding-scale capabilities. CoastalRisk is a useful tool for the public, but it limits understanding on a finer, more local level in terms of properties affected and the impact on them. A similar tool, known as the NOAA SLR Viewer, is used in the US. It uses a modified ‘bathtub’ approach but is limited to imagery of 1.83 m (six feet) above high tide (
NOAA 2018). ‘Surging Seas’, is another valuation tool that assesses SLR in major coastal areas globally, providing a risk-zone map based on two forecast scenarios: a two-degree rise or a four-degree rise in global temperatures (
Climate Central 2015).
The variety of sources and modelling, policies and considerations makes it difficult for governments, industry, communities and individuals to understand the direct implications for their properties, creating a high level of uncertainty in terms of decision-making. Current responses to the risks of SLR are insufficient across the layers of government in Australia, including at the federal, state and local levels. Plans, strategies and management ideas are under development, but there is limited communication regarding actions, and debate and lack of response will have significant effects on property stakeholders, communities, economies and individuals in the future. The likely expenditure requirements and construction time to mitigate and adapt to future SLR is likely to be extensive. Although there may be major implications for property, including property values, legal claims and property rights, longer-term sugar-coating of the situation is likely to be more disastrous, both economically and socially.
2.3. Property at Risk?
The financial implications of SLR for property are anticipated to escalate if prevention of predicted SLR is not achieved. As coastal populations grow, a larger percentage of residential property, commercial property and infrastructure in cities will be at risk; further climate change-related weather events will exacerbate economic and social impacts. Property owners and occupiers are faced by a broad spectrum of risks, which have the potential to cause major financial losses and public relation disasters; further, the changing global climate increases the risks and uncertainty which will extend and affect property owners beyond the initial impact of an event’s occurrence (
Piccininni 2014). The financial losses or costs associated with natural disasters and extreme weather events are often substantially below the actual cost, as only direct losses are tracked, and often, only the insurable loss is reported (
Bienert 2014). Consequently, the planning and consideration of the impacts of SLR and subsequent flood events are likely underestimated in terms of financial and social costs. The breadth of losses does not only include direct losses, but also, a host of other related costs. The associated losses and costs can be broken down into five key categories (see
Table 1).
The physical impacts on property associated with SLR are relatively direct, as the land and most buildings will experience total inundation in the event of SLR. However, buildings that are not subject to direct inundation may be affected in other ways, for example, through increased flooding during heavy precipitation, damage inflicted by storm surges or being cut-off from transport and infrastructure. These subsequent events may result in permanent damage to a building or limited and restricted access to a building, which will require repair and perhaps downtime in the building’s day-to-day operation. Consequently, this will affect tenants, their businesses and employees. The building being non-operational for a lengthy period will result in economic loss, such as rent paid and, depending on the event, there will be losses in long-term letting, rent, vacancy rates, property yields and investment. There has been economic modelling of particular events like storms and flooding to anticipate risk exposure and economic costs, often portrayed through net present value calculations and option modelling (see
Truong and Truck 2016;
and Truong et al. 2017), and annual expected losses (
Hirsch et al. 2015 and
Bienert 2014).
The economic impact needs to be considered on several levels: short-term physical costs of building rectification works; operational costs or losses; and long-term physical, operational and obsolescence costs. The economic effects are also not directly identified through the asset affected and its owner and/or tenants, but through taxpayer funding to support homeowners, businesses and others after events like floods, droughts, fire and future SLRs. Again, future regulatory costs will be incorporated through various policies, which will either be financial contributions or requirements to upgrade buildings; a further implication for building value may be increased functional obsolescence. Existing resources are generated by property taxes, particularly at the local government level in Australia. However, with the estimations of adaption costs and the actual physical value loss in inundated and affected properties, the ability to finance adaptive measures might be challenging and will likely be felt the most in lower socioeconomic areas (
Arkema et al. 2013).
There are also social costs related to buildings, comprising direct and indirect impacts on owners, occupants and employees. If an office or retail building is not operational due to flooding or access issues, tenants will suffer businesses losses, and employees will lose wages. Business impact is a growing area of concern. With the rise in global business, an event in one location may have a domino effect, inflicting income losses on other businesses, locally, nationally and internationally. The cost of creating barriers and adaptive measures to save businesses, land and livelihoods might exceed the productive capacity of the land saved (
Bosello et al. 2007).
Another factor is insurance costs, increasing premiums and the possibility of lack of insurance for properties in certain locations. Insurance companies currently rely on historical data and information to determine and calculate premia (
Biard et al. 2013); yet, the challenges for the future of increased disaster events and SLR implications are limited data and significant levels of uncertainty making it difficult, if not impossible, to precisely calculate risk, vulnerability and future losses. As a result, the response of insurance companies to properties that may be at risk could be variable. This raises concerns regarding what happens when the property is damaged or destroyed. Will governments foot the bill? Queensland is the only state in Australia without comprehensive insurance, leaving the Australian government to cover 75 per cent of recovery costs through the Natural Disaster Relief and Recovery Arrangements (
Wilson 2011). Further, the flood levy burdened Australian taxpayers in the financial year 2011–2012, who had to pay the A
$5.6 billion bill for flood devastation in Queensland (
Australian Tax Office 2011;
Levy 2011). The question is whether governments and taxpayers will continue to cover the costs of post-event crises, rather than focus on investigating and implementing measures to minimise and mitigate the impacts.
Given the globalised ownership and management of commercial property, an event in a particular location affecting only one asset will result in ripple effects for the direct property, occupants and their business operations. This will also have flow-on effects for their portfolio, fund and likely shareholders. This was apparent in the Brisbane floods in 2010 and 2011, which resulted in A
$2.4 billion of insured losses and inundation of 28,000 properties (
Mason et al. 2012). Other impacts included the A
$6 billion reduction in Queensland’s gross state product in 2010–2011, with annual economic growth decreasing by 2.25 per cent (
Deloitte 2011). The implications for the property sector because of these floods included actual physical inundation and reduction in activity due to infrastructure, services and amenities that were either inoperable or inaccessible. Many commercial, retail and industrial properties in the Brisbane central business district were inundated; subsequently, losses associated with direct damage and clean-up costs were in addition to the indirect costs of loss of rent and business operation for some time. In terms of consequential losses, there were isolated cases of tenants breaking leases, yet limited information is available regarding option renewal, and there is evidence that certain properties, particularly in fringe areas, have remained unoccupied (
Warner 2011). Brisbane’s industrial property market was the hardest hit, with 10 per cent affected. Some smaller businesses were forced to close, while larger businesses were generally fully insured and able to write off their losses (
Warner 2011). Residential properties in Brisbane saw a drop of 5–10 percent in 2011, with Rocklea, the suburb that was hit the hardest, reporting a 23.9 per cent decline in value (
Jabour 2012). Although the market did recover somewhat, there are still properties in certain areas (like the Lockyer Valley) that have stalled, shown minimal growth, and are discounted compared to surrounding areas (
Cross 2015).
Real estate is not an isolated structure; it is integrated into and socially supports communities and individuals. Consequently, isolated approaches to enhance urban sustainability and resilience are not productive and require a broader collaborative approach to the problem. When property is affected by an extreme weather event or natural disaster, it is not only the building owner that bears the brunt of the costs of repair—occupiers’ businesses, employees and the broader community are also affected socially and economically. Thus, to tackle problems like SLR, solutions and adaption strategies require engagement with property industry bodies, key institutional investors, owners, occupiers, local, state and federal governments and researchers. Working together to provide a strategically aligned approach can promote the development and implementation of risk minimisation and adaption strategies for property in Australia.
At present, the lack of a united and cohesive regulatory approach to SLR mitigation suggests that an opportunity and key driver for change in the property sector will be identifying and quantifying the implications for property values of SLR, and subsequent events that might affect properties’ operational capacities. This will propel the need for more investigation and structure to ascertain risk and risk profiles. Once understood, there is a need to create risk-minimisation strategies and adaption to minimise the future impact of these events. In time, the understanding of risk, risk mitigation strategies and the adoption of approaches, or lack thereof, will influence investment and occupation decisions within the sector, leading to future implications for market value and insurable values.
2.4. The Management of Sea Level Rise Risk
In Australia, the responsibility of managing SLR is largely shouldered by local government through existing land-use planning and development mechanisms. However, there is variation in SLR modelling and governance across states and territories, which has resulted in varied responses from local governments, from ‘do nothing’ to concrete policies (
Antarctic Climate and Ecosystem Cooperative Research Centre 2011;
House of Representatives Standing Committee on Climate Change Water Environment and the Arts 2009). The approaches of many local governments, water authorities and catchment management authorities have a significant influence on SLR modelling, and mitigation and adaption responses. For example, in Victoria,
Melbourne Water (
2017) has recently released
Planning for Sea Level Rise Guidelines—Port Phillip and Westernport. However, responses to SLR challenges are variable across locations, municipalities and states, with variations in modelling levels, and response to modelled levels often resulting in inadequate planning processes and projections when considering the implications for the future. A further example, the Central Coast Council in New South Wales (NSW) was advised that SLR projections in its area would result in an increase of 0.4 m by 2050 and 0.9 m by 2100, based on a static calm-water scenario. However, the Central Coast Council adopted the projections of 0.2 m by 2050 and 0.74 m by 2100 (
Central Coast Council 2014;
Collins 2015). Further variation in predicted modelling includes Victoria’s identification of a 0.8 m rise by 2100 through a strategic planning policy found in
Victorian Coastal Strategy 2014 (
Victorian Coastal Council 2014), South Australia’s sea level increase prediction of 1 m, and NSW and Western Australia’s predictions of 0.9 m (
Geoscience Australia 2015a,
2015b). Yet, the application of responses within planning has only been considered loosely (see
Hurlimann et al. (
2014) and
Measham et al. (
2011) for a broader discussion of adaption strategies and current barriers and challenges for strategic planning). Much of the present action is focused on new urban development, although there are several projects that do not qualify for these planning requirements.
Insurance companies are already performing risk analyses and identifying areas at risk or uninsurable areas that property stakeholders may be ignorant of (
Climate Risk and Choice 2014). Some local councils that have attempted to implement restrictions, or at least notify properties, have been accused in local media sources of devaluing properties, causing sales to fall through, development issues and restriction of lending by banks (
Cronshaw 2013;
Steketee 2013). Unfortunately, due to pressure, some councils and state governments, like Queensland and NSW, have subsequently removed state planning policy tools to help local councils manage SLR risk and have rejected proposed mandatory disclosure processes for climate risk warnings when purchasing a property (
Connor and Stefanova 2014). Others, like the
Bass Coast Shire Council (
2017) and
City of Port Phillip (
2016) have passed amendments to their inundation overlay to consider SLR, yet this is assumed to be incorporated within existing overlays and does not specifically identify SLR. In the case of the City of Port Phillip, the amendment is only recent and actual implications for values are yet to be observed, if at all if it is not specifically considered. Further, there are questions about the effects of climate change and, in particular, SLR, on property rights (
Obeng-Odoom and Sheehan 2014). At present, there appears to be a lack of cohesive, multilayered governmental approach to communicate risks and respond collectively to SLR (
Hurlimann et al. 2014;
Property Council of Australia 2015b). This could have disastrous implications for current and future generations with the potential for legal liability for authorities and other property stakeholders (
De Wit and Webb 2010;
McDonald 2007). The underestimation of the potential SLR—given the variation between predictions from the
IPCC (
2013) and recent evidence by
NOAA (
2017)—indicates a level of uncertainty in the science of prediction. Variation in modelling predictions is not unusual. However, in developing policy, what is ‘modelled’ in these scenarios requires further analysis to capture the broader implications and to incorporate them into responses. Problems occur when different authorities choose modelled scenarios and mitigation or adaption techniques that are not necessarily based on what might happen, but rather, what their constituents might accept. This is problematic when emissions are not being mitigated but many models assume that they are. Consequently, there should be a focus on the likelihood of worse-case scenarios, yet councils and policymakers are reluctant to take this approach due to community backlash.
Current responses to the risk of SLR are insufficient across the layers of government in Australia, including federal, state and local levels. The debate and lack of response will have significant impacts on property stakeholders, communities, economies and individuals in the future. Property, be it a workplace, home or place of industry, is exposed to potential risks that will affect the long-term financial wellbeing of individuals, businesses and governments. There is an increasing need for property stakeholders to be aware of potential risks, and it is paramount that they develop strategies for minimisation and adaption. Thus, research is required to demonstrate the broader implications of SLR and the associated risks that may not be immediately apparent to property stakeholders.
3. Materials and Methods
The aim of the current was to investigate how many properties may be affected by SLR through a range of modelled scenarios. This research used a case study of a municipality area to investigate a range of scenarios. The bayside municipality, situated in Melbourne, Victoria, Australia; known hereafter as the Municipality, was chosen to explore the implications of modelled SLR and to examine risk profiles of other factors that come into play when examining the real risks and impacts of SLR on property in a more holistic manner, as well as examining the financial implications.
3.1. Case Study: The Municipality
The Municipality, which is located in the inner suburbs of Melbourne, spans 11 km of the coastline of Port Phillip Bay. The Municipality has a range of management plans and information documents relating to SLR plus expected future flood levels in 2100 in the
Flood Management Plan (
City of Melbourne and Melbourne Water 2012), and more recently,
Planning for Sea Level Rise Guidelines in February 2017 (
Melbourne Water 2017). There have also been local investigations conducted in the Municipality that have investigated the initial expectations of climate change effects, and a second document has been used to examine how planning might be used. More recently, action by the Municipality has included Amendment C111 (2016) to the planning scheme, which revised the use of the special building overlay (SBO) to incorporate SLR as a consideration in the use of the SBO. The SBO in Victoria is an overlay implemented through the planning system which identifies urban areas and properties liable to inundation from overland flows from the urban drainage systems or within a designated floodplain (
Department of Environment, Land, Water and Planning 2018). However, clarity is still being sought as to how this will be implemented and whether SLR risk elements will be clearly communicated to current and future stakeholders as well as how this will limit or affect properties. Presently, the SBO is generally defined in relation to types of flooding, including riverine flooding, overland flows, coastal, tidal and storm surge flooding and SLR. SBO1 refers to overland flows from Melbourne’s water drainage system, while SBO2 refers to overland flows resulting from the Municipality’s drainage system. SBO3 is a more general overlay, similar to SBO1, but with fewer restrictions on planning permits. This research aimed to not only provide more information to the local government about the implications and range of impact of SLR on the Municipality, but also to press the need for clear communication with property stakeholders to raise awareness among property stakeholders.
3.2. Data Collection
Data collection comprised two main components: (1) the collection of property-related data and (2) the assembly of information pertaining to SLR and its additional implications. The property data comprised the information held on all properties within the Municipality. These data, obtained from the Valuer General of Victoria, contain information on approximately 70,000 properties, including individual details of the properties, a geolocation code, land size, age and condition of dwelling, zoning and key property features. A Geographic Information System (GIS) was then used to match the Valuer General data. The matching process comprised three steps: direct matching, which achieved a 52 per cent match; inverse address, which matched valuation data to address points using their full address (46 per cent); and the remainder were matched using fuzzy matching techniques. LiDAR data were then overlaid on the properties to add detailed elevation data. Once this was complete and all properties had height-level information, different scenarios relating to sea level heights could be run using software R and Quantum Geographic Information System (QGIS) to identify the properties affected.
The SLR scenarios developed required extensive investigation of the various methods used to easily model SLR. This research used a similar approach to the method adopted by OzCoasts (
Geoscience Australia 2015a,
2015b);
McInnes et al. (
2015) and
Hauer et al. (
2016)—the ‘bucket fill’ or ‘bathtub’ method, which calculates properties likely to be inundated. The limitations of this approach and its adoption are important to consider as the authors are not experts in the modelling of SLR or oceans. This approach has been modelled to demonstrate the implications of SLR; consequently, resources like Coastal Risk or more precise modelling should be used. In addition, there are certain factors that are not considered in this model (similar to other studies that have used this modelling approach), like existing seawalls, erosion, existing flood plains, hydrodynamics, hydrological models and other local factors. Further, it does not consider losses in infrastructure or restricted access (e.g., isolated parcels surrounded by water). The model created allows for any SLR height to be tested. For the purpose of this paper and to demonstrate the variation between SLR alone, and with the other contributory factors,
Table 2 shows the range of assumptions and levels used within the model to project inundation levels, based on existing modelling in published research and Australian documents that have interpreted the IPCC for Australia forecast SLR scenarios. This analysis allowed properties to be identified as being at risk of inundation on different levels.
There are numerous studies that have estimated different SLR heights and other factors, which have been examined either individually or cumulatively (
Hunter 2013). However, the research focus on property profile, risk and implications of SLR is limited in that it does not differentiate between total inundation by SLR, temporary or periodic flooding and storm-based inundation. These varying types of inundation obviously have a range of implications for property, property risk assessment and property values. By creating a sliding scale for SLR that allows for other factors to be incorporated in a basic modelling approach, stakeholders can gain a greater understanding of the risks posed to their property for any given situation. Recent websites like CoastalRisk (
www.coastalrisk.com.au) provide the ability for anyone to examine, using a GIS map, the potential for inundation of up to 10 m. However, more property-specific information is required by stakeholders regarding factors that might contribute to current and future risks. An examination of the broader implications of SLR, as demonstrated by
Andreucci and Aktas (
2017) and
Withey et al. (
2016), illustrates how these factors relate to direct and indirect risks to property.
To provide benchmarks, a range of different SLR heights was calculated to examine effects and implications. SLR, anticipated up until 2100 varies dramatically depending on the research or report examined. With this in mind, rather than relying on a particular forecast, this research used a range of values to provide an overall perspective (see
Table 2). Further storm surge attributes have substantial variability, depending on tide heights, wind speeds and a variety of other factors that have also been incorporated. At present, much of the initial analysis and modelling of impacts in Australia by the government often does not consider storm surge attributes. The purpose of this research was to highlight the implications of the combination of multiple factors and the potential for these to affect more properties. For example, storm surge is a major variability, as recently demonstrated in hurricane events in the US, where storm surge was up to 3 m in some areas (
Holder et al. 2017). This is an extreme consideration, and hurricanes are not a prevalent problem in Victoria, although cyclones in Queensland can bring storm surges between 1 and 10 m in height (
Griffith University 2016). Victorian modelling suggests that storm surge heights in a 1-in-100-year storm event are typically between 0.5 and 1 m (
Victorian Department of Sustainability and Environment 2012). Similar ranges have been found in New Zealand, where storm surge modelling has suggested a height of 0.9 m (
Tonkin and Taylor 2014). This information has been used to identify ‘benchmarks’ for use in this study. As previously mentioned, the model provides a sliding scale using Australian Height Datum (AHD) information to ascertain the properties affected, and consequently, the reporting of different scenarios to demonstrate individual and cumulative effects.
To examine the economic implications of SLR and increased flooding potential, the Valuer General data comprised the 2016 statutory values for each property within the Municipality. For the calculation of rates for each property in the Municipality, the net annual value (NAV)
1 is used with the multiplier rate in the dollar to ascertain the annual rates payable. In this municipality, there are different rates in the dollar for residential compared to commercial or industrial calculations. Further, the calculation of residential property NAV is calculated at 5% of the capital improved value (CIV)
2. The CIV figures were also used in the analysis of the total value of properties affected in the Municipality by SLR and flooding implications. Using the previous modelled analysis of the SLR and flood implications, properties deemed to be either a total loss due to SLR or affected by flood effects only at particular inundation heights were calculated on the basis of the annual rates payable and the total values (CIV) of the properties. The flood discounts modelled were 5%, 15%, 30% and 60%. The literature is not consistent regarding the implications of the discounts on value, with discounts being noted for those within designated floodplains compared to actual flood affected property analysis. Further, depending on the flood incidence and severity of a flood these can also affect perceived market discounts in both the short and long term. Exploration of flood implications for properties in this Municipality comprises further research currently being undertaken by the current authors. The calculations for total property value and rates losses were attributable to SLR and then, calculations under different flood discount scenarios were also applied, allowing an understanding of total losses arising from SLR and also the extent of potential value implications for properties affected by increased flooding issues associated with SLR.
3.3. Limitations
The limitations of this research predominantly relate to the development of the SLR model. This model, as previously mentioned, uses a ‘bathtub’ approach, making the assumption that any properties under a particular AHD will be submerged or affected by flooding. This rudimentary model has been created to focus on stakeholders’ underestimation of the broader effects of SLR. Its purpose is for illustrative examples of this case study; it has not been created as yet another SLR tool for the government, as there are likely more sophisticated modelling approaches. For example, this model does not consider erosion, existing flood plains and flood dynamics, tide variance, precipitation levels, wind and storms. Further, this modelling approach does not consider loss of infrastructure, access to properties via roads and networks, access to amenities and services, or existing flood dynamics or modelling, as it is based purely on the height of the property. In addition, there is a limitation in terms of the value discounting associated with flooding which relies upon perceived discounts from other studies associated with flooding. The analysis provided an overview of the different perspectives by providing a range of discounts analysed, yet, it would be expected that as SLR becomes more prevalent and increased flooding risk is demonstrated, the market will escalate the expected discounts to values. This was not been specifically investigated in this study and comprises future research.
4. Results and Discussion
The analysis of the data and the modelling of a range of heights discovered that in a SLR rise of up to a 1 m, only a small proportion of properties would be affected (only 0.3 per cent of all properties in the Municipality). The Victorian government’s management strategy (
Victorian Coastal Council 2008,
2014) used the prediction of an 0.8 m SLR by 2100 as a model, which, through analysis, was determined to affect about 152 properties (0.24 per cent). However, if the recent updated scenario analysis reported by the US
NOAA (
2017) is correct, and 2.7 m is a more reasonable estimate, SLR will affect 30 per cent of Municipality properties. This jump in properties affected is a result of the general topography of the Municipality, which is relatively flat and because the Municipality has a large proportion fronting the coastline (11 km in a municipality of 20.62 km
2). This also identifies a key tipping point for the Municipality, where significant effects of SLR will be felt across a significant proportion of the area. Initial analyses indicated that in the scenarios suggested by the Victorian government, there is not likely to be a significant SLR impact on the Municipality. However, this modelling changes the understanding of the impact of new flood height levels in the Municipality. Flood heights are currently covered in the planning scheme, devised by Melbourne Water and the Municipality, and are mapped using planning overlays. Flood heights are estimated at about 1.6 m AHD for a 1-in-100-year storm (
Melbourne Water 2012). Thus, if SLR increases, there is a reciprocal adjustment to existing flood heights.
This escalates the implications for property substantially when new flood levels are incorporated. Additional factors that are often not considered that were incorporated into the modelling here are the estimation of the astronomical high tide of 0.5 m (
Geoscience Australia 2015b), and the estimated storm surge of up to 0.5 m. So, if a 1-in-100-year storm occurred during high tide, the implications for the Municipality would be considerable. Although climate predictions indicate that rainfall in Southern Australia will likely decrease, precipitation is likely be more intense (
Parks Victoria 2010;
Department of Environment, Land, Water and Planning 2015;
Bienert 2014). It is anticipated that Melbourne will see an increase of 14 per cent in the annual frequency of severe thunderstorm days by 2100 (
Climate Council of Australia 2016). As shown in
Table 3, when considering additional property heights affected by floods, high tides and storm surges with a 1 m SLR, this makes the number of affected properties to significantly larger. Flooding at the 1-in-100-year level will affect 27 per cent of properties (currently based on height); if this occurs during high tide, 40 per cent of properties will be affected. A storm surge of 0.5 m will affect 45 per cent and a 1 m surge will affect 50% of properties. Thus, with an anticipated increase in storms of approximately 14 per cent, flood and storm damage will also increase and affect more properties more often, resulting in further direct, indirect and consequential losses.
Table 3 provides an overview of modelled heights and properties affected within the Municipality, as the bathtub model does not provide a high level of model precision. Further, its use in this context is not reliable.
Table 3 also indicates that the absolute worst-case scenario, the melting of the Greenland ice sheet and an expected SLR of 7 m (
IPCC 2014), would decimate the Municipality, with 76 per cent (approximately 48,000) properties underwater in the still-modelled assessment or 82 per cent of properties taking into account flood, high tide and storm surge to 0.5 m.
Further analysis was conducted for a range of heights to examine the effects on different property types.
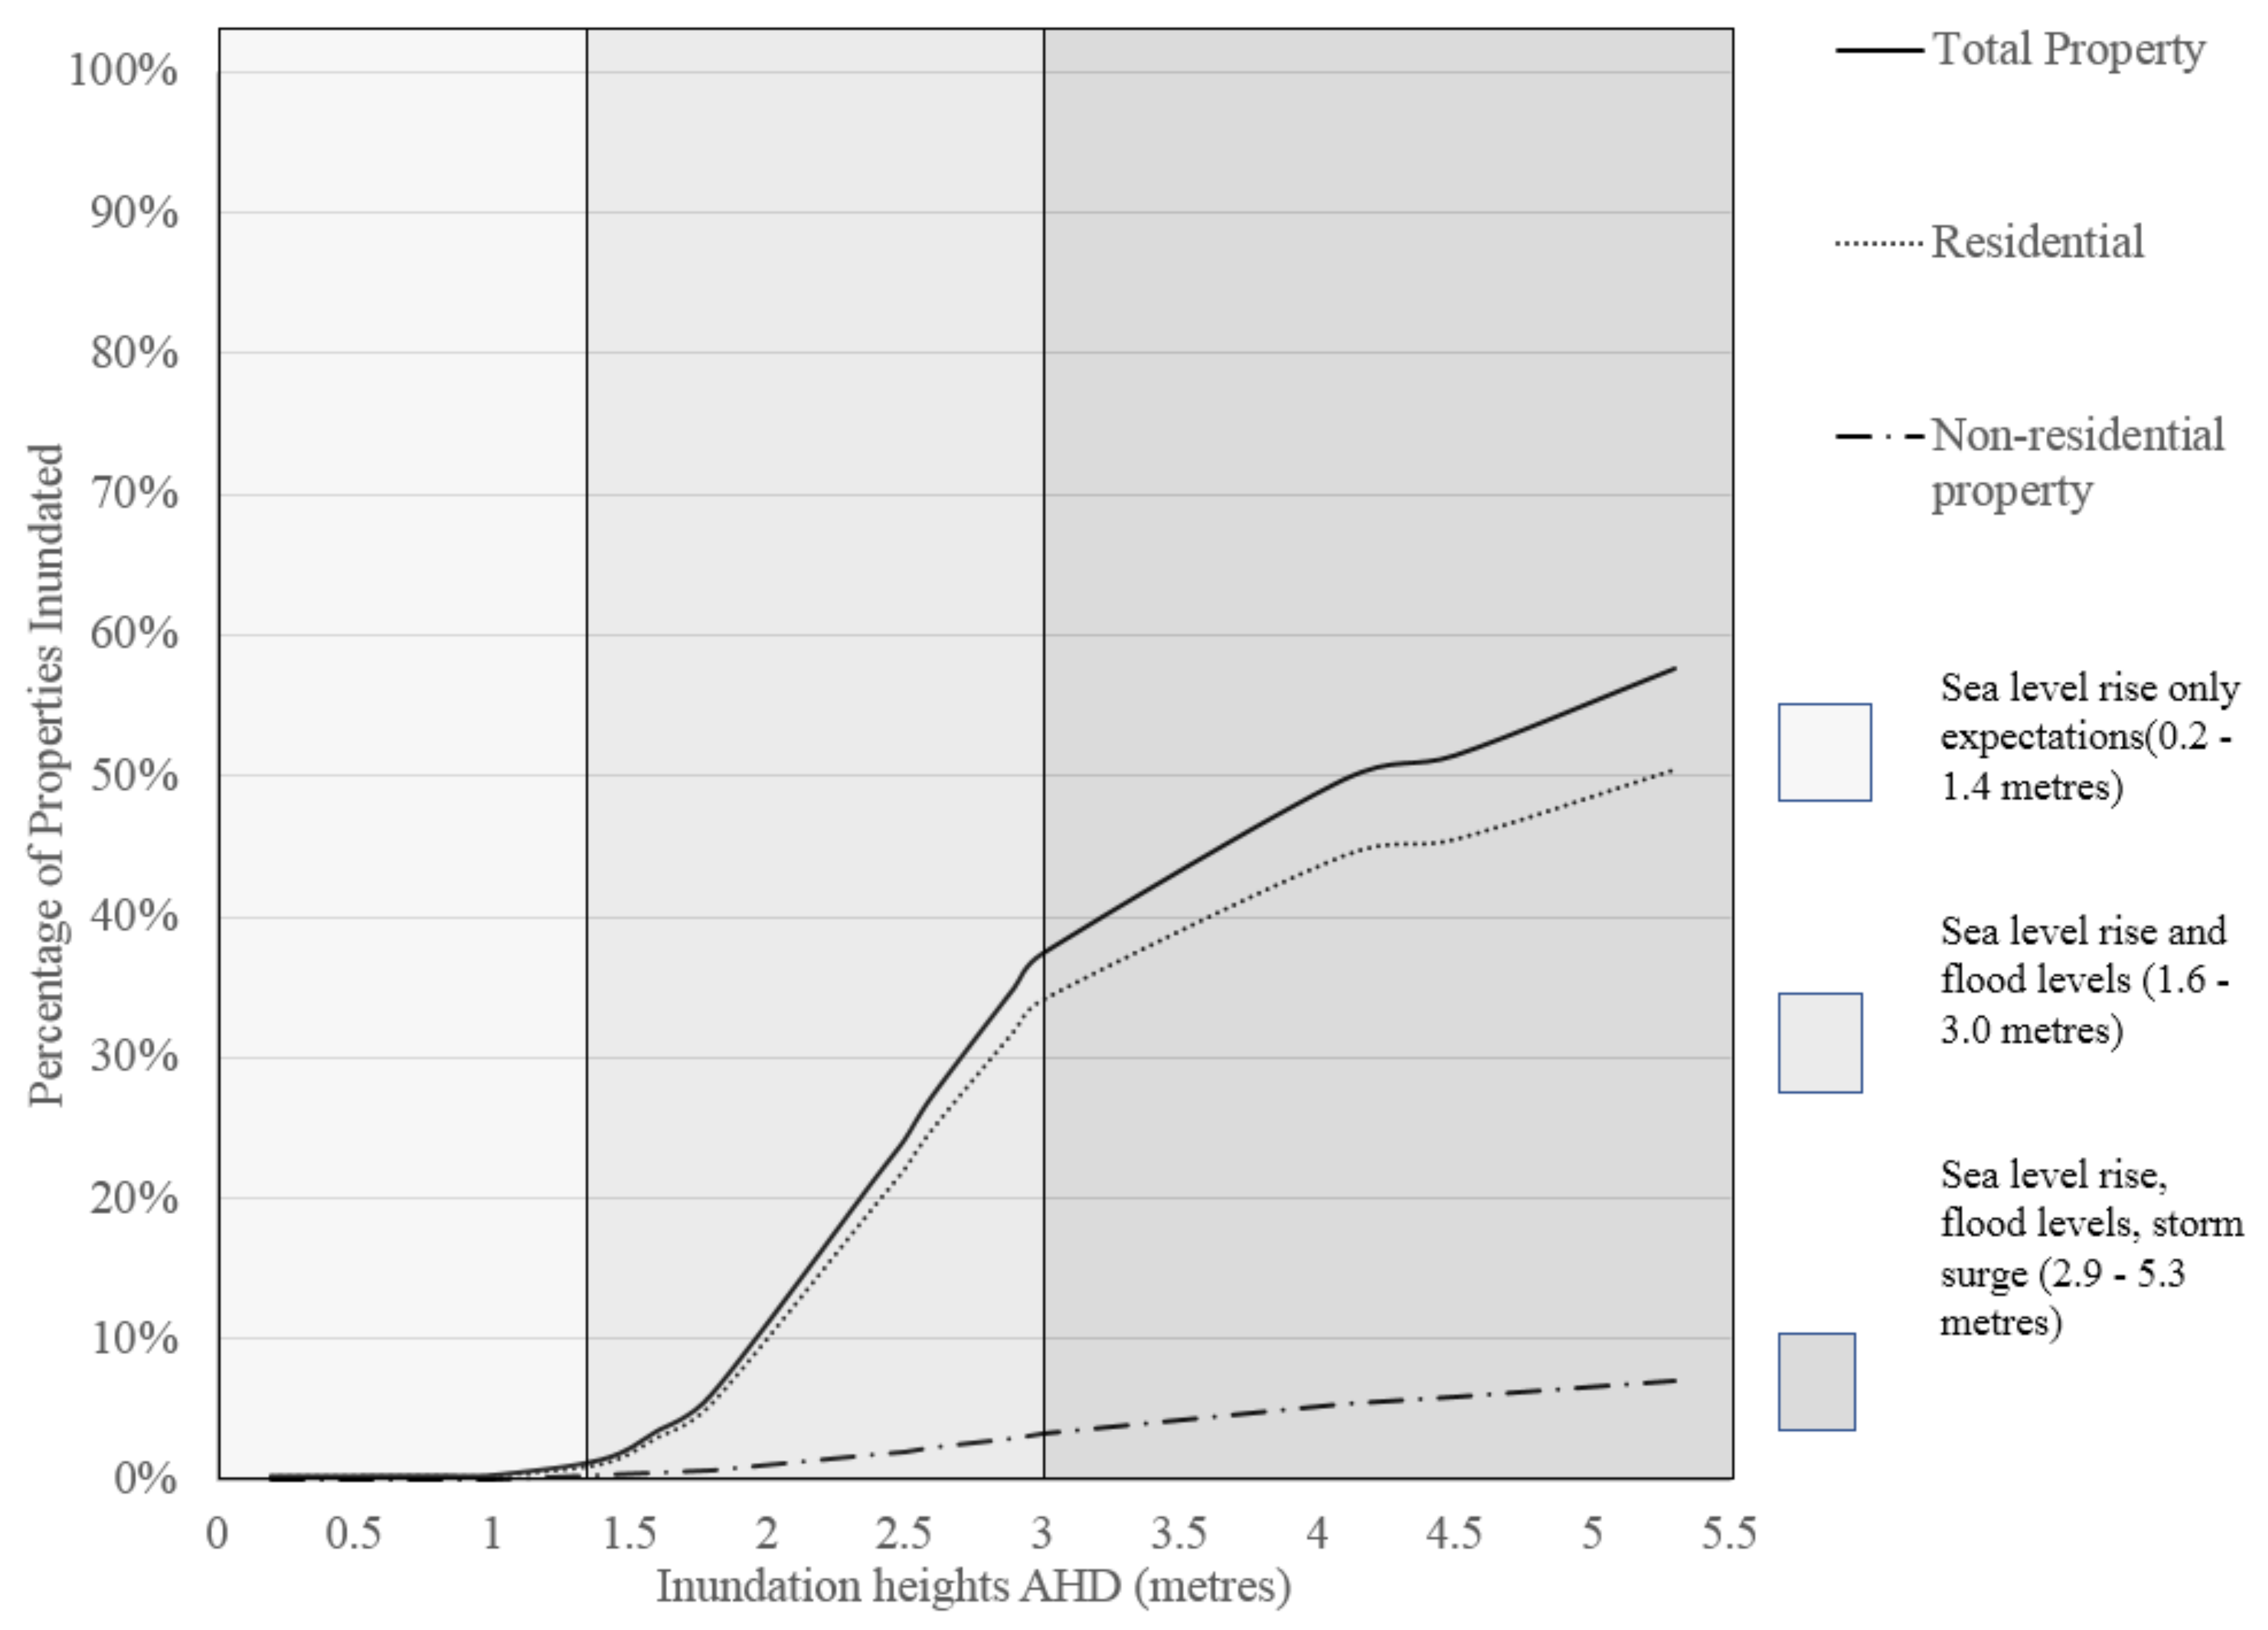
Figure 1 demonstrates that residential properties, as expected in this municipality, would be the worst affected. The chart also indicates that overall, not many properties would be affected with a 1 m SLR. Thus, direct and complete loss of property value is contained to approximately 0.3 per cent of properties in the Municipality in a 1 m SLR prediction. However, the number of properties affected by the future flooding potential is substantial—up to 50 per cent of the municipality. Residential properties by number are by far the worst affected. Thus, the first perception would be that residential properties will bear the full brunt of direct and indirect losses. It is also likely that in the future, as these trends become more evidenced, consequential losses will become a major consideration. The other consideration illustrated in
Figure 1 is the non-linear relationship between the changes in sea level height and flood estimations. The implication levels noted when 0.5 m of SLR is eamined, when adding flood- and storm-related effects, is that the number of properties affected increases substantially, from 0.23 per cent to 33 per cent.
The value of residential properties still indicates that within this municipality, the most susceptible properties are residences. This was expected, as this municipality is mostly residential, with pockets of industrial land to the Western side of the Municipality, commercial property in the Northern part of the Municipality, and retail comprising small shopping areas within each suburb. With much of the industrial land identified as future urban growth areas and substantial increases in density, the exposure of this land to potential SLR and flooding should be of concern to the local government. This modelling presents only a snapshot in time (2016 statutory values) of properties affected, with a range of limitations inherent in the modelling. When broken down into the different property types, residential properties (which comprise around 84 per cent of the Municipality’s properties) will be affected by SLR and associated flood-related events. However, if considered in terms of the property type and the amount affected by SLR, a slightly different perspective is presented (
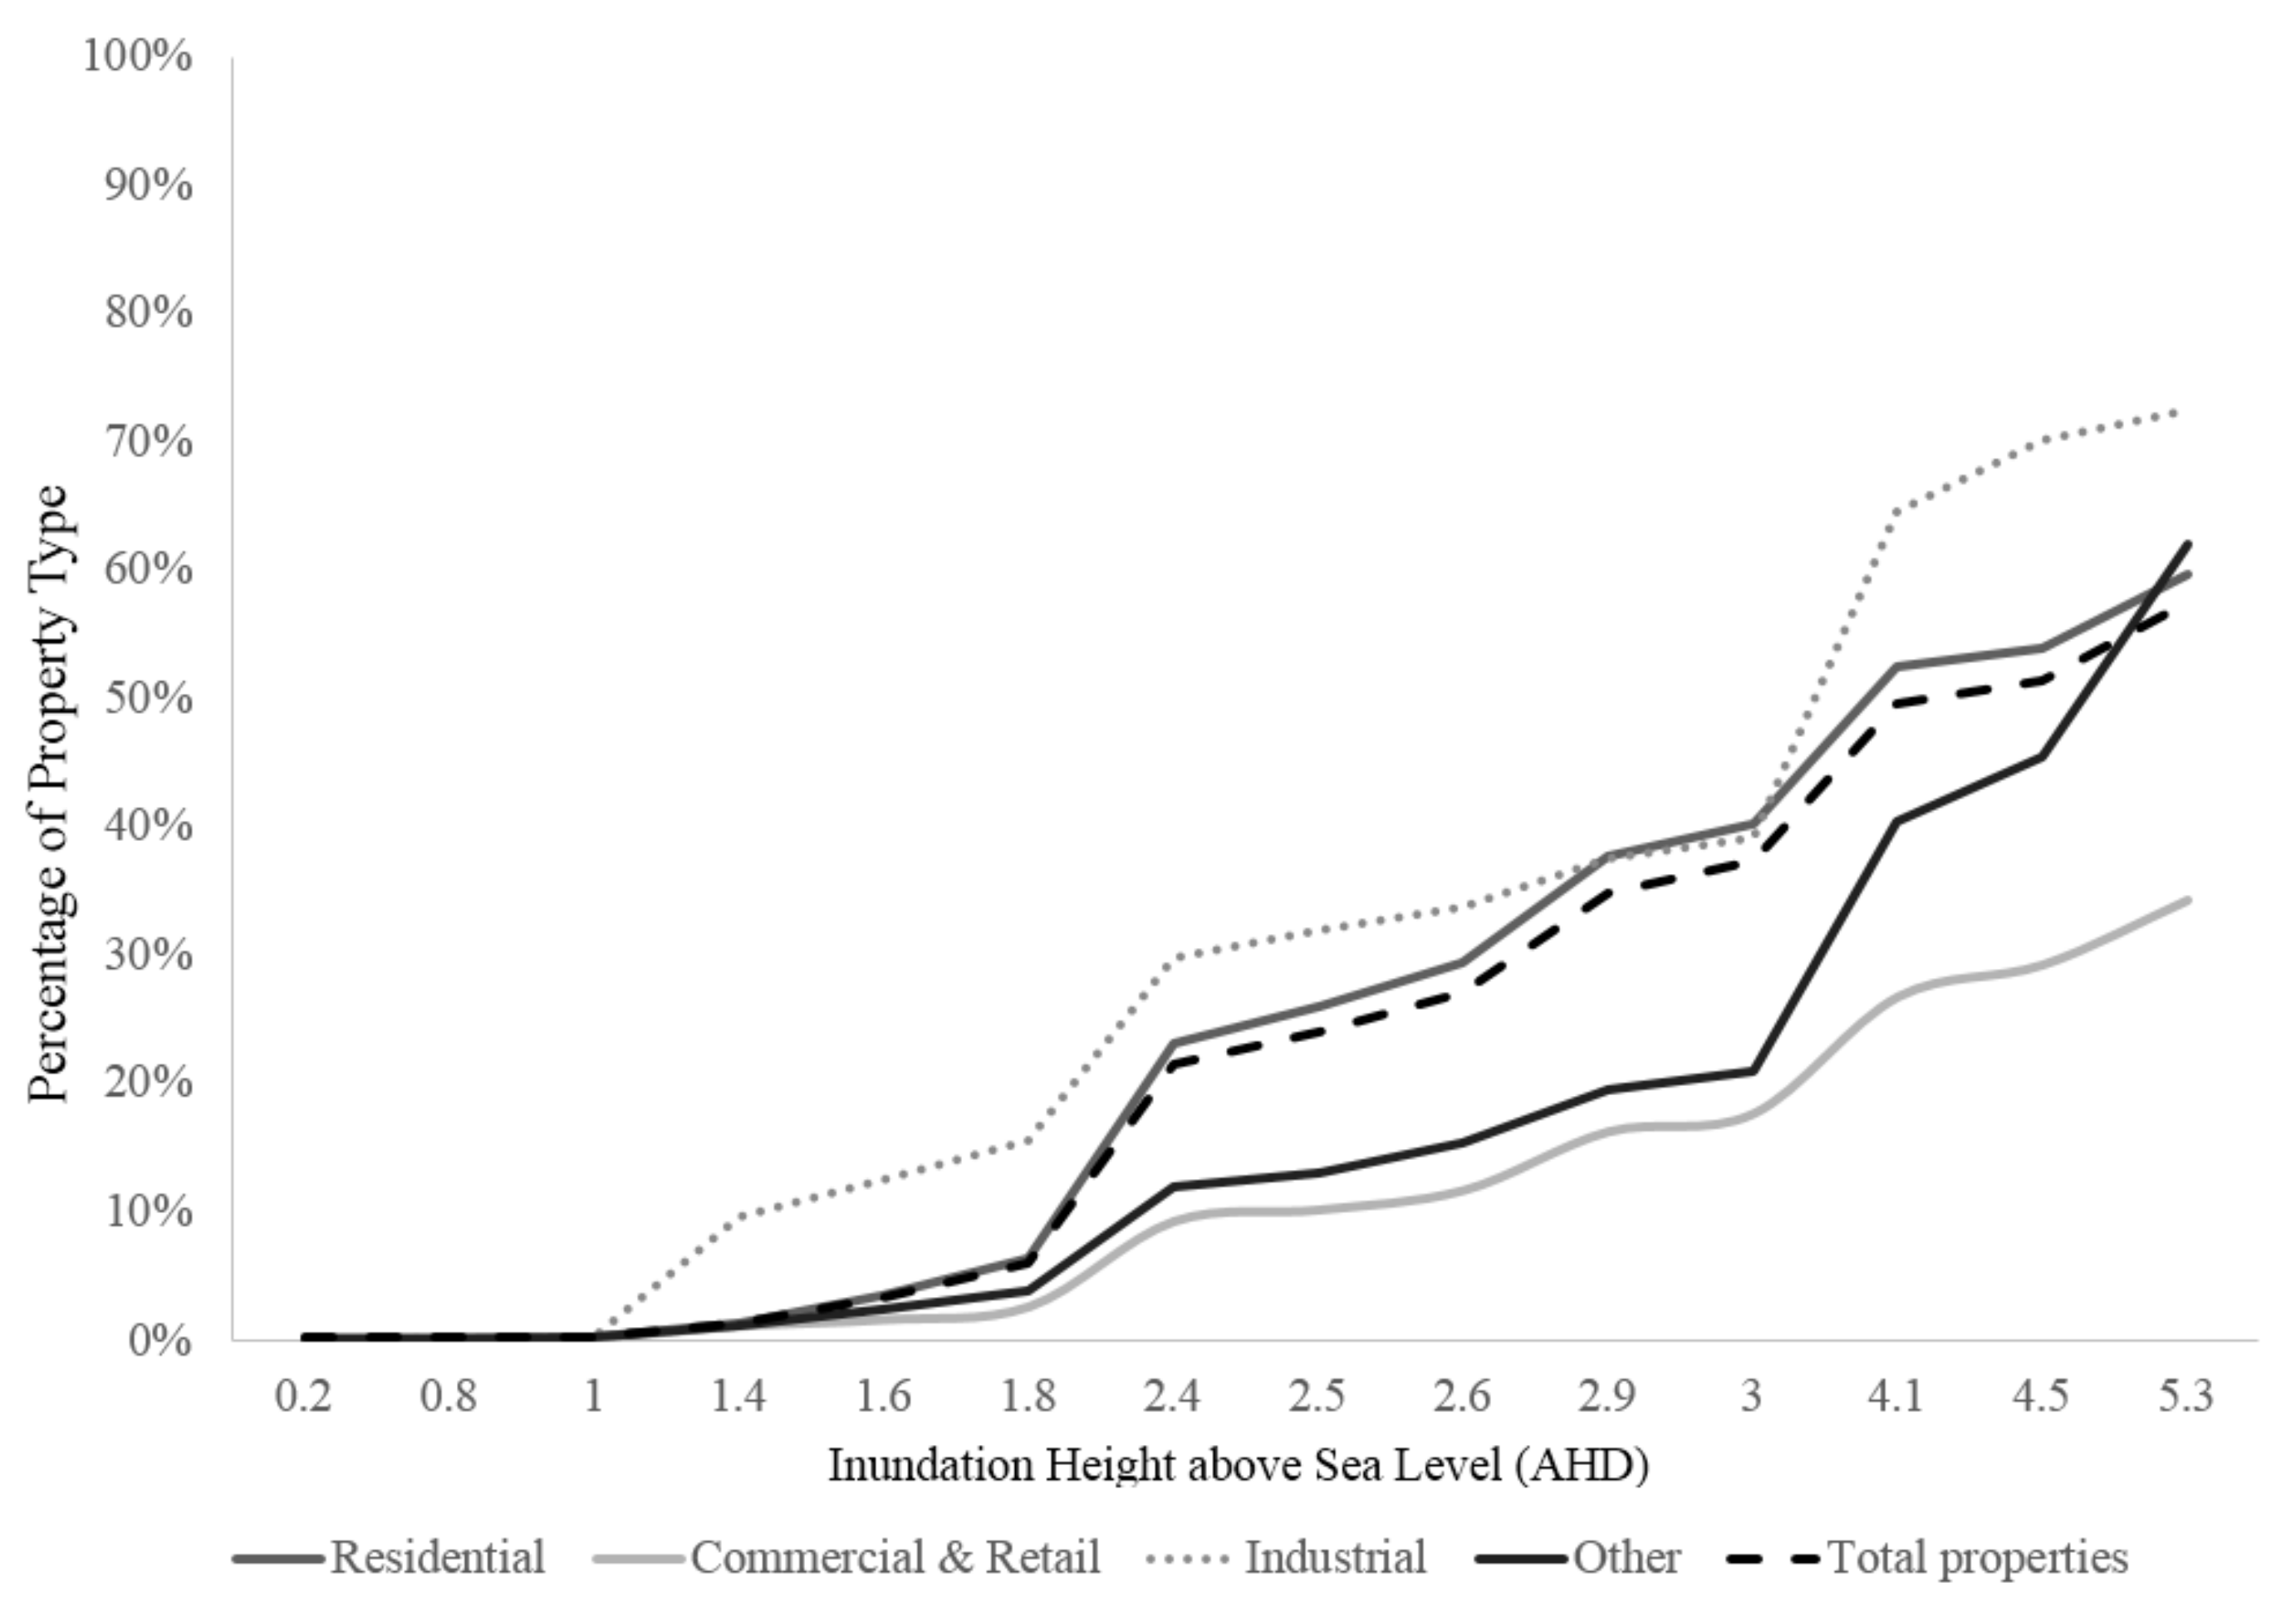
Figure 2). The total number of properties affected at an inundation level of 5.3 m will mean that 58 per cent of the Municipality’s properties will be affected. When considered by property type, industrial property appears to have the largest inundation level, with 73 per cent of industrial real estate lost at an inundation height of 5.3 m, while inundated residential property accounts for 60 per cent of all residential real estate. Other properties, when compared to those in their property type, are affected more greatly within the Municipality. At a 5.3 m inundation level, 62 per cent of other properties (e.g., schools, public land and parks) will be affected. Commercial and retail assets appear to be the least affected when compared to their own asset classes, with only 34 per cent likely to be affected at an inundation level of 5.3 m.
The risk demonstrated in this analysis highlights the exposure of industrial, residential and government-owned properties. Residential properties are still the most vulnerable in the Municipality; this raises concerns because residential properties are the most sensitive to insurance premiums, future cost implications, and are often the least insured or are underinsured (
Bienert 2014). Current owners are likely to be unaware of this risk, and unless specifically directed to look at the Coastal Risk tool or changes to flood-based overlays (although this does not specifically identify SLR), they are likely to remain unaware until significant action is taken by councils, public or the private sector that highlights risks through notifications in the sales process, on title or by insurance companies or lending difficulties. They will be completely unaware of the effect and cumulative impact of SLR and future flood layers and are likely to remain ignorant of the modelling parameters and lack of wind, storm and precipitation modelling.
Although total inundation because of SLR only is minimal based on these projections, the subsequent risk for other properties within the municipality is likely unknown and unaccounted for due to the lack of current information, perhaps lulling property owners and occupiers into a false sense of security. Property types displayed in
Figure 1 and
Figure 2 account for current use as of 1 January 2016. Consequently, the modelling undertaken only provides a snapshot of current property and density levels (as of 2016) and does not forecast the anticipated increases in density and development within the Municipality. The risk is likely underestimated in the Municipality, as there is increasing redevelopment of existing industrial land planned for higher-density developments, as well as the creation of new precincts. This former industrial area will be home to a new precinct, which will house approximately 80,000 new residents and provide 60,000 jobs on the waterfront, which could be threatened by SLR and future flooding issues. The refocus of the Municipality on the redevelopment of industrial land should be considered further, as the analysis in
Figure 2 highlights the potential substantial loss of industrial land in the municipality. Given the Municipality’s strategic direction and likely increase in density over the next century, consideration of the implications of SLR and new flood levels should be of utmost importance. Communicating this risk to residents and future residents should also be a priority. As potential future losses for residents could be significant, it is anticipated that of the
$54 billion (AUD) properties in this municipality (calculated based on 2016 statutory CIV values),
$670 million would be lost as a result of a SLR of 1.0 metres, and a further
$30 billion worth of property would be affected by discounting related to flooding. Further, if the anticipated SLR of 2.7 metres occurs, this will result in
$22.5 billion in property value lost, with a further
$14 billion affected by flooding.
Further, at present, Section 32 of Contract of Sale for property (which, in Victoria, details the particulars of a property: title, current covenants, caveats, planning and other salient elements) does not incorporate or suggest any implications of SLR. Consequently, future owners could be completely ignorant of the future risk to the property and are currently spending substantial sums to enter this bayside market without being fully aware of the risks. Homeowners and occupiers will likely be the most affected by a range of issues in relation to direct losses and consequential losses as the area becomes ‘known’ as a flood risk. As evidenced by the Brisbane floods, the government assists flood-ravaged residents and businesses; however, if these flood occurrences are set to increase and become steadily more severe, who will foot the bill? Certainly, as mentioned earlier, in the Queensland floods of 2012, the Australian government (through the Natural Disaster Relief and Recovery Arrangements) footed 75 per cent of recovery costs (
Wilson 2011). A flood levy on taxpaying Australians in fiscal 2011–2012 contributed to the A
$5.6 billion bill for flood devastation (
Australian Tax Office 2011;
Levy 2011). The annual average damage in Port Phillip and Westernport is estimated at about A
$399 million per year, and future predictions of cost will escalate as SLR changes existing flood levels and increasing extreme weather events cause heavy precipitation and flooding. Given the proposed escalation of risks associated with climate change and SLR and the likely impact this will have on the built environment, who is going to fund the losses? The direct, the indirect or the consequential? Property owners, local government, state or federal government, or taxpayers? In recent years, the Australian government has moved away from a collaborative and strategic approach to managing SLR by handing it to local councils, which have taken varying approaches, depending on location and action. Council direction is often determined by local community perceptions. However, when disaster strikes, some areas might survive while others are decimated, and the questions remain: Who is responsible? Where will the liability fall? Finally, who will pay the cost?
For other property types, the viability of businesses, occupation and manufacturing might be at significant risk on several levels. Direct inundation and damage costs will be felt years earlier than the SLR total loss of property, due to increased flooding and inundation during storm events. However, it will ultimately result in the total loss of value in properties and likely have impacts on occupants and businesses. Indirect costs leading up to the total loss of the property and/or new flood levels will have a range of implications relating to lost revenue from businesses, loss of products and jobs, causing financial strain on owners and occupants. Further, as flooding events increase, consequential long-term losses will increase, which will lead to lower direct investments, increased vacancy and loss of demand for property in that locale due to the increased risk and costs associated with owning or occupying such premises. This will affect the value of properties within these areas, resulting in discounts associated with properties at risk of full inundation and intermittent flooding. The anticipation of these discounts is an area for future research, yet the implications for local authorities’ future budgets are negative, as the funding of municipal councils is based only on property taxes within the area. Given that the council will likely be expected to lead and fund many of the adaption measures, it will face the financial pressures of finding additional capital with an increasingly smaller budget as SLR and flood events affect existing property values.
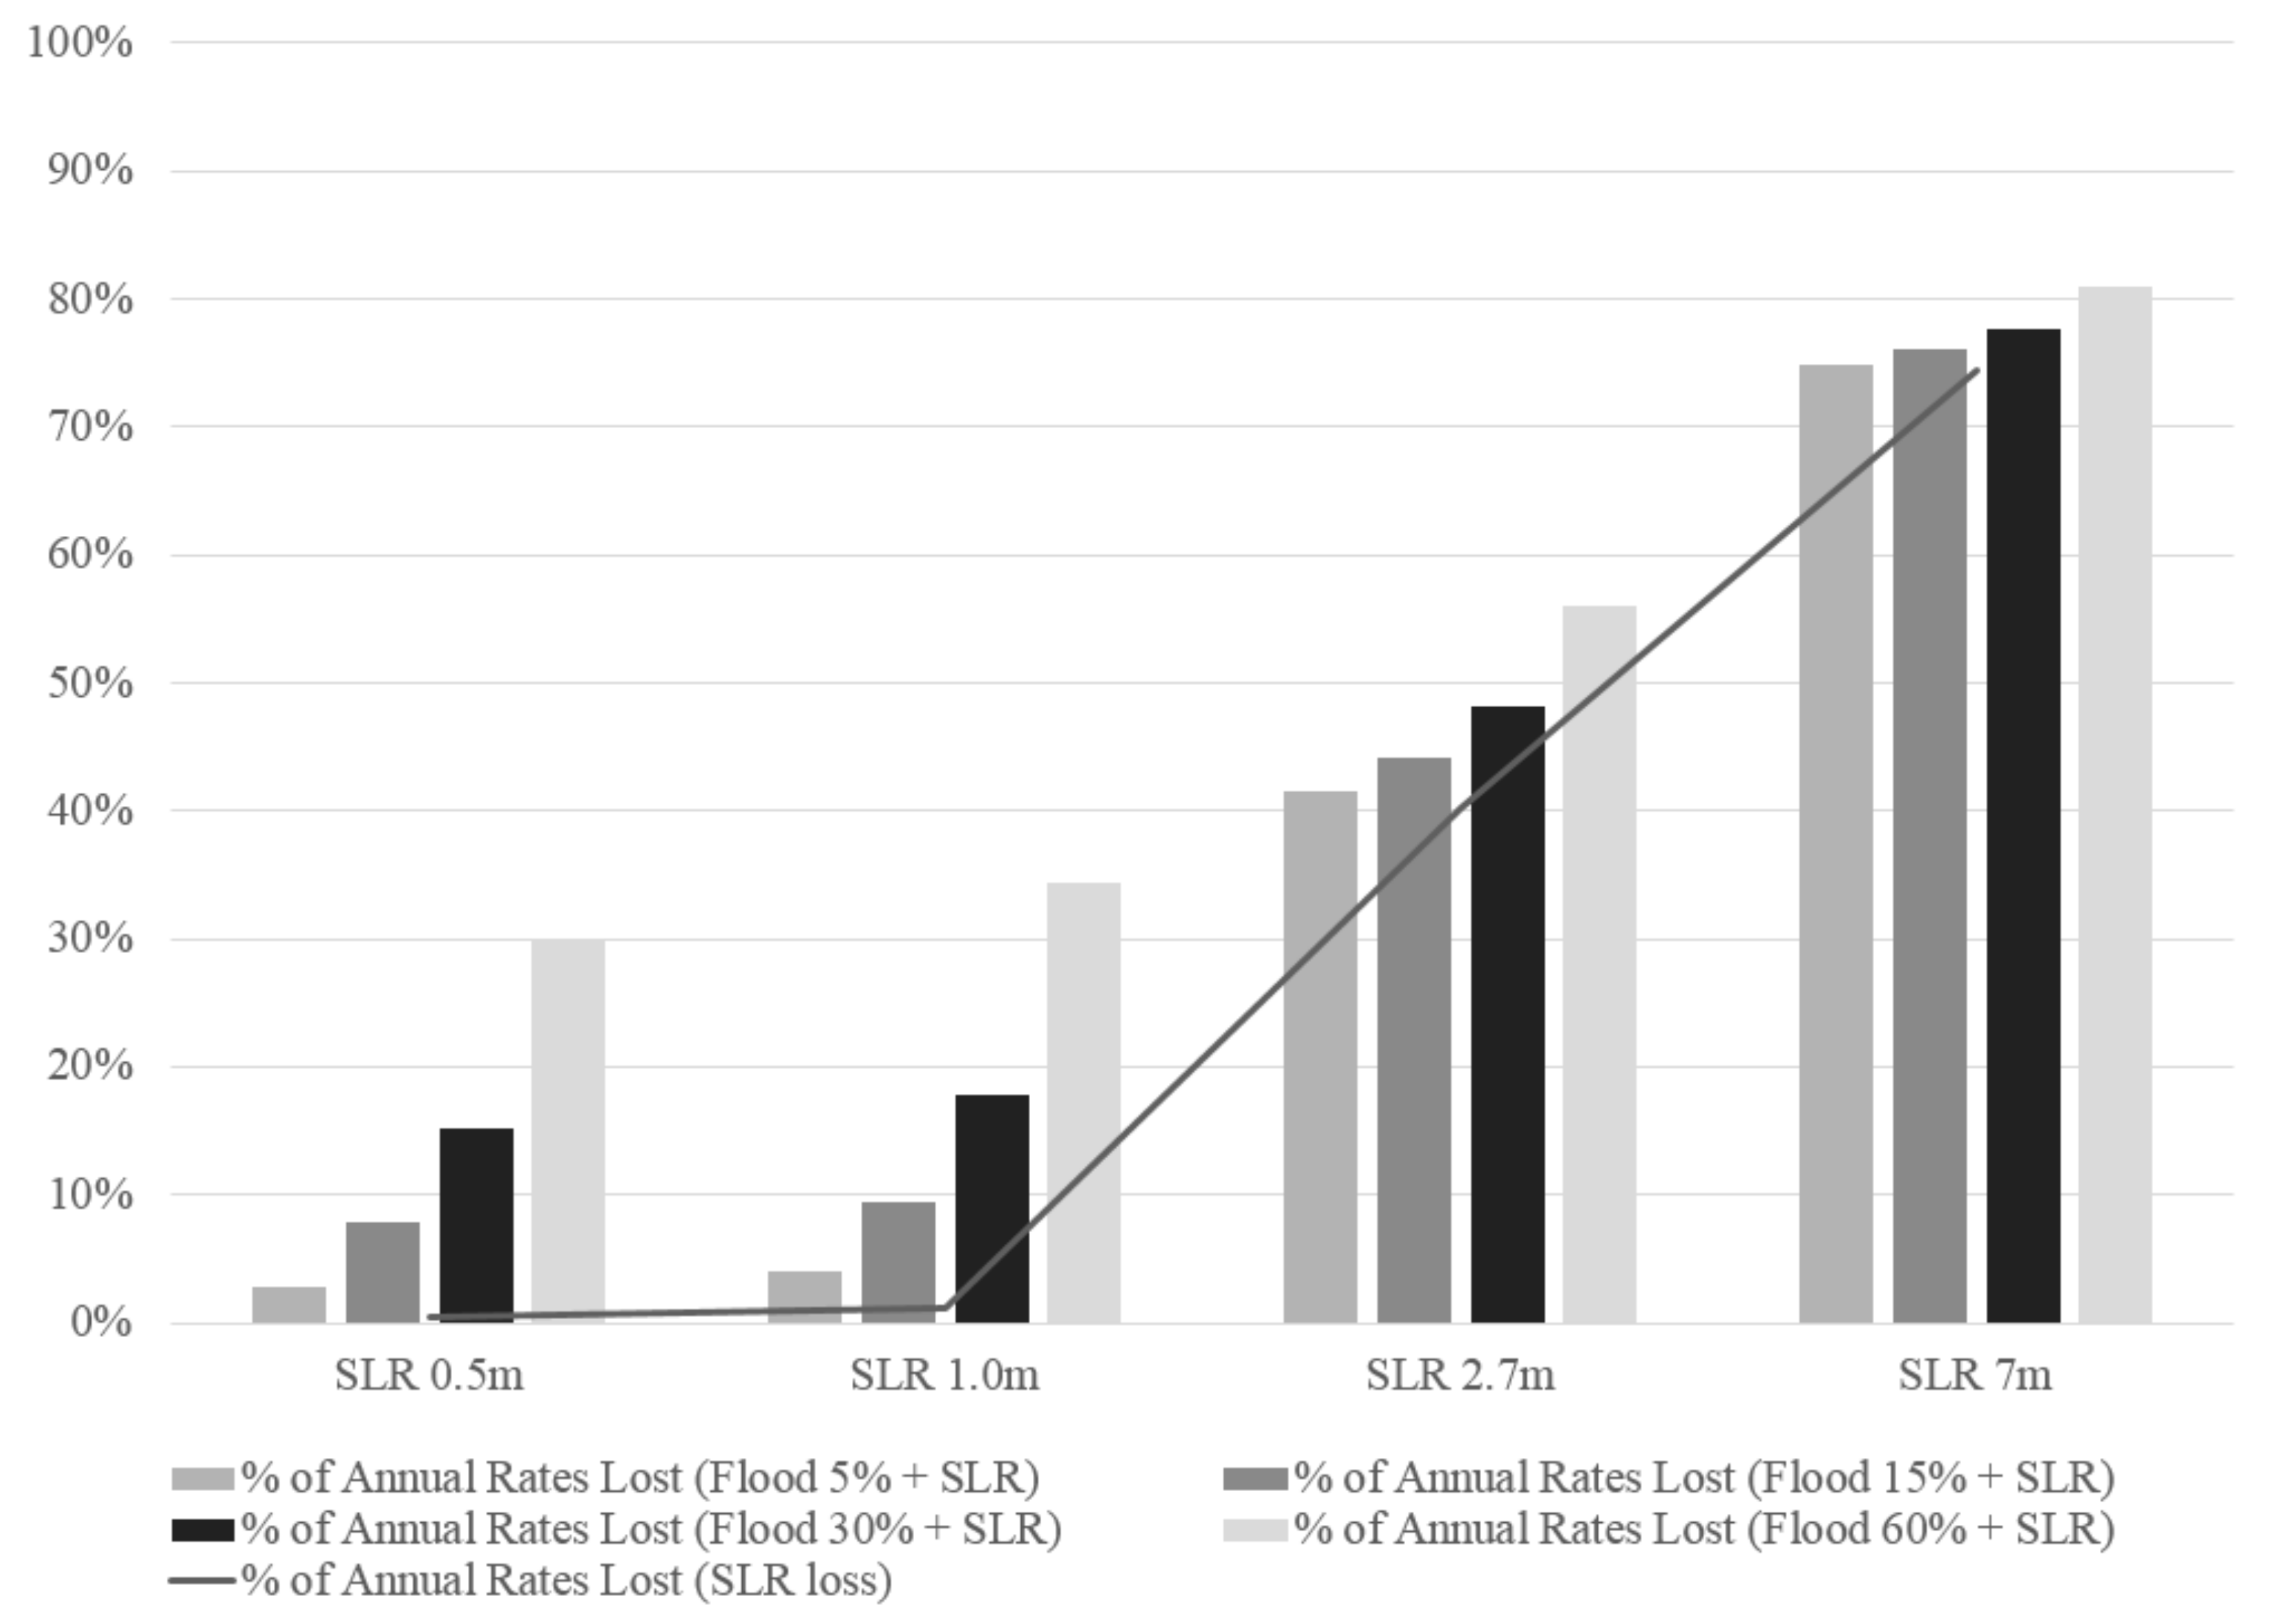
Figure 3 presents a snapshot of the potential annual budgetary implications for the Municipality under straight SLR (line) through the percentage of rates lost, based on the 2016 statutory valuations. The bars demonstrate the SLR loss component in the form of rates payable and the percentage of annual rates due to partial loss in property values based on several flood discount scenarios. The calculation of rates was based on the NAV of the individual properties; for those that were identified as affected by SLR only, it is assumed there is no value in the land (due to complete inundation) and consequently, no rates are payable. For those properties that are not directly affected by SLR, yet then become more affected to flooding based on existing flood measures discussed earlier, anticipated losses in value have been modelled at 5%, 15%, 30% and 60%; these losses would have a subsequent effect on the rates payable. It is likely that in earlier estimations, the discount levels would be minimal, but would grow over time as the market becomes more aware of the risks and cost implications of increased flooding. This demonstrates that the loss in annual rates from properties, particularly those affected by flooding, will have an effect on council rates before the properties are inundated by SLR. Further, the Municipality’s tipping point between the SRL ranges of 1.0 and 2.7 m will have a substantial impact on the annual income for the municipality. Therefore, the challenges lie in designing proactive approaches for future adaption to SLR and flood-related impacts before the effects become apparent. This analysis highlights the potential implications, particularly in the lower scenarios of SLR 0.5 m and SLR 1.0, of changes that may occur in market perception. As knowledge, understanding and risk avoidance of properties affect by SLR and/or flooding increases, the discounting factor may escalate, which then has a greater effect on annual rate income.
5. Conclusions
This research highlights the vulnerability of properties to SLR, both in physical and financial terms. While the risk directly related to SLR of up to 1 metre may not be very large in this study area, this may not be the case in many other areas. Many of the SLR models and projections assume a flat-water scenario that does not consider tides, wind, precipitation and storms. This study incorporated some of these considerations, using existing information and research, combined with property information, to demonstrate the increased flood risk that properties will be subjected to in the event of SLR. The number of affected properties disproportionately increases as elements of high tide, existing flood levels and storm surge are considered.
It is becoming more established that SLR will occur, but the extent of its impact is uncertain. The likelihood and impact will depend largely on global efforts to mitigate and adapt. For property stakeholders, the risk of SLR is significant; the absolute levels and the subsequent combined impacts of increased flooding are very likely to have a detrimental impact on values over the long term.
The evidence reviewed in this paper suggests that SLR poses clear physical and financial risks to real estate assets, with implications ranging from total loss in value to periodic losses from increased flooding. The study also highlighted the range of property affected; the municipality studied here is mostly residential, which is generally the most vulnerable of the property types. However, the implications for other property types were also highlighted. The substantial loss of industrial land was also identified and, as much of this land is slated for future redevelopment, there is a need for public authorities to take a more considered approach regarding expansion and density increases within the municipality. Action from a broad stakeholder group comprising owners, investors, occupiers, and local and state government seems advisable. In particular, a strategy for mitigation and adaption for a broad range of property types in an area larger than originally anticipated should be developed. For owners, occupiers or managers of property, either privately or in the public realm, there appears to be a need for an integrated approach that involves both private and public stakeholders in the development of strategies and action plans for existing property and future development.
SLR policy development is predominately a focus of local, state and federal governments, yet its action and implementation falls to local levels in relation to planning and policies. Local government policy and action is variable across municipalities and states, with varying approaches toward the public in terms of engagement and assistance in awareness and action. To date, there has been little consideration, interaction or action by private property stakeholders. The implications to value are a clear concern for property stakeholders, so the lack of discussion, mitigation and action coming from the property sector in relation to SLR may be surprising. This may be due to the complexity of the relevant information and the inconsistent modelling and reporting; however, perhaps the real impacts are not clear. As more information about the predicted impacts of SLR on the built environment becomes available, a wider range of property stakeholders is likely to consider the broader implications of SLR and the increased risks associated with properties near coastal areas. The escalation of extreme events and its impact on communities will question and test the capacity of local councils and governments to manage the effects of extreme events economically and legally.


