Abstract
This paper examines the effect of gainsharing provisions on the selection of a discount rate for a defined benefit pension plan. The paper uses a traditional actuarial approach of discounting liabilities using the expected return of the associated pension fund. A stochastic Excel model was developed to simulate the effect of varying investment returns on a pension fund with four asset classes. Lognormal distributions were fitted to historical returns of two of the asset classes; large company stocks and long-term government bonds. A third lognormal distribution was designed to represent the investment returns of alternative investments, such as real estate and private equity. The fourth asset class represented short term cash investments and that return was held constant. The following variables were analyzed to determine their relative impact of gainsharing on the selection of a discount rate: hurdle rate, percentage of gainsharing, actuarial asset method smoothing period, and variations in asset allocation. A 50% gainsharing feature can reduce the discount rate for a defined benefit pension plan from 0.5% to more than 2.5%, depending on the gainsharing design and asset allocation.
1. Introduction
This paper defines the cost of gainsharing as the reduction in the expected return on plan assets due to automatically removing a portion of excess investment gains for future gainsharing to plan participants. Even if some further action is required to actually distribute the excess investment gains, the cost event occurs when a portion of excess investment gains are removed from the pension plan assets. The cost is not dependent on whether the excess investment gains are provided to current retirees or another portion of the plan population, or whether the form of gainsharing is a 13th check or a permanent Cost-of-Living-Adjustment (COLA).
Gainsharing in a pension context is an asymmetric benefit; that is, benefits increase under favorable scenarios but do not decrease under unfavorable scenarios. There are many different pension gainsharing designs, such as a floor offset plan. Using excess pension fund returns for cash balance plan interest credit rates, perhaps with a minimum interest credit rate, is another example of gainsharing. Pension gainsharing is typically the sharing of unanticipated investment gains with some or all of the pension plan population—usually current retirees. Favorable (higher) mortality experience has also been discussed as a possible gainsharing design (Piggott et al. 2005), although that article anticipated decreases in annuity payments for unfavorable (lower) mortality experience.
Profit commissions in reinsurance provide a similar gainsharing analogy. Some brokers and reinsurance purchasers attempt to insert profit commission language in their contracts and they argue that these provisions are “free.” Reinsurance underwriters and actuaries understand that profit commissions are in fact not free, and that their inclusion will increase the quoted price.
Several states appear to have or had some form of gainsharing in their retirement systems, among them Alaska, Arizona, Arkansas, Connecticut, Illinois, Indiana, Louisiana, Michigan, Minnesota, Mississippi, Oregon, and Texas, and quite possibly other states.
The New York Times cited gainsharing as a contributing factor to the underfunded status of Detroit’s two large retirement systems (New York Times 2013). Bloomberg mentioned an analysis during Detroit’s bankruptcy proceedings that said one of the systems paid about $951M in gainsharing benefits from 1985 to 2008, which would have accumulated to about $1.92B with the foregone interest (Bloomberg News 2013). This particular form of gainsharing required the city council’s approval before it was paid, but gainsharing was approved 18 times during the 23 years of the analysis. Gainsharing was stopped in 2011, but the 2011 and 2012 payments were made retroactively due to provisions in Michigan’s Constitution.
Washington State added a gainsharing provision to its retirement system in 1998. This provision gave members and retirees of certain state pension plans a share of “extraordinary investment returns” whenever the pension trust funds had average investment gains of more than 10% over the preceding four years (Department of Retirement Systems 2014a). Gainsharing events occurred in 1998 and 2000, for total gainsharing expenditures of about $1.0B (Washington State Court System 2014). The legislature repealed this gainsharing provision in 2007 and replaced it with other pension benefits, including options for early retirement (Department of Retirement Systems 2014b). The pensioners sued and the case worked its way through the courts and was argued before the Washington State Supreme Court in October 2013. That court ruled on August 14 2014 (Washington Supreme Court 2014) that the repeal was allowable, because the enacting language contained a reservation of rights clause, stating that the legislature could repeal the benefits at a later date.
Yet, the actuarial literature on estimating the cost of gainsharing favorable pension investment experience is rather meager. Dr. Jeremy Gold, an actuary who co-authored (with Lawrence Bader) a seminal paper (Bader and Gold 2003) on the application of Financial Economics to pension plans, briefly mentioned “skim funds” in his September 2000 dissertation (Gold 2001). The Society of Actuaries published research papers on pension gainsharing in 2011 (Buchen et al. 2011), 2012 (England et al. 2012) and 2013 (Shang et al. 2013).
However, the current Actuarial Standard of Practice #4 (Actuarial Standards Board, 2013) Measuring Pension Obligations and Determining Pension Plan Costs or Contributions, requires actuaries to disclose the methods or procedures they used to estimate the cost of asymmetric benefits such as gainsharing, effective for measurement dates on or after 31 December 2014. The language of Section 3.5.3 of Actuarial Standards of Practice #4 (Plan Provisions that are Difficult to Measure), which specifically mentions gainsharing, states in part, “For such plan provisions, the actuary should consider using alternative valuation procedures, such as stochastic modeling, option-pricing techniques, or deterministic procedures in conjunction with assumptions that are adjusted to reflect the impact of variations in experience from year to year.”
2. Results
The baseline asset allocation was 60% equities, 25% long-term government bonds, 10% alternative investments, and 5% treasury bills for the first three findings. There was no smoothing period used for the first two findings. Those two findings were then compared to the results using a two-, three-, four-, and five-year actuarial asset smoothing periods. The last finding used varying asset allocations with a five-year smoothing period and a 10% hurdle.
There were four primary findings from an analysis of the model’s output:
- The higher the hurdle rate, the lower the cost of gainsharing.
- The cost of gainsharing is directly proportional to the percentage of favorable investment gains that are gainshared.
- If excess investment gains are calculated from smoothed assets, the cost of gainsharing decreases as the smoothing period increases.
- More aggressive asset allocations lead to greater “peak” returns for a given hurdle rate and smoothing period, which increases the cost of gainsharing. However, these greater returns also experience greater volatility, which further increases the cost of gainsharing.
2.1. Hurdle Rate
When an actuary assumes a future discount rate, such as 7.25%, the actuary knows that the fund will not earn exactly 7.25% every year. The fund may earn 15.54% in one year and the fund may lose 12.06% in another year. The actuary assumes that these investment gains and losses will offset each other over time, and the fund will earn an average of 7.25% over the life of the plan.
However, when a portion of investment returns above the hurdle rate are shared with plan participants, investment returns above 7.25% will not completely offset investment returns below 7.25% and the fund will not earn 7.25% over the life of the plan. If the fund earned 16.54% in some future year, and the pension plan provisions required sharing half of investment gains over a 10.00% hurdle, then plan participants would receive 3.27% of fund assets (half of the net of 16.54% minus the 10.00% hurdle rate) in that year. Thus, the fund would actually have earned only 13.27% in that year.
Figure 1 and the supporting data in Table 1 display one of the 5000 30-year simulations for a 10% hurdle, 50% gainsharing, no smoothing period, and the baseline asset allocation. It shows each year’s total investment return and the investment return after gainsharing. In this simulation, the pension fund earned 10.19% before gainsharing, and gainsharing lowered the fund’s 30-year return to 8.07%. Thus, the cost of gainsharing for this single simulation and these parameters was a reduction in the discount rate of 2.12%. For comparison, after 5000 simulations, the fund earned 9.38% before gainsharing, and gainsharing lowered the fund’s 30-year return to 7.05%. The average cost of gainsharing was 2.33%. The corresponding standard deviations were 10.50%, 8.05%, and 2.90%. For comparison, the corresponding standard deviations after 5000 simulations were 2.40%, 1.88%, and 0.52%.
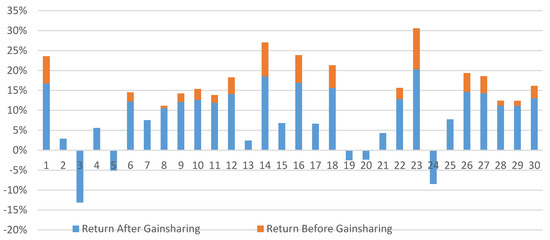
Figure 1.
Annual returns before and after gainsharing.

Table 1.
Returns Before and After 50% Gainsharing in One of 5000 Simulations.
Figure 2 displays the relationship between the hurdle rate and the cost of gainsharing for the baseline asset allocation and smoothing period. The cost of gainsharing, which is the decrease in the expected return on plan assets for this model, ranges from 2.57% for a 9.00% hurdle to 1.356% for a 15.00% hurdle rate. Thus, the actuary would lower the discount rate by these amounts for a 50% gainsharing design with these sample hurdle rates, no smoothing period, and the baseline asset allocation.
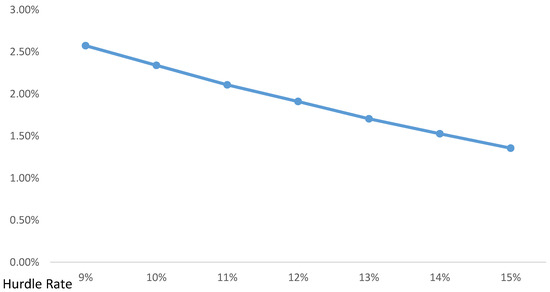
Figure 2.
Cost of 50% gainsharing by hurdle rate.
2.2. Percentage of Gainsharing
Intuitively, the cost of gainsharing should be directly proportional to the percent of investment returns over the hurdle rate that are provided to pension plan participants. Figure 3 displays the model’s results of varying the amount of gainsharing, confirming this intuitive conclusion.
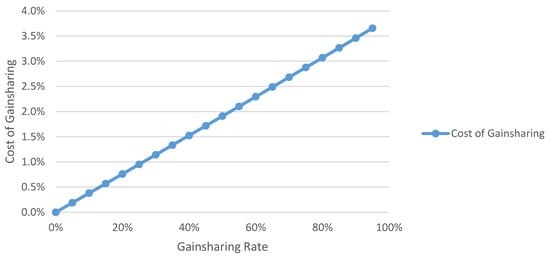
Figure 3.
Gainsharing rate vs. cost of gainsharing.
2.3. Smoothing Period
An actuarial asset smoothing method averages investment gains and losses over a defined smoothing period, typically three to five years. Plan sponsors utilize a smoothed actuarial value of assets in the belief that this method will help stabilize their contributions, though this does not always occur to the extent that plan sponsors desire. This paper uses the term “smoothing period” for the longer “actuarial asset method smoothing period.”
Suppose the fund earned 17.54%, −11.06%, 7.23%, 20.48%, and 17.27% over a five-year period. Without a smoothing period, the first, fourth, and fifth years would call for gainsharing a portion of investment gains over 10.00% with plan participants. However, if the gainsharing plan provisions required an investment gain to exceed a 10.00% hurdle rate for a rolling five-year period, then plan participants would receive only 0.292% of fund assets at the end of the fifth year.
(17.54% − 11.06% + 7.23% + 20.48% + 17.27%)/5 − 10.00% = 0.292%
If the fund earned 16.08% or less in the sixth year, then plan participants would not receive gainsharing at the end of the sixth year.
(−11.06% + 7.23% + 20.48% + 17.27% + 16.08%)/5 − 10.00% = 0.0%
Figure 4 and the supporting data in Table 2 display the relationship of the smoothing period on the cost of gainsharing with a 10.00% hurdle. The cost of gainsharing, which is the decrease in the assumed discount rate for this model, ranges from 1.83% for no smoothing period to 0.77% for a five-year smoothing period. Thus, the actuary should lower the discount rate by these amounts for these smoothing periods, given a 50% gainsharing design, a 10.00% hurdle rate, and the baseline asset allocation.
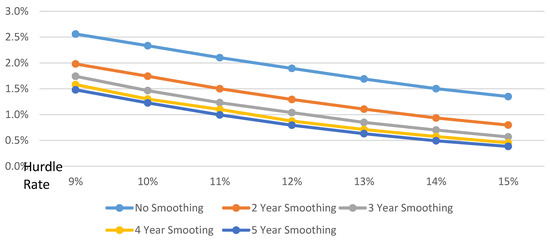
Figure 4.
Cost of gainsharing by hurdle rate and smoothing period.
Table 2.
Cost of 50% Gainsharing by Hurdle Rate and Smoothing Period.
Figure 5 and Table 3 show the fund’s returns before and after 50% gainsharing with a 10% hurdle rate for these smoothing periods.
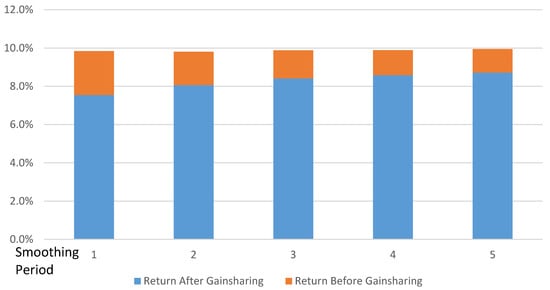
Figure 5.
Cost of gainsharing by smoothing period.
Table 3.
Returns Before and After 50% Gainsharing by Smoothing Period for 10% Hurdle Rate.
2.4. Asset Allocation
Four portfolios were constructed, ranging from conservative to aggressive. The allocations to stocks and alternative investments were increased in the aggressive portfolios, while the allocation to long-term government bonds decreased. Table 4 displays the asset allocation in each portfolio.
Table 4.
Asset Allocation of the Four Portfolios.
Figure 6 and its supporting data in Table 5 display the fund’s returns before and after 50% gainsharing for each of these asset allocations, a 10% hurdle rate, and a five-year smoothing period. As expected, the more aggressive portfolios yielded higher returns. These higher returns provided more favorable investment returns to be gainshared, thus increasing the cost of gainsharing for the more aggressive portfolios. Greater volatility of the more aggressive portfolios also increases the cost of gainsharing, as the investment return “peaks” are higher, leading to greater gainsharing. However, a five-year smoothing period tends to dampen the cost of gainsharing.
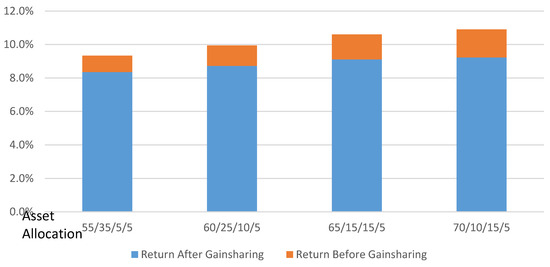
Figure 6.
Returns and cost of gainsharing for four asset allocations.
Table 5.
Effect of Asset Allocation on Returns Before and After 50% Gainsharing.
2.5. Limitations of the Model
This model has some limitations because it was a one semester independent study project. For example, inflation is a significant factor in investment returns, particularly long-term bond returns, but the model does not reflect current or future inflation in any of the future asset class returns. Also, current long-term bond returns are near historic lows, and the model ignores this when it generates bond returns in the early years of the projection. Many more sophisticated models have been developed to calculate discount rates with additional asset classes, beginning with the current investment environment.
The use of Ibbotson data, the alternative investment class, and treasury bills all produced a particular set of results. Using different sources of data for the historical returns or different historical periods would undoubtedly lead to different results. While this model used only four asset classes, most pension funds have several more asset classes, each with its own expected return and volatility. Using more asset classes would also lead to different results.
However, these limiting factors are all applied equally to the calculation of future returns without and with gainsharing. This paper focuses on the difference between these two returns, and not on the absolute value of either return, thus minimizing the impact of these limitations.
This model is intended to illustrate the impact of various gainsharing designs under different circumstances, and should not be used to calculate the cost of gainsharing in any specific situation.
3. Discussion
Many defined benefit pension plans, particularly public retirement systems, contain gainsharing provisions. Most of these designs provide gainsharing benefits to existing retirees, but gainsharing can also be provided to active participants. For example, a cash balance plan could provide additional interest credits to active participants in a year when investment earnings exceed the hurdle rate. Indeed, a few of these plans already exist. A career average plan could also provide an additional automatic retroactive accrual after a plan year of favorable investment experience. However, Actuarial Standards of Practice #4 requires an actuary to select a discount rate that reflects any gainsharing provision and to disclose how the impact was derived, or to disclose that the gainsharing benefit was not reflected in the calculations and the rationale for excluding it. This requirement is effective for measurement dates on or after 31 December 2014.
Note that some plan designs have been developed that may appear to be gainsharing designs, but are not. Participants in the New Brunswick Shared Risk Pension Plan (Munnell and Sass 2013) have a base benefit and an ancillary benefit. The base benefit does not change but the ancillary benefit can increase or decrease, depending on the funded status of the pension plan. Participants in a Retirement Shares Plan (Fuerst 2014) design might also have their benefits increase or decrease. Retirement Share Plan participants can elect certain investment choices, and their benefits are based on the investment experience of the underlying investments.
The distinguishing characteristic of these last two designs are their symmetry. That is, participants are exposed to the risk of their benefits increasing or decreasing. In asymmetrical gainsharing plan designs, participants’ benefits can increase with no downside risk, and that risk is borne by plan sponsors or tax-payers in the case of public plans.
4. Materials and Methods
This section describes the development of a stochastic Excel model that demonstrates the cost of gainsharing favorable pension investment using stochastic techniques. Analyzing the output of the model, this paper makes certain observations on the estimated cost of gainsharing based on hurdle rates, the percentage of gainsharing applied to excess investment gains, the actuarial asset method smoothing period, and variations in asset allocation.
The stochastic model uses four asset classes:
- Large company stocks
- Long-term government bonds
- Alternative investments
- Treasury bills
The first three asset classes model future returns using Ibbotson (Ibbotson Associates 2010) data from 1926 through 2009. The historical data for the first two asset classes was fitted to a pair of three parameter lognormal distributions which were used for the model’s asset return projections. Commercial software identified three parameter lognormal distributions as well fitting distributions to the underlying data according to Kolmogorov-Smirnov and Anderson-Darling criteria.
A lognormal distribution was used when the original data is positively skewed, but the natural logarithms of the original data tend to follow a normal distribution. In this distribution (Aristizabal 2012),
- μ is the scale parameter that stretch or shrink the distribution,
- σ is the shape parameter that affects the shape of the distribution, and
- γ is the threshold parameter or location parameter that defines the point where the support set of the distribution begins.
The third asset class (for example, real estate and private equity) was assigned parameters intended to imitate 2.0% higher yielding investments with 10.0% greater volatility than large company stocks. A constant treasury bill yield represented short term cash investments, typically a minor portion of the overall asset allocation. The asset allocation among these four asset classes was a user-controlled parameter, as was the hurdle rate, percentage of gainsharing, and asset smoothing period.
A stochastic model projected investment returns for 30 years without gainsharing and with gainsharing, and calculated those two geometric returns for the simulation. It then calculated the arithmetic average of 5000 such geometric averages without gainsharing and the arithmetic average of 5000 such geometric averages with gainsharing. The cost of gainsharing is the difference between these two arithmetic averages.
Several assumptions are used in the model, in addition to the ones already mentioned, such as:
- Future annual benefit payments equal future annual contributions
- No correlation between asset classes
- Returns are net of investment expenses
- No administrative expenses were payable from the trust
- Continuously compounded returns of each asset class follow a lognormal distribution with mean and variance , where
- ○
- r is based on the average continuously compounded rate of return of each asset class over the indicated historical data,
- ○
- δ is the dividend rate, and
- ○
- σ is based on historical prices of each asset class over the indicated historical data.
- Each year, the asset class return evolves according to the model:
- ○
- ○
- where Z is a lognormal random variable, whose expected value is ,
- ○
- and are parameters that fit the lognormal distribution to the underlying historical returns for each asset class.
The model for large company stocks was defined by:
- ○
- ○
- and .
And for long-term government bonds, the model was defined by:
- ○
- ○
- and .
5. Conclusions
Despite its characterization in some media reports, gainsharing is neither good nor evil. It is merely a design of some pension plans, like early retirement reduction factors. However, asymmetrical gainsharing features are not free; they have an underlying cost. This model demonstrates how a stochastic method could be used to estimate the cost of gainsharing.
Acknowledgments
There were no funds or grants received for this article.
Author Contributions
This paper is based on work done by Evan Cronick, Shelby Mathers and Matt Pollie in a one semester independent study actuarial science class at Michigan State University in 2014–2015. The corresponding author thanks them for developing the stochastic EXCEL gainsharing model and their suggestions on various drafts of this paper, before they joined their respective employers. The author also thanks anonymous reviewers whose advice greatly improved this paper.
Conflicts of Interest
The authors declare no conflict of interest.
References
- Aristizabal, Rodrigo J. 2012. Estimating the Parameters of the Three-Parameter Lognormal Distribution. Master’s Thesis, Florida International University, Miami, FL, USA, March 30. [Google Scholar]
- Actuarial Standards Board. 2013. Measuring Pension Obligations and Determining Pension Plan Costs or Contributions. Washington: American Academy of Actuaries. [Google Scholar]
- Bader, Lawrence, and Jeremy Gold. 2003. Reinventing Pension Actuarial Science. The Pension Forum 14: 2. [Google Scholar]
- Bloomberg News. 2013. Detroit Union Seeks to Revive 13th Pension Check Policy. Bloomberg, September 27. [Google Scholar]
- Buchen, Isaac, David R. Cantor, Jared Forman, Sheldon Gamzon, and PricewaterhouseCoopers LLP. 2011. Embedded Options in Pension Plans. Schaumburg: Society of Actuaries Pension Section. [Google Scholar]
- Department of Retirement Systems. 2014a. Supreme Court Rulings Issued on Gain Sharing. UCOLA Lawsuits. Tumwater: Washington State Department of Retirement Systems. [Google Scholar]
- Department of Retirement Systems. 2014b. Supreme Court Rulings Issued on Gain Sharing. UCOLA lawsuits. Tumwater: Washington State Department of Retirement Systems. [Google Scholar]
- England, Colin, Thomas Bolton, and Ann Sturner. 2012. Considerations in the Evaluation of Gain Sharing Designs. Schaumburg: Society of Actuaries Research Project. [Google Scholar]
- Fuerst, Donald E. 2014. Retirement Shares Plan: A New Model of Risk Sharing. Philadelphia: Pension Research Council of the Wharton School of the University of Pennsylvania. [Google Scholar]
- Gold, Jeremy. 2001. Assumed Rates of Discount for Valuations of Publicly Sponsored Defined Benefit Plans. Pension Research Council, Philadelphia: The Wharton School of the University of Pennsylvania, WP2001-06. [Google Scholar]
- Ibbotson Associates. 2010. Ibbotson 2010 Classic Yearbook. Hoboken: Ibbotson Associates. [Google Scholar]
- Munnell, Alicia H., and Steven A. Sass. 2013. New Brunswick’s New Shared Risk Pension Plan. Chestnut Hill: Center for Retirement Research at Boston College. [Google Scholar]
- New York Times. 2013. Case in Detroit Highlights Cost of ‘Extra’ Pension Payments. New York Times, October 22. [Google Scholar]
- Piggott, John, Emiliano Valdez, and Bettina Detzel. 2005. The Simple Analytics of a Pooled Annuity Fund. Journal of Risk and Insurance 72: 497–520. [Google Scholar] [CrossRef]
- Shang, Kailan, Jen-Chieh Huang, and Hua Su. 2013. Pension Plan Embedded Option Valuation. Schaumburg: Society of Actuaries Research Project. [Google Scholar]
- Washington State Court System. 2014. Case #87424-7. Olympia, WA, USA. [Google Scholar]
- Washington Education Association. Washington Department of Retirement Systems 2014. Olympia: Washington Department of Retirement Systems.
© 2017 by the authors. Licensee MDPI, Basel, Switzerland. This article is an open access article distributed under the terms and conditions of the Creative Commons Attribution (CC BY) license (http://creativecommons.org/licenses/by/4.0/).