Article

Financial Flexibility, Corporate Governance, and Firm Performance: Evidence from Chinese A-Share Listed Firms

College of Business, Universiti Utara Malaysia (UUM), Sintok 06010, Kedah, Malaysia
*
Author to whom correspondence should be addressed.
Risks 2026, 14(7), 166; https://doi.org/10.3390/risks14070166
Submission received: 11 May 2026 / Revised: 10 July 2026 / Accepted: 13 July 2026 / Published: 16 July 2026

Abstract

This study examines the relationship between financial flexibility and firm performance, and the moderating role of corporate-governance mechanisms, using a large panel of Chinese A-share non-financial listed companies over 2017–2024. Financial flexibility reflects a firm’s capacity to access and deploy financial resources under uncertainty and is increasingly viewed as central to corporate resilience and value creation. Employing panel regressions with firm and year fixed effects, this study finds that financial flexibility is positively and significantly associated with Tobin’s Q and return on assets as measures of firm performance. Further analysis shows that this relationship is contingent on governance structures: ownership concentration and CEO duality weaken the positive association, while board independence is associated with a marginally significant strengthening of it. Marginal-effect analyses indicate that governance mechanisms systematically condition the value of financial flexibility. A dynamic system-GMM specification qualifies these findings: once persistence and reverse causality are modeled, the unconditional flexibility coefficient turns negative, underscoring that the fixed-effects estimates should be read as associations whose sign and magnitude depend on governance and on how endogeneity is treated. These findings contribute to the literature by integrating financial flexibility and corporate governance in a single analytical framework, highlighting governance as a key boundary condition for the effective use of financial slack. The results carry implications for managers, investors, and policymakers, emphasizing balanced ownership structures, leadership separation, and independent boards in enhancing the performance benefits of financial flexibility in emerging markets.

1. Introduction

1.1. Background and Research Motivation

Today’s fiscal, economic, and financial landscape is characterized by growing uncertainty, volatility in financial markets, and frequent external shocks in the world’s economies. Firms are facing increased financing risk and operational risk as a result of events such as trade disruptions, international financial crises, and disease outbreaks. In this context, the ability of a firm to maintain its liquidity and financing ability, called its financial flexibility, has emerged as a key issue in corporate finance research. Recent studies emphasize that financial flexibility enables companies to deal with adverse shocks, to lower the cost of external financing, and to maintain strategic investment capacity during periods of uncertainty (Almeida et al. 2004; Arslan-Ayaydin et al. 2014). Thus, financial flexibility is seen as more than just a product of the balance sheet, but as a strategic asset that can enhance the firm’s resilience, stability, and long-term value creation. Although this has increased, the evidence is still inconclusive whether financial flexibility is always positively related to firm performance.

1.2. Financial Flexibility and Firm Performance

Empirical evidence to support the performance implications of financial flexibility has been contradictory in the recent literature. On the one hand, the recent literature suggests that financially flexible firms have higher market values, are more profitable, and are better equipped to deal with adverse economic shocks (Ma and Jin 2016; Arslan-Ayaydin et al. 2014). Financial flexibility allows companies to facilitate investment and reduce refinancing risk, as well as to keep the business running during periods of limited external capital market availability. On the other hand, there are growing indications that, when liquidity is high and debt capacity is idled, capital discipline can be compromised, and resources can be misallocated. In the case of weak internal governance, financial slack can either help exacerbate agency problems, avoidance of risk, and growth opportunities, as shown by Aktas et al. (2015) and Boubaker et al. (2016). The performance effects of financial flexibility are not always positive, as these results show. This conditionality makes it clear that institutional and governance issues that shape how financial flexibilities are used should also be explored.

1.3. Financial Flexibility and Corporate Governance

The mechanisms of corporate governance are essential to limit the discretion of managerial decisions and harmonize the allocation of resources with the interests of shareholders. The latest governance studies point out ownership structure, leadership structure, and board structure to be the major determinants of financial decision-making and financial performance of firms (Young et al. 2008; Jiang and Kim 2020). Governance mechanisms are especially crucial when firms have high financial flexibility. Financial slack widens managerial decision-making latitude, so effective monitoring is necessary to ensure that internal resources are channeled into value-enhancing investments rather than hoarded inefficiently or used to evade market discipline. Recent experience of emerging markets has shown that the quality of governance plays an important role in the efficiency of the internal financial resources in turning them into performance benefits (Masulis et al. 2012; Jiang and Kim 2020). Nevertheless, empirical studies that specifically investigate the effect of governance contingency on the performance of financial flexibility are scarce.

1.4. Risk and Stability Perspectives

In addition to this direct performance effect, recent research highlights risk reduction and operational stability as a further channel through which financial flexibility creates value. More financially flexible firms are better positioned for smooth earnings and cash flows and minimized distress risk in a downturn (Acharya et al. 2013; DeAngelo and Roll 2015). Mechanisms of governance, at the same time, influence the effect of financial flexibility on firm risk-taking behavior. Well-functioning governance can harness financial flexibility to stabilize operations without compromising growth, whereas poor governance can result in excessive conservatism or unproductive cash hoarding. Although risk and stability provide useful background motivation for why financial flexibility may matter, the present study does not test these channels directly; the empirical analysis focuses on the governance-contingent effect of financial flexibility on firm performance.

1.5. Institutional Context and Research Gap

Emerging markets provide an informative setting for studying these questions. In China, the institutional environment of the listed firms is that of concentrated ownership, emerging governance reforms, and ineffective external capital markets. These attributes make companies more dependent on internal funds and, at the same time, heighten agency conflicts (Jiang and Kim 2020). Although recent studies have explored financial flexibility and corporate governance independently, few have combined governance moderation and the risk-and-stability perspective in a single empirical model, particularly in the Chinese context. This gap limits our understanding of when and how financial flexibility enhances firm performance in emerging markets.

1.6. Research Objectives and Contributions

This paper examines the question of whether financial flexibility has a positive impact on the performance of a firm and whether the corporate governance mechanisms, such as ownership concentration, CEO duality, and board independence, moderate the relationship between financial flexibility and the performance of a firm. It also relies on a risk and a stability lens to inspire the discussion of the necessity of financial flexibility to translate into performance, and the empirical analysis explores the moderating effects of ownership concentration, CEO duality, and board independence on the financial flexibility–performance nexus. This study adds to the literature in four ways. First, it serves to explain some of the mixed results on the performance impact of financial flexibility, as it has a different impact in different governance systems. Second, it offers empirical evidence at the firm level of how the relationship between financial flexibility and firm performance is mediated by governance characteristics, including ownership concentration, duality of the CEO, and independence of the board. Third, it also expands the corporate-finance literature to the Chinese institutional context and makes implications for emerging markets. Fourth, the authors’ approach of linking firm fixed-effects and dynamic system-GMM estimation reveals that the measured financial flexibility value is sensitive to the treatment of endogeneity; under the static approach, the positive association between financial flexibility and governance is weakened and may even turn negative in the dynamic approach, which is why governance is the determining boundary condition. The account is conditional and endogeneity-aware, and sets it apart from previous research on financial flexibility in China based on only one equation.

2. Literature Review and Hypothesis Development

2.1. Financial Flexibility: Contemporary Perspectives

Financial flexibility is defined as a firm’s ability to maintain its liquidity and unused debt capacity to take advantage of favorable investment opportunities as well as financing opportunities in a profitable way in the face of economic uncertainty. In contrast to the previous static perspectives, dynamic research has framed financial flexibility as a dynamic strategic resource that enables firms to respond to changing conditions by modifying their investment policy and capital structure (Almeida et al. 2004; Arslan-Ayaydin et al. 2014).
Financial flexibility has been shown to be a cushion against distress in a company, helping it maintain production levels during negative shocks and to be more resilient, as evidenced by the global financial crisis (Ma and Jin 2016; Arslan-Ayaydin et al. 2014). The results place financial flexibility in a new light: from a passive balance-sheet construct to an active driver of firm value and financial resilience. Meanwhile, new research has raised concerns about the unconditional nature of the benefits of flexibility in finance and how much it depends on the internal governance of the organization. This work also places more emphasis on financial flexibility as a risk-absorbing, downside-protecting tool than as solely a growth-enabling tool. Additionally, Almeida et al. (2004) and Acharya et al. (2013) demonstrate that firms with higher internal financial capacity are better able to absorb macroeconomic disturbances, credit tightening, and policy uncertainty.
Evidence also indicates that financial flexibility is more useful in the presence of institutional frictions and imperfect capital markets (which is still common in emerging economies, see Arslan-Ayaydin et al. 2014; Ma and Jin 2016). It is important to note that since 2016, the literature has increasingly separated financial flexibility from financial slack. While slack might be seen as inefficiency or precautionary saving, flexibility is the capacity to make financing decisions quickly, and has meaningful governance and performance implications (Aktas et al. 2015; DeAngelo and Roll 2015).
There is mounting recent evidence to back up the value of financial flexibility. The literature on non-load-leverage firms demonstrates that conservative leverage policies lead to a higher investment capacity and increase firm value (Marchica and Mura 2010; Denis and McKeon 2012; Ferrando et al. 2017), while cross-country evidence indicates that leverage flexibility is most beneficial when external financing is restricted (Faulkender et al. 2012; Favara et al. 2021). A natural experiment was provided by the COVID-19 shock, as financially flexible firms showed significantly better performance when revenues were reduced (Fahlenbrach et al. 2021; Bae et al. 2021). Recent evidence in China shows that financial flexibility is associated with better firm performance, investment, and coping with distress within China (Feng et al. 2022; Wu et al. 2024; Zhang and Liu 2022).

2.2. Firm Performance and Financial Flexibility

Since 2016, there has been an increase in empirical studies on the relationship between financial flexibility and firm performance. Financially flexible firms have lower refinancing risk and have better investment capacity and strategic flexibility that typically act to increase market value and operating performance (Hoberg et al. 2014; Aktas et al. 2015). Conversely, some recent studies suggest that the financial slack can come with agency costs: Aktas et al. (2015) and Boubaker et al. (2016) argue that too many internal resources can weaken capital discipline, erode investment efficiency, and encourage conservative behavior under weak monitoring. These results collectively suggest that financial flexibility may positively or negatively impact firm performance depending upon the way in which internal resources are deployed. This research is based on the assumption that there is a positive baseline relationship between financial flexibility and firm performance, as in the prevailing opinion in the recent literature. Further research also reveals that these performance impacts are also asymmetric, with a greater marginal value of flexibility under high uncertainty and lower under stable conditions (Hoberg et al. 2014; Arslan-Ayaydin et al. 2014).
This finding is consistent with the suggestion that flexibility is most relevant when firms are constrained by binding conditions or higher risk—the very conditions where the influence of governance mechanisms is most critical in determining their results.
Hypothesis 1 (H1).
Financial flexibility is positively associated with firm performance.

2.3. Corporate Governance as a Conditioning Mechanism

Corporate governance systems are a key determinant of the allocation and utilization of internal financial resources of firms. The studies highlight that the manner in which capital is allocated, risk-taking behavior, and the incentive of managers are influenced by the ownership structure, leadership configuration, and board composition (Young et al. 2008; Jiang and Kim 2020). Financial slack provides even greater management discretion in financially flexible companies, making governance even more significant. In good governance, flexibility can be used in value-enhancing investments; in poor governance, agency problems can be exacerbated, and the value of internal funds can decline (R. Chen et al. 2017).
The three governance mechanisms—ownership concentration, CEO duality, and board independence—are thus examined in this paper as moderators in the financial flexibility–performance relationship.
Recent governance research also emphasizes that the effects of the internal financial resources on performance are related to the quality of monitoring. Concentrated ownership, multiple blockholders, and state ownership have an impact on disclosure, cash policy, and the efficiency of capital allocation in China (G. Chen et al. 2006; Jiang et al. 2020; R. Chen et al. 2018; Huang and Wang 2015). Research on the impact of leadership structure on performance has been mixed and has now started to show the positive or negative effects of having multiple CEOs on performance depends on context, in particular board independence (Peng et al. 2007; Mubeen et al. 2021; Duru et al. 2016; Tran 2021; Fatemi et al. 2018; Yu 2023).

2.4. Ownership Concentration and Financial Flexibility

Ownership concentration measures the extent of dominant share ownership rights. Concentrated ownership can increase the monitoring capacity but can also induce entrenchment and risk aversion behavior as well as the search for private benefits, particularly in emerging markets where investor protection is low (Boubaker et al. 2016; Young et al. 2008). If financial flexibility is high, controlling shareholders might consider restricting access to their internal funds to maintain control or to limit the exposure to risks, hence reducing the strategic value of financial flexibility. From a Chinese perspective, it is found that high liquidity leads to lower responsiveness of the firms to investment opportunities for an increase in ownership concentration (R. Chen et al. 2017). From this logic, it would be reasonable to anticipate that an increase in ownership concentration would make it harder for financial flexibility to enhance corporate performance. Concentrated ownership and weak external governance tend to exacerbate principal-principal conflict in emerging markets: Boubaker et al. (2016) and Young et al. (2008) demonstrate that controlling shareholders in emerging markets may use resources at the firm to serve their own private interests, or they may discourage risk taking to safeguard private interests. In comparison, evidence from more recent Chinese studies indicates that investment and financing decisions are less responsive to the availability of internal cash in concentrated ownership, especially if firms maintain large liquidity buffers (Boubaker et al. 2016; R. Chen et al. 2017).
Hypothesis 2 (H2).
Ownership concentration negatively moderates the relationship between financial flexibility and firm performance.

2.5. CEO Duality and Financial Flexibility

CEO duality—where the same person serves as chief executive and board chair—concentrates decision-making authority and reduces board independence. Recent governance research shows that duality weakens monitoring and widens managerial discretion, especially when firms hold substantial internal resources (Krause et al. 2014). In financially flexible firms, duality can allow managers to retain excess liquidity, delay investment, or avoid external discipline, which reduces the effectiveness with which financial flexibility is converted into performance gains. This logic echoes the managerial-rent framework of Lambrecht and Myers (2012, 2017), in which managers use debt and investment to smooth payouts and protect their own rents, and the payout-smoothing evidence of Hoang and Hoxha (2016, 2021) for the United States and for China and Taiwan, which shows how managerial discretion over financial policy can divert the benefits of flexibility away from shareholders. Consistent with this evidence, CEO duality is found to weaken the sensitivity of performance to internal financial resources (Krause et al. 2014). Therefore, a negative moderation is expected between financial flexibility and firm performance in the case of CEO duality. In addition to monitoring, recent studies show that duality also affects companies’ risk attitude and financial conservatism: Krause et al. (2014) show that dual CEOs are more likely to engage in conservative financial policy, which can reduce the strategic flexibility of financial policy. This is in line with the negative moderation effect found in this study.
Hypothesis 3 (H3).
CEO duality negatively moderates the relationship between financial flexibility and firm performance.

2.6. Board Independence and Financial Flexibility

Independence of the Board is one of the fundamental tools of the internal-governance system designed to enhance checks and balances and safeguard the interests of shareholders. Independent directors can more easily challenge managerial decisions; increase transparency; and facilitate the efficient allocation of capital (Ahn et al. 2010; Masulis et al. 2012). Recent studies show that board independence has a positive association with the marginal value of the internal funds and with the potential of using financial slack to enhance firm performance, especially in emerging markets (Masulis et al. 2012). In financially flexible firms, the independent board can help to discipline the use of liquidity and debt capacity to reduce agency problems. Board independence should thus enhance the positive correlation between financial flexibility and firm performance. Independent directors’ role in resource allocation is also important from a recent study on the governance of the firm, which finds that independent boards better handle uncertainty and boost internal capital-market efficiency (Masulis et al. 2012; Ahn et al. 2010). The results confirm the hypotheses that the value-creating role of financial flexibility is enhanced by board independence.
Hypothesis 4 (H4).
Board independence positively moderates the relationship between financial flexibility and firm performance.

2.7. Conceptual Framework

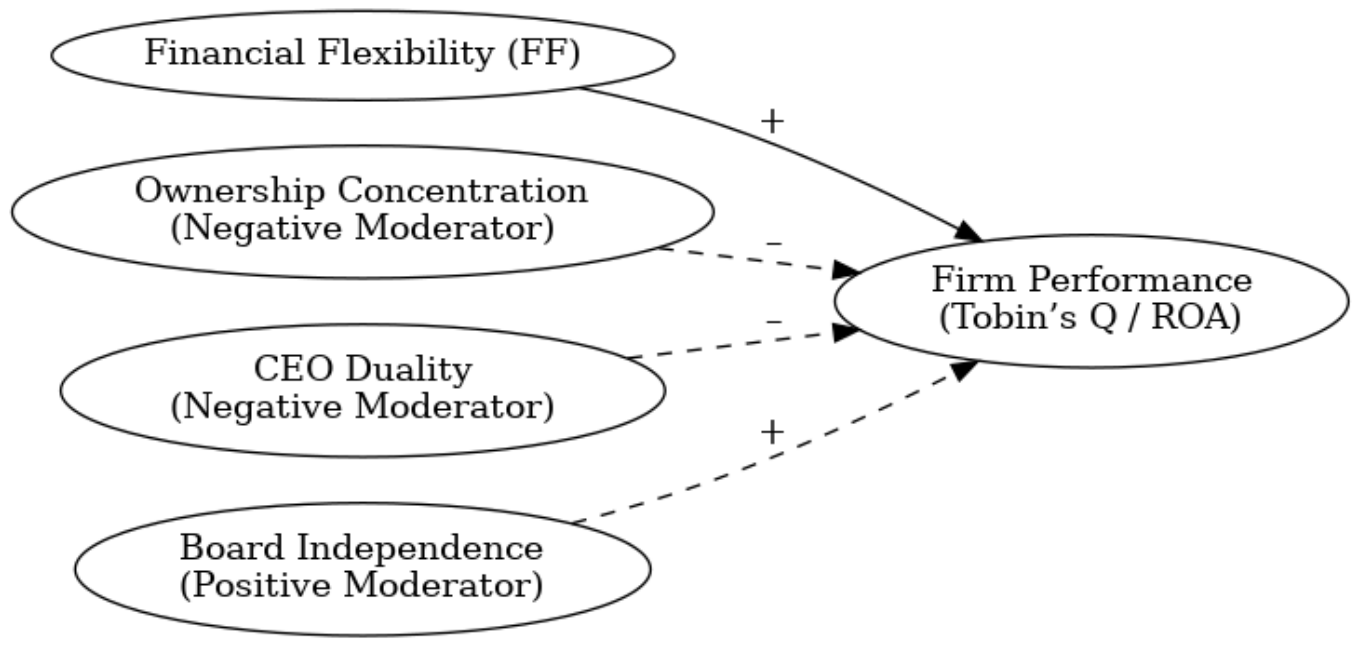
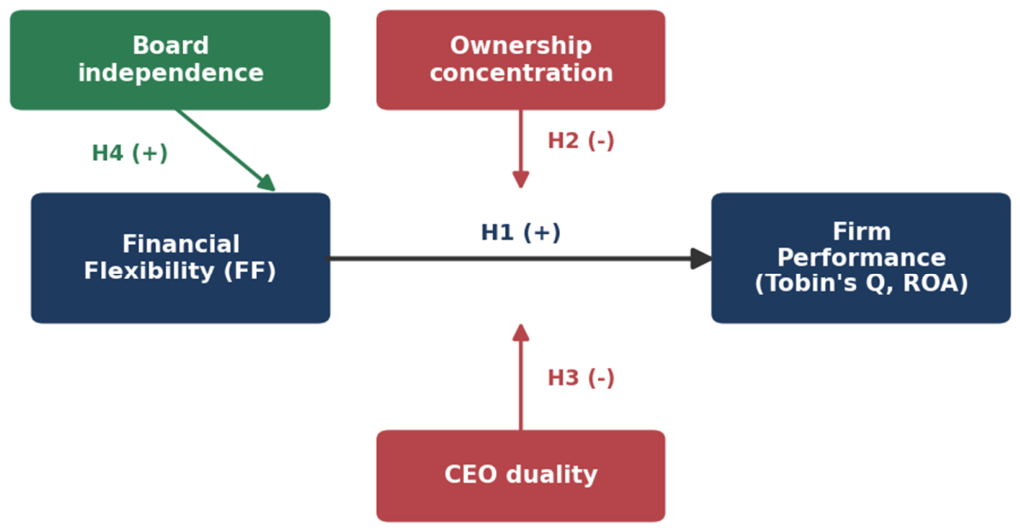
This study was guided by a conceptual approach that combines direct effects and governance moderation as guided by the empirical models tested. Figure 1 depicts the hypothesized relationships among financial flexibility, corporate governance, and firm performance.
  • Direct Effect: Financial flexibility has a direct impact on firm performance through its impact on financing adaptability and investment capacity.
  • Negative moderators: Ownership concentration and CEO duality decrease the effectiveness of financial flexibility through entrenchment and less monitoring.
  • Positive moderator: Board independence enhances the performance effect of financial flexibility through enhancing oversight and discipline in the allocation of resources.
The framework is based on the causal mechanism, which is not tested, but is consistent with the empirical design and results. Figure 2 summarize the conceptual framework.

2.8. Summary of Literature and Hypotheses

Table 1 summarizes the key studies underpinning each hypothesis and the expected direction of each governance effect.

3. Data, Variables, and Methodology

3.1. Data Sources and Sample Selection

The data are firm-level observations obtained from the CSMAR (China Stock Market and Accounting Research) database, which contains financial, governance, and market data on Chinese listed companies. The sample includes A-share companies listed on the Shanghai and Shenzhen Stock Exchanges between 2017 and 2024. The period of study represents a time of heightened economic uncertainty, reform of regulation, and changing practices of corporate governance in China. It is especially well-suited to investigating the performance effects of financial flexibility under different forms of governance. To ensure sample consistency and comparability, the sample is screened using the following criteria. First, the financial sector is omitted because of the unique balance-sheet arrangement and regulatory conditions in the financial sector. Second, firms designated ST or *ST are excluded, since their abnormal financial status can distort performance indicators. Third, those firms that issued an initial public offering (IPO) in 2024 are eliminated in order to prevent incomplete post-listing observations. Fourth, the observations that lack data are dropped to ensure complete data series for all variables. Lastly, continuous variables are winsorized at the 1st and 99th percentiles to limit the influence of outliers.
After applying these screening procedures, the final sample consists of 26,088 firm-year observations on 4694 unique firms; because all explanatory variables are lagged one year, 20,896 firm-year observations enter the regressions. Table 2 summarizes the sample-selection procedure (with further detail in Appendix B), and Table 3 defines all variables.

3.2. Definitions and Measurement of Variables

3.2.1. Dependent Variables: Firm Performance

The robustness is achieved by using both market and accounting measures of firm performance. Tobin’s Q is defined as the market value of equity plus total liabilities divided by total assets, and shows what investors think might be available for future growth. Return on Assets (ROA) = Net Income/Total Assets; Operating efficiency. Tobin’s Q is the primary dependent variable, and ROA is used for a robustness check.

3.2.2. Independent Variable: Financial Flexibility

Financial Flexibility (FF) is the key explanatory variable. It describes a firm’s ability to sustain liquidity and unused debt capacity so that it can respond efficiently to uncertainty and investment opportunities. Following the construction used in the dataset, FF is a standardized composite index built from two components: a cash/liquidity component (CF), measured as cash and cash equivalents scaled by total assets, and a debt-capacity component (DF), measured as unused borrowing capacity (one minus the leverage ratio). Each component is standardized by year (a z-score that removes scale and common time effects), and the two standardized components are summed, so that FF = z(CF) + z(DF); the full construction is documented in Appendix A. Higher values denote greater financial flexibility. To confirm that the composite does not mask divergent component effects, we also report regressions using CF and DF separately (Section 4.6); these checks are summarized in Appendix D.

3.2.3. Moderating Variables: Corporate Governance

Three corporate-governance variables are used as moderators. Ownership Concentration (Own) is the shareholding ratio of the largest shareholder. CEO Duality (CEO) is a dummy variable equal to one when the CEO also chairs the board and zero otherwise. Independent Director Proportion (IDP) is the share of independent directors on the board. These variables encompass major aspects of control, monitoring, and independence of the board that drives the deployment of financial flexibility.

3.2.4. Control Variables

Following prior literature, the analysis includes several control variables that may affect firm performance:
  • Firm Size (Size): the natural logarithm of total assets.
  • Growth (Grow): sales growth rate.
  • Debt Ratio (DR): total liabilities divided by total assets.
  • Total Asset Turnover (TAT): operating efficiency.
  • Firm Age (Age): years since listing.
  • Cash Flow (Cashflow): operating cash flow scaled by assets
Table 3. Variable Definitions.
VariableDefinitionMeasurement
Tobin’s QMarket performance(Market value + liabilities)/assets
ROAOperating performanceNet income/assets
FFFinancial flexibilityStandardized composite index
OwnOwnership concentrationLargest shareholder ratio
CEOCEO dualityDummy variable
IDPBoard independenceIndependent directors/board size
SizeFirm sizeln(Total assets)
GrowGrowthSales growth
DRDebt ratioLiabilities/assets
TATAsset turnoverRevenue/assets
AgeFirm ageYears since listing
CashflowCash flowOperating CF/assets

3.3. Descriptive Statistics

Table 4 gives the descriptive statistics of all variables. The statistics reveal substantial variation in firm performance, financial flexibility, and governance structure across the sample, indicating sufficient variation for regression analysis.

3.4. Correlation Analysis

Table 5 reports Pearson correlation coefficients among all variables used in the analysis. Financial flexibility is positively correlated with both Tobin’s Q and ROA, providing preliminary support for a positive relationship between flexibility and performance. Correlations among independent variables remain within acceptable ranges, indicating that multicollinearity is unlikely to bias regression estimates.

3.5. Empirical Model Specification

To examine the impact of financial flexibility on firm performance and the moderating role of corporate governance, the study employs panel regression models with fixed effects.

3.5.1. Baseline Model

P e r f o r m a n c e _ { i t } = α + β 1 F F _ { i t } + γ C o n t r o l s _ { i t } + μ _ i + λ _ t + ε _ { i t }
where i indicates firms and t indicates years.
μ _ i and λ _ t denote firm fixed effects and year fixed effects, respectively (the earlier industry-and-year specification is reported as a robustness check in Section 4.6), and ε _ { i t } is the error term.

3.5.2. Moderation Models

To test moderation effects, interaction terms are introduced:
P e r f o r m a n c e _ { i t } = α + β 1 F F _ { i t } + β 2 G o v _ { i t } + β 3 ( F F _ { i t } × G o v _ { i t } ) + γ C o n t r o l s _ { i t } + μ _ i + λ _ t + ε _ { i t }
where G o v _ { i t } represents the corporate governance variable (ownership concentration, CEO duality, or board independence).
The interaction term F F _ { i t } × G o v _ { i t } captures the moderating effect of governance on the relationship between financial flexibility and firm performance.

3.6. Estimation Method

The main models are estimated with firm (entity) and year fixed effects, which absorb time-invariant firm heterogeneity and common time shocks; the earlier industry-and-year specification is retained as a robustness comparison, and all explanatory variables are lagged one year to mitigate simultaneity. Standard errors are also clustered at a firm level to take into consideration the heteroskedasticity and within-firm serial correlation. To determine the presence of multicollinearity, the values of the variance inflation factor (VIF) are analyzed, and all values obtained are less than traditional levels. To address dynamic endogeneity and reverse causality, we additionally estimate a system-GMM dynamic panel with a lagged dependent variable, reporting Arellano–Bond AR(1) and AR(2) tests and the Hansen over-identification test (Section 4.6).

3.7. Robustness Checks

The study re-estimates the baseline model with ROA as an alternative dependent variable to make the study robust; the findings are consistent in sign and significance. We further (i) decompose financial flexibility into its cash (CF) and debt-capacity (DF) components entered separately, (ii) estimate a system-GMM dynamic panel to address endogeneity, and (iii) split the sample into pre-, during-, and post-COVID sub-periods. These analyses, reported in Section 4.6, probe the sensitivity of the main models: the decomposition and sub-period results are consistent with the governance-contingent pattern, while the dynamic system-GMM specification qualifies the baseline association by showing that the unconditional flexibility coefficient turns negative once persistence and reverse causality are modeled.

3.8. Methodological Design

In this chapter, the author describes the data source, sample construction, definitions of variables, and empirical models that were used to test hypotheses generated in Section 2. The empirical findings presented in Section 4 are entirely consistent with the methodology and make the study findings reliable and have internal consistency.

4. Empirical Results

4.1. Baseline Effect of Financial Flexibility on Firm Performance (H1)

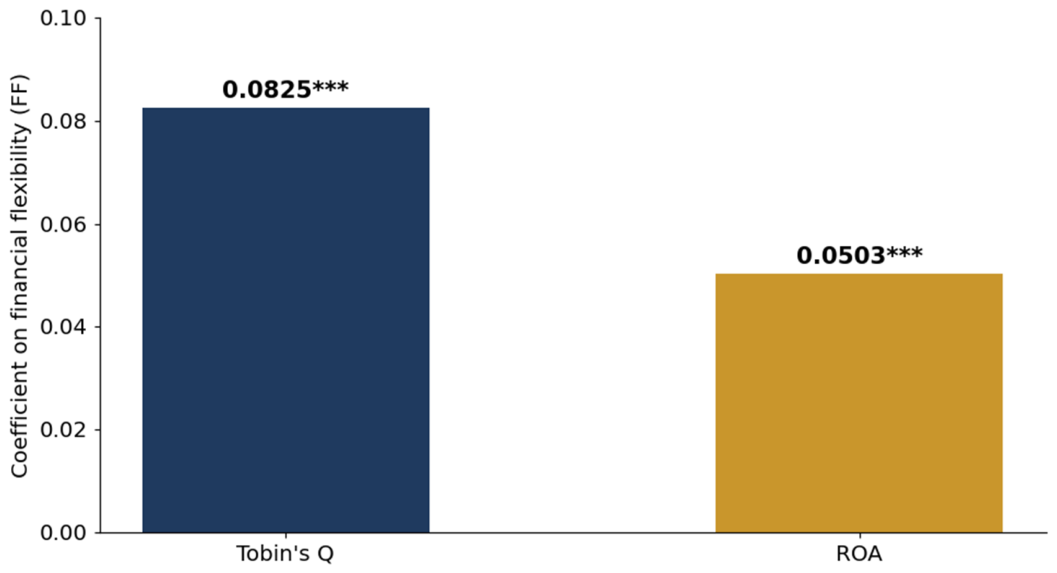
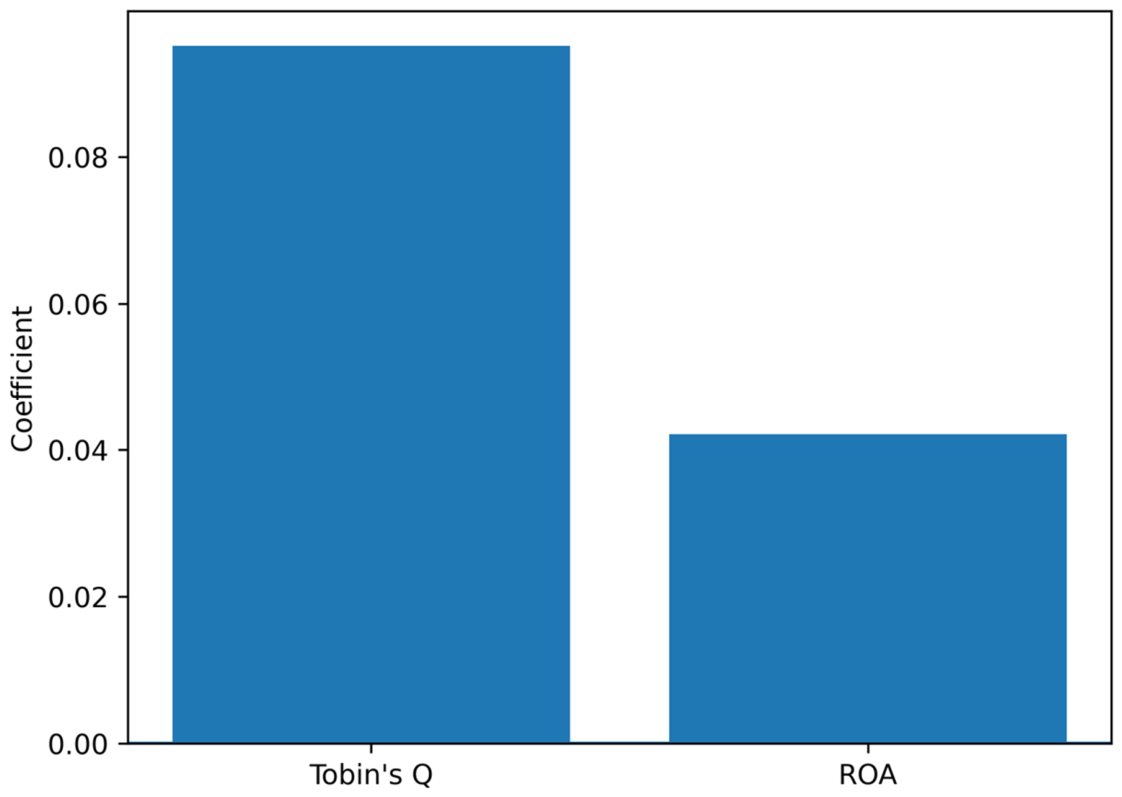
This section analyzes the baseline relationship between financial flexibility and firm performance. As outlined in Section 3, performance of firms is determined by both a market-based performance measure (Tobin’s Q) and an accounting-based performance measure (ROA), and all of the models incorporate firm and year fixed effects, with standard errors clustered at the firm level; the estimation framework is set out in Appendix C, and multicollinearity diagnostics appear in Appendix E. The baseline regressions are reported in Table 6. In both specifications, financial flexibility is positively and statistically significantly associated with firm performance. The coefficient of financial flexibility is positive and statistically significant at the 1% level when Tobin’s Q is the dependent variable, and hence, the higher the internal liquidity and debt capacity of firms, the higher the market valuation. The finding is consistent with financially flexible firms being better positioned to respond to investment opportunities and to overcome financing constraints. Figure 3 and Figure 4 visualize the baseline coefficients for both performance measures. In economic terms, a one-standard-deviation increase in financial flexibility (0.58) is associated with an increase of about 0.048 in Tobin’s Q (roughly 2.5% of its sample mean) and about 0.029 in ROA (approximately 0.44 of an ROA standard deviation), showing that the effect is not only statistically significant but also economically meaningful.
The robustness specification using ROA yields an equally positive and highly significant coefficient, indicating that the performance benefits of financial flexibility extend beyond market valuation to operating results. These findings support Hypothesis 1, which predicts a positive association between financial flexibility and firm performance.
This Figure reports the estimated coefficients of financial flexibility from baseline regressions using Tobin’s Q and ROA as dependent variables.

4.2. Moderating Effect of Ownership Concentration (H2)

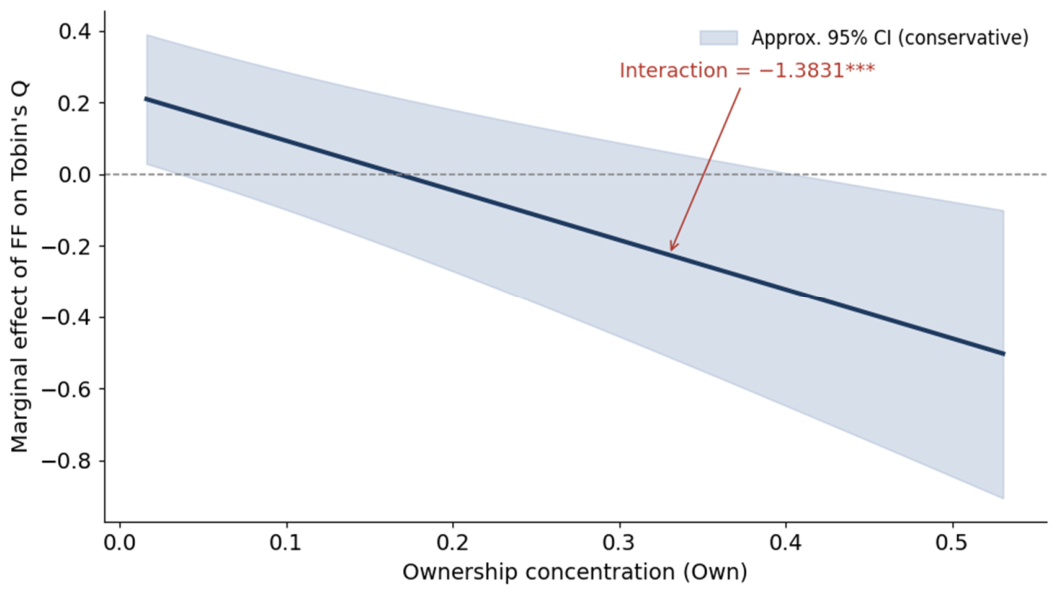
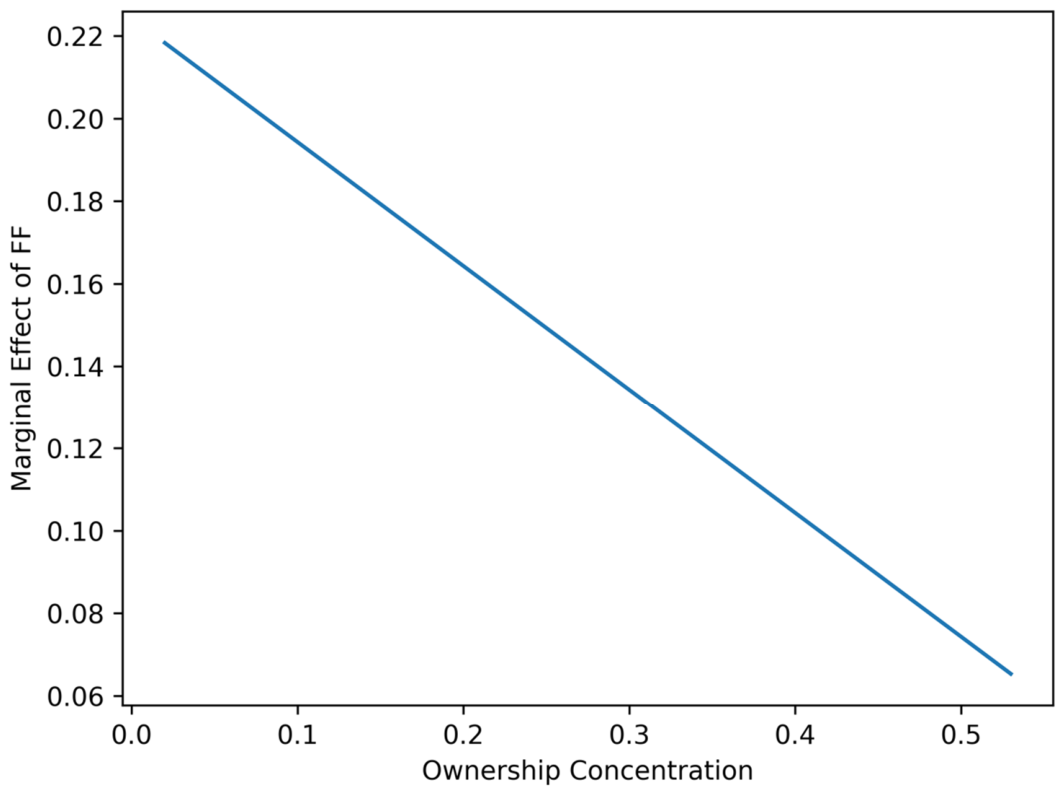
The regression results for ownership concentration as a moderating factor are shown in Table 7. The association between financial flexibility and ownership concentration is negative and significant, which suggests that the positive relationship between financial flexibility and firm performance becomes less positive when the firm’s ownership is concentrated. Figure 5 and Figure 6 plot how the estimated marginal effect declines as ownership concentration rises, crossing zero at high concentration levels.
The result indicates that the marginal performance payoff of financial flexibility decreases with increases in the concentration of ownership. While financial flexibility has a positive relationship with performance, its impact becomes less as ownership becomes more concentrated. The result validates Hypothesis 2 and suggests that the tendency has the potential to constrain dominant shareholders from using their internal financial resources strategically, possibly due to risk aversion or entrenchment issues.

4.3. Moderating Effect of CEO Duality (H3)

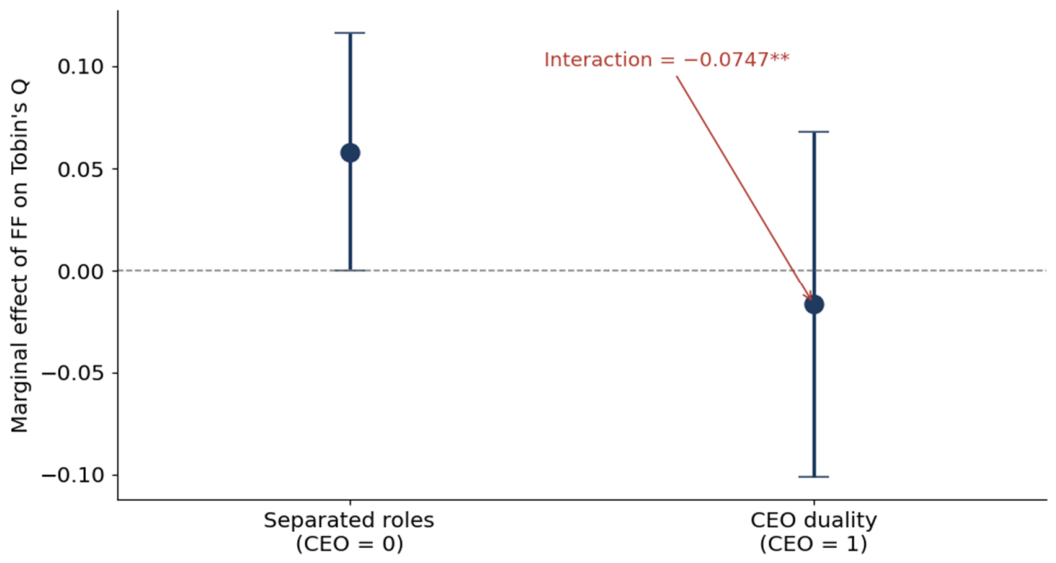
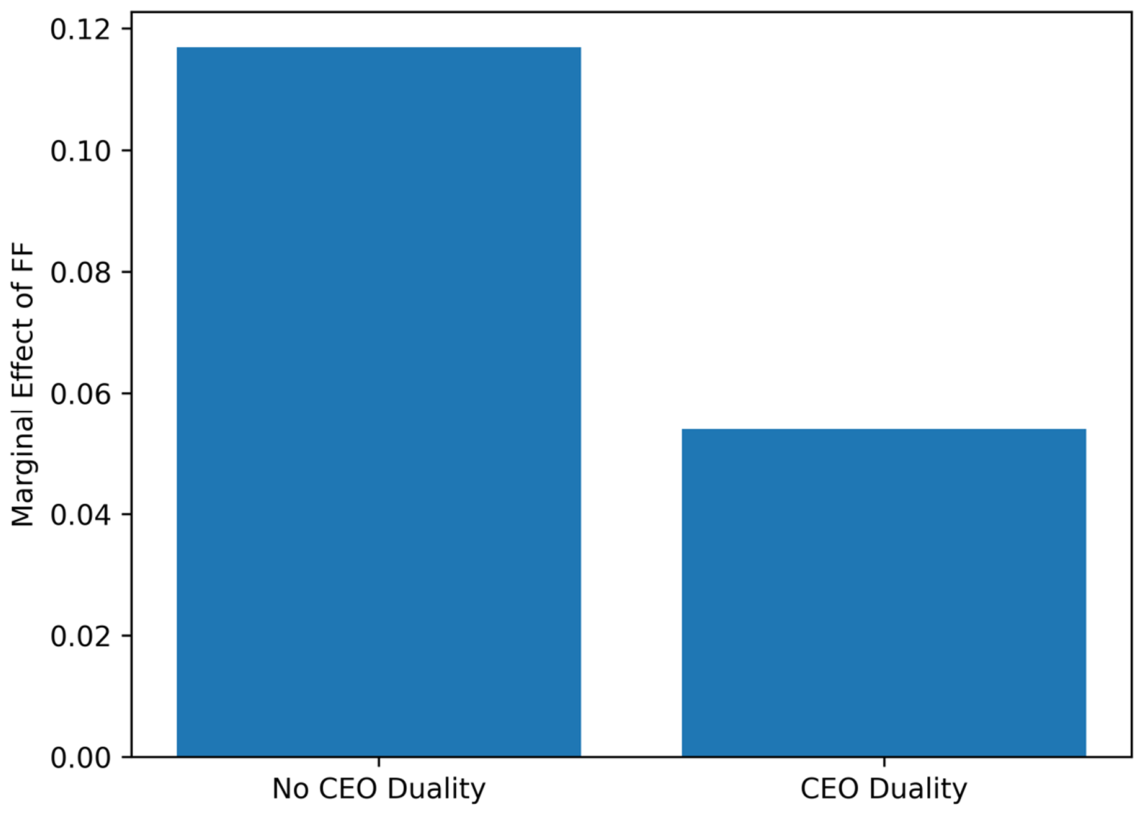
Table 8 reports the results for CEO duality as a moderating mechanism. The relationship between financial flexibility and the duality of the Chief Executive Officer is negative and statistically significant, meaning that CEO duality has a negative impact on the beneficial effect of financial flexibility on firm performance.
This means that financial flexibility can lead to increased managerial discretion in a setting of managerial power that is concentrated in one hand and subject to limited monitoring. This is likely to lead to a less efficient utilization of the company’s internal financial resources and will have less impact on the firm’s value. The results are consistent with the agency theory and with Hypothesis 3. Figure 7 and Figure 8 contrast the estimated marginal effects for firms with combined versus separated leadership.

4.4. Moderating Effect of Board Independence (H4)

Table 9 presents the regression results examining board independence as a moderating factor. In contrast to ownership concentration and CEO duality, the interaction term between financial flexibility and board independence is positive but only marginally significant (10% level), so this moderating effect should be interpreted with appropriate caution.
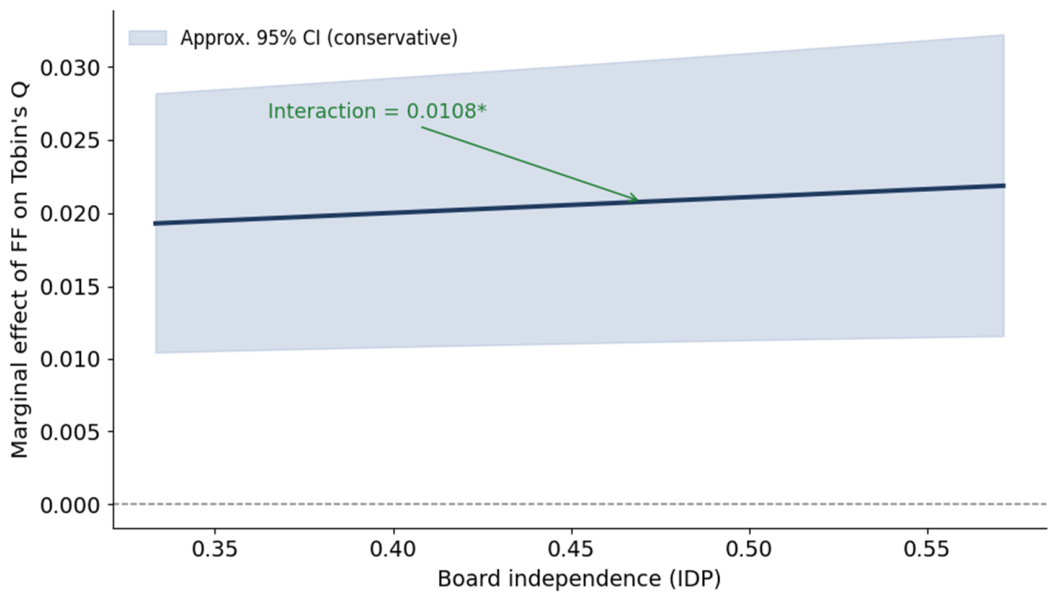
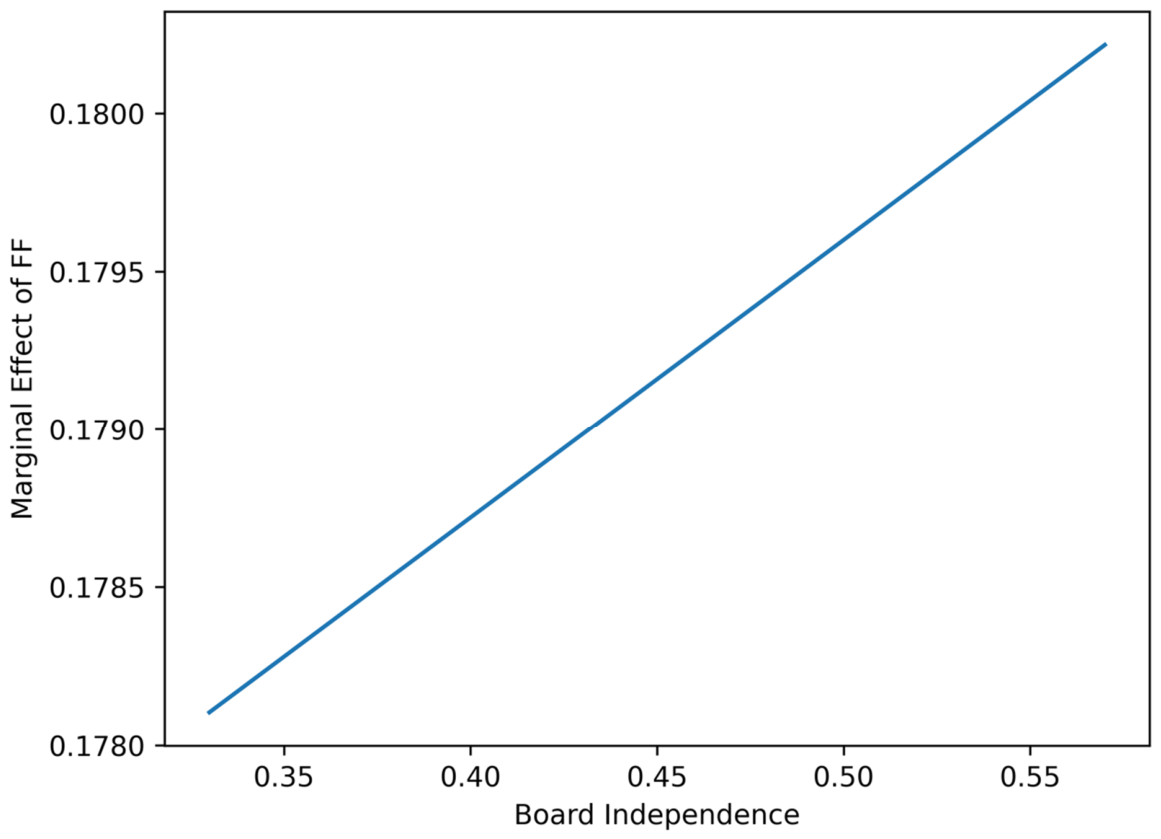
This finding provides qualified support for Hypothesis 4, suggesting that board independence enhances the positive association between financial flexibility and firm performance. Figure 9 and Figure 10 show the marginal effect increasing modestly as board independence rises. Independent directors seem to improve the quality of monitoring and ensure that the internal financial resources are used in value-added activities. Consequently, more independent boards allow financially flexible companies to transform internal financial capability into better performance.

4.5. Summary of Regression Results

Combined, the regression outcomes show that financial flexibility is strongly associated with the performance of firms, although the strength of this association depends on the internal governance mechanisms. Concentration of ownership and CEO duality undermine performance gains of financial flexibility, and board independence increases them. These findings form an internally coherent body of evidence that aligns with the hypotheses made in Section 2 and the empirical plan of Section 3. The next chapter discusses the theoretical and practical implications of these findings.

4.6. Additional Robustness and Endogeneity

(a)
Dynamic panel system-GMM
To address persistence and reverse causality, we estimate a system-GMM model with a lagged dependent variable (Table 10). The diagnostics support the specification: AR(1) p < 0.01, AR(2) p = 0.918, Hansen p = 0.194, with 16 instruments for 4362 firms. The lagged term is large and significant (0.6382), confirming strong persistence in Tobin’s Q. Once this dynamic structure is modeled, the FF coefficient turns negative and significant (−0.0901, t = −4.07). We read the static positive association and the dynamic negative estimate together: flexible firms tend to be valued highly, but net of persistence and reverse causality, excess financial slack can carry an agency cost (a free-cash-flow effect)—which is precisely why the governance moderators matter. The GMM specification should therefore be read as an endogeneity-sensitive qualification of the fixed-effects findings rather than a confirmation of them: the static results are associations, and the governance-contingent interpretation is the claim the evidence supports most robustly.
(b)
Decomposition of financial flexibility
We replace the composite index with its two components entered separately. Both are positive and significant, and the Table 11 and Table 12 report these regressions. The cash component (0.1977, t = 8.02) is larger than the debt-capacity component (0.1249, t = 4.96), indicating the performance association is driven more by liquidity than by unused borrowing power. The composite remains useful as a parsimonious summary because both components point in the same direction.
(c)
COVID-19 sub-period analysis
Splitting the sample (Table 13) provides suggestive evidence that the value of financial flexibility is state-dependent: FF is positive and significant before (0.1419) and during (0.1477) the pandemic, but insignificant afterward (−0.0065). Because the association is positive both before and during the pandemic and weakens only in the post-COVID period, we do not interpret this as a uniquely COVID-specific effect; rather, it offers suggestive evidence that the value of financial flexibility varies with the economic state and appears weaker in the post-pandemic period.

4.7. Marginal Effects of Financial Flexibility Across Governance Levels

To convey the economic meaning of the moderation results, Table 14 reports the marginal effect of financial flexibility on Tobin’s Q at representative low, mean, and high values of each governance variable, together with approximate 95% confidence intervals. The marginal effect is computed as β(FF) + β(FF × Gov) × Gov. The pattern mirrors the interaction coefficients: the effect of financial flexibility is strongest under stronger governance (low ownership concentration, separated leadership, and higher board independence) and attenuates toward zero or turns negative under weaker governance.

5. Discussion and Analysis

5.1. Overview of Key Empirical Insights

The present study examines the relation between financial flexibility and firm performance as well as how this relation is moderated by internal corporate-governance mechanisms of Chinese A-share listed firms. The empirical results show an average value-added effect of financial flexibility. Most importantly, though, there is a need to understand that the power and effectiveness of this relationship will be closely linked to governance structures within firms. The findings suggest that financial flexibility is a strategic asset that is not always advantageous, but rather has positive outcomes contingent on the allocation of decision rights and monitoring within the firm. This perspective is useful for understanding the tension between the available evidence and past research, and creates a financial policy other than via governance.

5.2. Financial Flexibility as a Performance-Enhancing Resource

The positive relationship between financial flexibility and firm performance is in line with the modern-day corporate finance theory, where financial flexibility is a way of dealing with uncertainty, mitigating financing frictions, and maintaining investment capacity (Almeida et al. 2004; Arslan-Ayaydin et al. 2014). In the Chinese context, where external financing is subject to policy adjustments and institutional tensions, the concept of internal liquidity and the untapped debt capacity seems particularly useful. The results indicate that firms with higher financial flexibility can better smooth their investment and are less reliant on external funding, responding faster to market opportunities. This is similar to other accounts of financial flexibility based on the concept of resilience that focus on the capacity to withstand adverse events as well as on the capacity to grow. Importantly, the strength and importance of the relationship between financial flexibility, financial perceptions, and operating performance make this relationship not just a reflection of investor perception but also a reflection of operating performance.

5.3. Ownership Concentration and the Attenuation of Flexibility Benefits

The negative moderating effect of ownership concentration suggests that the benefits of financial flexibility are lessened through ownership concentration. This aligns with principal-principal agency issues, particularly strong in emerging markets. When ownership is highly concentrated, controlling shareholders can have an incentive to preserve wealth, maintain control, or extract private benefit in lieu of value-enhancing investment. Increasing the internal resource base may paradoxically help reinforce this tendency, as it lessens the need for external monitoring and market discipline. This will lead to more conservative or inefficient utilization of internal funds, and hence less flexibility vs. performance. This is understandable when considering the descriptive and correlation results, in that ownership concentration can both increase profitability and decrease its market value. The results indicate that agency problems do not disappear when ownership is concentrated, but are simply refashioned, and their relationship with the financial capacity of the firms is changed.

5.4. CEO Duality and Managerial Discretion

Another example of governance structure affecting the value creation potential of financial flexibility arises from the negative relationship between financial flexibility and the dual role of the CEO. CEO duality focuses power into one person and reduces the board’s oversight, leading to more discretionary decision-making. This freedom can manifest itself in one of two ways: an excess of liquidity or a delay in investment, or risk aversion, in financially flexible firms. While this may reduce short-run volatility, it can also limit the ability of a firm to grow and lower the value of the firm. The results suggest that the importance of financial flexibility decreases as CEOs have fewer restrictions. This fits in with agency theories that view the structures of leadership as distinct between managerial and monitoring roles, as well as arguments that the separation of managerial and monitoring roles is especially relevant in the presence of abundant internal resources.

5.5. Board Independence as a Governance Complement to Flexibility

In contrast, board independence positively moderates the financial flexibility–performance relationship, while ownership concentration and CEO duality have no such effect. This outcome is indicative of the co-creative potential of financial capacity and effective monitoring. Independent directors can help the board to discipline managerial behavior, review investments, and make sure the internal funds are used for value-enhancing projects. This monitoring seems to be a necessary ingredient for avoiding waste and resource misallocation from agencies in financially flexible firms. The discovery helps the governance theory by validating that board independence can not only limit managerial discretion but also increase the strategic worth of monetary adaptability. It suggests that flexibility and governance are not separate issues, but are both analyzed together.

5.6. Integrating the Findings: A Governance-Contingent View of Financial Flexibility

Combined, the findings suggest a governance contingent model where an increase in financial flexibility is linked to firm performance contingent on the ability of internal governance structures to direct managerial discretion. There is a potential for value in financial flexibility, and the governance mechanisms will decide whether this value is realized. Negative moderators (ownership concentration and CEO duality) decrease the efficiency of the utilization of internal resources, while the positive moderator (board independence) increases the efficiency of internal resource utilization. This approach reconciles the conflicting perspectives found in the literature that view financial flexibility as value-creating or value-destroying. The results highlight that financial flexibility can be positive or negative and that this is dependent on who is making the financial decisions and how the decisions are monitored.

5.7. Implications for Corporate-Governance Theory

In this paper, I contribute to the theory of corporate governance in three ways. First, it demonstrates that the returns to financial policy are not just a function of what directly influences the performance of the firm, but also governance mechanisms. Second, it serves as a platform to further the debate on governance studies by bringing the dimensions of internal financial resources into the picture of the returns that stem from them. Second, it combines the resource-based view with agency theory since it demonstrates that management incentives will need to be aligned with the interests of shareholders so that the resources within the firm generate value. Third, it illuminates how the governance-finance nexus functions in the institutional context of concentrated ownership and trending regulation, namely in China.

5.8. Managerial and Policy Relevance of the Findings

The findings suggest a linkage between building financial flexibility and good governance for managers. Firms that have a weak monitoring system will not know the benefits of leverage with their internal financing resources, while firms with strong monitoring boards can take advantage of the flexibility better. Excessive control appears to have a negative impact on firm value for controlling shareholders, as the results indicate that it hinders their use of financial resources to make strategic decisions. For regulators and policymakers, the results provide evidence that reforms of boards and internal governance, such as increased board independence, in the more financially flexible firm would be beneficial.

5.9. Limitations and Future Research

Although this study has several strengths, a number of limitations should be noted. The sample firms are drawn from a single institutional context, which may limit generalizability. In addition, governance mechanisms are measured using observable structural proxies, which may not fully capture governance effectiveness. Further development of the research might focus on other aspects of governance, including executive remuneration, state-ownership, or external control, and seek to understand whether the same governance-contingent impact can be found in other institutional settings.

5.10. Concluding Analysis

This chapter shows that financial flexibility is positively associated with firm performance, although this association materializes only when the governance structures enable firms to use internal resources effectively. This relationship is weakened by ownership concentration and CEO duality, and strengthened by board independence. These results support the significance of financial policy distribution in line with the quality of governance, and a subtle insight into the relationship between internal resources and firm value is made.

6. Conclusions

6.1. Study Overview

This paper examines whether financial flexibility is associated with better firm performance and analyzes how internal corporate-governance mechanisms moderate that relationship. Using a large sample of Chinese A-share listed firms over 2017–2024, it studies three core governance mechanisms—ownership concentration, CEO duality, and board independence—to develop a governance-contingent view of the value of financial flexibility. By combining financial policy and corporate governance perspectives, the study moves beyond the assumption that financial flexibility is always beneficial and shows that its value depends heavily on how a firm is governed.

6.2. Summary of Key Findings

The empirical analysis yields several coherent findings. First, financial flexibility is positively associated with firm performance on both market-based (Tobin’s Q) and accounting-based (ROA) measures, consistent with firms that hold greater internal liquidity and debt capacity being better placed to create value and sustain operating performance. Second, the ownership concentration negatively moderates the relationship between flexibility and performance; the incremental value of financial flexibility is significantly reduced when ownership is concentrated, implying that the ability to use internal resources is constrained with concentrated control. Third, CEO duality weakens the positive association between financial flexibility and performance, consistent with concentrated managerial power aggravating agency problems when firms hold abundant internal resources. Finally, board independence is associated with a marginally significant strengthening of the flexibility–performance relationship (10% level), consistent with independent directors improving monitoring and helping direct internal funds toward value-enhancing activities; given its weaker statistical significance, this result warrants cautious interpretation. Together, these findings show that financial flexibility is a contingent strategic resource and that the value of financial flexibility is linked to the quality of internal governance. Because the static models identify associations rather than strict causal effects, and because the dynamic system-GMM estimate indicates that the unconditional effect of excess flexibility may even turn negative once endogeneity is addressed, these conclusions are framed in associational terms, with the governance-contingent interpretation being the paper’s central and most robustly supported claim.

6.3. Theoretical Contributions

This study has several contributions to the literature. First, it contributes to the financial flexibility literature by offering robust empirical evidence of the performance consequences of financial flexibility as being governance-conditioned, while previous literature has focused more on direct impacts. Second, it extends the literature on the mechanisms leading to these performance consequences by introducing the concept of internal governance mechanisms, which it finds to be a fundamental determinant of the returns to financial flexibility. Second, it combines agency theory and the resource-based view, arguing that value creation from internal financial resources depends on the alignment of agents’ incentives with shareholders’ interests, which is the opportunity provided by the flexibility, and the mechanism by which these interests are aligned or not, which is the governance structure. Third, it helps advance the growing body of literature on corporate governance in emerging markets by shedding light on the interaction between ownership concentration and the formation of the leadership with respect to financial policy in regulatory environments that are subject to change and where external enforcement is incomplete.

6.4. Managerial and Policy Implications

There are some practical implications to the results. Financial flexibility should be established at an appropriate level to facilitate firm performance, but with proper governance, the funds may be misused or misallocated; hence, it is recommended that firms make proper alignment between financial policy and governance reform, especially in leadership and board composition. The evidence highlights the role of independent directors in maximizing the value of financial flexibility in the context of boards, and that increasing the independence of the board can lead to better outcomes of the use of internal resources for the value of the firm. Findings suggest that excessive control may negatively impact firm value by curtailing strategic flexibility, while a “just-right” level of control and professional governance may have more positive long-term implications for controlling shareholders. The findings for policymakers suggest the need for measures that enhance board independence and curb undue concentration of decision-making power to help boost transparency, accountability, and effectiveness of the financial capacity of companies’ boards.

6.5. Limitations

Despite its contributions, this study has several limitations. First, the research concentrates solely on listed companies in China, which may limit the generalizability of the results to other institutional environments. Second, the observable structural indicators measure governance mechanisms, and this may not be a complete measure of governance effectiveness on the ground. Third, although the models lag financial flexibility by one year, include firm and year fixed effects, and are complemented by a system-GMM dynamic-panel estimator to mitigate simultaneity and reverse causality, endogeneity cannot be fully eliminated with observational data in the absence of an external instrument or natural experiment. Future work could exploit exogenous shocks or instrumental-variable designs to sharpen identification further. These are the limitations that should be considered during the interpretation of the results.

6.6. Directions for Future Research

This study can be further expanded in a number of ways in future research. First, comparative research in the various institutional settings could examine whether the governance-contingent effects of financial flexibility differ between emerging and developed markets. Second, future research could examine alternative aspects of governance including executive pay, government ownership, or external oversight. Third, the study of the interaction of financial flexibility and governance during extreme crises or shocks can also provide additional information on corporate resilience.

6.7. Final Concluding Remarks

This paper shows that financial flexibility is associated with stronger firm performance, but its value is neither automatic nor universal. The internal systems of governance are decisive in determining whether financial flexibility is converted into firm value or diluted by agency problems. By highlighting the governance-contingent character of financial flexibility, the study offers a more refined perspective on the joint influence of financial policy and governance structures in determining firm performance.


Author Contributions

Conceptualization, X.C. and N.S.; methodology, X.C.; software, X.C.; validation, X.C., N.S. and S.A.; formal analysis, X.C.; investigation, X.C.; data curation, X.C.; writing—original draft preparation, X.C.; writing—review and editing, N.S. and S.A.; visualization, X.C.; supervision, N.S. and S.A.; project administration, N.S. All authors have read and agreed to the published version of the manuscript.

Funding

This research received no external funding.

Data Availability Statement

Data sources and replication details are documented in Appendix F. The original contributions presented in this study are included in the article. Further inquiries can be directed to the corresponding author.

Conflicts of Interest

The authors declare no conflicts of interest.

Appendix A. Detailed Variable Construction and Measurement

Appendix A.1. Financial Flexibility (FF): Conceptual and Operational Definition

Financial flexibility is defined as a firm’s capacity to mobilize internal financial resources and preserve borrowing ability in response to uncertainty, investment opportunities, and financing constraints. Unlike simple financial slack, financial flexibility reflects both liquidity availability and balance-sheet capacity.
Following contemporary empirical literature, financial flexibility is operationalized as a composite index combining liquidity and leverage dimensions.

Appendix A.1.1. Liquidity Component

C a s h   R a t i o i t = C a s h   a n d   C a s h   E q u i v a l e n t s i t T o t a l   A s s e t s i t
This measure captures readily deployable internal funds.

Appendix A.1.2. Debt Capacity Component

D e b t   C a p a c i t y i t = 1 T o t a l   L i a b i l i t i e s i t T o t a l   A s s e t s i t
This proxy reflects unused borrowing capacity and balance-sheet flexibility.

Appendix A.1.3. Standardization and Index Construction

To ensure comparability across firms and years, both components are standardized by year:
Z X i t = X i t   μ t σ t
The final financial flexibility index is computed as:
F F i t =   Z C a s h   R a t i o i t +   Z D e b t   C a p a c i t y i t
Higher values of FF indicate greater financial flexibility.

Appendix A.2. Firm Performance Measures

Two complementary performance measures are used:
  • Market-based performance (Tobin’s Q)
    T o b i n s   Q i t = M a r k e t   V a l u e   o f   E q u i t y i t + T o t a l   L i a b i l i t i e s i t T o t a l   A s s e t s i t
  • Accounting-based performance (ROA)
    R O A i t = N e t   I n c o m e i t T o t a l   A s s e t s i t
Using both measures mitigates concerns related to market mispricing or accounting distortions.

Appendix A.3. Corporate Governance Variables

Appendix A.3.1. Ownership Concentration (Own)

Measured as the percentage of shares held by the largest shareholder. This variable captures control concentration and potential principal–principal agency conflicts.
O w n e r s h i p i t =   S h a r e s   H e l d   b y   L a r g e s t   S h a r e h o l d e r i t T o t a l   O u t s t a n d i n g   S h a r e s i t

Appendix A.3.2. CEO Duality (CEO)

Dummy variable equal to 1 if the CEO concurrently serves as board chair, and 0 otherwise. This proxy reflects leadership power concentration and monitoring effectiveness.
C E O   D u a l i t y i t =   1 ,   i f   C E O   =   B o a r d   C h a i r
C E O   D u a l i t y i t =   0 ,   o t h e r w i s e

Appendix A.3.3. Board Independence (IDP)

Measured as the ratio of independent directors to total board members. Higher values indicate stronger board-level monitoring.
I D P i t =   N u m b e r   o f   I n d e p e n d e n t   D i r e c t o r s i t T o t a l   N u m b e r   o f   D i r e c t o r s i t

Appendix A.4. Control Variables

Table A1. Control variables: measurement and rationale.
VariableMeasurementRationale
Firm Sizeln(Total assets)Controls for scale effects
GrowthAnnual sales growthCaptures investment opportunities
Leverage (DR)Total liabilities/assetsControls capital structure
Asset Turnover (TAT)Sales/assetsOperating efficiency
Firm AgeYears since listingLifecycle effects
Cash FlowOperating CF/assetsInternal financing

Appendix B. Sample Construction and Data Cleaning

Appendix B.1. Sample Selection Criteria

The initial dataset includes all Chinese A-share listed firms from 2017 to 2024 obtained from the CSMAR database. The following exclusions are applied sequentially:
  • Financial firms (banks, insurance, securities)
  • ST and *ST firms
  • Firms listed in 2024
  • Observations with missing key variables
Table A2. Sample selection procedure (detailed screening steps).
StepDescriptionObservations
Initial sampleAll A-share firms43,812
LessFinancial firms−5432
LessST and *ST firms−3106
LessIPO firms (2024)−1247
LessMissing observations−7939
Final sampleFirm-year observations26,088

Appendix B.2. Winsorization and Outlier Treatment

All continuous variables are winsorized at the 1st and 99th percentiles to mitigate the influence of extreme values. This procedure reduces sensitivity to outliers while preserving distributional properties.

Appendix C. Econometric Model Specifications

Appendix C.1. Baseline Fixed-Effects Model

P e r f o r m a n c e i t = α + β 1   F F i t + Σ   γ k   C o n t r o l s i t + μ i + λ t + ε i t
where:
  • μ i = firm fixed effects (main models; an industry-and-year specification is reported as a robustness check)
  • λ t = year fixed effects

Appendix C.2. Moderation Models

P e r f o r m a n c e _ i t = α + β 1   F F _ i t + β 2   G o v _ i t + β 3   ( F F _ i t × G o v _ i t ) + Σ   γ k   C o n t r o l s i t + μ i + λ t + ε i t

Appendix C.3. Estimation Details

  • Firm-level clustered standard errors are used to address serial correlation.
  • Firm and year fixed effects are included in the main models.
  • All models are estimated using panel least squares.

Appendix D. Robustness and Sensitivity Considerations

The following robustness checks are reported in Section 4.6:
  • Alternative performance measures (ROA vs. Tobin’s Q)
  • Decomposition of financial flexibility into cash (CF) and debt-capacity (DF) components
  • Lagged financial flexibility to reduce simultaneity
  • Dynamic system-GMM estimation and a COVID-period sub-sample analysis
The governance-contingent pattern documented in the main models is robust across these specifications.

Appendix E. Multicollinearity and Diagnostics

Variance Inflation Factors (VIFs) are calculated for all regression models. All VIF values remain well below commonly accepted thresholds, indicating that multicollinearity does not materially affect coefficient estimates. It should nonetheless be noted that, by construction, the financial-flexibility index and the leverage-based debt-ratio control are mechanically related (pairwise correlation −0.677); although their variance inflation factors stay within accepted bounds, this partial overlap should be borne in mind when interpreting the financial-flexibility and debt-ratio coefficients jointly.

Appendix F. Data Source and Replication Statement

All firm-level financial and governance data are obtained from the CSMAR (China Stock Market & Accounting Research) database. The variable definitions, screening procedures, and econometric specifications described above allow full replication by researchers with access to the database.

References

  1. Acharya, Viral V., Heitor Almeida, and Murillo Campello. 2013. Aggregate risk and the choice between cash and lines of credit. Journal of Finance 68: 2059–116. [Google Scholar] [CrossRef]
  2. Ahn, Seoungpil, Pornsit Jiraporn, and Young Sang Kim. 2010. Multiple directorships and acquirer returns. Journal of Banking & Finance 34: 2011–26. [Google Scholar] [CrossRef]
  3. Aktas, Nihat, Ettore Croci, and Dimitris Petmezas. 2015. Is working capital management value-enhancing? Evidence from firm performance and investments. Journal of Corporate Finance 30: 98–113. [Google Scholar] [CrossRef]
  4. Almeida, Heitor, Murillo Campello, and Michael S. Weisbach. 2004. The cash flow sensitivity of cash. Journal of Finance 59: 1777–804. [Google Scholar] [CrossRef]
  5. Arslan-Ayaydin, Özgür, Chris Florackis, and Aydin Ozkan. 2014. Financial flexibility, corporate investment and performance: Evidence from financial crises. Review of Quantitative Finance and Accounting 42: 211–50. [Google Scholar] [CrossRef]
  6. Bae, Kee-Hong, Sadok El Ghoul, Zhaoran Gong, and Omrane Guedhami. 2021. Does CSR matter in times of crisis? Evidence from the COVID-19 pandemic. Journal of Corporate Finance 67: 101876. [Google Scholar] [CrossRef]
  7. Boubaker, Sabri, Pascal Nguyen, and Wael Rouatbi. 2016. Multiple large shareholders and corporate risk-taking: Evidence from French family firms. European Financial Management 22: 697–745. [Google Scholar] [CrossRef]
  8. Chen, Gongmeng, Michael Firth, Daniel N. Gao, and Oliver M. Rui. 2006. Ownership structure, corporate governance, and fraud: Evidence from China. Journal of Corporate Finance 12: 424–48. [Google Scholar] [CrossRef]
  9. Chen, Ruiyuan, Sadok El Ghoul, Omrane Guedhami, and He Wang. 2017. Do state and foreign ownership affect investment efficiency? Evidence from privatizations. Journal of Corporate Finance 42: 408–21. [Google Scholar] [CrossRef]
  10. Chen, Ruiyuan, Sadok El Ghoul, Omrane Guedhami, and Robert Nash. 2018. State ownership and corporate cash holdings. Journal of Financial and Quantitative Analysis 53: 2293–334. [Google Scholar] [CrossRef]
  11. DeAngelo, Harry, and Richard Roll. 2015. How stable are corporate capital structures? Journal of Finance 70: 373–418. [Google Scholar] [CrossRef]
  12. Denis, David J., and Stephen B. McKeon. 2012. Debt financing and financial flexibility: Evidence from proactive leverage increases. Review of Financial Studies 25: 1897–929. [Google Scholar] [CrossRef]
  13. Duru, Augustine, Raghavan J. Iyengar, and Ernest M. Zampelli. 2016. The dynamic relationship between CEO duality and firm performance: The moderating role of board independence. Journal of Business Research 69: 4269–77. [Google Scholar] [CrossRef]
  14. Fahlenbrach, Rüdiger, Kevin Rageth, and René M. Stulz. 2021. How valuable is financial flexibility when revenue stops? Evidence from the COVID-19 crisis. Review of Financial Studies 34: 5474–521. [Google Scholar] [CrossRef]
  15. Fatemi, Ali, Martin Glaum, and Stefanie Kaiser. 2018. ESG performance and firm value: The moderating role of disclosure. Global Finance Journal 38: 45–64. [Google Scholar] [CrossRef]
  16. Faulkender, Michael, Mark J. Flannery, Kristine Watson Hankins, and Jason M. Smith. 2012. Cash flows and leverage adjustments. Journal of Financial Economics 103: 632–46. [Google Scholar] [CrossRef]
  17. Favara, Giovanni, Janet Gao, and Mariassunta Giannetti. 2021. Uncertainty, access to debt, and firm precautionary behavior. Journal of Financial Economics 141: 436–53. [Google Scholar] [CrossRef]
  18. Feng, Chai Bin, Sultan Sikandar Mirza, Tanveer Ahsan, and Ammar Ali Gull. 2022. The impact of financial flexibility and directors’ academic experience on corporate R&D investments: A quantile regression approach. Applied Economics 54: 1974–88. [Google Scholar] [CrossRef]
  19. Ferrando, Annalisa, Maria-Teresa Marchica, and Roberto Mura. 2017. Financial flexibility and investment ability across the euro area and the UK. European Financial Management 23: 87–126. [Google Scholar] [CrossRef]
  20. Hoang, Edward C., and Indrit Hoxha. 2016. Corporate payout smoothing: A variance decomposition approach. Journal of Empirical Finance 35: 1–13. [Google Scholar] [CrossRef]
  21. Hoang, Edward C., and Indrit Hoxha. 2021. A tale of two emerging market economies: Evidence from payout smoothing in China and Taiwan. International Journal of Managerial Finance 17: 361–76. [Google Scholar] [CrossRef]
  22. Hoberg, Gerard, Gordon Phillips, and Nagpurnanand Prabhala. 2014. Product market threats, payouts, and financial flexibility. Journal of Finance 69: 293–324. [Google Scholar] [CrossRef]
  23. Huang, Ying Sophie, and Chia-Jane Wang. 2015. Corporate governance and risk-taking of Chinese firms: The role of board size. International Review of Economics & Finance 37: 96–113. [Google Scholar] [CrossRef]
  24. Jiang, Fuxiu, and Kenneth A. Kim. 2020. Corporate governance in China: A survey. Review of Finance 24: 733–72. [Google Scholar] [CrossRef]
  25. Jiang, Fuxiu, Yunbiao Ma, and Xue Wang. 2020. Multiple blockholders and earnings management. Journal of Corporate Finance 64: 101689. [Google Scholar] [CrossRef]
  26. Krause, Ryan, Matthew Semadeni, and Albert A. Cannella. 2014. CEO duality: A review and research agenda. Journal of Management 40: 256–86. [Google Scholar] [CrossRef]
  27. Lambrecht, Bart M., and Stewart C. Myers. 2012. A Lintner model of payout and managerial rents. Journal of Finance 67: 1761–810. [Google Scholar] [CrossRef]
  28. Lambrecht, Bart M., and Stewart C. Myers. 2017. The dynamics of investment, payout, and debt. Review of Financial Studies 30: 3759–800. [Google Scholar] [CrossRef]
  29. Ma, Chun-Ai, and Yanbo Jin. 2016. What drives the relationship between financial flexibility and firm performance: Investment scale or investment efficiency? Evidence from China. Emerging Markets Finance and Trade 52: 2043–55. [Google Scholar] [CrossRef]
  30. Marchica, Maria-Teresa, and Roberto Mura. 2010. Financial flexibility, investment ability, and firm value: Evidence from firms with spare debt capacity. Financial Management 39: 1339–65. [Google Scholar] [CrossRef]
  31. Masulis, Ronald W., Cong Wang, and Fei Xie. 2012. Globalizing the boardroom: The effects of foreign directors on corporate governance and firm performance. Journal of Accounting and Economics 53: 527–54. [Google Scholar] [CrossRef]
  32. Mubeen, Riaqa, Dongping Han, Jaffar Abbas, Susana Álvarez-Otero, and Muhammad Safdar Sial. 2021. The relationship between CEO duality and business firms’ performance: The moderating role of firm size and corporate social responsibility. Frontiers in Psychology 12: 669715. [Google Scholar] [CrossRef] [PubMed]
  33. Peng, Mike W., Shujun Zhang, and Xinchun Li. 2007. CEO duality and firm performance during China’s institutional transitions. Management and Organization Review 3: 205–25. [Google Scholar] [CrossRef]
  34. Tran, Hien Thi. 2021. The link between independent directors and firm performance: The moderating role of corporate social responsibility. Corporate Governance 21: 831–44. [Google Scholar] [CrossRef]
  35. Wu, Wei, Shiyu Zhang, Yali Fan, and Yulu Shi. 2024. Financial flexibility, firm performance, and financial distress: A comparative study of China and the U.S. during pandemics. International Review of Financial Analysis 96: 103706. [Google Scholar] [CrossRef]
  36. Young, Michael N., Mike W. Peng, David Ahlstrom, Garry D. Bruton, and Yi Jiang. 2008. Corporate governance in emerging economies: A review of the principal–principal perspective. Journal of Management Studies 45: 196–220. [Google Scholar] [CrossRef]
  37. Yu, Meici. 2023. CEO duality and firm performance: A systematic review and research agenda. European Management Review 20: 346–58. [Google Scholar] [CrossRef]
  38. Zhang, Dingzu, and Luqi Liu. 2022. Does ESG performance enhance financial flexibility? Evidence from China. Sustainability 14: 11324. [Google Scholar] [CrossRef]
Figure 1. Overview of the hypothesized relationships among financial flexibility, corporate governance, and firm performance.
Risks 14 00166 g001
Figure 2. Conceptual Framework. (Source: Authors’ conceptualization).
Risks 14 00166 g002
Figure 3. Baseline effect of financial flexibility on firm performance. *** p < 0.01.
Risks 14 00166 g003
Figure 4. Baseline effect of financial flexibility.
Risks 14 00166 g004
Figure 5. Illustrates the marginal effect of financial flexibility at different levels of ownership concentration, showing a clear downward slope as ownership concentration increases. The shaded area is an approximate 95% confidence band; *** p < 0.01 refers to the interaction coefficient.
Risks 14 00166 g005
Figure 6. Marginal Effect of FF by Ownership Concentration.
Risks 14 00166 g006
Figure 7. Illustrates the marginal effect of financial flexibility under the two leadership structures, showing that the effect of financial flexibility is weaker in firms that have CEO duality. Error bars are approximate 95% confidence intervals; ** p < 0.05 refers to the interaction coefficient.
Risks 14 00166 g007
Figure 8. Marginal Effect of FF under CEO Duality.
Risks 14 00166 g008
Figure 9. Illustrates the marginal effect of financial flexibility across different levels of board independence, showing an upward slope as board independence increases. The shaded area is an approximate 95% confidence band; * p < 0.1 refers to the interaction coefficient.
Risks 14 00166 g009
Figure 10. Marginal Effect of FF by Board Independence.
Risks 14 00166 g010
Table 1. Literature Summary and Hypothesis Development.
HypothesisGovernance MechanismExpected EffectKey References
H1Financial FlexibilityPositiveAlmeida et al. (2004); Ma and Jin (2016)
H2Ownership ConcentrationNegative moderationBoubaker et al. (2016); Young et al. (2008)
H3CEO DualityNegative moderationKrause et al. (2014)
H4Board IndependencePositive moderationAhn et al. (2010); Masulis et al. (2012)
Table 2. Sample Selection Procedure.
StepDescriptionObservations
Initial sampleAll A-share listed firms (2017–2024)43,812
LessFinancial firms−5432
LessST and *ST firms−3106
LessIPO firms in 2024−1247
LessObservations with missing data−7939
Final sampleNon-financial A-share firms26,088
Table 4. Summary statistics of all variables.
VariableMeanStd. Dev.MinMax
Tobin’s Q1.90261.15160.81197.6055
ROA0.03090.0661−0.25910.2018
FF−0.00320.5789−1.22881.5810
Own0.15020.10790.01590.5306
CEO0.31370.464001
IDP0.37830.05280.33330.5714
Size22.39121.310019.933226.3866
Grow0.11910.3298−0.55631.8136
TAT0.59400.39170.07792.4456
Age11.49098.2327130
Cashflow−0.05480.2296−0.80630.6094
DR0.42120.19780.06280.8957
Table 5. Correlation Matrix.
(1)(2)(3)(4)(5)(6)(7)(8)(9)(10)(11)(12)(13)(14)
(1) Tobin’s Q1
(2) ROA0.176 ***1
(3) FF0.229 ***0.425 ***1
(4) CF0.210 ***0.512 ***0.849 ***1
(5) DF0.102 ***−0.014 **0.548 ***0.028 ***1
(6) Own−0.085 ***0.176 ***0.056 ***0.101 ***−0.053 ***1
(7) CEO0.097 ***0.1240.090 ***0.067 ***0.064 ***−0.056 ***1
(8) IDP0.043 ***−0.0090.017 ***0.021 ***−0.0020.043 ***0.118 ***1
(9) Size−0.338 ***0.064 ***−0.378 ***−0.266 ***−0.302 ***0.203 ***−0.189 ***−0.018 ***1
(10) DR−0.251 ***−0.319 ***−0.677 ***−0.675 ***−0.217 ***0.005−0.115 ***−0.014 **0.464 ***1
(11) Age−0.138 ***−0.105 ***−0.251 ***−0.195 ***−0.168 ***−0.033 ***−0.264 ***−0.044 ***0.431 ***0.291 ***1
(12) TAT−0.0030.141 ***0.108 ***−0.0080.215 ***0.047 ***−0.026 ***−0.0070.069 ***0.167 ***0.052 ***1
(13) Cashflow0.014 **0.027 ***0.129 ***0.129 ***0.044 ***0.016 ***−0.059 ***−0.003−0.035 ***−0.153 ***0.166 ***0.043 ***1
(14) Grow0.111 ***0.267 ***0.044 ***0.059 ***−0.017 ***0.016 ***0.014 **−0.0050.038 ***0.041 ***−0.074 ***0.130 ***−0.371 ***1
Notes: Variables are numbered (1)–(14) as listed in the first column. CF and DF denote the cash-flexibility and debt-flexibility components of the financial-flexibility index (FF); Cashflow denotes operating cash flow. *** p < 0.01, ** p < 0.05.
Table 6. (a) Baseline—Tobin’s Q (H1). (b) Robustness—ROA as dependent variable.
(a)
VariableCoef.Std. Err.tp
Constant18.5604 ***0.758824.460.000
FF0.0825 ***0.02753.000.003
Size−0.6996 ***0.0339−20.650.000
Grow0.1911 ***0.01969.760.000
Age0.1733 ***0.03335.200.000
TAT0.2925 ***0.04876.010.000
DR−0.1946 ***0.0289−6.730.000
Cashflow0.0173 ***0.00295.870.000
Firm FEYes
Year FEYes
Observations20,896
F165.33
Adj. R20.1983
(b)
VariableCoef.Std. Err.tp
Constant−0.5159 ***0.0461−11.200.000
FF0.0503 ***0.002024.550.000
Size0.0262 ***0.002112.730.000
Grow0.0377 ***0.001525.380.000
Age−0.00190.0023−0.830.407
TAT0.0291 ***0.00446.640.000
DR−0.0858 ***0.0081−10.640.000
Cashflow0.0129 ***0.00225.820.000
Firm FEYes
Year FEYes
Observations20,896
F261.18
Adj. R20.3272
Notes: The Tobin’s Q column reports the baseline model (H1); the ROA column reports the robustness check with ROA as the dependent variable. t-statistics in parentheses. *** p < 0.01.
Table 7. Ownership concentration (H2).
VariableCoef.Std. Err.tp
Constant7.7804 ***0.173044.980.000
FF0.2312 **0.09172.520.012
Own−1.0952 ***0.2571−4.260.000
FF × Own−1.3831 ***0.3458−4.000.000
Size−0.8107 ***0.0696−11.640.000
Grow0.0010 *0.00051.910.056
Age0.0138 ***0.00482.850.004
TAT0.2476 ***0.05484.520.000
DR−0.5978 ***0.2317−2.580.010
Cashflow0.0206 ***0.00345.980.000
Firm FEYes
Year FEYes
Observations20,896
F106.00
Adj. R20.1296
Notes: *** p < 0.01, ** p < 0.05, * p < 0.1.
Table 8. CEO duality (H3).
VariableCoef.Std. Err.tp
Constant18.5682 ***0.756724.540.000
FF0.0580 **0.02961.960.050
CEO−0.0547 **0.0227−2.410.016
FF × CEO−0.0747 **0.0313−2.390.017
Size−0.6993 ***0.0338−20.710.000
Grow0.1902 ***0.01969.700.000
Age0.1726 ***0.03335.190.000
TAT0.2923 ***0.04866.010.000
DR−0.1984 ***0.0289−6.860.000
Cashflow0.0181 ***0.00296.340.000
Firm FEYes
Year FEYes
Observations20,896
F145.36
Adj. R20.1585
Notes: *** p < 0.01, ** p < 0.05.
Table 9. Board independence (H4).
VariableCoef.Std. Err.tp
Constant19.7460 ***1.480213.340.000
FF0.0157 ***0.00413.810.000
IDP0.0051 **0.00232.220.026
FF × IDP0.0108 *0.00581.870.061
Size−0.7985 ***0.0678−11.770.000
Grow0.00080.00090.870.384
Age0.0177 ***0.00493.580.000
TAT0.2486 ***0.05384.620.000
DR−0.5262 **0.2230−2.360.018
Cashflow0.0229 ***0.00425.470.000
Firm FEYes
Year FEYes
Observations20,896
F105.89
Adj. R20.1255
Notes: *** p < 0.01, ** p < 0.05, * p < 0.1.
Table 10. System-GMM (dependent variable: Tobin’s Q).
VariableCoef.Std. Err.tp
Tobin’s Q (t − 1)0.6382 ***0.035018.260.000
FF−0.0901 ***0.0221−4.070.000
Size−0.1441 ***0.0103−14.020.000
Grow0.1142 ***0.02674.280.000
Age−0.0049 ***0.0009−5.570.000
TAT0.0851 ***0.01695.050.000
DR−0.2840 ***0.0554−5.130.000
Cashflow0.4462 ***0.039811.200.000
Firms4362
Observations20,896
Instruments16
AR(1)/AR(2) p0.000/0.918
Hansen p0.194
Notes: *** p < 0.01.
Table 11. Cash component (CF).
VariableCoef.Std. Err.tp
Constant7.5138 ***0.181141.480.000
CF (cash)0.1977 ***0.02478.020.000
Size−0.2473 ***0.0083−29.620.000
Grow0.4333 ***0.025816.780.000
Age0.0066 ***0.00106.520.000
TAT0.00730.01740.420.674
DR−0.2564 ***0.0615−4.170.000
Cashflow0.1874 ***0.03405.510.000
Firm FEYes
Year FEYes
F227.68
Adj. R20.1919
Notes: *** p < 0.01.
Table 12. Debt-capacity component (DF).
VariableCoef.Std. Err.tp
Constant7.6875 ***0.182942.020.000
DF (debt cap.)0.1249 ***0.02524.960.000
Size−0.2493 ***0.0086−29.150.000
Grow0.4555 ***0.026117.420.000
Age0.0062 ***0.00106.060.000
TAT0.0580 ***0.01813.200.001
DR−0.6305 ***0.0471−13.390.000
Cashflow0.2089 ***0.03456.060.000
Firm FEYes
Year FEYes
F224.51
Adj. R20.1892
Notes: *** p < 0.01.
Table 13. FF–performance by sub-period (Tobin’s Q).
VariablePre (2017–2019)During (2020–2022)Post (2023–2024)
FF0.1419 *** (0.0377)0.1477 *** (0.0373)−0.0065 (0.0314)
Size−0.2769 ***−0.1787 ***−0.2779 ***
Grow0.2013 ***0.6403 ***0.4170 ***
Age0.0121 ***−0.00120.0093 ***
TAT0.0217−0.0688 **0.0542 *
DR−0.3081 ***−0.6198 ***−0.3118 ***
Cashflow0.2160 ***0.1191 **0.3219 ***
Firm & Year FEYesYesYes
N759597978696
R20.23410.17610.1981
Standard errors in parentheses for FF. Firm and year fixed effects in all columns. *** p < 0.01, ** p < 0.05, * p < 0.1.
Table 14. Marginal effect of FF at representative governance levels.
Governance VariableLevelMarginal Effect of FFApprox. 95% CI
Ownership concentration (Own)0.04+0.1759[−0.006, +0.358]
0.15 (mean)+0.0237[−0.183, +0.230]
0.26−0.1284[−0.380, +0.123]
CEO duality (CEO)0 (separate)+0.0580[0.000, +0.116]
1 (dual)−0.0167[−0.101, +0.068]
Board independence (IDP)0.33+0.0193[+0.010, +0.028]
0.38 (mean)+0.0198[+0.011, +0.029]
0.43+0.0203[+0.011, +0.030]
Note: Confidence intervals are approximate, computed from the reported coefficient standard errors under an assumption of zero covariance between the baseline and interaction coefficients. Because this covariance is typically negative for interaction models, the intervals are conservative (wider than exact intervals). The moderation itself is established by the interaction coefficients (Table 7, Table 8 and Table 9), which are statistically significant. Marginal effects are also displayed in Figure 5, Figure 6, Figure 7, Figure 8 and Figure 9.
Disclaimer/Publisher’s Note: The statements, opinions and data contained in all publications are solely those of the individual author(s) and contributor(s) and not of MDPI and/or the editor(s). MDPI and/or the editor(s) disclaim responsibility for any injury to people or property resulting from any ideas, methods, instructions or products referred to in the content.