Abstract
We investigate the influence of boardroom gender diversity on earnings management. Drawing on a sample of European firms over the 2010–2023 period, we document an inverted U-shaped nexus between boardroom gender heterogeneity and earnings manipulation. Moreover, we also find that the Democracy Index moderates the curvilinear nexus by flattening the inverted U-curve and shifting the inflection point leftward. Our findings are consistent across various measures of earnings management and different econometric approaches, offering valuable insights for European policymakers.
1. Introduction
Amid the latest accounting fraud scandals (e.g., Tesco and Wirecard), the influence of boardroom attributes, including gender, on earnings quality has gained considerable interest from academics and policymakers. Based on the lens of agency theory, female directors tend to exhibit greater ethical sensitivity, caution, risk aversion, and monitoring capacity than their male peers, which prevents them from engaging in unethical practices such as earnings manipulation (Gull et al. 2018). From the perspective of critical mass theory, only sizeable boardroom gender minorities contribute to board decision making and corporate outcomes (such as financial reporting and earnings quality). Otherwise, their voices and influence may be marginalized.
Although previous research has attempted to explore the nexus between boardroom gender heterogeneity and earnings manipulation, the empirical results remain indecisive. Specifically, some studies document a negative nexus (Kyaw et al. 2015; Gull et al. 2018; Kouaib and Almulhim 2019; Saona et al. 2024), others a negligible or positive (Sun et al. 2011; Paul et al. 2023), and others a curvilinear (Nguyen 2024; Du et al. 2016). However, even those empirical studies that report a curvilinear link do not formally test for the shape of the curve as suggested by Haans et al. (2016), leading to misleading inferences.
Moreover, although previous studies have investigated the moderating role of societal and cultural factors on the board diversity–earnings quality nexus, the influence of democracy remains unexplored. Directors’ capacity to shape corporate outcomes depends upon institutional and contextual factors, and we argue that democracy is one of them. Specifically, based on institutional theory, formal and informal institutions affect how boardrooms perceive the costs and benefits of financial reporting quality. Therefore, the actions of female directors are constrained or encouraged by these institutional forces. More democratic nations exhibit greater transparency, accountability, scrutiny, risk management, and robust governance practices (Bonaparte 2024; Socol and Iuga 2025). Therefore, the influence of internal monitoring mechanisms, such as gender diversity, on earnings quality may be less pronounced in more democratic countries.
Based on the above, this research aims to fill the gaps in the literature by exploring the following fundamental questions: (1) Does the effect of boardroom gender heterogeneity on earnings management exhibit a non-linearity? (2) Does the Democracy Index moderate this curvilinear relationship?
2. Literature Review
According to agency theory, gender balance in a corporate boardroom can minimize agency conflicts, as it enhances managerial oversight and aligns the interests of managers and stockholders. Female directors are considered to be more ethical, cautious, and risk-averse than their male peers and are less likely to engage in unethical behaviors, such as earnings manipulation activities (Gull et al. 2018). In line with this theoretical perspective, Kouaib and Almulhim (2019) note that boardroom gender heterogeneity prevents earnings manipulation practices. Moreover, based on a sample of Spanish companies, Saona et al. (2024) document a favorable association between gender-diverse boardrooms and transparent financial reporting.
Based on the lens of critical mass theory, once a minority of boardroom members with specific characteristics (e.g., gender, nationality, tenure, and age) reaches a certain threshold, it will significantly contribute to board decision-making and corporate outcomes (Brahma et al. 2021). Specifically, female directors cannot effectively contribute to board operations until a minimum number (critical mass) is achieved. A marginal presence of women on corporate boards may lead to tokenism issues (suspicion and isolation), which limit their ability to exert meaningful influence. Utilizing a dataset of Chinese corporations, Du et al. (2016) identify an inverted U-shaped relationship between the top management team’s gender heterogeneity and earnings management, lending support to the critical mass theory. In the same vein, Nguyen (2024) reports a U-shaped association between boardroom gender diversity and earnings quality, suggesting that a critical mass of female directors can alleviate tokenism issues and enhance financial reporting accuracy. In contrast, Paul et al. (2023) argue that gender diversity in the boardroom can lead to increased earnings manipulation, suggesting that female directors may not be as risk-averse as commonly believed. However, Sun et al. (2011) report an insignificant relationship between gender diversity and earnings management. Based on the above discussion, we anticipate that:
H1.
There is an inverted U-shaped relation between boardroom gender heterogeneity and earnings management.
Institutional theory suggests that human and corporate actions are influenced by the social, cultural, and institutional dynamics of the societies in which they are embedded. In other words, the institutional environment shapes the behavior of directors, which in turn affects their capacity to influence corporate outcomes. According to this theoretical framework, boardroom gender heterogeneity is not universally beneficial for firms (Varouchas et al. 2024), as the benefits of gender diversity rely on the specific features of the institutional environment. Specifically, its impact depends on institutional and contextual factors (e.g., accounting regulations, investor protection, corporate governance quality, cultural context, democracy, and legal frameworks). For instance, Naghavi et al. (2021) argue that in countries characterized by high power distance, masculinity, individualism, and low uncertainty avoidance, a greater representation of women on corporate boards is associated with a negative effect on firm performance. Kyaw et al. (2015) emphasize that gender-diverse boardrooms prevent earnings management in countries characterized by high levels of gender equality. Moreover, Nguyen et al. (2021) suggest that boardroom gender balance boosts corporate performance in nations with high national governance quality. They argue that in countries with strong national governance systems, female directors are likely to be more empowered and motivated to make substantial contributions to boardroom decision-making processes.
While prior studies have examined various institutional factors affecting the relationship between boardroom gender diversity and earnings management, the role of democracy has, to the best of the authors’ knowledge, not yet been explored. As a system of governance, democracy fundamentally shapes the economic landscape of countries worldwide. Democracy is regarded as a necessary condition for financial liberalization and the creation of an effective financial regulatory framework (Agoraki et al. 2020).
The complementary hypothesis suggests that external governance-monitoring mechanisms can enhance the effectiveness of internal governance-monitoring mechanisms. In contrast, the substitution hypothesis supports the opposite. On the one hand, democratic institutions foster an environment of freedom, fairness, and equality that enables female directors to actively and effectively participate in boardroom operations, amplifying their contribution to governance quality and the integrity of financial reporting. On the other hand, more democratic countries exhibit greater transparency, accountability, scrutiny, and risk management, efficient oversight, and robust governance practices (Bonaparte 2024; Socol and Iuga 2025). Thus, the influence of internal monitoring mechanisms, such as gender diversity, on earnings quality may be less pronounced in more democratic countries. Therefore, the quality of democracy may function as either a substitute or a complement to internal monitoring mechanisms, such as gender diversity, in the effective oversight of accounting reports. Based on the preceding information, we expect that:
H2.
The quality of a country’s democracy moderates the inverted U-shaped nexus between gender diversity in the boardroom and earnings management.
3. Research Methodology
3.1. Sample
Our preliminary sample included 2054 European firms over the 2010–2023 period. However, following earlier research (Sha et al. 2021), we excluded financial, real estate, and utility companies and firms with missing values on key corporate governance variables. Therefore, our final sample consists of 1818 firms, yielding 13,596 observations. Due to the lack of information for certain firms during the entire sampling period, our dataset has an unbalanced structure. Firm-related information was gathered from the Refinitiv database. The data related to the Democracy Index were obtained from the Economist Intelligence Unit (EIU). We decided on 2010 as a starting point, aiming to evaluate the influence of boardroom gender diversity on earnings management and to explore how democracy might influence this relationship in the aftermath of the 2008–2009 financial crisis. In addition, given that our data were gathered in December 2024, 2023 was chosen as the cut-off point, as there was no available information for the following years.
3.2. Variables
Our key dependent variable is earnings management. Researchers emphasize that managers frequently use accruals to manipulate financial outcomes, given that external stakeholders do not easily detect them (Jones 1991; Kothari et al. 2005; Dechow et al. 1995). Therefore, we use discretionary accruals as an earnings management proxy. Following the convention in the literature, to estimate current discretionary accruals we rely on the following models:
(i) Jones (1991) model:
(ii) Modified Jones (Dechow et al. 1995) model:
(iii) Performance-matched model (Kothari et al. 2005):
where represents total accruals, measured as net income before extraordinary items minus cash flow from operations; denotes the change in revenues; denotes the change in net receivables; indicates the gross property, plant, and equipment; indicates the one-year lagged total assets; represents return on assets (net income before extraordinary items divided by total assets). The residuals of Equations (1)–(3) represent the current discretionary accruals (). Consistent with the literature, we use the absolute value of current discretionary accruals () in our analysis.
Our main independent variable of interest is , denoting the proportion of female board members. denotes the square of . In this research, we utilize the Democracy Index () provided by the Economist Intelligence Unit (EIU) as our main democracy proxy. The index ranges from 0 (no democracy) to 10 (full democracy). Higher values of this index denote a better quality of democracy. Specifically, the utilized index is constructed based on 60 distinct indicators, which are organized into five categories: (i) political participation, (ii) civil liberties, (iii) electoral process and pluralism, (iv) the effectiveness of governmental functioning, and (v) political culture. The overall score determines a country’s classification into one of four regime types: (i) “Full democracy” (8 < score ≤ 10), (ii) “Flawed democracy” (6 < score ≤ 8), (iii) “Hybrid regimes” (4 < score ≤ 6), (iv) “Authoritarian regimes” (score ≤ 4). The index seeks to offer a snapshot of global democracy, monitor its evolution over time, and assist in analyzing political trends and developments.
We also control for board-level, firm-level, and country-level characteristics that may impact the earnings manipulation process. More precisely, denotes the proportion of independent directors. is a dummy variable that equals 1 if the Chairman is also the CEO, and 0 otherwise. indicates the debt-to-assets ratio. denotes firm size, measured by the natural logarithm of total assets. indicates the ratio of investment in research and development to total assets. is defined as the current assets scaled by total assets. captures the percentage change in revenues. is a dummy variable that equals 1 if a company is audited by any of the Big 4 auditors and 0 in other cases. denotes firm performance, measured by the ratio of net income before extraordinary items to total assets. represents the GDP growth of each country (information sourced from the World Bank).
3.3. Model Specification
To examine whether there is a curvilinear relationship between boardroom gender heterogeneity and earnings management we use Model (4). Next, we rely on Model (5) to examine whether the Democracy Index moderates the previously mentioned nonlinear relationship.
where indicates firms, denotes time, represents the country, represents the constant, denote the coefficients of regressors, and is a random error term.
3.4. Estimation Approach
We performed various econometric tests before selecting the appropriate estimation technique for our econometric models. Initially, we tested for heteroskedasticity. The results of the modified Wald test (p-value = 0.000) confirm the existence of heteroskedasticity in our panel dataset. Second, we performed the Wooldridge test for serial correlation in panel data. The results (p-value = 0.000) indicate the presence of autocorrelation. Third, we performed a cross-sectional dependence test. The Pesaran (CD) test results (p-value = 0.000) provide evidence of cross-sectional dependence. Thus, we implemented the “xtscc” approach in Stata 17 with Driscoll–Kraay standard errors to address heteroskedasticity, cross-sectional dependence, and autocorrelation issues. Moreover, to account for the endogenous determination of boardroom gender heterogeneity, we also performed the instrumental variables 2-stage least-squares (IV-2SLS) estimation technique. Drawing inspiration from Usman et al. (2019), we used the 1-year and 2-year lags of the proportion of female directors and the industry average of gender heterogeneity as instruments for gender diversity. Since Model 4 incorporates the squared term of gender diversity, the first stage comprises two equations. Similarly, Model 5 includes the squared term of gender heterogeneity as well as interaction terms between the Democracy Index and both gender heterogeneity and its square, so the first stage of this model consists of four equations (Owen and Temesvary 2018). Consequently, in addition to our primary instruments, we also employ the 1-year lag of these endogenous variables. The detailed first-stage results and statistics for Model 4 can be found in Appendix A1. To assess the strength of the selected instruments, we conducted two post-estimation tests. More precisely, we performed the Hansen J test of overidentifying restrictions to assess the validity of our instrumental variables (H0: Valid instruments). Moreover, we implemented an “underidentification” test utilizing the Anderson canonical correlation LM statistic to explore whether the excluded instruments are “relevant”, i.e., correlated with endogenous variables (H0: Irrelevant instruments).
4. Empirical Results
4.1. Data Analysis
Table 1 presents summary statistics. To mitigate the effect of outliers, all continuous variables have been winsorized at the 1% and 99% levels. The average value of ABSDA is approximately 0.04, which is higher than that of 0.012 in Gull et al. (2018). On average, female directors make up 25.6% of total boardroom members. This outcome is significantly higher than the mean value of 10.14% reported by Kyaw et al. (2015). The mean DEM is 8.44, indicating that, on average, European countries achieve high democracy quality. Our obtained result is higher than 6.83 in Bonaparte (2024). The detailed statistics of the remaining variables are also presented in Table 1. The correlation analysis in Appendix A indicates no multicollinearity issues, which is also confirmed by the mean (1.14) and highest (1.27) values of the variance inflation factors. Appendix A also presents the sample distribution by country, year, and sector.

Table 1.
Summary statistics.
4.2. Regression Results
As indicated in Table 2, there is an inverted U-shaped relationship between boardroom gender heterogeneity and earnings management, which supports our initial hypothesis. Our results align with the findings of Nguyen (2024) and Du et al. (2016). The significant and positive coefficient of GENDER and the significant and negative coefficient of GENDER2 confirm this result. Furthermore, as illustrated in Appendix A, the inverted U-shaped pattern is validated as the extreme point (maximum) lying within the data range, and the slope is steep enough at both ends (Haans et al. 2016). Specifically, consistent with the critical mass theory, we denote that at first a marginal representation of female directors increases earnings manipulation, but once the proportion of female directors surpasses a certain threshold a further addition of female directors starts to prevent earnings management, indicating that the monitoring efficiency, morality, and risk aversion of female directors outweigh potential problems (e.g., conflicts, isolation, and communication hardships) associated with tokenism issues. More precisely, when the representation of female directors falls below the critical threshold, their ability to influence decision making is limited, as male directors dominate through autocratic leadership, thereby facilitating the adoption of aggressive and unethical earnings management practices. However, once the proportion of female board members exceeds the critical threshold, their influence on leadership style and strategic decision making becomes significant, contributing to a reduction in earnings manipulation.
Table 2.
Gender and earnings management.
Consistent with Gull et al. (2018), we denote an inverse nexus between boardroom independence and earnings management, suggesting that the stringent oversight provided by independent directors effectively limits opportunistic financial reporting. However, the impact of CEO duality is negligible. Reinforcing the conclusions of Bouaziz et al. (2020), our results suggest a positive link between financial leverage and discretionary accruals. In agreement with Nguyen (2024), our findings indicate that larger companies, benefiting from more advanced internal control systems compared to smaller companies, are less prone to earnings manipulation. Unlike the findings of Gull et al. (2018), our results reveal a significant and positive association between R&D and discretionary accruals (ABSDA). Moreover, we conclude that companies with strong liquidity face less pressure to manipulate earnings, as they possess adequate resources to sustain operations and meet short-term obligations without relying on accounting manipulation to demonstrate financial stability. Aligned with Du et al. (2016), we argue that selecting a Big 4 auditing firm serves as an external monitoring tool, which can reduce the extent of earnings management. The positive coefficients of ROA and GROWTH suggest that firms with higher returns and greater revenue growth are more likely to engage in earnings manipulation practices (Du et al. 2016). We also demonstrate a negative association between GDP growth and earnings manipulation, suggesting that improved macroeconomic conditions are associated with a reduction in managerial incentives or pressures to manipulate earnings.
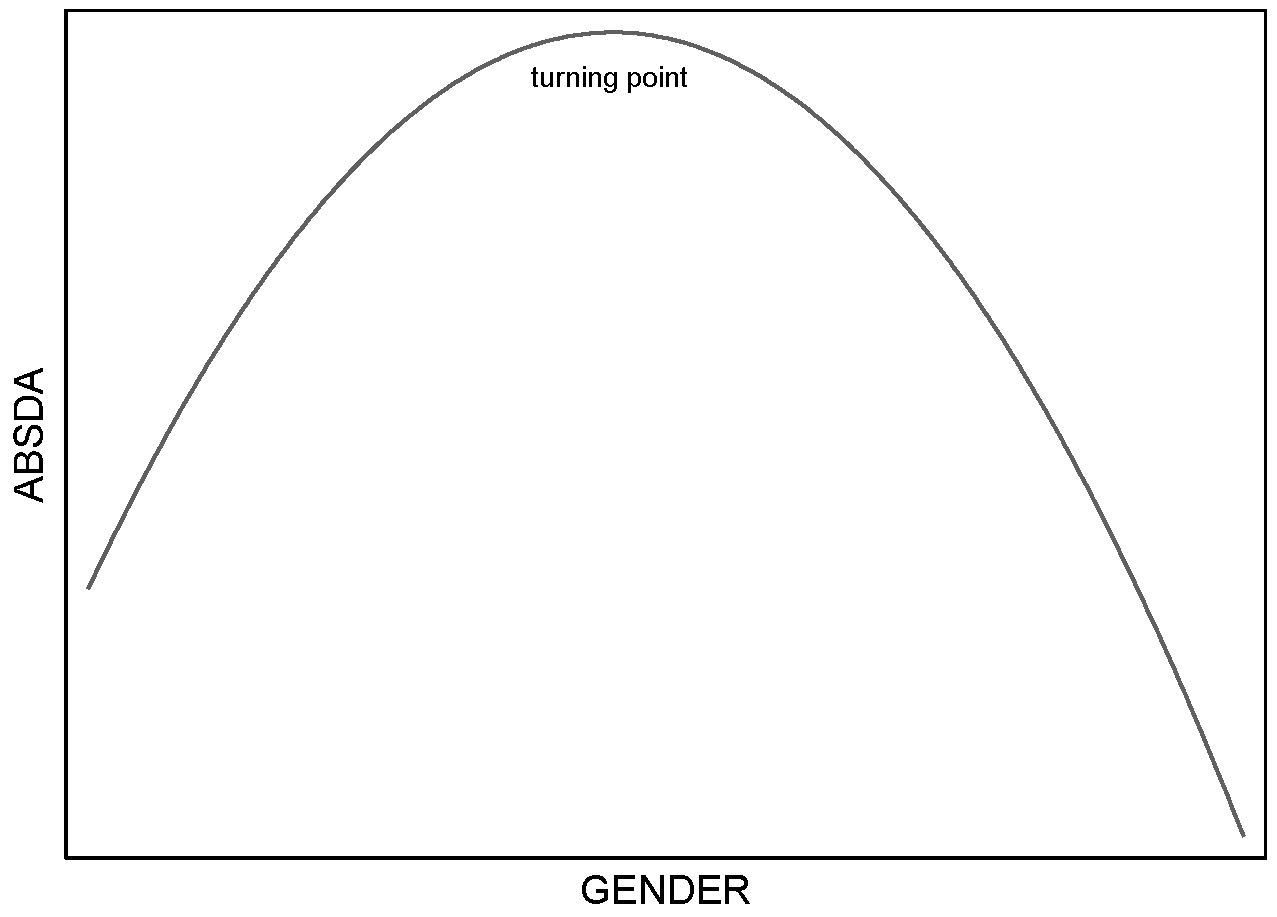
To strengthen the reliability of our findings, we also include a visual representation of our results. Figure 1 presents the predicted ABSDA across different levels of GENDER. Figure 2 depicts the obtained inverted U-shaped curve between ABSDA and GENDER.
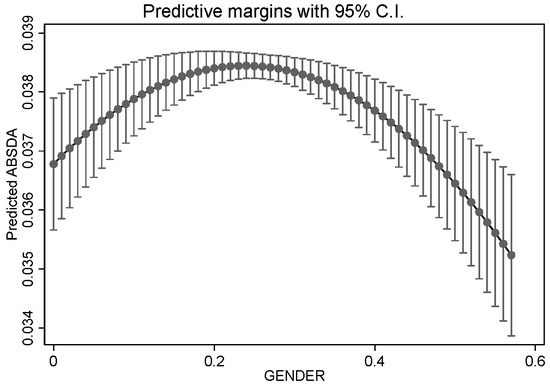
Figure 1.
Marginal effects plot.
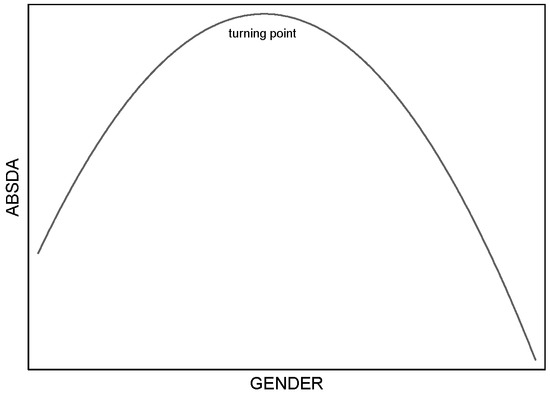
Figure 2.
Graphical illustration of the inverted U-curve.
To assess democracy’s moderating effect on the inverted U-curve, we test both for a steepening/flattening of the curve and for a possible shift in the extreme point (Haans et al. 2016). As illustrated in Table 3, the significant and positive coefficient () of the quadratic interaction term (GENDER2 × DEM) indicates that democracy flattens the inverted U-shaped curve between boardroom gender diversity and earnings management. That is to say, the inhibitory (enhancing) effect of boardroom gender heterogeneity on earnings management after (before) the turning point becomes weaker for companies operating in more democratic countries. Transparency, sound governance, better risk management, efficient oversight, and lower corruption levels are notable attributes of democratic countries. Therefore, the influence of internal control mechanisms, such as gender diversity, on earnings quality is weaker for firms operating in more democratic countries. In other words, in democratic regimes, where external governance mechanisms are already strong, the influence of internal governance-monitoring mechanisms becomes less important, lending support to the substitution hypothesis. Moreover, before the inflection point, democracy lessens the negative (positive) effect of token female representation on earnings quality (manipulation). More precisely, democracy can alleviate the risks linked to the early-stage or symbolic representation of boardroom minorities. Concerning the extreme point change, following Haans et al. (2016), we perform a formal test (by assigning the mean value to DEM) to assess the significance of the term . The results indicate that the whole term is negative and significant (p-value = 0.044), indicating a leftward movement of the curve’s peak. This suggests that female directors’ mitigating (beneficial) effect on earnings management (quality) will occur earlier for corporations in more democratic countries. This result shows that a lower proportion of women on the board is sufficient to reduce earnings management in more democratic countries, indicating that the quality of democracy may substitute the need for a critical mass of female directors to curb earnings manipulation. In general, the above findings lend empirical support to the second hypothesis. Furthermore, our findings corroborate the institutional theory, indicating that the influence of boardroom gender heterogeneity is contingent upon institutional factors, such as the quality of democracy. The impact of the control variables remains as in Table 2.
Table 3.
Gender, democracy, and earnings management.
Moreover, apart from controlling for industry-specific characteristics and unobserved changes over time, we also control for unobserved, time-invariant firm-level characteristics by employing the multiple fixed effects estimation technique. Including firm fixed effects in our regression analysis reduces omitted variable bias by accounting for unobserved, time-invariant firm factors that may influence both earnings quality and the gender composition of the board2.
The results in Table 4 (columns 1, 2, and 3) confirm the inverted U-shaped relationship between boardroom gender heterogeneity and earnings manipulation, enhancing the validity of our estimates. However, while the results continue to suggest that the Democracy Index flattens the inverted U-shaped relationship, the effect is statistically insignificant, as the main (GENDER and GENDER2) and interaction terms (GENDER × DEM and GENDER2 × DEM) retain their signs but lack significance (columns 4, 5, and 6).
Table 4.
Multiple fixed effects regression analysis.
5. Conclusions
Using a sample of European companies, we determine that the link between boardroom gender diversity and earnings management follows an inverted U-curve, which aligns with the critical mass theory. Further, drawing on institutional theory, we also find that the Democracy Index moderates this nexus by flattening the inverted U-curve and moving the inflection point left.
The paper’s contribution is fourfold. First, by thoroughly testing and confirming the existence of an inverted U-shaped link between boardroom gender diversity and earnings manipulation, our research distinguishes itself from previous studies that have reported either a negative or insignificant association, thereby reconciling the indecisive empirical conclusions. Second, to the best of the authors’ knowledge, this is the first empirical attempt that investigates the moderating influence of democracy on the board gender diversity–earnings management relationship, extending the current literature in this realm. Third, our research offers fruitful insights to European policymakers, showing that the influence of internal monitoring mechanisms (i.e., gender diversity) on financial reporting depends on institutional and socio-political factors (i.e., democracy). Simply put, boardroom gender diversity may not always be beneficial for corporate prosperity. More precisely, we argue that democracy (an external governance mechanism) and boardroom gender diversity (an internal governance mechanism) operate as substitutes for curbing earnings manipulation. In essence, our results indicate that there is no ‘one size fits all’ case. Therefore, regulators should consider the institutional setting when designing boardroom diversity initiatives, rules, and quotas. In addition, business owners and other stakeholders should consider that the effectiveness of boardroom gender heterogeneity in enhancing financial integrity is not uniform across all institutional settings. Overall, our empirical conclusions underscore the necessity for tailored practices and context-specific regulations. Fourth, from a methodological perspective, our study addresses common panel data issues (e.g., heteroskedasticity, autocorrelation, cross-sectional dependence, and endogeneity) that have been prevalent in many previous studies. Additionally, our results remain robust across three different indicators of earnings management and under two distinct econometric approaches.
Finally, this research is not without limitations. Initially, we restrict our focus on the influence of boardroom gender heterogeneity on earnings manipulation, neglecting other board attributes such as culture, expertise, and tenure. Future research can expand this research by examining whether a curvilinear link exists between these attributes and earnings quality. Moreover, beyond the Democracy Indicator, future research could explore the moderating effect of other socio-political indices, such as the Political Freedom Index and the Economic Freedom Index, on the relationship between board composition and earnings manipulation.
Author Contributions
Conceptualization, E.G.V. and S.E.A.; methodology, E.G.V. and S.E.A.; software, E.G.V. and S.E.A.; validation, E.G.V., S.E.A. and C.F.; formal analysis, E.G.V., S.E.A. and C.F.; investigation, E.G.V.; data curation, E.G.V. and S.E.A.; writing—original draft preparation, E.G.V.; writing—review and editing, S.E.A. and C.F.; visualization, E.G.V. and S.E.A.; supervision, S.E.A. and C.F. All authors have read and agreed to the published version of the manuscript.
Funding
This research received no external funding.
Data Availability Statement
The data presented in this study are available on request from the corresponding author.
Conflicts of Interest
The authors declare no conflicts of interest.
Appendix A
Table A1.
Correlations.
Table A1.
Correlations.
| Variables | (1) | (2) | (3) | (4) | (5) | (6) | (7) | (8) | (9) | (10) | (11) | (12) |
|---|---|---|---|---|---|---|---|---|---|---|---|---|
| (1) GENDER | 1 | |||||||||||
| (2) IND | 0.195 *** | 1 | ||||||||||
| (3) DUALITY | 0.029 *** | −0.089 *** | 1 | |||||||||
| (4) LEVERAGE | 0.059 *** | 0.017 * | 0.024 *** | 1 | ||||||||
| (5) LNSIZE | 0.075 *** | 0.093 *** | 0.093 *** | 0.174 *** | 1 | |||||||
| (6) R&D | −0.014 | 0.114 *** | 0.016 * | −0.123 *** | −0.172 *** | 1 | ||||||
| (7) LIQUIDITY | −0.009 | −0.056 *** | 0.021 ** | −0.368 *** | −0.325 *** | 0.239 *** | 1 | |||||
| (8) GROWTH | −0.010 | 0.000 | −0.017 * | −0.046 *** | −0.070 *** | 0.042 *** | 0.027 *** | 1 | ||||
| (9) BIG4 | −0.028 *** | 0.029 *** | 0.041 *** | 0.009 | 0.103 *** | −0.008 | −0.023 *** | −0.007 | 1 | |||
| (10) ROA | 0.021 ** | −0.022 *** | 0.013 | −0.167 *** | 0.218 *** | −0.317 *** | −0.055 *** | 0.134 *** | 0.033 *** | 1 | ||
| (11) GDP | −0.015 * | 0.035 *** | −0.010 | −0.027 *** | 0.018 ** | 0.010 | −0.006 | 0.256 *** | 0.017 ** | 0.063 *** | 1 | |
| (12) DEM | 0.191 *** | 0.199 *** | −0.073 *** | −0.116 *** | −0.197 *** | 0.106 *** | 0.125 *** | 0.015 * | −0.009 | −0.084 *** | −0.002 | 1 |
Notes: Asterisks indicate significance at three levels: 10% (*), 5% (**), and 1% (***).
Table A2.
Sample distribution by country, year, and sector.
Table A2.
Sample distribution by country, year, and sector.
| Country | Freq. | Percent |
|---|---|---|
| Austria | 218 | 1.60 |
| Belgium | 327 | 2.41 |
| Bulgaria | 3 | 0.02 |
| Cyprus | 35 | 0.26 |
| Denmark | 416 | 3.06 |
| Finland | 471 | 3.46 |
| France | 1311 | 9.64 |
| Germany | 1527 | 11.23 |
| Greece | 145 | 1.07 |
| Hungary | 60 | 0.44 |
| Iceland | 23 | 0.17 |
| Ireland | 424 | 3.12 |
| Italy | 532 | 3.91 |
| Lithuania | 4 | 0.03 |
| Luxembourg | 188 | 1.38 |
| Malta | 30 | 0.22 |
| Netherlands | 501 | 3.68 |
| Norway | 398 | 2.93 |
| Poland | 197 | 1.45 |
| Portugal | 105 | 0.77 |
| Romania | 15 | 0.11 |
| Russia | 320 | 2.35 |
| Slovenia | 9 | 0.07 |
| Spain | 430 | 3.16 |
| Sweden | 1480 | 10.89 |
| Switzerland | 1089 | 8.01 |
| Ukraine | 14 | 0.10 |
| United Kingdom | 3324 | 24.46 |
| Total | 13,596 | 100 |
| Year | Freq. | Percent |
| 2010 | 499 | 3.67 |
| 2011 | 526 | 3.87 |
| 2012 | 543 | 3.99 |
| 2013 | 552 | 4.06 |
| 2014 | 571 | 4.20 |
| 2015 | 615 | 4.52 |
| 2016 | 642 | 4.72 |
| 2017 | 702 | 5.16 |
| 2018 | 934 | 6.87 |
| 2019 | 1158 | 8.52 |
| 2020 | 1535 | 11.29 |
| 2021 | 1740 | 12.80 |
| 2022 | 1782 | 13.11 |
| 2023 | 1797 | 13.22 |
| Total | 13,596 | 100 |
| Sector | Freq. | Percent |
| Basic Materials | 1771 | 13.03 |
| Consumer Cyclicals | 2655 | 19.53 |
| Consumer Non-Cyclicals | 1195 | 8.79 |
| Energy | 894 | 6.58 |
| Healthcare | 1456 | 10.71 |
| Industrials | 3364 | 24.74 |
| Technology | 2261 | 16.62 |
| Total | 13,596 | 100 |
Table A3.
U-test.
Table A3.
U-test.
| Driscoll-Kraay Regression | Driscoll-Kraay Regression | Driscoll-Kraay Regression | IV-2SLS | IV-2SLS | IV-2SLS | |||||||
|---|---|---|---|---|---|---|---|---|---|---|---|---|
| ABSDA | Jones Model | Modified Jones Model | Performance-Matched Model | Jones Model | Modified Jones Model | Performance-Matched Model | ||||||
| Lower Bound | Upper Bound | Lower Bound | Upper Bound | Lower Bound | Upper Bound | Lower Bound | Upper Bound | Lower Bound | Upper Bound | Lower Bound | Upper Bound | |
| Interval | 0 | 0.571 | 0 | 0.571 | 0 | 0.571 | 0 | 0.571 | 0 | 0.571 | 0 | 0.571 |
| Slope | 0.014 | −0.019 | 0.011 | −0.017 | 0.010 | −0.016 | 0.021 | −0.025 | 0.019 | −0.025 | 0.019 | −0.024 |
| t-value | 4.237 | −5.423 | 2.434 | −4.941 | 2.384 | −4.918 | 3.146 | −3.285 | 2.587 | −3.025 | 2.538 | −2.950 |
| Overall test p-value | 0.000 | 0.015 | 0.016 | 0.000 | 0.004 | 0.005 | ||||||
| Turning point | 0.239 | 0.224 | 0.223 | 0.258 | 0.247 | 0.248 | ||||||
| 95% Fieller C.I. | [0.155–0.313] | [0.050–0.301] | [0.042–0.302] | [0.196–0.316] | [0.150–0.309] | [0.148–0.312] | ||||||
Table A4.
First-stage regressions.
Table A4.
First-stage regressions.
| Jones Model | Modified Jones Model | Performance-Matched Model | ||||
|---|---|---|---|---|---|---|
| Dependent variable: | GENDER | GENDER2 | GENDER | GENDER2 | GENDER | GENDER2 |
| GENDERt−1 | 0.906 *** | 0.106 *** | 0.852 *** | 0.070 *** | 0.852 *** | 0.070 *** |
| (52.291) | (12.590) | (40.049) | (6.623) | (40.049) | (6.623) | |
| GENDERt−2 | 0.093 *** | 0.056 *** | 0.093 *** | 0.056 *** | ||
| (7.778) | (7.531) | (7.778) | (7.531) | |||
| GENDER2t−1 | −0.154 *** | 0.655 *** | −0.197 *** | 0.637 *** | −0.197 *** | 0.637 *** |
| (−5.007) | (34.937) | (−6.097) | (32.120) | (−6.097) | (32.120) | |
| GENDER_INDUSTRY | 0.105 *** | 0.044 *** | 0.072 *** | 0.030 * | 0.072 *** | 0.030 * |
| (4.107) | (2.811) | (2.705) | (1.797) | (2.705) | (1.797) | |
| IND | 0.018 *** | 0.006 *** | 0.015 *** | 0.005 *** | 0.015 *** | 0.005 *** |
| (6.269) | (4.051) | (4.884) | (3.054) | (4.884) | (3.054) | |
| DUALITY | 0.002 | 0.002 ** | 0.000 | 0.001 | 0.000 | 0.001 |
| (1.477) | (2.439) | (0.156) | (1.469) | (0.156) | (1.469) | |
| LEVERAGE | −0.004 | −0.000 | −0.003 | −0.000 | −0.003 | −0.000 |
| (−0.851) | (−0.089) | (−0.534) | (−0.164) | (−0.534) | (−0.164) | |
| LNSIZE | 0.002 *** | 0.001 *** | 0.002 *** | 0.001 *** | 0.002 *** | 0.001 *** |
| (5.027) | (4.009) | (4.490) | (3.473) | (4.490) | (3.473) | |
| R&D | −0.032 | −0.022 | −0.018 | −0.014 | −0.018 | −0.014 |
| (−1.299) | (−1.442) | (−0.626) | (−0.811) | (−0.626) | (−0.811) | |
| LIQUIDITY | 0.003 | 0.002 | 0.003 | 0.002 | 0.003 | 0.002 |
| (0.556) | (0.735) | (0.629) | (0.738) | (0.629) | (0.738) | |
| GROWTH | 0.005 * | 0.003 * | 0.004 | 0.003 | 0.004 | 0.003 |
| (1.727) | (1.664) | (1.277) | (1.393) | (1.277) | (1.393) | |
| BIG4 | 0.002 * | 0.001 | 0.003 ** | 0.001 | 0.003 ** | 0.001 |
| (1.863) | (1.177) | (2.237) | (1.500) | (2.237) | (1.500) | |
| ROA | 0.007 | 0.003 | 0.017 * | 0.008 | 0.017 * | 0.008 |
| (0.703) | (0.656) | (1.702) | (1.519) | (1.702) | (1.519) | |
| GDP | −0.000 | −0.000 | −0.000 | −0.000 | −0.000 | −0.000 |
| (−0.592) | (−1.158) | (−0.401) | (−1.006) | (−0.401) | (−1.006) | |
| CONSTANT | −0.053 *** | −0.037 *** | −0.038 *** | −0.032 *** | −0.038 *** | −0.032 *** |
| (−3.941) | (−4.773) | (−2.698) | (−3.835) | (−2.698) | (−3.835) | |
| Observations | 11,004 | 11,004 | 9364 | 9364 | 9364 | 9364 |
| Industry dummies | ✓ | ✓ | ✓ | ✓ | ✓ | ✓ |
| Year dummies | ✓ | ✓ | ✓ | ✓ | ✓ | ✓ |
| F-statistic p-value | 0.000 | 0.000 | 0.000 | 0.000 | 0.000 | 0.000 |
| S-W F statistics | 3298 | 3230 | 1834 | 1827 | 1834 | 1827 |
Notes: Asterisks indicate significance at three levels: 10% (*), 5% (**), and 1% (***). GENDER_INDUSTRY = industry average of gender heterogeneity. S-W = Sanderson–Windmeijer. ✓ = Yes.
Notes
| 1 | Concerning the first-stage regressions, we utilized the IV-2SLS F-statistics to assess instrument strength and the Sanderson–Windmeijer F-test to evaluate instrument weakness (Null: Weak instruments). The detailed first-stage outcomes and statistics for Model 5 are available upon request. |
| 2 | We gratefully acknowledge the anonymous reviewer for this valuable suggestion. |
References
- Agoraki, Maria-Eleni K., Georgios P. Kouretas, and Christos Triantopoulos. 2020. Democracy, regulation and competition in emerging banking systems. Economic Modelling 84: 190–202. [Google Scholar] [CrossRef]
- Bonaparte, Yosef. 2024. Why do stock markets negatively price democracy? Journal of International Financial Markets, Institutions and Money 91: 101905. [Google Scholar] [CrossRef]
- Bouaziz, Dhouha, Bassem Salhi, and Anis Jarboui. 2020. CEO characteristics and earnings management: Empirical evidence from France. Journal of Financial Reporting and Accounting 18: 77–110. [Google Scholar] [CrossRef]
- Brahma, Sanjukta, Chioma Nwafor, and Agyenim Boateng. 2021. Board gender diversity and firm performance: The UK evidence. International Journal of Finance & Economics 26: 5704–19. [Google Scholar] [CrossRef]
- Dechow, Patricia M., Richard G. Sloan, and Amy P. Sweeney. 1995. Detecting earnings management. Accounting Review 70: 193–225. [Google Scholar]
- Du, Xingqiang, Shaojuan Lai, and Hongmei Pei. 2016. Do women top managers always mitigate earnings management? Evidence from China. China Journal of Accounting Studies 4: 308–38. [Google Scholar] [CrossRef]
- Gull, Ammar Ali, Mehdi Nekhili, Haithem Nagati, and Tawhid Chtioui. 2018. Beyond gender diversity: How specific attributes of female directors affect earnings management. The British Accounting Review 50: 255–74. [Google Scholar] [CrossRef]
- Haans, Richard F. J., Constant Pieters, and Zi-Lin He. 2016. Thinking about U: Theorizing and testing U-and inverted U-shaped relationships in strategy research. Strategic Management Journal 37: 1177–95. [Google Scholar] [CrossRef]
- Jones, Jennifer J. 1991. Earnings management during import relief investigations. Journal of Accounting Research 29: 193–228. [Google Scholar] [CrossRef]
- Kothari, Sagar P., Andrew J. Leone, and Charles E. Wasley. 2005. Performance matched discretionary accrual measures. Journal of Accounting and Economics 39: 163–97. [Google Scholar] [CrossRef]
- Kouaib, Amel, and Abdullah Almulhim. 2019. Earnings manipulations and board’s diversity: The moderating role of audit. The Journal of High Technology Management Research 30: 100356. [Google Scholar] [CrossRef]
- Kyaw, Khine, Mojisola Olugbode, and Barbara Petracci. 2015. Does gender diverse board mean less earnings management? Finance Research Letters 14: 135–41. [Google Scholar] [CrossRef]
- Naghavi, Navaz, Saeed Pahlevan Sharif, and Hafezali Bin Iqbal Hussain. 2021. The role of national culture in the impact of board gender diversity on firm performance: Evidence from a multi-country study. Equality Diversity and Inclusion 40: 631–50. [Google Scholar] [CrossRef]
- Nguyen, Quang Khai. 2024. Women in top executive positions, external audit quality and financial reporting quality: Evidence from Vietnam. Journal of Accounting in Emerging Economies 14: 993–1019. [Google Scholar] [CrossRef]
- Nguyen, Tuan, An Nguyen, Mau Nguyen, and Thuyen Truong. 2021. Is national governance quality a key moderator of the boardroom gender diversity–firm performance relationship? International evidence from a multi-hierarchical analysis. International Review of Economics & Finance 73: 370–90. [Google Scholar] [CrossRef]
- Owen, Ann L., and Judit Temesvary. 2018. The performance effects of gender diversity on bank boards. Journal of Banking & Finance 90: 50–63. [Google Scholar] [CrossRef]
- Paul, Olojede, Erin Olayinka, and Adetula Dorcas. 2023. Do corporate governance mechanisms restrain earnings management? Evidence from Nigeria. International Journal of Business Governance and Ethics 17: 544–72. [Google Scholar] [CrossRef]
- Saona, Paolo, Laura Muro, Pablo San Martín, and Ryan McWay. 2024. Do board gender diversity and remuneration impact earnings quality? Evidence from Spanish firms. Gender in Management: An International Journal 39: 18–51. [Google Scholar] [CrossRef]
- Sha, Yezhou, Lu Qiao, Suyang Li, and Ziwen Bu. 2021. Political freedom and earnings management. Journal of International Financial Markets, Institutions and Money 75: 101443. [Google Scholar] [CrossRef]
- Socol, Adela, and Iulia Cristina Iuga. 2025. Does democracy matter in banking performance? Exploring the linkage between democracy, economic freedom and banking performance in the European Union member states. International Journal of Finance & Economics 30: 86–116. [Google Scholar] [CrossRef]
- Sun, Jerry, Guoping Liu, and George Lan. 2011. Does Female Directorship on Independent Audit Committees Constrain Earnings Management? Journal of Business Ethics 99: 369–82. [Google Scholar] [CrossRef]
- Usman, Muhammad, Muhammad Umar Farooq, Junrui Zhang, Muhammad Abdul Majid Makki, and Muhammad Kaleem Khan. 2019. Female directors and the cost of debt: Does gender diversity in the boardroom matter to lenders? Managerial Auditing Journal 34: 374–92. [Google Scholar] [CrossRef]
- Varouchas, Evangelos, Stavros Arvanitis, Emmanuel Mamatzakis, and George M. Agiomirgianakis. 2024. Examining the influence of gender and ethnic diversity on bank performance: Empirical insights from the USA. International Journal of Banking, Accounting and Finance 14: 513–58. [Google Scholar] [CrossRef]

Disclaimer/Publisher’s Note: The statements, opinions and data contained in all publications are solely those of the individual author(s) and contributor(s) and not of MDPI and/or the editor(s). MDPI and/or the editor(s) disclaim responsibility for any injury to people or property resulting from any ideas, methods, instructions or products referred to in the content. |
© 2025 by the authors. Licensee MDPI, Basel, Switzerland. This article is an open access article distributed under the terms and conditions of the Creative Commons Attribution (CC BY) license (https://creativecommons.org/licenses/by/4.0/).