Abstract
The aim of this research is to thoroughly investigate the influence of the 2025 Donald Trump Presidential Inauguration on informational efficiency of the U.S. exchange-traded fund market in the context of political risk. The data set includes daily observations for twenty U.S. Exchange-Traded Funds (ETFs). The whole sample comprises the period from 20 October 2024 to 20 April 2025. Since the Presidential Inauguration of Donald Trump took place on 20 January 2025, two sub-samples of an equal length are analyzed: (1) the period before the 2025 U.S. Presidential Inauguration from 20 October 2024 to 19 January 2025 and (2) the period after the 2025 U.S. Presidential Inauguration from 20 January 2025 to 20 April 2025. Since the whole sample period is not long (six months), to estimate market efficiency, modified Shannon entropy based on symbolic encoding with two thresholds is used. The empirical findings are visualized by symbol-sequence histograms. The proposed research hypothesis states that the U.S. ETF market’s informational efficiency, as measured by entropy, substantially decreased during the turbulent period after the Donald Trump Presidential Inauguration compared to the period before the Inauguration. The results unambiguously confirm the research hypothesis and indicate that political risk could affect the informational efficiency of markets. To the best of the author’s knowledge, this is the first study exploring the influence of the Donald Trump Presidential Inauguration on the informational efficiency of the U.S. ETF market.
1. Introduction
Measuring the impact of political risk on investment decisions is one of the most significant issues in international business and finance (Bekaert et al. 2016). However, the results and conclusions are rather diverse. For instance, the authors of (Erb et al. 1996) formulated the following research question: How important is an understanding of country risk for investors? The authors utilized different measures of country risk representing the political risk, economic risk, and financial risk of various countries and concluded that changes in political risk have marginal explanatory power in emerging financial markets but not in developed markets. Other researchers have emphasized that higher political (and geopolitical) risks may herald lower employment and investment and are usually associated with larger downside risks and higher disaster probability (Caldara and Iacoviello 2022).
Undoubtedly, the U.S. presidential elections usually generate a high level of political risk (in its broader meaning), not only in the United States but worldwide. In general, financial markets tend to respond positively to incumbents who are expected to continue existing policies, while new candidates may provoke caution among investors. Additionally, there is a general perception that the financial market tends to perform better under a particular political party (see, e.g., (Thaker et al. 2025) and the references therein).
Therefore, in the context of political risk, the aim of this study is to thoroughly investigate the influence of the 2025 Donald Trump Presidential Inauguration in the U.S. on the informational efficiency of the U.S. Exchange-Traded Fund (ETF) market.
The data set includes daily observations for twenty ETFs. The whole sample comprises the period from 20 October 2024 to 20 April 2025. Since the Presidential Inauguration of Donald Trump took place on 20 January 2025, the following two sub-samples of equal length are investigated: (1) the period before the 2025 U.S. Presidential Inauguration from 20 October 2024 to 19 January 2025 and (2) the period after the 2025 U.S. Presidential Inauguration from 20 January 2025 to 20 April 2025. The date of the Presidential Inauguration is crucial, since at that point, Donald Trump legally assumed the role of president and started to make important economic and politically motivated decisions.
The whole sample period is not long (six months). Hence, the procedures that are commonly utilized to investigate market efficiency within long time periods (e.g., the Hurst exponent (Hurst 1951)) are not useful in this case. Therefore, in this research, modified Shannon entropy based on symbolic encoding with two thresholds is used (Olbrys 2024b). Generally speaking, the use of proper symbolic encoding of information is a foundation of the mathematical theory of communication (Shannon 1948). Data analysis tools referred to as symbolic time-series analysis (STSA) involve the transformation of raw data time series into a series of symbols and can be used to investigate market efficiency within relatively short time periods (see, e.g., Ahn et al. 2019; Brouty and Garcin 2023; Calcagnile et al. 2020; Mensi et al. 2012; Olbrys 2024a; Olbryś and Komar 2023; Sensoy et al. 2014; Shternshis et al. 2022).
In general, the concept of informational market efficiency is crucial in finance, and it is strictly connected with the Efficient Market Hypothesis (EMH) that was introduced in the seminal paper by Fama (1970). On the basis of the existing literature, the following three possible forms of market efficiency are analyzed: (1) weak-form efficiency (the information set includes only the history of prices and returns), (2) semi-strong-form efficiency (the information set includes all publicly available information), and (3) strong-form efficiency (the information set includes all information known to any market participant) (Campbell et al. 1997). In this research, we address the semi-strong-form efficiency of the U.S. ETF market, since the aim is to assess the influence of all publicly available information (including the history of prices and returns). Undoubtedly, testing for market (in)efficiency is rather complicated; therefore, empirical findings are frequently ambiguous (Dimson and Mussavian 1998; Lim and Brooks 2011).
The contribution of this study is twofold. First, to the best of the author’s knowledge, this is the first paper to explore the influence of the Donald Trump Presidential Inauguration on the informational efficiency of the U.S. ETF market. Second, in our research, we utilize a relatively new methodology based on modified Shannon entropy. We propose a research hypothesis that states that the informational efficiency of the U.S. ETF market, as measured by the entropy of the funds’ daily rates of return, substantially decreased during the turbulent period after the Donald Trump Presidential Inauguration. All major results are illustrated by symbol-sequence histograms. The results are homogenous and indicate no reason to reject the research hypothesis. The empirical findings reported in this paper are entirely novel and have not been presented in the literature thus far.
The remaining part of this study is organized as follows. Section 2 outlines selected issues concerning ETFs, specifically on the U.S. financial market. Section 3 describes the methodological background of this research. Section 4 presents and compares empirical findings. Section 5 summarizes and discusses the main results and indicates some further research directions. The study is supplemented with Appendix A and Appendix B.
2. Exchange-Traded Funds (ETFs): Selected Issues
An exchange-traded fund (ETF) is a specific investment whose performance is based on an particular index or other underlying asset. The goal of an ETF is to mimic its corresponding financial instrument in order to yield the same return on investment (Calcagnile et al. 2020). As innovative financial products, ETFs were first introduced in the early 1990s, either in Canada (with Toronto Index Participation units (TIPs), which were first traded on 9 March 1990) or in the U.S. (with SPDR, which was first traded on 23 January 1993). Standard & Poor’s Depositary Receipt (SPDR), ticker SPY, is often referred to as the world’s first ETF. For more details concerning the history of ETFs see, e.g., (Deville 2008) and the references therein.
ETFs are very interesting and relatively popular investment opportunities. Hence, the literature concerning this topic is quite extensive, and it is not possible to provide a full citation list. Therefore, only some selected sources, including broader literature surveys and comprehensive guides to ETFs, are presented and discussed in this study.
For instance, the (Liebi 2020) reviewed the academic literature concerning ETFs and grouped the surveyed papers into six sub-categories according to the analyzed economic outcome. These outcomes are liquidity, volatility, price discovery, financial distress, co-movement, and leveraged ETFs.
Moreover, the literature indicates that some important features of ETFs have caused their growing popularity among investors. Some of these features are transparency, intraday tradeability, tax efficiency, and access to specific markets or asset classes (Antoniewicz and Heinrichs 2014).
The authors of a useful guide to ETFs (Hill et al. 2015) emphasized that there are some benefits of using ETFs as investment vehicles. First, investors appoint lower costs and benefits of index strategies. A second core benefit of ETFs is simply access. Furthermore, the transparency of ETFs is helpful in portfolio construction and analysis. The fourth major benefit of ETFs is their liquidity. Other key benefits of ETFs are tax efficiency and tax fairness. However, like any powerful tool, ETFs can be dangerous if not properly understood.
It is important to stress that innovation in the ETF market and its rapid growth may heighten various risks to investors, such as liquidity, collateral and counterparty risks, in addition to possibly introducing risks to financial systems (Foucher and Gray 2014). Although ETFs have acquired rising popularity among both individual and institutional investors, liquidity shocks in the ETF market are propagated to the prices of underlying securities, adding a new layer of non-fundamental volatility (Ben-David et al. 2018).
In (Lettau and Madhavan 2018), the authors concluded that although the increased variety and complexity of investment products provide more opportunities, investment decisions require more financial sophistication. ETFs are part of this trend, with many advantages and some possible disadvantages. Investors should take a view that distinguishes the various ETF types in the same way we analyze the pros and cons of various types of mutual funds. ETFs, as financial innovations, compete with existing open-end mutual index funds in the context of their alternative organizational form and characteristics. It seems that conventional funds and ETFs are substitutes—but not perfect substitutes—for one another (Agapova 2011). Marszk and Lechman (2020) presented a comprehensive comparison exploring the main differences between ETFs and mutual funds. In fact, these differences may be regarded as relative advantages of ETFs.
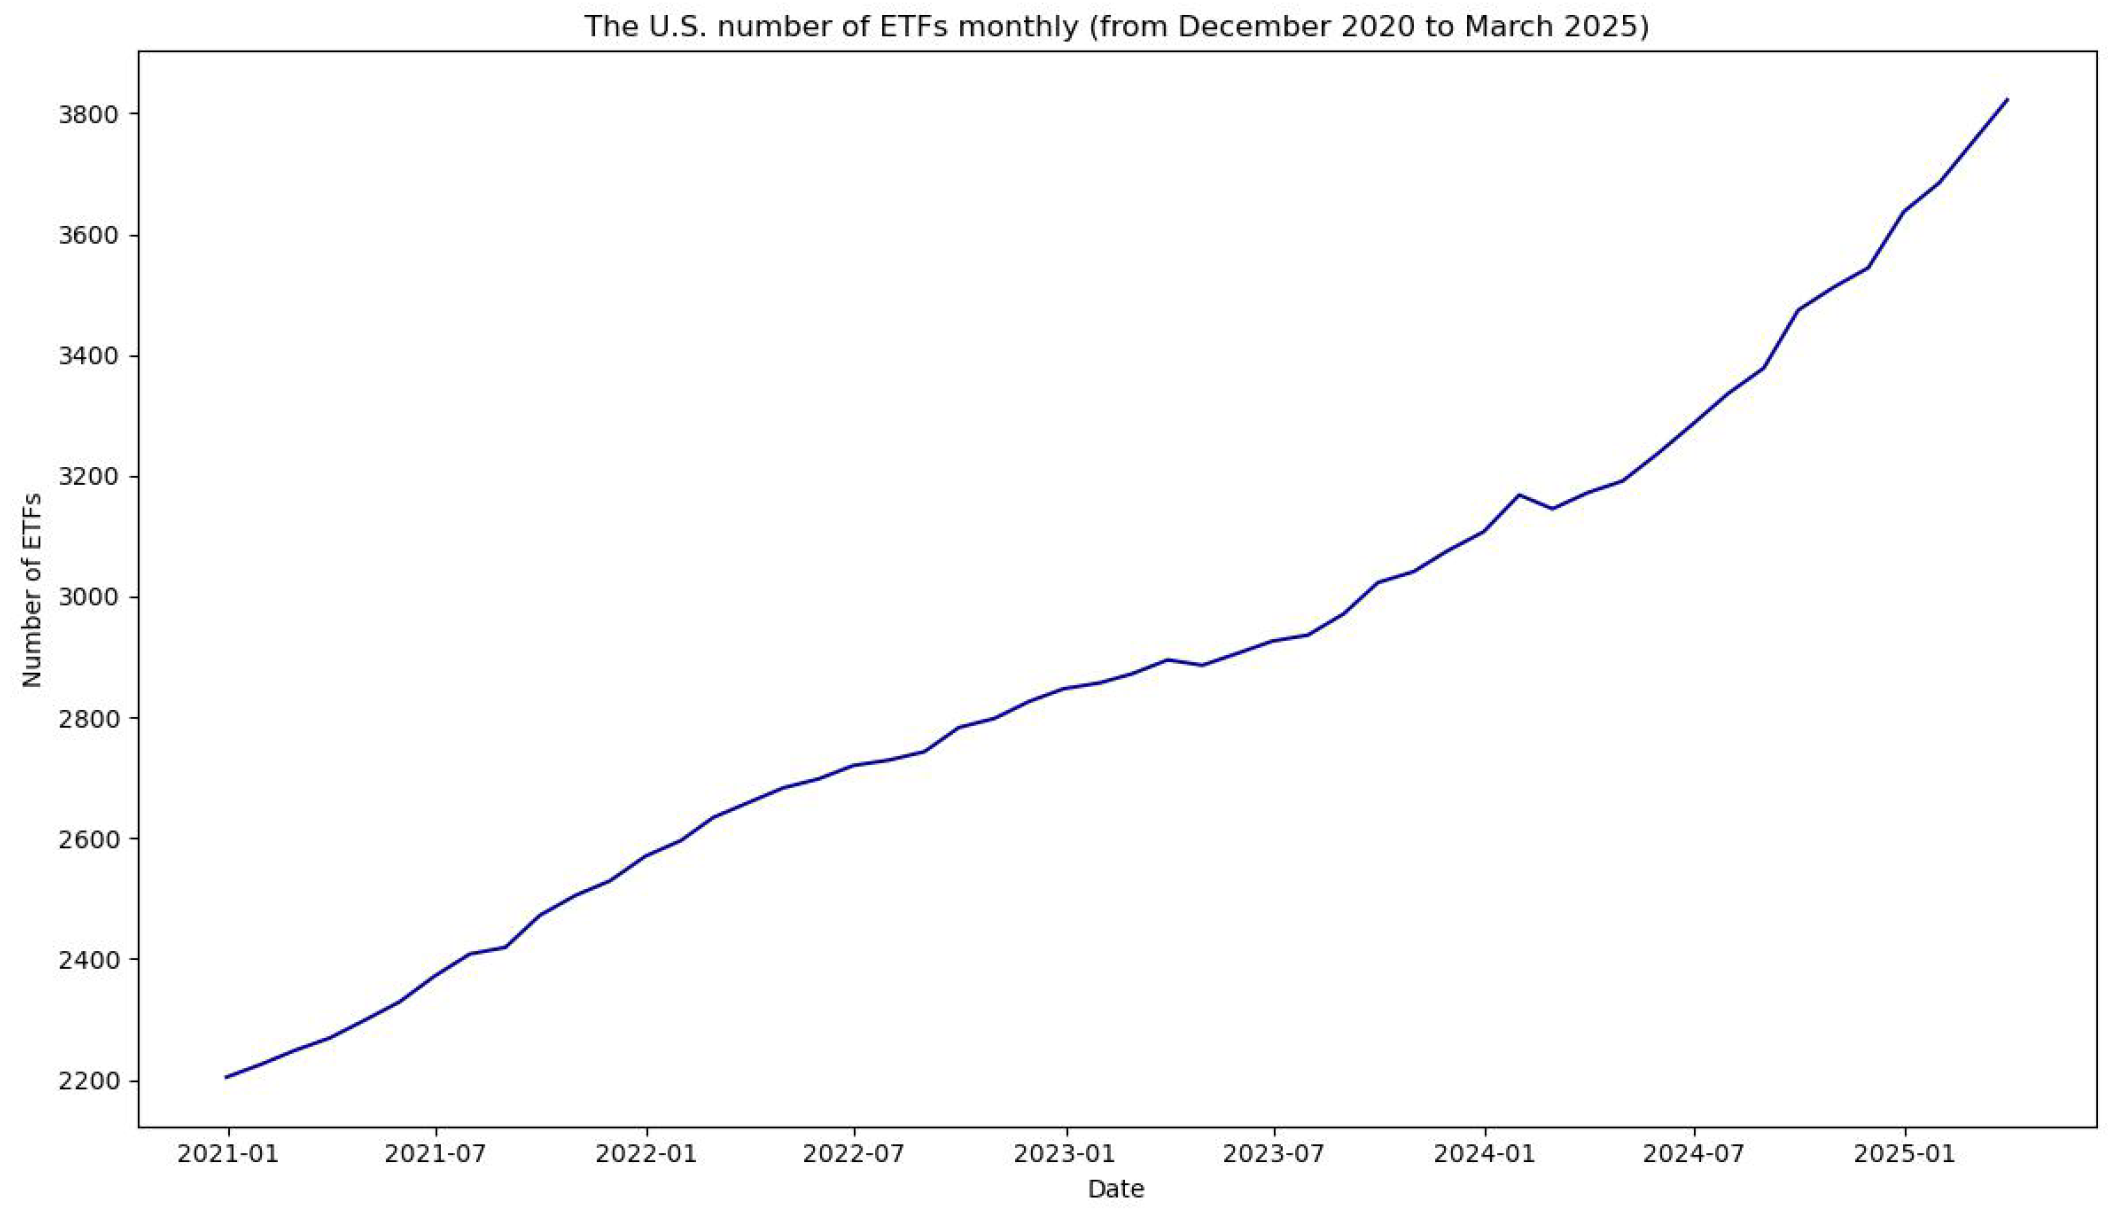
In this research, U.S. ETFs are investigated. The list of all U.S. ETFs traded in the USA that are currently tagged by the ETF Database is available from the (VettaFi 2025) website. However, the list may not contain newly issued ETFs, since the number of U.S. ETFs is still growing. Figure 1 visualizes the rapid growth in the number of the ETFs om the U.S. financial market during the period from 31 December 2020 (2204 ETFs) to 31 March 2025 (3822 ETFs) based on (YCHARTS 2025).
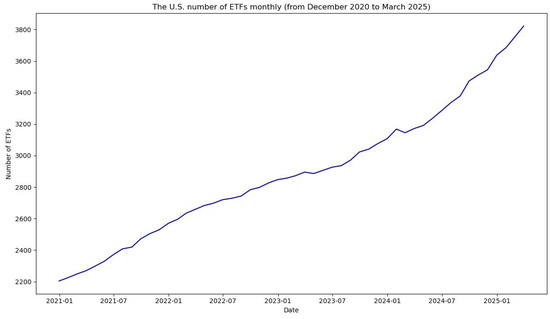
Figure 1.
The monthly number of U.S. ETFs (from December 2020 to March 2025).
3. Materials and Methods
This section provides the methodological background concerning the ternary symbolic encoding procedure that incorporates volatility estimates. Moreover, symbol-sequence histograms and symbol-sequence statistics are described in detail. Furthermore, on the basis of the existing literature, the modified Shannon entropy approach based on symbol-sequence histograms is presented.
3.1. Ternary Discretization Including Volatility Estimates
In this study, exchange-traded fund (ETF) time series are investigated. Returns of the ETFs are computed as daily logarithmic rates of return:
where is the closing price of the particular ETF on day t.
The ternary discretization of the ETF return time series into sequences of symbols () is performed with the use of the encoding procedure with two thresholds, as introduced in (Olbrys 2024b). The ternary alphabet () is used. Empirical comparative experiments presented in (Olbrys 2024b) confirmed that the ternary discretization including volatility estimates is especially useful in assessing information content of financial time series, since it enables investors to detect extreme changes in returns, specifically within turbulent periods. Based on (Olbrys 2024b), the encoding procedure is defined as follows:
Definition 1.
A sequence () of symbols is defined according to the following:
where is the mean of returns, σ is the standard deviation of returns, and and are the thresholds of the return time series.
Direct identification of symbolic dynamic patterns in a particular time series includes two steps. The first step comprises ternary discretization based on Definition 1. The second step provides the proposition of possible symbol sequences, and each sequence is represented in terms of a unique code given by a natural number.
Table 1 reports the assigned codes of all possible sequences in the case of the ternary alphabet () and the length of a code sequence ( natural numbers). Obviously, the order of sequences and the coding of natural numbers could be different and chosen arbitrary (see, e.g., (Olbrys 2024b; Olbryś and Komar 2023)). Additionally, to better justify the choice of the proper STSA method, Appendix B describes some robustness tests concerning several alternative encoding procedures that have been investigated and compared in the literature.

Table 1.
The codes of all possible sequences (words) for the ternary alphabet () and .
Based on (Olbryś 2025), in this research, the most frequently observed sequence (1, 1, 1) is the first, which determines the symbol-sequence histogram charts.
3.2. Symbol-Sequence Histograms and Related Statistics
The structure of patterns in real data can be described by the relative frequency of each possible k-length symbol sequence. The observed dynamics can be visualized by a k histogram of relative frequencies. The empirical distribution presented in such a histogram allows for comparison of coded sequences. On the basis of the literature, visualization of the frequencies with histograms provides a suitable way of observing possible patterns in time series (see, e.g., (Brida and Punzo 2003; Daw et al. 2003; Olbryś 2025; Olbryś and Komar 2023)).
Measuring the similarity—or distance—between two histograms is an important issue in pattern recognition and classification. Hence, several measures for calculating the distance between two histograms have been proposed and used in the literature in various applications (see, e.g., (Brunelli and Mich 2001; Cha and Srihari 2002)).
A widely used family of metrics defined on corresponding vector spaces is the family described by Equation (3):
where and are vector spaces.
Let be the number of possible symbols and be the length of a code sequence. Hence, there are paths with k symbols that occur in the particular symbolic sequence. In a such case, a histogram is treated as a -dimensional vector; therefore, standard vector metrics can be used as distances between two histograms. In this research, two of the most used distance metrics belonging to the family are employed: (1) the city-block (Manhattan) distance (-norm) and (2) the Euclidean distance (-norm).
The city-block (Manhattan) distance is defined by the following Equation (4):
where and are the empirical frequencies of individual sequences for the sequence codes (i), given k histograms X and Y.
The Euclidean distance is defined by Equation (5):
where the notation is the same as in Equation (4).
Both the Manhattan and Euclidean norms work like metrics in the space of all possible sequences (words), providing measures of the distance between different k histograms. Greater distances indicate that the dynamics in the data are increasingly different (Olbrys 2024b).
3.3. Modified Shannon Entropy Based on Symbol-Sequence Histograms
Shannon information entropy (Shannon 1948) quantifies the expected value of information contained in a discrete distribution. Shannon entropy of the k-th order (Definition 2) is an information indicator for symbol-sequence frequencies.
Definition 2.
Shannon entropy of the k-th order () is defined as follows:
where is the probability of finding the i-th sequence of length k.
The probability is approximated by the number of times the i-th sequence is found in the original symbolic string divided by the number of all non-zero sequences of length k. To ensure consistency with the existing literature, in this research, we follow (Brida and Punzo 2003) and utilize the definition of modified Shannon entropy (), which is just a normalized form of Shannon entropy ().
Definition 3.
Modified (normalized) Shannon entropy () based on the symbolic representation of time series is defined as follows:
where N is the total number of observed sequences of length k with non-zero frequency, i is the index of a sequence, and is the probability of finding the i-th sequence of length k. It is assumed that .
4. Comparative Empirical Experiments
This section describes the database and presents our comparative empirical results within the whole sample period and two sub-samples: before and after the 2025 Donald Trump Presidential Inauguration.
4.1. Real Data Description
The data set includes daily observations for twenty ETFs belonging to the list of Top 25 U.S. ETFs (MarketWatch 2025) (this list is updated daily). The data were obtained free of charge from the Stooq website (https://stooq.pl, accessed on 25 April 2025). Table 2 presents the list of the twenty selected ETFs (traded on the NYSE or NASDAQ markets) investigated in this study. The ETFs are presented in alphabetical order.
Table 2.
List of 20 selected U.S. ETFs.
Calculations were conducted with a dedicated program that was created with the use of Jupyter Notebook, an interactive computing platform based on the Python 3.13.2 language version.
The whole sample covers the period from 21 October 2024 to 21 April 2025 (124 trading days). Since the Presidential Inauguration of Donald Trump took place on 20 January 2025, the following two sub-samples of equal length are investigated:
- The period before the 2025 U.S. Presidential Inauguration from 21 October 2024 to 19 January 2025 (62 trading days);
- The period after the 2025 U.S. Presidential Inauguration from 20 January 2025 to 21 April 2025 (62 trading days).
The date of the Presidential Inauguration is crucial, since at that point, Donald Trump legally assumed the role of president and started to make important decisions.
Table 3 includes a brief overview of the information about the analyzed ETFs and the summarized statistics for daily logarithmic returns within the whole sample period and two investigated sub-periods. The ETFs are labeled with ticker symbols.
Table 3.
Basic statistics for ETF daily logarithmic returns within the whole sample and two sub-samples.
In general, the mean values are almost equal to zero within the whole sample and both sub-samples for all investigated ETFs. The standard deviation values are slightly higher within the period after the Presidential Inauguration and confirm the rise in volatility during this turbulent period. This evidence is in accordance with our expectations. In summary, the basic statistical results are consistent for all analyzed ETFs.
4.2. Comparative Statistical Analysis of Symbol-Sequence Histograms: The Periods Before and After the 2025 U.S. Presidential Inauguration
This section presents and discusses our empirical findings concerning symbol-sequence histograms and the related statistics that are described in Section 3.2. As mentioned previously, the dynamics and the structure of patterns in real data can be visualize by symbol-sequence histograms of relative frequencies, and such visualization provides a convenient way of observing possible patterns and the level of regularity in time series. Specifically, a symbol-sequence histogram documents the frequency of a particular sequence and the number of sequences with non-zero frequency.
As emphasized in Section 3.3, the number of sequences with non-zero frequency is especially important in the modified Shannon entropy estimation based on Definition 3. Table 4 reports these numbers within the periods before and after the 2025 U.S. Presidential Inauguration. The total number of possible sequences is equal to 27 (based on Table 1).
Table 4.
The number of sequences with non-zero frequency within the periods before and after the 2025 U.S. Presidential Inauguration.
Based on Table 4, one can observe that the case of the AGG fund is especially interesting and worth a comment, since the number of sequences with non-zero frequency within the period before the 2025 U.S. Presidential Inauguration is the lowest (10/27), while the number of sequences with non-zero frequency within the period after the 2025 U.S. Presidential Inauguration is the highest (17/27). Figure 2 presents symbol-sequence histograms for the AGG fund within the two sub-periods.
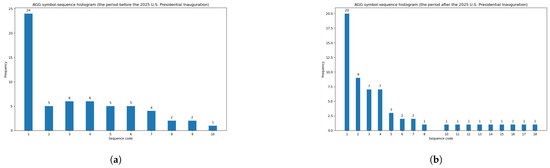
Figure 2.
Symbol-sequence histograms for the AGG fund (based on Table 4). (a) The minimal number of sequences with non-zero frequency (10/27) within the period before the 2025 U.S. Presidential Inauguration. (b) The maximal number of sequences with non-zero frequency (17/27) within the period after the 2025 U.S. Presidential Inauguration.
Table 5 contains the number of the most frequently observed sequence, i.e., No. 1 (1, 1, 1) (see Table 1). This sequence means that three successive daily logarithmic returns are not extremely low or high but lie between thresholds (see Definition 1). Based on Table 3, the total number of sequences of length within the whole sample period is equal to 122, while the total number of sequences within both sub-periods is equal to 60. In summary, the empirical findings presented in Table 5 indicate that the (1, 1, 1) sequence dominated decidedly and that the level of regularity in daily logarithmic returns was high for all ETFs. Moreover, the evidence shows that the level of regularity substantially increased during the period after the 2025 U.S. Presidential Inauguration for the vast majority of the ETFs.
Table 5.
The number of (1, 1, 1) sequences within the whole sample and the periods before and after the 2025 U.S. Presidential Inauguration.
As emphasized in Section 3.2, a formal comparison of symbol-sequence histograms can be conducted with the use of classical distance metrics. Table 6 reports the summarized statistical results of the differences between the two histograms during the periods before and after the 2025 U.S. Presidential Inauguration. A shorter distance confirms that symbol-sequence histograms are similar and that the change in dynamics of daily logarithmic rates of return is smaller.
Table 6.
The summarized results of the distances between the two histograms within the periods before and after the 2025 U.S. Presidential Inauguration.
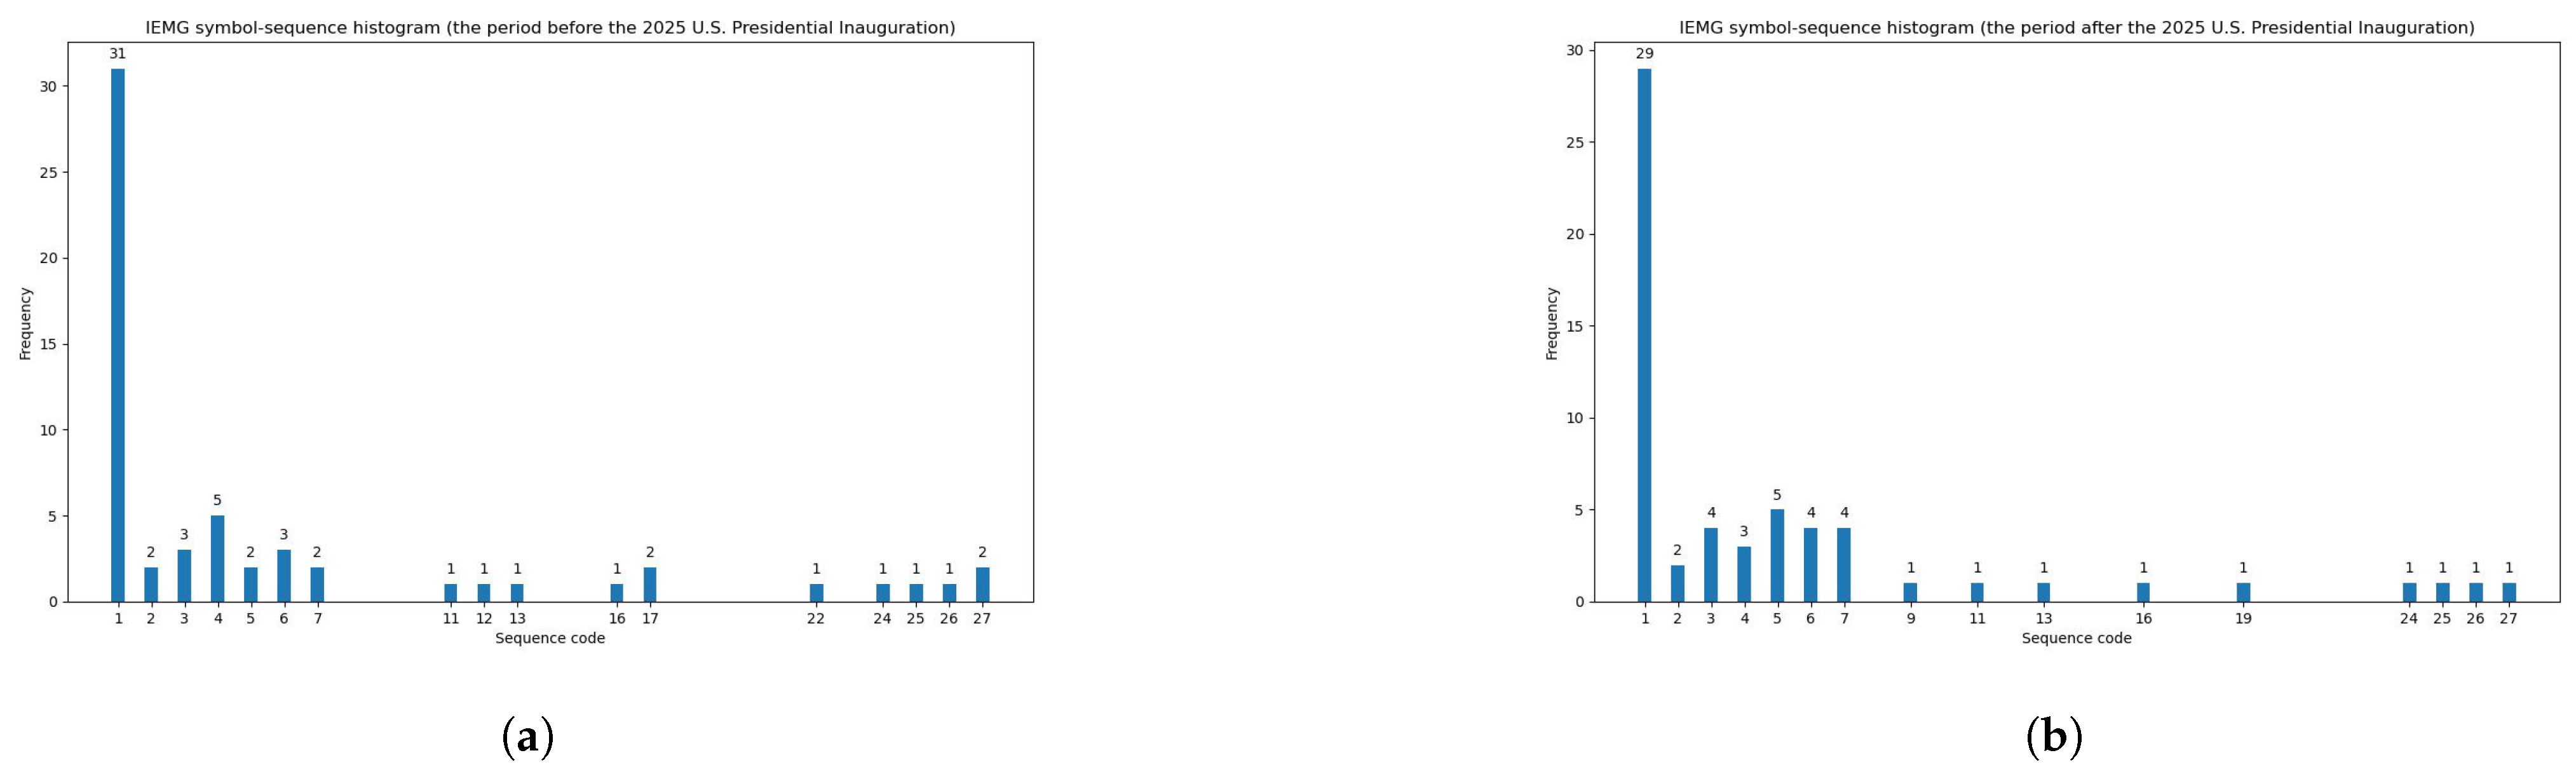
In light of the results presented in Table 6, one can conclude that the most similar symbol-sequence histograms occur for the IEMG fund, since the evidence is that the values of both Euclidean and Manhattan metrics are minimal in this case. Figure 3 demonstrates a high level of similarity between the two histograms for the IEMG fund.

Figure 3.
The most similar symbol-sequence histograms with minimal values of both Euclidean and Manhattan distances for the IEMG fund (based on Table 6). (a) The IEMG symbol-sequence histogram within the period before the 2025 U.S. Presidential Inauguration. (b) The IEMG symbol-sequence histogram within the period after the 2025 U.S. Presidential Inauguration.
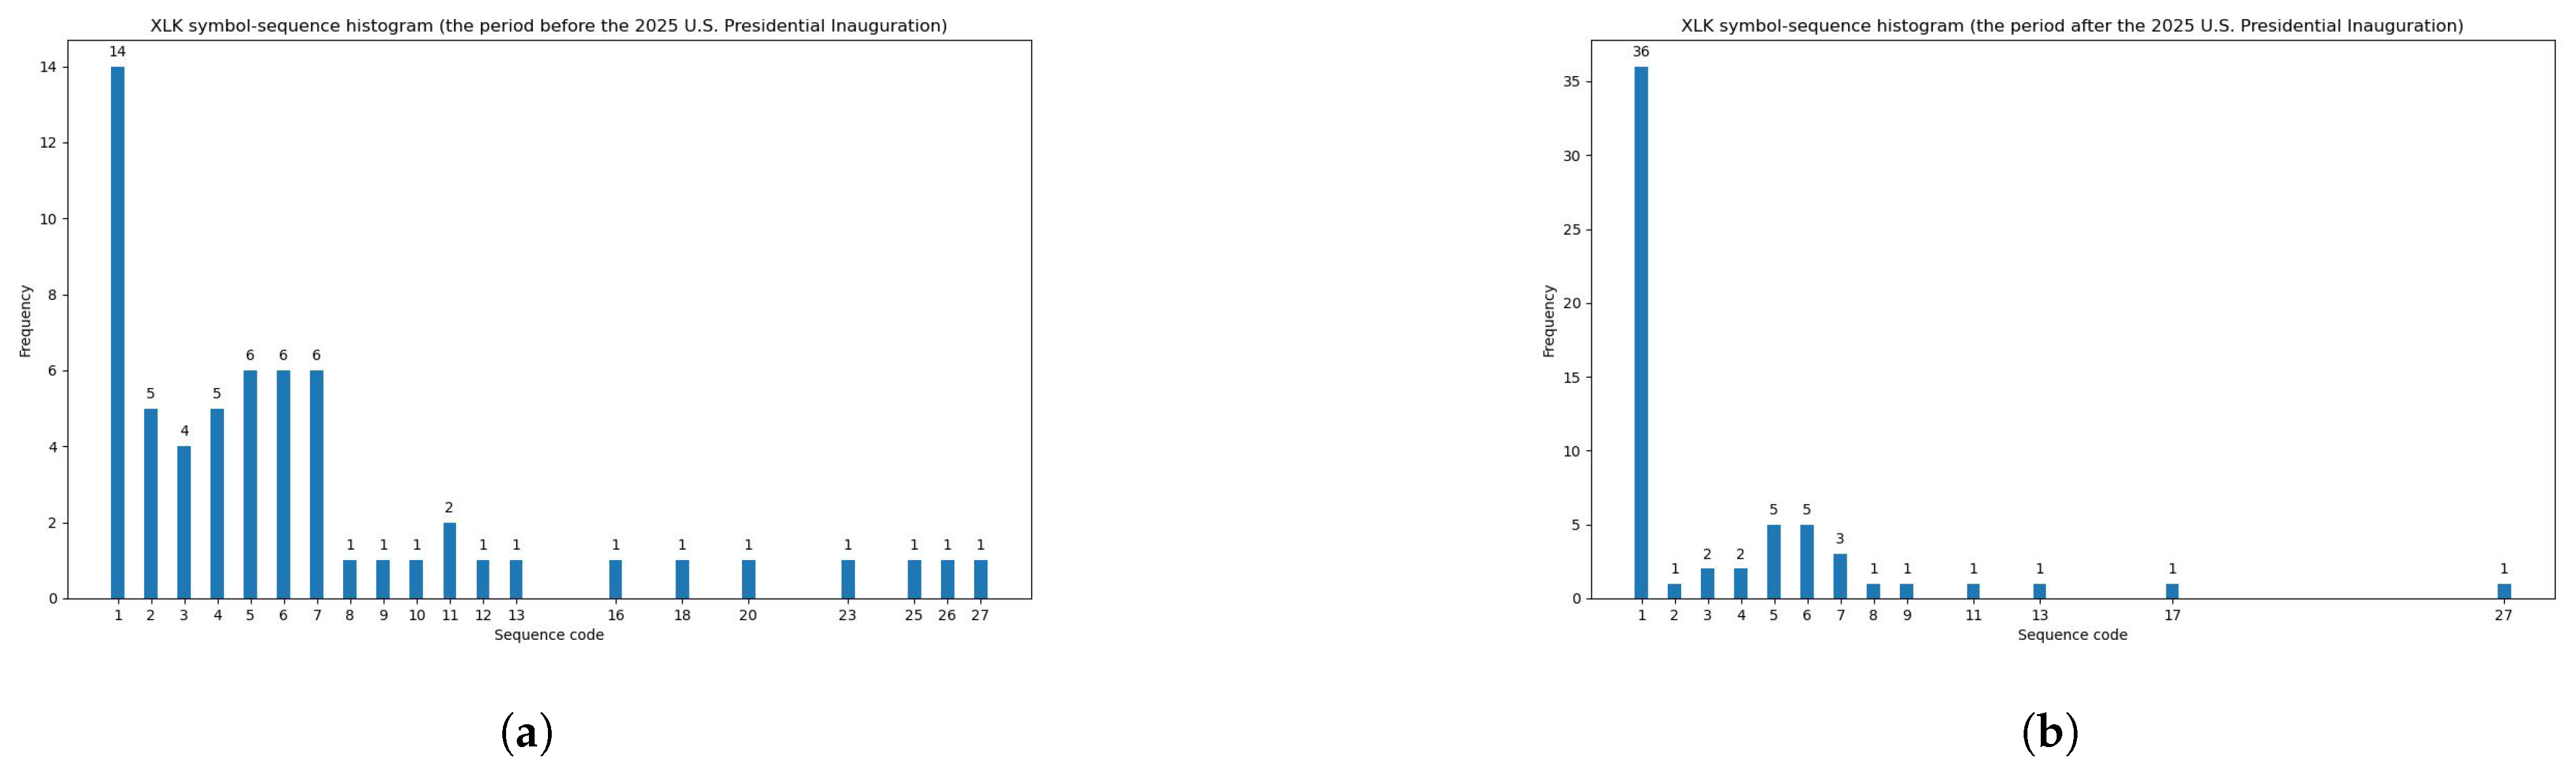
Conversely, on the basis of the results presented in Table 6, the least similar symbol-sequence histograms with the maximal value of the Euclidean distance (equal to 23.11) occur in the case of the XLK fund. The subsequent Figure 4 visualizes a low degree of similarity between these two histograms for the XLK fund.
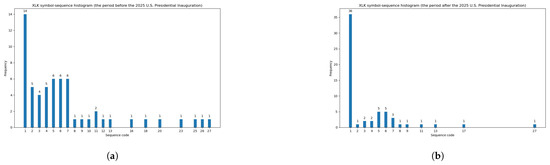
Figure 4.
The least similar symbol-sequence histograms with the maximal value of the Euclidean distance for the XLK fund (based on Table 6). (a) The XLK symbol-sequence histogram within the period before the 2025 U.S. Presidential Inauguration. (b) The XLK symbol-sequence histogram within the period after the 2025 U.S. Presidential Inauguration.
Similarly, based on Table 6, one can observe the least similar symbol-sequence histograms with the maximal value of the Manhattan distance (equal to 54) in the case of the RSP fund. Figure 5 documents a low level of similarity between the two histograms for the RSP fund within the two sub-periods.
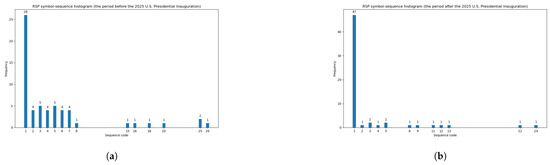
Figure 5.
The least similar symbol-sequence histograms with the maximal value of the Manhattan distance for the RSP fund (based on Table 6). (a) The RSP symbol-sequence histogram within the period before the 2025 U.S. Presidential Inauguration. (b) The RSP symbol-sequence histogram within the period after the 2025 U.S. Presidential Inauguration.
4.3. Comparative Empirical Results of Informational ETF Market Efficiency: The Periods Before and After the 2025 U.S. Presidential Inauguration
In this subsection, the comparative empirical results of the informational efficiency of the U.S. ETF market within the periods before and after the 2025 Donald Trump Presidential Inauguration are presented and discussed.
Table 7 documents the results for the modified Shannon entropy of the ETFs’ daily logarithmic returns based on the STSA method expressed by Definition 1, where and denote the thresholds of the return time series.
Table 7.
The modified Shannon entropy of the ETFs’ daily logarithmic returns based on the STSA method given by Definition 1.
The column entitled ’Change in Entropy’ contains changes in entropy between the periods before and after the Donald Trump Inauguration. Up arrows illustrate an entropy increase, while down arrows visualize an entropy decrease during the period after the Inauguration. The results are unambiguous, since the modified Shannon entropy substantially decreased for the vast majority of the ETFs. Entropy increased for only two funds, i.e., BND and IEMG. In other words, one can conclude that the 2025 Donald Trump Presidential Inauguration substantially affected the informational efficiency of the U.S. ETF market, as measured by entropy. Therefore, empirical findings confirm the research hypothesis that was formulated in Section 1.
It is important to emphasize that the entropy results presented in Table 7 are strictly connected to the symbol-sequence histograms and are directly observable in the charts.
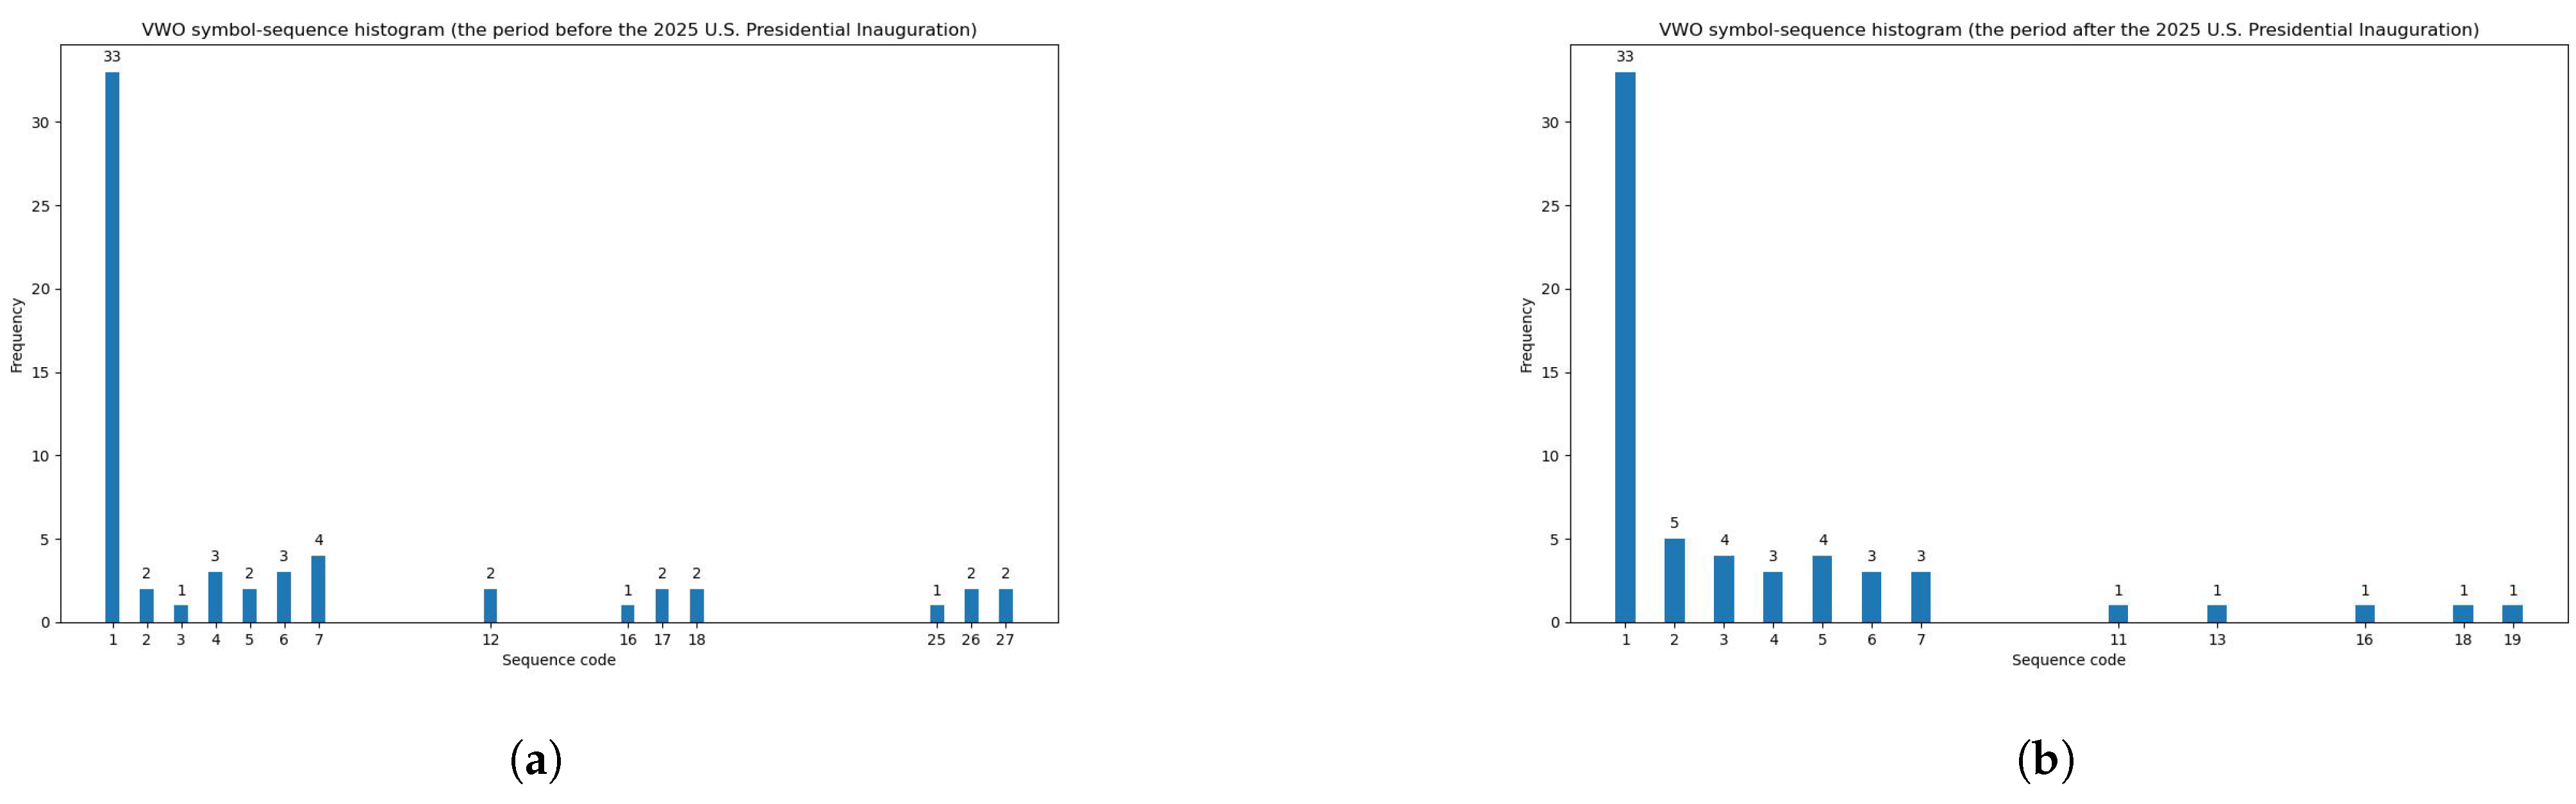
For instance, Table 7 documents the maximal entropy decrease (equal to −0.351) within two sub-periods for the RSP fund. However, Figure 5 (presented in the previous section) visualizes this maximal entropy decrease in the symbol-sequence histograms and illustrates the substantial increase in the regularity of the RSP fund’s daily return time series during the period after the 2025 Donald Trump Presidential Inauguration. Furthermore, Figure 6 contains the symbol-sequence histograms that visualize the minimal entropy decrease (equal to −0.006) for the VWO fund.
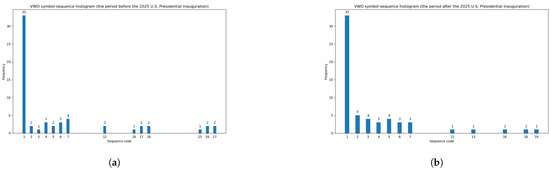
Figure 6.
Symbol-sequence histograms that visualize the minimal entropy decrease (equal to −0.006) for the VWO fund (based on Table 7). (a) The VWO symbol-sequence histogram within the period before the 2025 U.S. Presidential Inauguration. (b) The VWO symbol-sequence histogram within the period after the 2025 U.S. Presidential Inauguration.
In general, the following important numbers are visible in the charts: (1) the number of sequences with non-zero frequency within the periods before and after the 2025 Donald Trump Presidential Inauguration (reported in Table 4) and (2) the number of the most frequently observed sequence, i.e., No. 1 (1, 1, 1) (presented in Table 5).
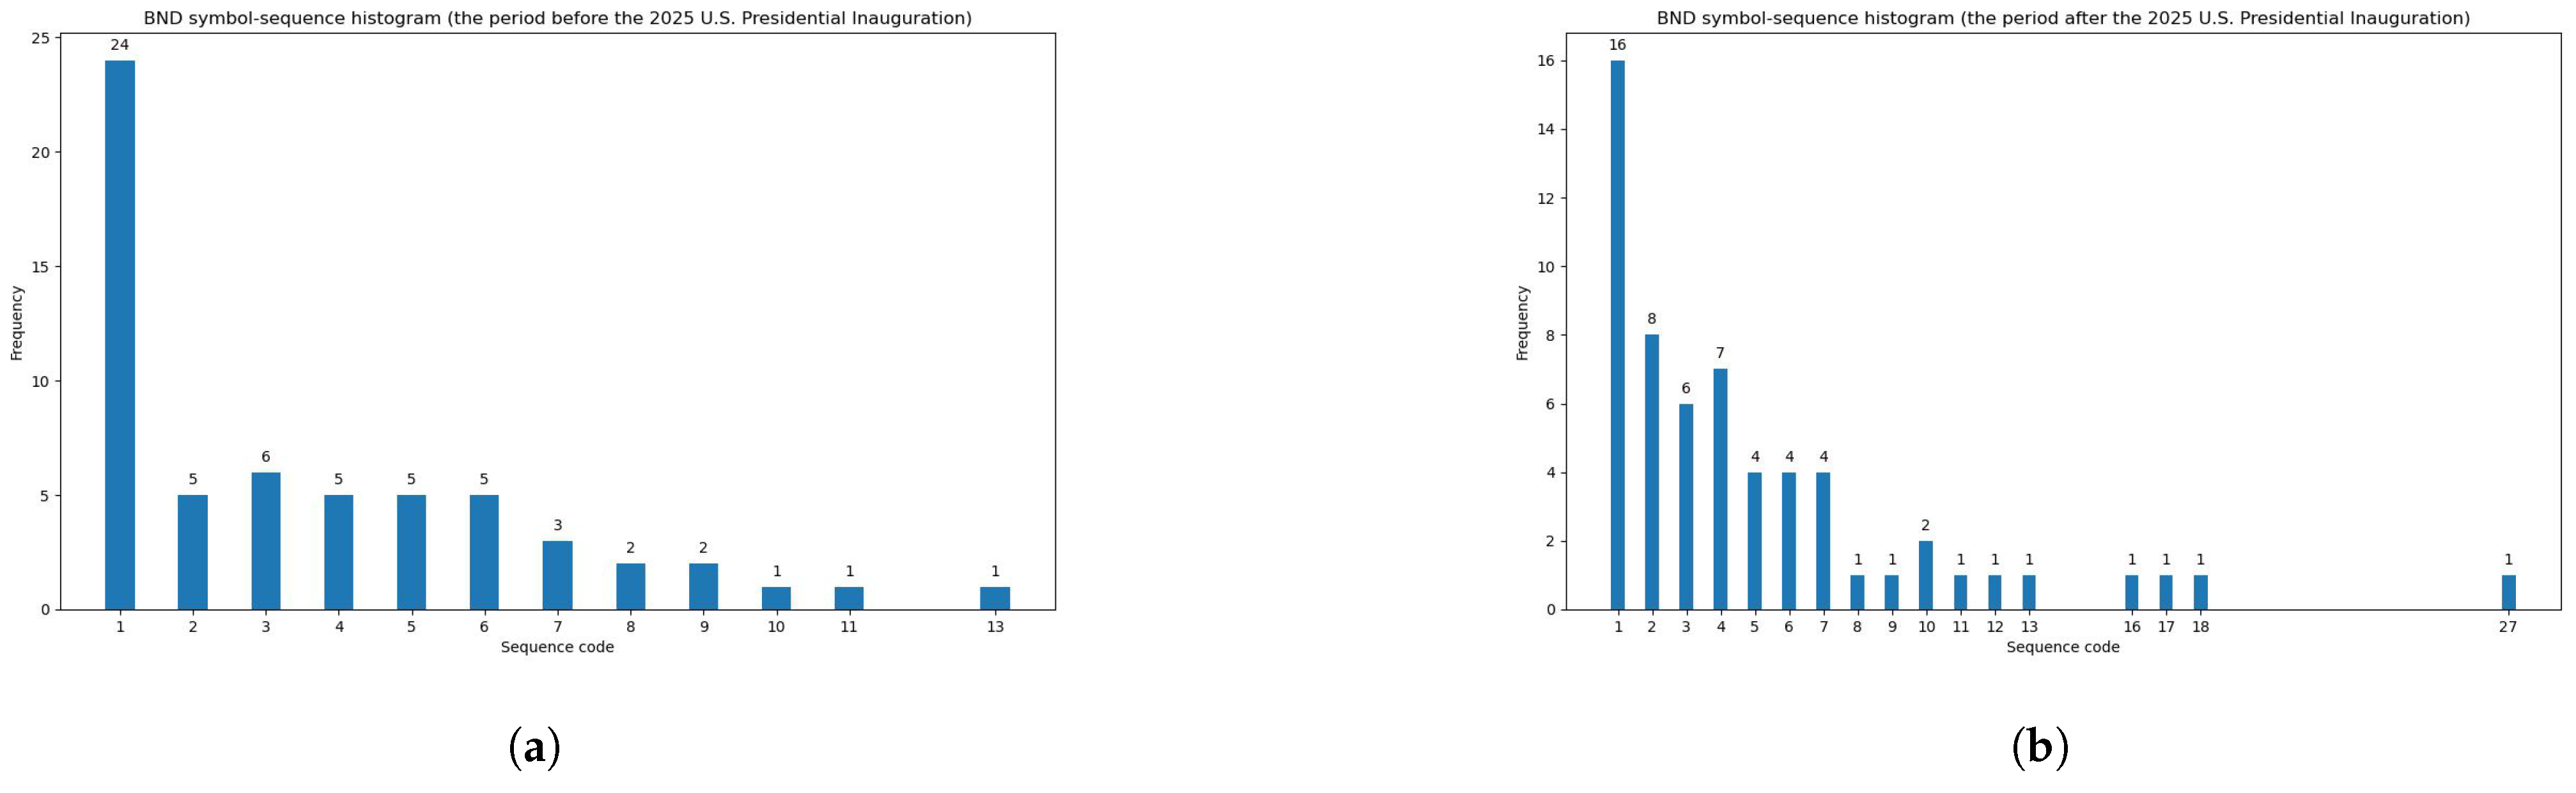
Table 7 documents the entropy increase for only two funds, i.e., BND and IEMG. Figure 7 illustrates the symbol-sequence histograms that visualize the entropy increase (equal to 0.03) for the BND fund. Figure 3 (presented in the previous section) shows the high level of similarity between two histograms, exemplifying a slight entropy increase (equal to 0.021) for the IEMG fund.

Figure 7.
Symbol-sequence histograms that visualize the entropy increase (equal to 0.03) for the BND fund (based on Table 7). (a) The BND symbol-sequence histogram within the period before the 2025 U.S. Presidential Inauguration. (b) The BND symbol-sequence histogram within the period after the 2025 U.S. Presidential Inauguration.
Moreover, selected additional histograms that exemplify relatively high negative changes in the modified Shannon entropy within the periods before and after the 2025 Donald Trump Presidential Inauguration are presented in Figure A1 (Appendix A).
5. Discussion and Conclusions
As mentioned in the Introduction (Section 1), the contribution of this study is twofold. The main methodological contribution of this study is the utilization of a new procedure (based on modified Shannon entropy) to measure the informational efficiency of the ETF market. Besides the possibility of investigating market informational efficiency within relatively short time periods, the proposed method also enables researchers to directly visualize empirical findings using symbol-sequence histograms.
The main empirical contribution of our research is the thorough investigation of the influence of the 2025 U.S. Donald Trump Presidential Inauguration on the informational efficiency of the U.S. ETF market. The proposed research hypothesis stated that the informational efficiency of the U.S. ETF market, as measured by the entropy of the funds’ daily rates of return, substantially decreased during the turbulent period after the Donald Trump Presidential Inauguration. The results of empirical experiments confirmed the research hypothesis. Consequently, we can formulate the main conclusion that the 2025 Presidential Inauguration substantially affected the informational efficiency of the U.S. ETF market, since at that point, Donald Trump started to make important economic and politically motivated decisions.
It is worth emphasizing that our research findings are consistent with the existing literature and contribute to the broad debate about various entropy-based applications, especially in finance, economics, and management studies. According to the literature, the entropy of financial return time series usually falls during extreme-event periods such as financial crises, pandemic periods, wars, etc. (e.g., Olbrys (2024a); Olbryś and Majewska (2022); Olbryś and Komar (2023); Ozkan (2021); Papla and Siedlecki (2024); Risso (2008); Saha et al. (2022); Wang and Wang (2021) and the references therein). In other words, the more frequent existence of patterns may cause a significant growth in the regularity of asset returns.
The empirical findings presented in this study certainly cannot provide definitive conclusions concerning the explanation for entropy changes. Apart from the political uncertainty around the Presidential Inauguration, there are several possible alternative explanations for this phenomenon. Undoubtedly, the relevant factors that could affect ETF market efficiency are include macroeconomic indicators (e.g., the Federal Reserve’s interest rate expectations, inflation surprises, and employment reports); quarterly earnings-season effects; and even seasonal effects represented, for instance, by end-of-year trading behavior. However, although changes in entropy cannot be solely attributed to political risk, some important and somewhat controversial decisions made by Donald Trump immediately after the inauguration certainly influenced the U.S. financial market during the period under study.
To avoid the internal inconsistency of this research, the external control variables mentioned above were not directly taken into consideration in the empirical investigation. Despite some limitations of our study, we believe that the novel empirical results presented in this paper might be interesting for both academics and investors, since the existence of regularity (in terms of sequential patterns) in financial asset return time series implies the possibility of predicting ETF returns. In light of the existing literature, entropy can be treated as a useful and successful indicator in predictive modeling. It was shown in (Billio et al. 2016) that entropy-based indicators reveal forecasting ability in the prediction of banking crises. Similar evidence in the context of systemic risk was presented in (Gradojevic and Caric 2017), the authors of which also suggested that, although entropy and volatility can be treated as related measures of market uncertainty, entropy seems to be more successful in market forecasting.
Moreover, the entropy-based procedure proposed in this paper might be involved in automatic systems that support investment strategies and decisions. For instance, the authors of (Gencay and Gradojevic 2017) suggested the incorporation of entropy into technical analysis as a market sentiment indicator, since it can be useful in predicting financial market expectations.
Given the importance of the topic concerning entropy-based applications in finance, a promising avenue for further research could be an entropy-based investigation of dynamic informational content of global risk indexes such as the VIX (CBOE Volatility Index) or GPR (Geopolitical Risk Index) in the context of the influence of various turbulent and extreme-event periods. The aforementioned indexes are known to be extremely sensitive to information inflow.
Funding
This contribution was supported by grant WZ/WI-IIT/2/2025 from the Bialystok University of Technology and funded by the Ministry of Science and Higher Education.
Institutional Review Board Statement
Not applicable.
Informed Consent Statement
Not applicable.
Data Availability Statement
The data were obtained free of charge from the Stooq website (https://stooq.pl, accessed on 25 April 2025).
Conflicts of Interest
The author declares no conflicts of interest.
Abbreviations
The following abbreviations are used in this manuscript:
| ETF | Exchange-Traded Fund |
| STSA | Symbolic Time-Series Analysis |
| NYSE | New York Stock Exchange |
| NASDAQ | National Association of Securities Dealers Automated Quotations |
Appendix A. Symbol-Sequence Histograms: Additional Comparative Results
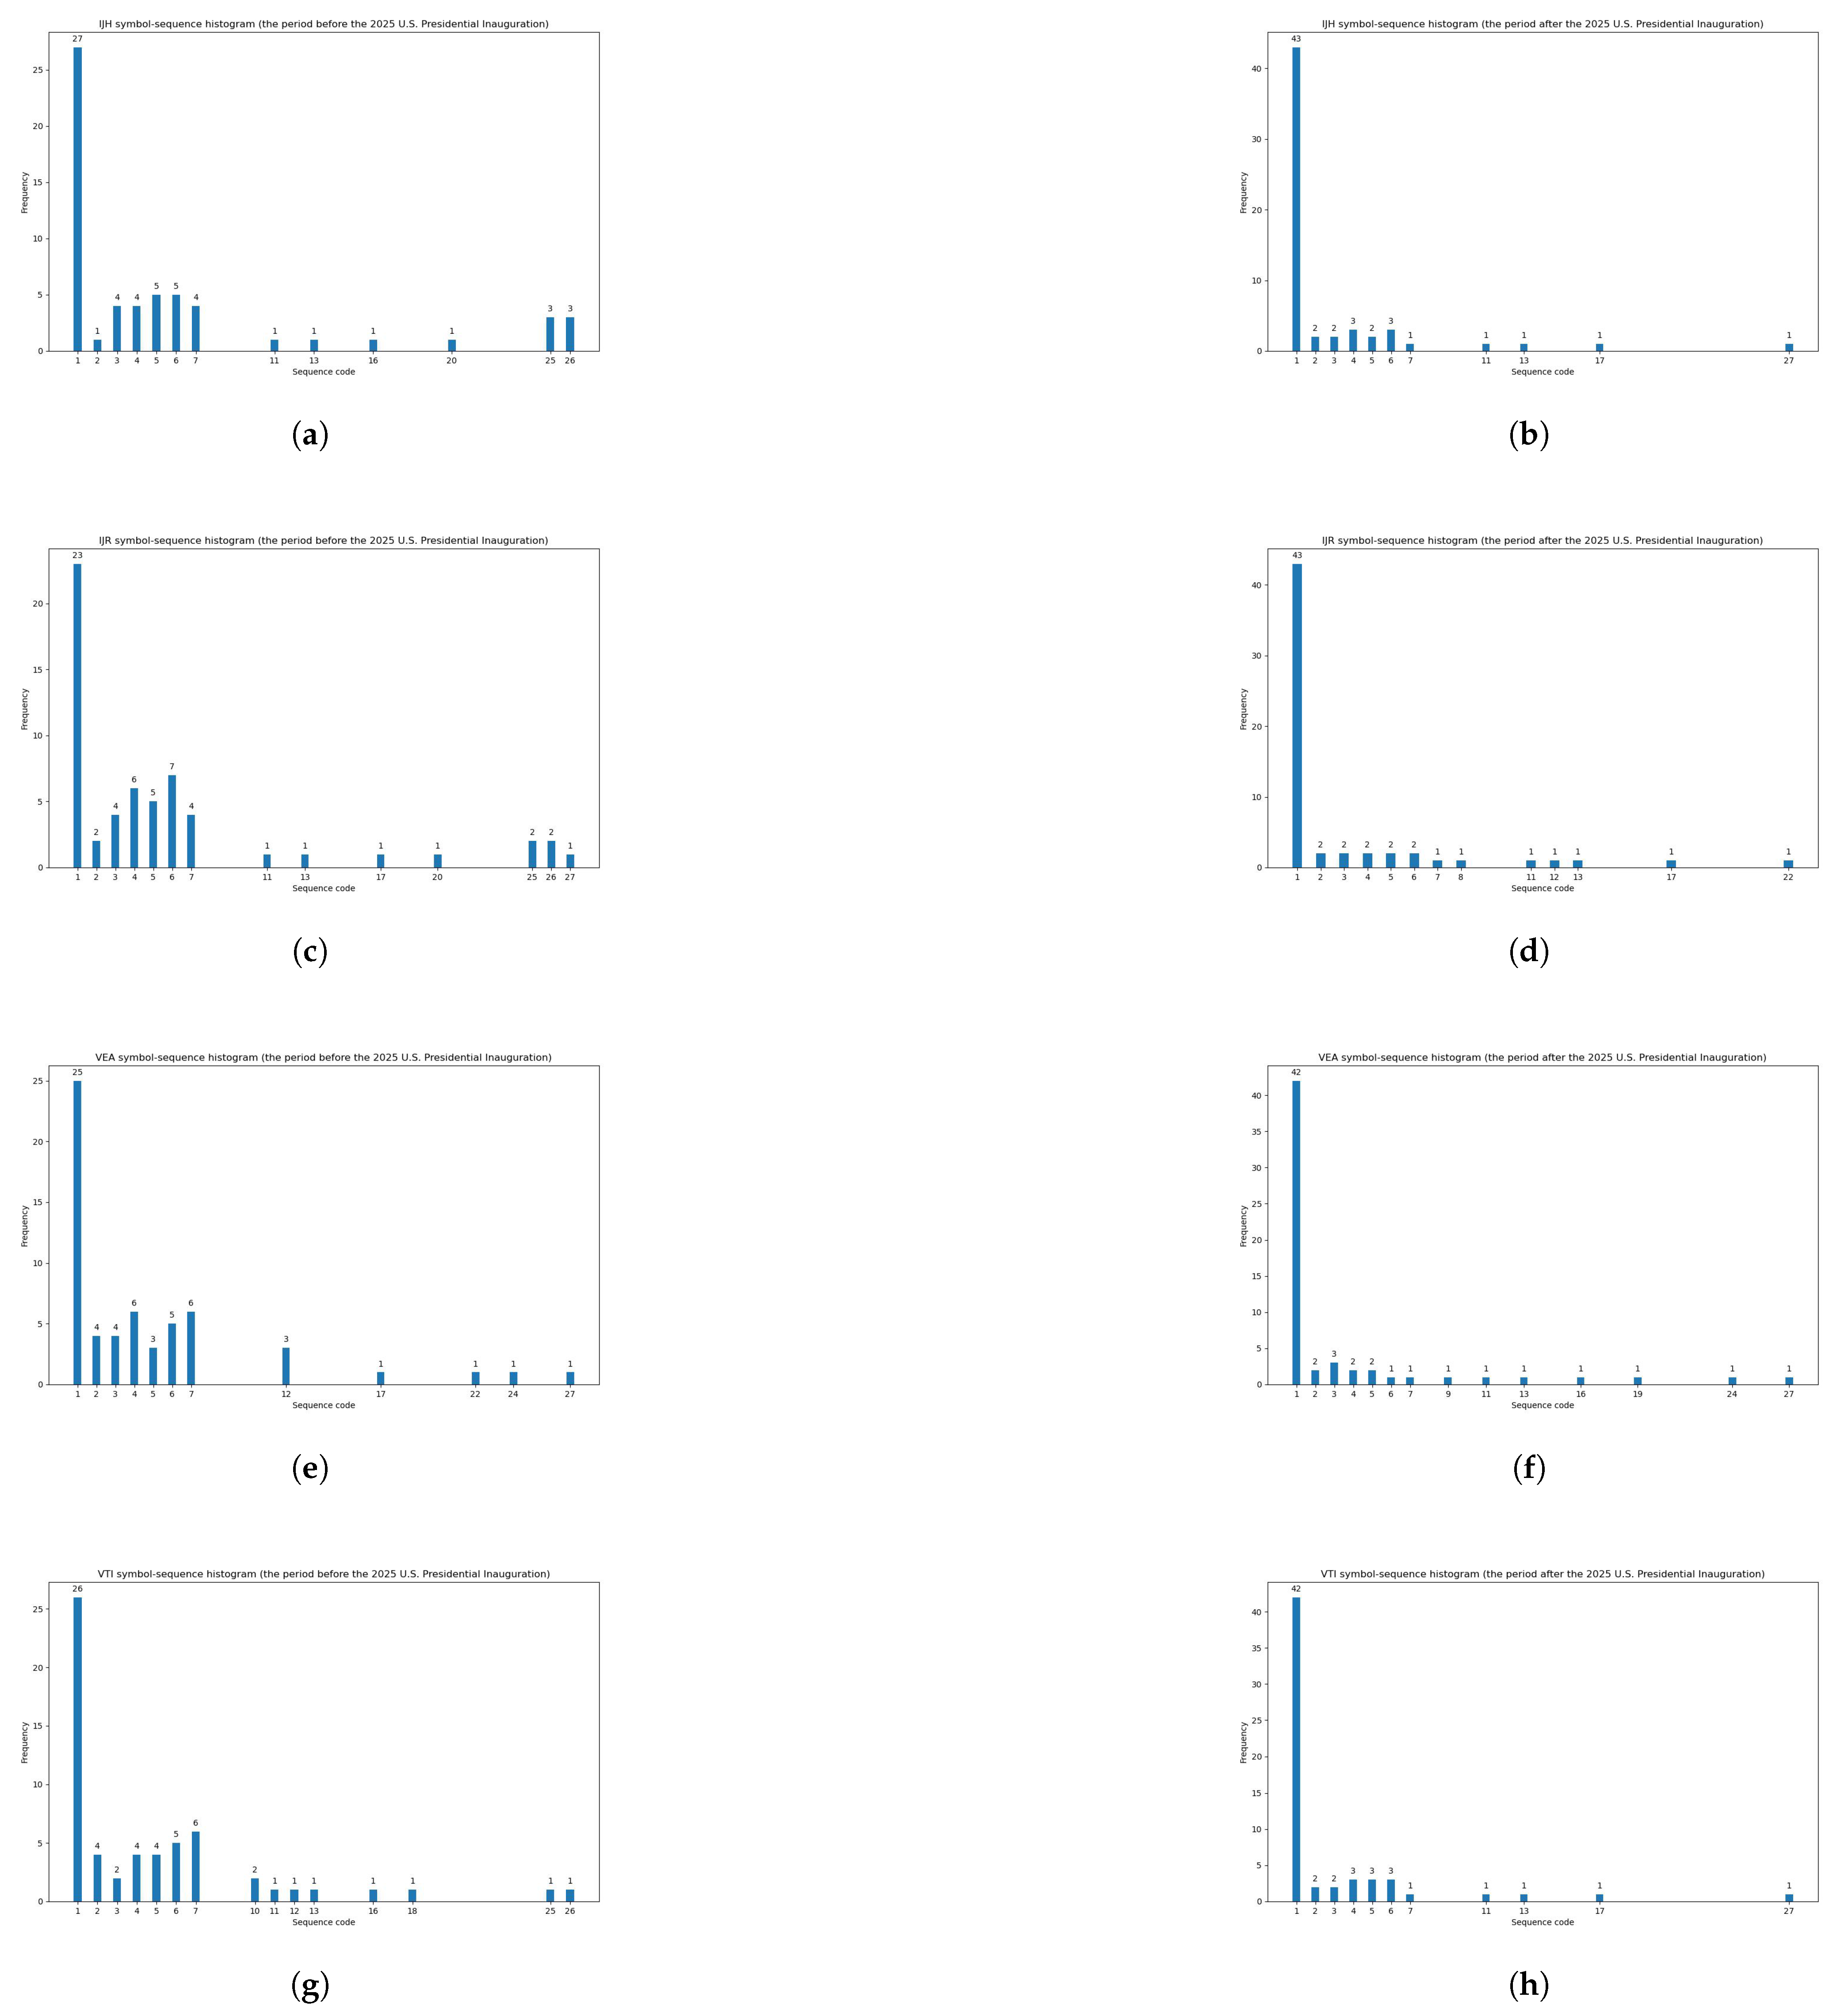
Figure A1 exemplifies the symbol-sequence histograms for four ETFs with relatively high negative changes in the modified Shannon entropy within the periods before and after the 2025 Donald Trump Presidential Inauguration based on Table 7. These ETFs are IJH (the change in entropy is equal to −0.254), IJR (the change in entropy is equal to −0.295), VEA (the change in entropy is equal to −0.278), and VTI (the change in entropy is equal to −0.227).
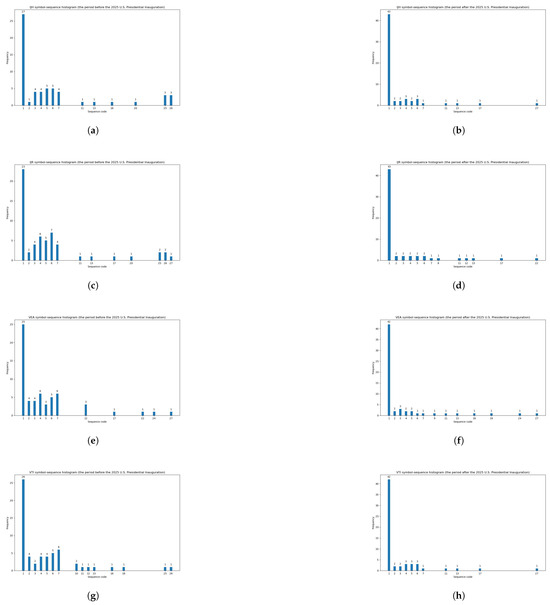
Figure A1.
Symbol-sequence histograms that visualize negative changes in entropy for selected ETFs (based on Table 7). (a) IJH histogram for the period before the Presidential Inauguration. (b) IJH histogram for the period after the Presidential Inauguration. (c) IJR histogram for the period before the Presidential Inauguration. (d) IJR histogram for the period after the Presidential Inauguration. (e) VEA histogram for the period before the Presidential Inauguration. (f) VEA histogram for the period after the Presidential Inauguration. (g) VTI histogram for the period before the 2025 U.S. Presidential Inauguration. (h) VTI histogram for the period after the Presidential Inauguration.
Appendix B. Comment on Robustness Checks of the STSA Methods
Comprehensive robustness analyses of a battery of the STSA methods with various thresholds are presented in (Olbryś and Komar 2023). In the aforementioned research, six alternative symbolic encoding procedures, i.e., three binary and three ternary discretization schemes, were thoroughly investigated and compared. The Shannon entropy results based on these six STSA methods, in the context of market informational (in)efficiency, were analyzed as well. Specifically, the investigated binary discretization procedures comprise methods with zero, mean, or median as the critical points (thresholds). The ternary discretization procedures include three methods with different sample quantiles as the thresholds. Moreover, various code-sequence lengths (e.g., k = 3, k = 4, and k = 5) were explored. However, the obtained results confirm that the choice of sequence length (k) is a minor issue, since the findings for different k values are very similar. Unfortunately, visualization with histograms in the case of k = 4 or k = 5 is much more difficult, as the total number of sequences is large. To check the robustness of the results to sample choice, all calculations were conducted within two turbulent periods: the periods of the COVID-pandemic outbreak and the war in Ukraine. In summary, the experimental research results indicate that ternary discretization procedures work better than the binary procedures, and the method with two 5% and 95% quantiles as the thresholds seems to be the most precise and effective in locating dynamic patterns in financial time series.
Furthermore, (Olbrys 2024b) introduced a novel entropy-based approach to market (in)efficiency assessment that uses the STSA procedure, including volatility estimates. The author compares the proposed new method with the scheme utilizing two 5% and 95% quantiles as the thresholds. The results of empirical experiments confirm that the novel procedure can be recommended, since it outperforms the method with sample quantiles. This was the main motivation for the usage of Definition 1 in this study.
References
- Agapova, Anna. 2011. Conventional mutual index funds versus exchange traded funds. Journal of Financial Markets 14: 323–43. [Google Scholar] [CrossRef]
- Ahn, Kwangwon, Daeyong Lee, Sungbin Sohn, and Biao Yang. 2019. Stock market uncertainty and economic fundamentals: An entropy-based approach. Quantitative Finance 19: 1151–63. [Google Scholar] [CrossRef]
- Antoniewicz, Rachelle, and Jane Heinrichs. 2019. Understanding exchange-traded funds: How ETFs work. In ICI Research Perspective. Washington, DC: ICI Investment Company Institute, vol. 20, pp. 1–40. [Google Scholar]
- Bekaert, Geert, Campbell R. Harvey, Christian T. Lundblad, and Stephan Siegel. 2016. Political risk and international valuation. Journal of Corporate Finance 37: 1–23. [Google Scholar] [CrossRef]
- Ben-David, Itzhak, Francesco Franzoni, and Rabin Moussawi. 2018. Do ETFs increase volatility? Journal of Finance 73: 2471–535. [Google Scholar] [CrossRef]
- Billio, Monica, Roberto Casarin, Michele Costola, and Andrea Pasqualini. 2016. An entropy-based early warning indicator for systematic risk. Journal of International Financial Markets, Institution & Money 45: 42–59. [Google Scholar]
- Brida, Juan G., and Lionello F. Punzo. 2003. Symbolic time series analysis and dynamic regimes. Structural Change and Economic Dynamics 14: 159–83. [Google Scholar] [CrossRef]
- Brouty, Xavier, and Matthieu Garcin. 2023. A statistical test of market efficiency based on information theory. Quantitative Finance 23: 1003–18. [Google Scholar] [CrossRef]
- Brunelli, Roberto, and Ornella Mich. 2001. Histograms analysis for image retrieval. Pattern Recognition 34: 1625–37. [Google Scholar] [CrossRef]
- Calcagnile, Lucio M., Fulvio Corsi, and Stefano Marmi. 2020. Entropy and efficiency of the ETF market. Computational Economics 55: 143–84. [Google Scholar] [CrossRef]
- Caldara, Dario, and Matteo Iacoviello. 2022. Measuring geopolitical risk. American Economic Review 112: 1194–225. [Google Scholar] [CrossRef]
- Campbell, John Y., Andrew W. Lo, and A. Craig MacKinlay. 1997. The Econometrics of Financial Markets. Princeton: Princeton University Press. [Google Scholar]
- Cha, Sung-Hyuk, and Sargur N. Srihari. 2002. On measuring the distance between histograms. Pattern Recognition 35: 1355–70. [Google Scholar] [CrossRef]
- Daw, Stuart, Charles E. A. Finney, and Eugene R. Tracy. 2003. A review of symbolic analysis of experimental data. Review of Scientific Instruments 74: 915–30. [Google Scholar] [CrossRef]
- Deville, Laurent. 2008. Exchange Traded Funds: History, trading and research. In Handbook of Financial Engineering. Edited by Constantin Zopounidis, Michalis Doumpos and Panos Pardalos. HAL Open Science. Berlin: Springer, pp. 1–37. [Google Scholar]
- Dimson, Elroy, and Massoud Mussavian. 1998. A brief history of market efficiency. European Financial Management 4: 1–14. [Google Scholar] [CrossRef]
- Erb, Claude B., Campbell R. Harvey, and Tadas E. Viskanta. 1996. Political risk, economic risk and financial risk. Financial Analysts Journal 52: 29–46. [Google Scholar] [CrossRef]
- Fama, Eugene F. 1970. Efficient capital markets: A review of theory and empirical work. Journal of Finance 25: 383–417. [Google Scholar] [CrossRef]
- Foucher, Ian, and Kyle Gray. 2014. Exchange traded funds: Evolution of benefits, vulnerabilities and risks. Bank of Canada, Financial System Review 1: 37–46. [Google Scholar]
- Gencay, Ramazan, and Nikola Gradojevic. 2017. The tale of two crises: An entropic perspective. Entropy 19: 244. [Google Scholar] [CrossRef]
- Gradojevic, Nikola, and Marko Caric. 2017. Predicting systematic risk with entropic indicators. Journal of Forecasting 36: 16–25. [Google Scholar] [CrossRef]
- Hill, Joanne M., Dave Nadig, and Matt Hougan. 2015. A Comprehensive Guide to Exchange-Traded Funds (ETFs). Charlottesville: CFA Institute Research Foundation. [Google Scholar]
- Hurst, Harold E. 1951. Long term storage capacity of reservoirs. Transactions of the American Society of Civil Engineers 116: 770–99. [Google Scholar] [CrossRef]
- Lettau, Martin, and Ananth Madhavan. 2018. Exchange-Traded Funds 101 for economists. Journal of Economic Perspectives 32: 135–54. [Google Scholar] [CrossRef]
- Liebi, Luca J. 2020. The effect of ETFs on financial markets: A literature review. Financial Markets and Portfolio Management 34: 165–78. [Google Scholar] [CrossRef]
- Lim, Kian-Ping, and Robert Brooks. 2011. The evolution of stock market efficiency over time: A survey of the empirical literature. Journal of Economic Surveys 25: 69–108. [Google Scholar] [CrossRef]
- MarketWatch. 2025. Top 25 ETFs. Available online: https://www.marketwatch.com/tools/top-25-etfs (accessed on 25 April 2025).
- Marszk, Adam, and Ewa Lechman. 2020. Exchange-traded-funds on European markets: Has critical mass been reached? Implications for financial systems. Entropy 22: 686. [Google Scholar] [CrossRef]
- Mensi, Walid, Chaker Aloui, Manel Hamdi, and Duc Khuong Nguyen. 2012. Crude oil market efficiency: An empirical investigation via the Shannon entropy. International Economics 129: 119–37. [Google Scholar] [CrossRef]
- Olbrys, Joanna. 2024a. Extreme events and stock market efficiency: The modified Shannon entropy approach. In Applied Economic Research and Trends. Edited by Nicholas Tsounis and Aspasia Vlachvei. Springer Proceedings in Business and Economics. Cham: Springer, pp. 77–89. [Google Scholar]
- Olbrys, Joanna. 2024b. Incorporating volatility into symbolic encoding with thresholds: New entropy-based approach to market efficiency assessment. Procedia Computer Science 246: 48–57. [Google Scholar] [CrossRef]
- Olbryś, Joanna. 2025. Entropy of volatility changes: Novel method for assessment of regularity in volatility time series. Entropy 27: 318. [Google Scholar] [CrossRef]
- Olbryś, Joanna, and Elżbieta Majewska. 2022. Regularity in stock market indices within turbulence periods: The sample entropy approach. Entropy 24: 921. [Google Scholar] [CrossRef]
- Olbryś, Joanna, and Natalia Komar. 2023. Symbolic encoding methods with entropy-based applications to financial time series analyses. Entropy 25: 1009. [Google Scholar] [CrossRef]
- Ozkan, Oktay. 2021. Impact of COVID-19 on stock market efficiency: Evidence from developed countries. Research in International Business and Finance 58: 101445. [Google Scholar] [CrossRef]
- Papla, Daniel, and Rafał Siedlecki. 2024. Entropy as a tool for the analysis of stock market efficiency during periods of crisis. Entropy 26: 1079. [Google Scholar] [CrossRef]
- Risso, Wiston A. 2008. The informational efficiency and the financial crashes. Research in International Business and Finance 22: 396–408. [Google Scholar] [CrossRef]
- Saha, Kunai, Vinodh Madhavan, and Garimalla R. Chadrashekhar. 2022. Effect of COVID-19 on ETF and index efficiency: Evidence from an entropy-based analysis. Journal of Economics and Finance 46: 347–59. [Google Scholar] [CrossRef]
- Sensoy, Ahmet, Cihat Sobaci, Sadri Sensoy, and Fatih Alali. 2014. Effective transfer entropy approach to information flow between exchange rates and stock markets. Chaos, Solitons & Fractals 68: 180–85. [Google Scholar]
- Shannon, Claude E. 1948. A mathematical theory of communication. The Bell System Technical Journal 27: 379–423. [Google Scholar] [CrossRef]
- Shternshis, Andrey, Piero Mazzarisi, and Stefano Marmi. 2022. Measuring market efficiency: The Shannon entropy of high-frequency financial time series. Chaos, Solitons & Fractals 162: 112403. [Google Scholar]
- Thaker, Avi, Daniel Sonner, and Leo H. Chan. 2025. Using machine learning to understand the dynamics between the stock market and US presidential election outcomes. Journal of Risk and Financial Management 18: 109. [Google Scholar] [CrossRef]
- VettaFi. 2025. U.S. ETF List. Available online: https://etfdb.com/etfs/country/us/ (accessed on 25 April 2025).
- Wang, Jingjing, and Xiaoyang Wang. 2021. COVID-19 and financial market efficiency: Evidence from an entropy-based analysis. Finance Research Letters 42: 101888. [Google Scholar] [CrossRef]
- YCHARTS. 2025. US Number of ETFs. Available online: https://ycharts.com/indicators/us_number_of_etfs (accessed on 25 April 2025).


Disclaimer/Publisher’s Note: The statements, opinions and data contained in all publications are solely those of the individual author(s) and contributor(s) and not of MDPI and/or the editor(s). MDPI and/or the editor(s) disclaim responsibility for any injury to people or property resulting from any ideas, methods, instructions or products referred to in the content. |
© 2025 by the author. Licensee MDPI, Basel, Switzerland. This article is an open access article distributed under the terms and conditions of the Creative Commons Attribution (CC BY) license (https://creativecommons.org/licenses/by/4.0/).