1. Introduction
Credit ratings play a pivotal role in financial markets by providing standardized assessments of a firm’s creditworthiness, shaping investment decisions, influencing risk management strategies, and determining regulatory compliance obligations (
Kou et al. 2019). These ratings directly affect borrowing costs, bond yields, and market perceptions, thereby reinforcing overall market stability.
Traditionally, credit rating agencies (CRAs) have relied on a combination of financial ratio analysis and qualitative judgment when assigning ratings. This conventional approach typically involves assessing key financial indicators—such as leverage, liquidity, and profitability—alongside non-financial factors, including management quality and macroeconomic trends (
Egan-Jones Ratings 2024;
Investment Grade Capital 2024). However, these methodologies exhibit inherent limitations, notably the assumption of linear relationships between variables and the potential to overlook complex, non-linear dynamics prevalent in modern financial markets. Furthermore, regulatory inconsistencies and enforcement challenges continue to impede the effective supervision of CRAs, particularly in emerging markets (
Rabinowitz et al. 2024).
In response to these challenges, machine learning (ML) and artificial intelligence (AI) have emerged as transformative tools in credit risk assessment. ML algorithms excel at analyzing vast and complex datasets, enabling the detection of intricate patterns that traditional statistical models may fail to capture (
Kou et al. 2019). This capability has led to substantial improvements in predictive performance across various financial applications, such as bankruptcy prediction (
Barboza et al. 2017) and credit card default forecasting (
Chang et al. 2024).
The incorporation of alternative data sources has further enhanced the predictive capabilities of credit risk models. Integrating non-traditional information enables more nuanced and timely credit evaluations, providing a multidimensional view of borrower risk that extends beyond conventional financial statements (
Lu et al. 2019).
Despite these advancements, critical gaps persist in the literature. Notably, there is a scarcity of comprehensive studies systematically comparing the performance and robustness of different ML algorithms across diverse market conditions and industry sectors (
Kou et al. 2019). Moreover, concerns regarding the explainability and fairness of AI-driven models are increasingly prominent. Regulatory authorities mandate that financial institutions ensure transparency, accountability, and governance in their credit risk models, particularly when employing complex ML algorithms (
European Banking Authority 2021).
Recent scholarly work has further underscored these concerns. Enhancing both the accuracy and fairness of AI applications in credit risk assessment is crucial for promoting trust and stakeholder acceptance (
Z. Wang 2024). Additionally, interpretable models should be preferred over black-box approaches in high-stakes decision-making contexts, such as credit rating, to mitigate risks and ensure regulatory compliance (
Rudin 2019).
To address these challenges, this study conducts a rigorous comparative evaluation of multiple ML algorithms applied to corporate credit rating prediction. Specifically, it aims to assess the predictive performance of widely used models—including Logistic Regression (LR), Decision Trees (DT), Random Forests (RF), Support Vector Machines (SVMs), Neural Networks (NN), and Gradient Boosting Machines (GBM)—against traditional credit rating approaches. Moreover, the study seeks to identify and interpret the most influential factors affecting credit ratings through advanced feature importance analysis.
The robustness of these models will be tested across various economic contexts to evaluate their practical applicability and generalizability. This consideration is particularly important given that a deeper understanding of generalization remains critical for the reliable deployment of deep-learning models (
Zhang et al. 2021).
To support these objectives, the study utilizes a comprehensive dataset covering seven years of corporate credit ratings across 20 countries sourced from S&P Capital IQ Pro. The dataset comprises 51 variables, with 43 related to financial risk and 8 to business risk. Rigorous data pre-processing procedures—including outlier detection, normalization, and treatment of missing values—are applied to enhance data quality. Feature selection follows established best practices, notably the recursive feature elimination method, which has proven effective in isolating the most predictive variables in high-dimensional datasets (
Guyon et al. 2002).
Each selected ML algorithm is trained using stratified k-fold cross-validation to prevent overfitting and ensure model generalizability. Performance evaluation is conducted across a suite of metrics—accuracy, precision, recall, F1 score, and ROC-AUC—aligned with recommended evaluation standards for ML model assessments (
Biecek and Burzykowski 2021).
This research makes several key contributions to the field. First, it offers an extensive comparative analysis of ML algorithms for corporate credit rating prediction, directly addressing gaps identified in the literature (
Kou et al. 2019). Second, it incorporates both traditional financial indicators and alternative data sources, providing new insights into the determinants of corporate creditworthiness. Finally, it responds to regulatory and ethical imperatives by embedding explainability and fairness considerations into model selection and evaluation (
European Banking Authority 2021;
Rudin 2019;
Y. Wang 2024).
The remainder of this paper presents a review of the literature on ML applications in credit rating prediction, followed by the research methodology detailing model selection and evaluation metrics. Subsequently, the empirical findings and their implications are discussed, concluding with recommendations for financial practitioners, regulators, and future research.
2. Literature Review
Credit rating prediction has long been a critical area of financial research due to its role in assessing borrowers’ creditworthiness. Traditional approaches relied heavily on statistical models, which laid the foundation for systematic risk assessment. A seminal contribution is
Altman’s (
1968) Z-score model, which used multiple discriminant analysis (MDA) to combine financial ratios into a singular risk metric for bankruptcy prediction.
Merton’s (
1974) structural model further advanced the field by applying option pricing theory, conceptualizing a company’s equity as a call option on its assets to estimate default probabilities.
However, traditional credit rating models exhibit notable limitations. Their dependence on historical financial data and accounting-based ratios constrains their ability to capture complex, non-linear relationships and adapt to real-time shifts in a borrower’s financial condition, undermining predictive accuracy (
Cheng et al. 2024;
Umeaduma and Adedapo 2025). Additionally, these models often rely on simplifying assumptions about the distribution of financial ratios and market conditions—assumptions that can fail during periods of economic turbulence or firm-specific distress (
Addy et al. 2024). A further limitation lies in their predominantly binary classification framework, which focuses solely on default versus non-default outcomes, neglecting nuanced credit rating migrations essential for risk-sensitive applications (
Addy et al. 2024;
Jagtiani and Lemieux 2019).
To address these shortcomings, enhanced statistical methods emerged. Linear regression models established relationships between credit ratings and variables such as financial ratios and economic indicators. For instance,
Kaplan and Urwitz (
1979) demonstrated the effectiveness of linear regression in predicting bond ratings. Subsequently, LR became a staple for binary classification in credit risk contexts, notably through
Ohlson’s (
1980) pioneering application for bankruptcy prediction. Nevertheless, LR is limited by its assumption of linearity in the logit function and susceptibility to multicollinearity among independent variables.
Recognizing these constraints, CRAs began integrating quantitative data with expert judgment. Qualitative factors—such as management quality, governance practices, and industry dynamics—play a critical role in bond ratings, contributing to more comprehensive and forward-looking assessments. However, this integration introduces risks of subjectivity and potential inconsistencies that can compromise model objectivity (
Seetharaman et al. 2017).
In recent years, ML and AI have significantly transformed credit risk modeling by offering advanced tools for data analysis and prediction. ML algorithms excel at identifying complex, non-linear patterns in large datasets, thereby addressing many limitations inherent in traditional models (
Talaei Khoei and Kaabouch 2023).
Talaei Khoei and Kaabouch (
2023) provided a comprehensive review of various ML methods—including NN, SVMs, and ensemble learning techniques—highlighting their advantages in enhancing predictive performance and robustness across financial applications. Further exemplifying these advancements,
Chang et al. (
2024) demonstrated that deep-learning architectures such as Recurrent Neural Networks (RNNs) and Convolutional Neural Networks (CNNs) outperform conventional models in credit card default prediction, particularly in handling sequential and structured financial data.
The growing integration of advanced ML techniques into credit rating prediction reflects a broader trend toward more sophisticated analytical tools. For example,
Tran and Tham (
2025) showed that boosting ensembles and SVMs outperform traditional models like LR in financial risk evaluation owing to their superior capacity for modeling complex, non-linear relationships. Similarly,
Mokheleli and Museba (
2023) highlighted how NNs and ensemble methods enhance the predictive accuracy of credit score models by capturing intricate patterns within financial datasets.
Despite their superior predictive capabilities, ML models often face criticism for their “black-box” nature, which complicates interpretability and transparency—particularly in high-stakes financial decision-making. In response, recent research has prioritized the development of Explainable Artificial Intelligence (XAI) techniques, such as Shapley Additive Explanations (SHAP) and Local Interpretable Model-Agnostic Explanations (LIME). These methods improve the interpretability of model predictions and are essential for compliance with emerging regulatory frameworks, including the European Union’s AI Act and the Basel Committee’s guidelines on model risk management (
Hassija et al. 2024;
Sabharwal et al. 2024).
Y. Wang (
2024) emphasized that ensuring fairness and transparency in ML-based credit risk assessments is vital for promoting stakeholder trust and meeting regulatory requirements. Complementing this perspective,
Hassija et al. (
2024) reviewed a range of methods for interpreting black-box models, underscoring their growing relevance in financial contexts. Moreover,
Weber et al. (
2024) conducted a systematic review that highlighted the increasing importance of XAI in finance, particularly for enhancing model accountability and mitigating risks associated with opaque decision-making processes.
In addition to advances in ML techniques, recent research has emphasized the importance of non-financial and strategic variables in credit risk and default prediction—particularly for SMEs. Traditional financial indicators, while foundational, may be insufficient to capture the nuanced factors that influence a firm’s creditworthiness and recovery potential.
For instance,
Altman et al. (
2022,
2023) introduced the Omega Score, a revised predictive model that integrates both financial and qualitative variables for SME default prediction, significantly improving model performance and robustness. These studies stress the value of including variables related to management quality, market positioning, and strategic behavior.
This perspective is further reinforced in sector-specific contexts.
Srhoj et al. (
2024) demonstrate that in the tourism industry, predictors of SME default differ from general models, underscoring the need for industry-tailored frameworks. Their findings highlight the unique operational and demand-side dynamics that impact firms in this sector.
Furthermore, recovery-oriented research by
Altman et al. (
2024) explores the drivers of turnaround success, finding that qualitative factors—such as managerial flexibility and strategic refocusing—are crucial for explaining why some distressed firms rebound while others do not. This work suggests a growing consensus around the integration of strategic, behavioral, and sector-specific dimensions in predictive modeling.
Parallel to advancements in interpretability, the incorporation of alternative data sources has emerged as a significant trend in credit risk modeling. Traditional financial indicators are now frequently supplemented by non-traditional data such as environmental, social, and governance (ESG) metrics, supply chain information, and social media sentiment.
Lu et al. (
2019) provided empirical evidence demonstrating that alternative data significantly improves the predictive accuracy of credit risk models by offering a more comprehensive and multidimensional perspective on borrower risk.
The influence of fintech and digital footprints in credit scoring is further evidenced by studies such as those by
Jagtiani and Lemieux (
2019) and
Berg et al. (
2020). Their findings reveal that alternative data enhances model performance by capturing forward-looking indicators typically overlooked by traditional models. However, the integration of such data also raises complex challenges related to privacy, ethical considerations, and model validation, necessitating ongoing research and robust regulatory oversight (
Owoade et al. 2024). In line with this, the
Basel Committee on Banking Supervision (
2023) has issued principles for managing climate-related financial risks, reinforcing the need to incorporate ESG-related alternative data in credit risk assessments.
The impact of ML extends beyond credit rating prediction to domains such as fraud detection and portfolio management. Fraud detection systems have evolved from rule-based mechanisms to sophisticated ML-driven models. Recent studies highlight the effectiveness of advanced ML approaches in identifying complex fraud patterns, with ensemble methods and synthetic sampling techniques contributing to improved classification accuracy (
Bello et al. 2023;
Ileberi et al. 2021).
In portfolio management, ML has enhanced traditional models such as Modern Portfolio Theory (
Markowitz 1952) and the Capital Asset Pricing Model (
Sharpe 1964). For instance,
Krauss et al. (
2017) and
Gu et al. (
2020) applied deep NNs and gradient-boosted trees for stock return prediction, achieving significant improvements over conventional time-series forecasting methods.
Illustrating the broader applicability of ML techniques, the study “On the analytical study of the service quality of Indian Railways under soft-computing paradigm” demonstrates the versatility of approaches such as rough set theory, extra trees classifiers, and SVMs beyond financial contexts, reinforcing the value of these tools across diverse domains (
Majumder et al. 2024).
While substantial progress has been made, future research should focus on enhancing the interpretability of ML models, integrating alternative data sources more effectively, and ensuring alignment with evolving regulatory frameworks. Additionally, systematic comparative studies evaluating the performance of different ML algorithms across various economic contexts and industry sectors remain relatively scarce (
Kou et al. 2019).
The convergence of ML techniques with domain expertise and traditional financial theories offers significant potential for developing more robust and reliable credit risk models. Furthermore, advancing responsible AI principles—such as fairness, accountability, and transparency—is essential to harmonize technological innovation with societal and regulatory expectations. Recent contributions by
Barocas et al. (
2023) underscore the growing emphasis on fairness and causal approaches in credit scoring, providing valuable guidance for future research agendas.
2.1. Theoretical Framework
2.1.1. Credit Risk Theory
Credit risk theory forms the backbone of credit rating assessments, emphasizing the potential risk of loss resulting from a borrower’s failure to repay a loan. Robert Merton’s foundational works (1974) laid the groundwork for modern credit risk evaluation through the Merton model, which applies option pricing theory to corporate debt valuation. Merton’s model fundamentally reshaped the understanding of credit risk by treating corporate debt as a risk-free bond combined with a short put option on the firm’s assets, reflecting the probability of default.
Before
Merton (
1974) introduced his structural model,
Altman (
1968) developed the Z-score model, a statistical tool for predicting bankruptcy. Altman’s model utilized financial ratios and discriminant analysis to estimate the likelihood of default, providing a practical and widely adopted framework for credit risk assessment. While Merton’s approach focuses on market-based measures, Altman’s model emphasizes accounting data, highlighting a divergence in methodology but a convergence in the goal of assessing credit risk.
Jarrow and Turnbull (
1995) significantly advanced credit risk modeling by developing a reduced-form approach that incorporates the term structure of interest rates. Their model provides a market-based, dynamic method for estimating default probabilities and credit spreads, improving upon static accounting-based measures like the Altman Z-score. This approach underscores the importance of market-sensitive frameworks in credit risk assessment.
2.1.2. Machine Learning Theory
ML theories have significantly transformed credit rating prediction by introducing advanced algorithms capable of managing large-scale datasets and capturing complex, non-linear patterns. Foundational techniques such as DT models (
Breiman et al. 1984) offer intuitive and interpretable structures but are inherently prone to overfitting. To mitigate these limitations, contemporary ensemble methods such as RF (
Breiman 2001) and GBM (
Friedman 2001) have been developed, followed by more sophisticated variants like XGBoost (
Chen and Guestrin 2016), LightGBM (
Ke et al. 2017), and CatBoost (
Prokhorenkova et al. 2018), which deliver enhanced scalability and predictive accuracy.
The backpropagation algorithm (
Rumelhart et al. 1986) remains a cornerstone of NN training, underpinning modern deep-learning architectures that adeptly model complex financial relationships. Recent empirical studies, such as that of
Tran and Tham (
2025), have demonstrated the efficacy of deep NNs in processing extensive historical credit data, thereby significantly improving predictive performance.
Despite these technological advances, the “black-box” nature of many ML models has raised concerns about transparency and interpretability, particularly in high-stakes financial decision-making contexts. This has catalyzed extensive research on XAI methodologies, notably SHAP (
Lundberg and Lee 2017) and LIME, to ensure model interpretability and regulatory compliance. Regulatory frameworks, including the European Union’s Artificial Intelligence Act (
European Commission 2023) and the Basel Committee’s guidance on model risk management, now underscore the imperative for interpretable models in financial applications.
Benchmarking studies focused on credit scoring and rating prediction have consistently validated the superiority of ensemble-based models over traditional statistical approaches (
Lessmann et al. 2015), reinforcing their growing prominence in contemporary credit risk analytics. Moreover, recent comprehensive reviews on ensemble deep learning have emphasized their advantages in improving predictive performance across various domains, further highlighting their methodological robustness and broad applicability (
Mohammed and Kora 2023).
2.1.3. Behavioral Finance Theory
Behavioral finance theory examines how psychological factors and biases influence financial decision-making, which can impact credit ratings.
Tversky and Kahneman’s (
1974) prospect theory highlights how cognitive biases, particularly loss aversion, shape risk perceptions. Other behavioral biases, such as overconfidence and herding behavior, also influence investor decisions. These biases contribute to irrational market behavior, influencing credit risk assessment through changes in market sentiment, risk perception, and investor-driven fluctuations in credit spreads, which can ultimately affect credit ratings.
Shiller (
2003) explored the role of market sentiments and speculative bubbles in financial markets, underscoring the influence of behavioral factors on asset pricing and risk perception. Behavioral finance theories suggest that traditional models may overlook these irrational elements, leading to mispricing and inaccurate credit ratings.
ML can address these complexities by incorporating behavioral indicators into predictive models. By analyzing patterns in investor behavior and sentiment, ML algorithms can adjust for biases and improve the accuracy of credit risk predictions. This integration of behavioral finance with ML approaches represents a convergence of theories aimed at enhancing the robustness of credit rating methodologies.
2.1.4. Gaps in the Literature
Applying ML algorithms in credit rating prediction has gained significant attention recently. However, despite these advancements, the black-box nature of many ML models poses challenges for interpretability and regulatory acceptance. Researchers have developed XAI techniques to address these concerns that provide insights into model predictions.
Ribeiro et al. (
2016) introduced LIME, a method designed to explain the predictions of any classifier, enhancing the transparency of ML models. Similarly,
Lundberg and Lee (
2017) developed SHAP, a unified approach to interpreting model predictions, gaining traction in financial applications. These techniques have significantly improved interpretability, yet challenges remain in effectively integrating them into real-world financial decision-making.
Despite these advancements, several limitations persist in the literature. First, most studies have focused on static models that do not account for temporal changes in financial data. Second, data quality and availability remain significant challenges. Many studies rely on proprietary datasets that are not publicly accessible, limiting the reproducibility and generalizability of findings. Finally, as
Doshi-Velez and Kim (
2017) emphasized, while interest in XAI techniques continues to grow, achieving a balance between model accuracy and interpretability remains an ongoing challenge. Addressing these issues is crucial for adopting ML-based credit rating models in regulatory and financial environments.
Given these gaps, the current study aims to advance the field by developing a dynamic machine-learning framework for credit rating prediction that accounts for temporal changes in financial data. By utilizing publicly available datasets, this study seeks to enhance the reproducibility and generalizability of findings.
In addition to these technical limitations, recent empirical work has drawn attention to the absence of strategic and industry-specific considerations in many credit risk prediction models. For example,
Altman et al. (
2022,
2023) highlight the relevance of non-financial predictors—such as governance and competitive advantage—in improving SME default prediction. Likewise,
Srhoj et al. (
2024) show that sector-specific models yield better predictive accuracy by accounting for structural differences across industries.
Altman et al. (
2024) go a step further by identifying the qualitative and strategic determinants of firm recovery, advocating for a broader conceptualization of creditworthiness that includes the likelihood of turnaround.
By engaging with these perspectives, the present study aims to not only enhance methodological rigor through ML but also set a foundation for integrating qualitative and sector-sensitive factors into future predictive frameworks.
3. Methodology
3.1. Materials and Methods
This study focuses on credit rating prediction, a well-established research topic in financial risk assessment. Credit ratings categorize a client’s financial condition into predefined classes, such as “A,” “B,” “C,” or “D.” These classifications are assigned based on financial and qualitative indicators using ML techniques.
A comprehensive dataset must be compiled from various sources to develop a predictive model. Relevant financial and qualitative features are extracted as predictors in a classification model. Credit rating prediction is framed as a classification problem, where a supervised learning model, trained on labeled data, assigns a credit rating to new clients based on their financial characteristics. Key financial indicators, such as the debt-to-income ratio, history of defaults, and credit inquiries, play a significant role in determining whether a client receives a “good” or “poor” rating.
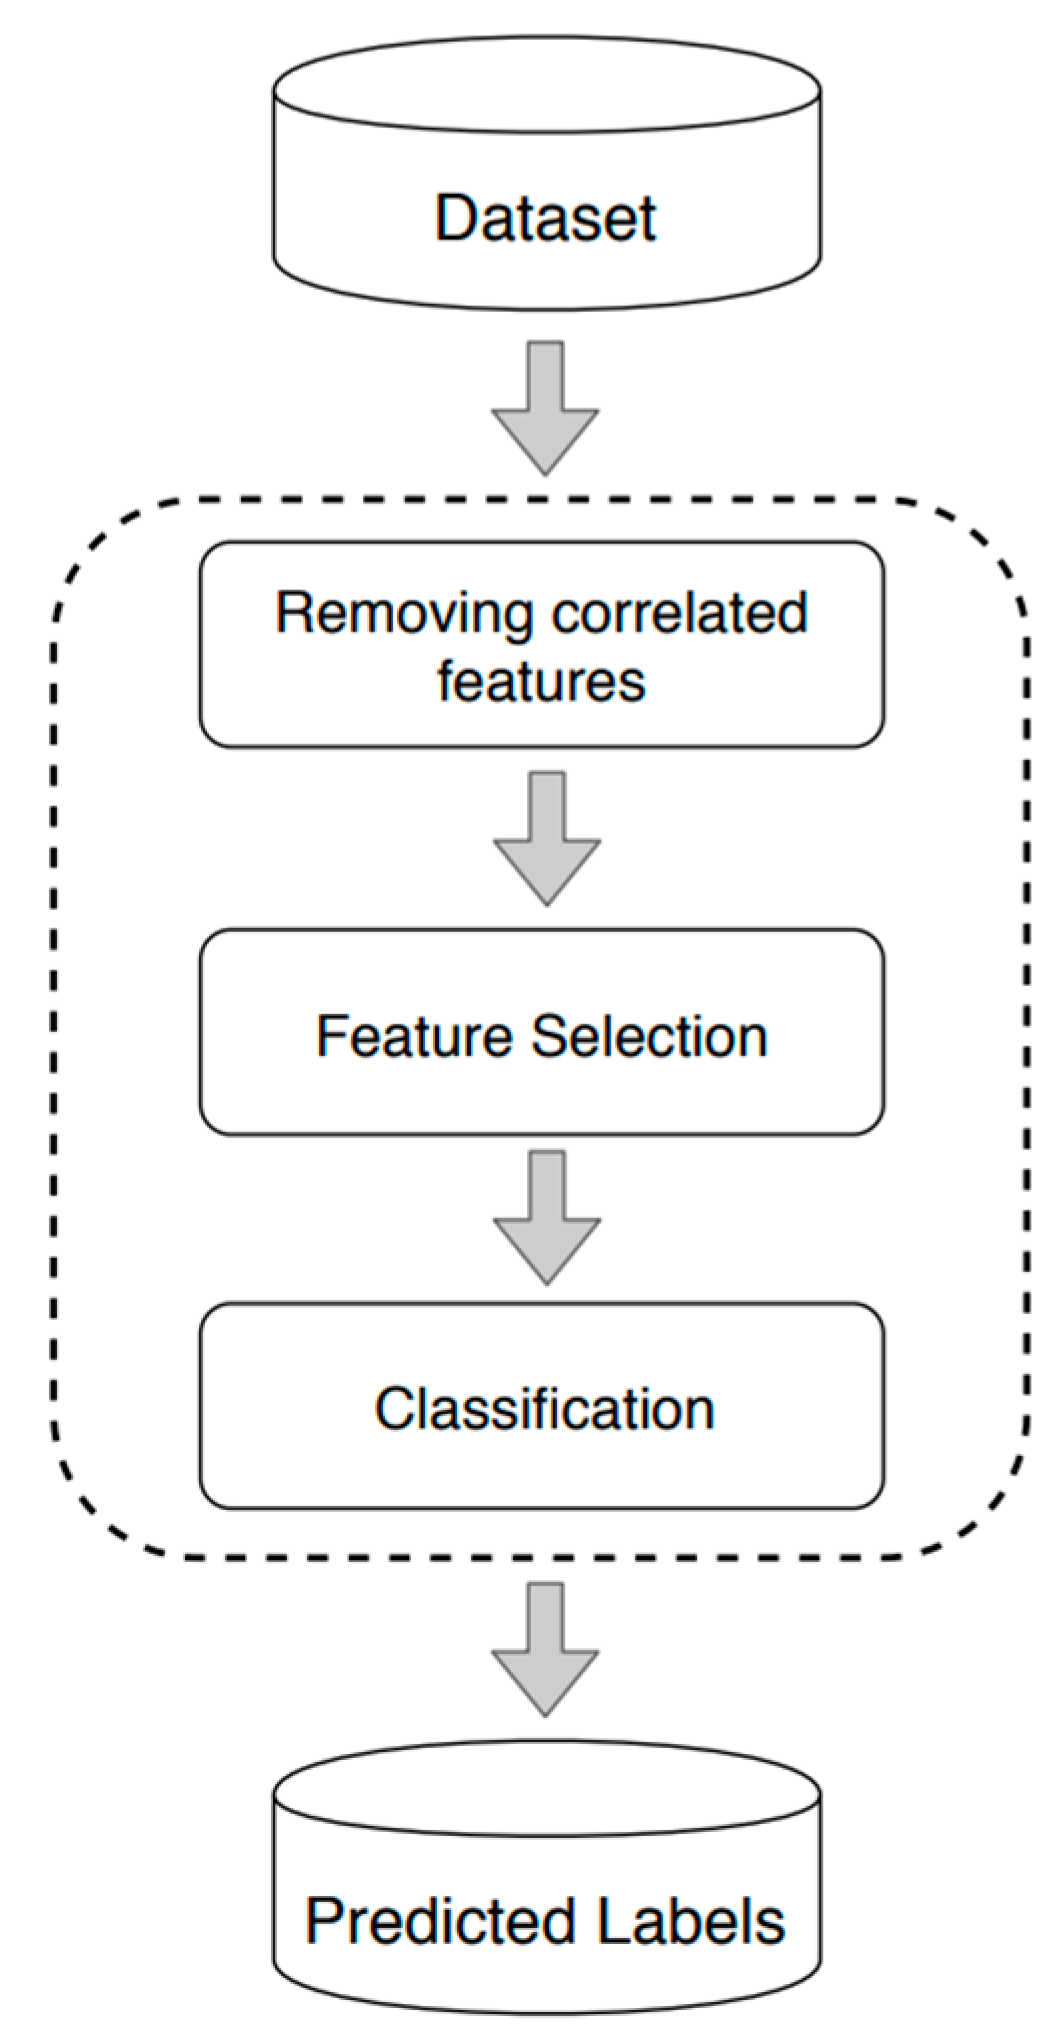
The proposed methodology follows a structured approach, illustrated in
Figure 1. First, financial and qualitative data are collected and processed to build a robust dataset, ensuring each feature represents a meaningful aspect of the company’s risk profile. Since not all financial and qualitative attributes contribute equally to prediction accuracy, a two-stage feature refinement process is applied: (i) correlation analysis to remove highly correlated and redundant features and (ii) feature selection to exclude variables that may negatively impact classification performance. Finally, a ML classification model is trained on the selected features and used to predict credit ratings.
3.2. Removing Correlated Features
The previous section outlined the process of collecting, processing, and structuring data—comprising features and labels—as input for the classification step. However, certain features may exhibit high correlation, leading to redundant information that does not contribute unique predictive value. Removing such redundancy is essential for enhancing model interpretability, reducing overfitting, and improving classification accuracy.
In statistical analysis and ML, correlation is a fundamental metric for assessing feature relevance and redundancy. The linear correlation coefficient (ρ) is the most widely used measure to quantify the strength and direction of the relationship between two variables, X and Y. It ranges from −1 to 1, where ρ = 1 signifies a perfect positive correlation—indicating that as one variable increases, the other increases proportionally. Conversely, ρ = −1 represents a perfect negative correlation, where an increase in one variable corresponds to a proportional decrease in the other. A value of ρ = 0 suggests no linear relationship between the variables, implying that changes in one do not systematically correspond to changes in the other.
In the context of credit rating prediction, financial variables such as net income and EBITDA or current ratio and quick ratio are often highly correlated. Retaining both in the dataset may introduce redundancy, inflating the feature space without improving predictive performance. To mitigate this issue, correlation analysis is applied to identify and eliminate features with excessive collinearity, ensuring that only the most informative predictors are used in the classification model.
3.3. Feature Selection
The subsequent step in the proposed methodology (see
Figure 1) is feature selection, which aims to identify and eliminate irrelevant and redundant information. This process reduces the dimensionality of the dataset, thereby improving computational efficiency and enhancing the performance of ML algorithms by focusing on the most informative features (
Cheng 2024). From an ML perspective, feature selection in classification tasks offers several key benefits. It enhances model accuracy by removing superfluous features, leading to more compact and computationally efficient models. Furthermore, it facilitates knowledge discovery by isolating the most influential variables, thereby improving interpretability and providing deeper insights into the underlying data structure (
Büyükkeçeci and Okur 2023).
Feature selection techniques are typically categorized into three classes based on their interaction with the classification model: filter methods, wrapper methods, and embedded methods (
Al-shalif et al. 2024). Filter methods operate independently of the learning algorithm, selecting features based on intrinsic data characteristics during a pre-processing phase. Conversely, wrapper and embedded methods incorporate feature selection within the model training process. Wrapper methods evaluate various feature subsets using a search strategy informed by the model’s predictive performance, whereas embedded methods perform feature selection intrinsically as part of the model’s parameter optimization during training (
Cheng 2024).
This study employed wrapper methods due to their balance of interpretability and simplicity compared to embedded techniques. A commonly adopted search strategy within wrapper methods is greedy hill climbing, which iteratively modifies the current feature subset by either adding or removing one feature at a time. Variants of this strategy include forward selection, focusing exclusively on adding features, and backward elimination, which sequentially removes features. To overcome the limitations associated with these traditional approaches, recent advancements such as meta-heuristic algorithms (e.g., genetic algorithms, particle swarm optimization) and floating search methods have been introduced, enabling more flexible and dynamic inclusion and exclusion of features during the selection process (
Al-shalif et al. 2024;
Nemati et al. 2024). Moreover, hybrid approaches that combine multiple feature selection strategies have demonstrated promising results, achieving an optimal trade-off between computational efficiency and model performance (
Nemati et al. 2024).
3.4. Classification
The proposed approach’s final and most critical stage involves using classifiers to develop a classification model and assessing its performance through standard evaluation metrics, as explained in the next section.
3.4.1. Classification in Credit Rating Prediction
Classification is the process of predicting the target class of a given instance based on a set of input features. In financial applications, classification models are crucial in assessing credit risk, particularly in predicting corporate credit ratings, default probabilities, and borrower creditworthiness. For example, using financial information about a company, a classification model can predict the company’s credit rating (the target class). In this context, the company is labeled with the value of the target class (e.g., credit rating). The term “label” will be used throughout this paper to refer to the target class, following standard ML terminology.
Building a classification model involves learning a mapping from input features to output labels. The training data used to develop the model contains labels corresponding to each training company, and the model’s objective is to predict the label for input values corresponding to companies not included in the training data. A predefined set of features, such as profitability ratios, leverage, liquidity, and macroeconomic indicators, characterizes each company. However, financial classification tasks introduce unique challenges, including class imbalance, where highly rated firms significantly outnumber defaulted firms, and temporal dependencies, as creditworthiness evolves (
Altman and Saunders 1998;
Duffie and Singleton 2003).
Numerous classification algorithms are currently available, including traditional statistical methods such as LR and more advanced ML techniques like SVMs, NN, DT, GBM, and RF. However, it is impossible to definitively state that any algorithm is superior, as its effectiveness depends on the specific application and the nature of the dataset being used.
3.4.2. Evaluation Criteria
Evaluating classification models in credit risk applications requires the use of performance metrics tailored to financial decision-making. Common metrics include Area Under the ROC Curve (AUC-ROC), Gini coefficient, and F1 score, which help assess model discrimination power and balance between precision and recall. Furthermore, given the regulatory requirements in financial markets, model explainability remains a significant concern, particularly for ML techniques that operate as black-box models (
Kuiper et al. 2022).
Despite advancements in ML, challenges remain in applying classification techniques to financial risk modeling. Regulatory compliance, explainability requirements, and the dynamic nature of financial markets necessitate careful feature selection and robustness testing.
4. Experiments and Results
In
Section 3.1, we describe our methodology (summarized in
Figure 1), which leverages financial and business risk features to construct a training dataset. This dataset is then used to train a classification model designed to predict the credit rating of companies. To enhance classification performance, we apply data analysis techniques, such as feature correlation analysis and feature selection.
Section 4.1 provides a detailed overview of the training dataset, focusing on the specific features we collected. In
Section 4.2, we discuss the classification models employed in our study, emphasizing their role in credit rating prediction. The results of our methodology are presented in
Section 4.3, where we analyze feature correlations within the dataset and identify the most important features contributing to classification performance.
4.1. Training Dataset
The dataset used in this study, presented in
Table 1, was obtained from S&P Capital IQ Pro and consists of 51 features, including 43 financial features and 8 business features, covering rated companies across 20 countries. We collected financial and qualitative variables from Capital IQ Pro and Bloomberg for 3453 companies over the period 2018–2024. The feature selection was based on data availability and relevance to credit rating assessment, ensuring a comprehensive representation of financial and business characteristics.
In this study, we utilize the full range of S&P Global credit rating grades, which includes 23 ordered levels, ranging from AAA (highest creditworthiness) to D (default). Market participants often group ratings of CCC+ and below due to their elevated default risk and financial vulnerability, reflecting a heightened probability of credit distress.
When dealing with categorical dependent variables such as credit ratings in ML models, each algorithm employs distinct techniques for processing these features. The following section provides a detailed analysis of how LR, SVMs, NN, DT, Gradient Boosting (GB), and RF handle credit ratings as a categorical target variable.
4.2. Classifiers
In this study, the target variable consists of multiple credit rating categories, necessitating the use of classifiers capable of handling multiclass classification. To ensure methodological diversity and capture different aspects of credit rating prediction, we selected six classifiers spanning linear models, tree-based models, and NNs.
Linear models, such as LR and SVMs, were chosen for their interpretability and ability to model direct relationships between financial variables and risk.
Tree-based models, including DT, RF, and GB, were selected for their ability to capture non-linear interactions, provide feature-importance insights, and maintain robustness when handling high-dimensional data.
Finally, NNs were incorporated due to their capacity to model highly complex, non-linear relationships without assuming a predefined decision boundary, making them well-suited for capturing intricate financial patterns.
The following section provides a discussion of each classification method, emphasizing their capability to handle multiclass classification.
4.2.1. Logistic Regression
LR, commonly used for binary classification, can be extended to multiclass prediction tasks, such as forecasting multiple credit ratings, through approaches like One-vs-Rest (OvR) or One-vs-One (OvO). However, when the categories exhibit a natural ranking (e.g., AAA > AA > A > BBB), ordinal LR is a more suitable choice.
As demonstrated by
Goldmann et al. (
2024), ordinal LR explicitly accounts for the ordered structure of the dependent variable, thereby improving interpretability and producing more meaningful coefficient estimates compared to standard multinomial LR. This modeling approach ensures that the predicted probabilities adhere to the inherent ranking of credit ratings, leading to more accurate assessments in credit risk modeling.
4.2.2. Support Vector Machines
SVMs, originally designed for binary classification, have been effectively extended to handle multiclass classification through strategies such as OvO and OvR. These methods enable SVMs to manage complex rating systems involving multiple classes, ensuring scalability and reliable classification performance.
Kurbakov and Sulimova (
2024) provide a comprehensive comparative study on multiclass extensions for SVMs, demonstrating their effectiveness and practical applicability across diverse classification tasks. Their proposed Dual-Layer Smart Sampling SVM (DLSS-SVM) method enhances scalability and efficiency without compromising accuracy, reflecting contemporary advancements in multiclass SVM methodologies.
4.2.3. Neural Networks
NNs offer substantial flexibility in handling both binary and multiclass categorical outcomes, such as credit ratings. In multiclass classification, the SoftMax activation function is commonly applied in the output layer to produce a probability distribution over possible classes. Categorical variables are typically represented using one-hot encoding, where each category is converted into a binary vector. However, for high-cardinality categorical variables, embedding layers provide a more efficient alternative by mapping categories into continuous vector spaces. As highlighted by
Cao (
2024), embedding models efficiently transform sparse, high-dimensional inputs into dense, low-dimensional representations, thereby enhancing both memory efficiency and learning performance.
4.2.4. Decision Trees
DT inherently support multiclass classification as they recursively split data at each node, accommodating multiple class labels. Their flexibility in handling both categorical and continuous features make them useful in applications like credit rating prediction.
Mienye and Jere (
2024) emphasize that DT are a versatile and foundational method for classification, demonstrating significant effectiveness in managing complex decision-making tasks across various domains.
4.2.5. Gradient Boosting
Gradient Boosting (GB) can be extended to multiclass classification by adapting boosting algorithms to optimize loss functions for multiple target categories.
Friedman (
2001) introduced GBM and discussed their potential extensions beyond binary classification. This theoretical framework has been successfully operationalized in modern implementations such as XGBoost (
Chen and Guestrin 2016), which efficiently supports multiclass classification tasks.
4.2.6. Random Forests
RF are an effective approach for multiclass classification, leveraging an ensemble of DT trained on random subsets of data and features. Their ensemble nature enhances robustness and predictive accuracy across classification tasks.
Breiman (
2001) introduced RF as a method that generalizes well across various classification settings, demonstrating their effectiveness, including in multiclass problems. This has been further exemplified in recent applications within intrusion detection systems (
Alharthi et al. 2025).
4.3. Results and Discussion
As described in
Section 3.1, not all features are relevant when constructing a model since sometimes they represent redundant information. Hence, two experiments were carried out: in
Section 4.3.1, the model was tested after removing features that were highly correlated (redundant), whereas in
Section 4.3.2, the model was tested using only a selected subset of the original features. This experiment aimed to determine whether a smaller but more relevant set of features could still provide good results.
4.3.1. Feature Correlation Analysis
To enhance model performance and reduce redundancy, we conducted a correlation analysis to identify highly correlated features. High correlation among independent variables can introduce multicollinearity, leading to unstable model estimates, increased computational complexity, and a higher risk of overfitting.
To mitigate these issues, we identified and excluded features with high pairwise correlation, ensuring that only the most informative variables were retained. This feature selection step aims to improve the model’s generalization ability while maintaining computational efficiency.
4.3.2. Credit Rating Analysis
In this experiment, we analyze the impact of feature selection on model performance. While
Section 4.3.1 focused on eliminating highly correlated features, this section evaluates how removing low-importance features affects classification accuracy.
The dataset used for credit rating prediction, presented in
Table 4, comprises 27,664 instances collected from 20 countries. However, the distribution of observations is highly imbalanced, with the United States contributing 16,374 instances (59% of the dataset), while Switzerland accounts for only 257 instances (1%). This imbalance extends to the distribution of credit ratings across countries, leading to significant variations in rating proportions. Such disparities pose challenges for model generalization and predictive performance.
To mitigate these issues and improve model robustness, a country-specific modeling approach was adopted. This strategy accounts for regional differences in economic conditions, regulatory environments, and credit risk factors, thereby enhancing the model’s ability to capture country-specific patterns in credit ratings.
Rating Categorization and Balance Improvement
The original credit ratings were highly detailed, leading to an uneven distribution of data across rating categories. This imbalance could negatively impact the analysis by reducing statistical reliability. To address this, we grouped the ratings into four broader categories, ensuring a more balanced distribution while preserving the essential distinctions needed for meaningful interpretation.
Table 5 presents the grouped ratings by category.
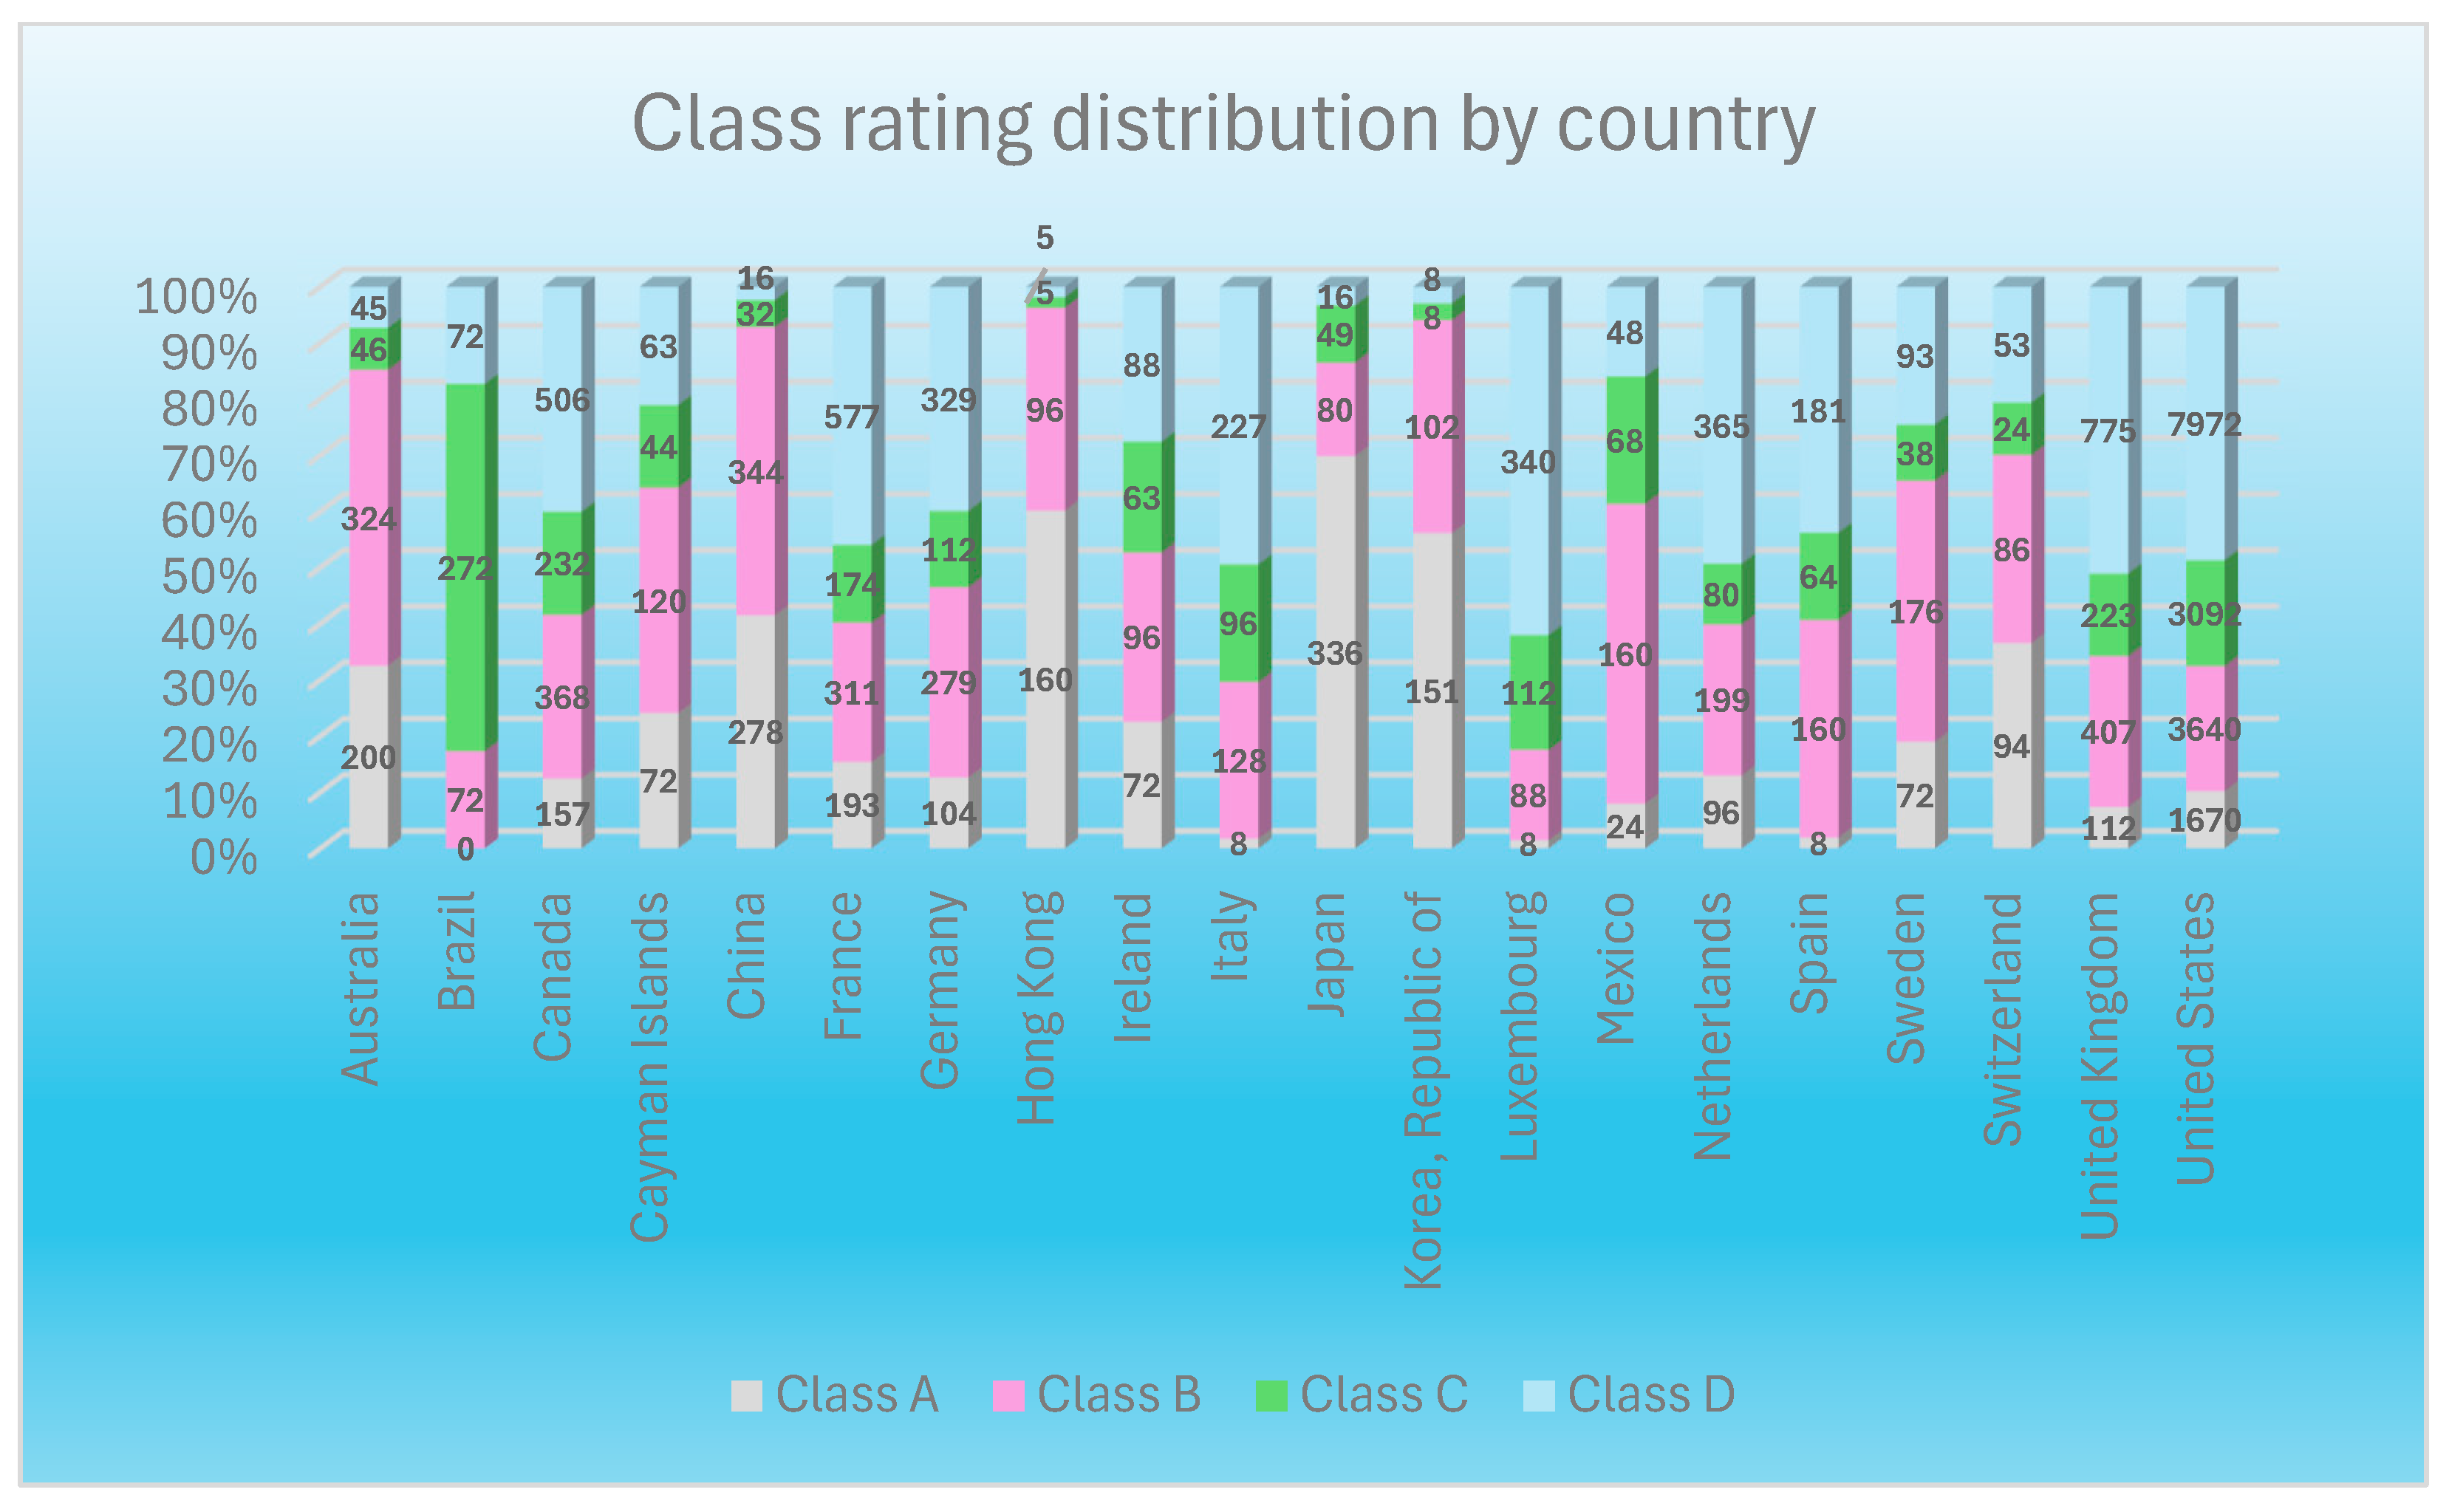
Figure 2 presents a stacked bar chart illustrating the distribution of Class A, B, C, and D ratings across various countries, showing the relative proportion of each rating within each country.
One of the most striking observations is that the United States has the highest number of Class D ratings, 7972, indicating that a large share of rated entities in the country fall into the lowest rating category. On the other hand, countries such as France, Germany, and the United Kingdom exhibit a strong presence of Class A ratings, highlighting a concentration of highly rated entities. Similarly, Japan and Canada also have a significant proportion of Class A ratings, reinforcing their position as countries with a higher credit quality profile.
Meanwhile, countries such as Brazil, the Cayman Islands, and Mexico have a greater proportion of Class B and Class C ratings, indicating a mid-tier credit profile. In contrast, Germany, China, and Hong Kong demonstrate a more balanced distribution across Classes A, B, C, and D, suggesting a diversified risk profile.
Class D ratings are also notably significant in several other countries besides the United States. Countries such as Switzerland, Spain, and Italy exhibit a visible portion of Class D ratings, suggesting a notable presence of lower-rated entities. Likewise, the United Kingdom also has a considerable number of Class D ratings, 775, indicating that while some entities are highly rated, a significant portion falls within the lower classification.
Justification for Country-Specific Models
Given the heterogeneity of economic environments and the varying distribution of credit ratings across countries, training a single global model may result in suboptimal performance. A universal model could struggle to capture the complex, country-specific relationships embedded within the data. To mitigate this limitation, we implemented a country-specific modeling approach, developing separate models for each of the 20 countries in the dataset.
This methodology offers several advantages:
Enhanced Data Homogeneity: Training models on country-specific datasets ensures greater uniformity in economic conditions, reducing variability introduced by cross-country differences and improving model reliability.
Improved Predictive Accuracy: By tailoring models to individual economic contexts, this approach enhances predictive performance by mitigating confounding effects inherent in aggregated datasets.
Scalability and Adaptability: Independent models enable efficient updates and fine-tuning as new country-specific data becomes available, supporting both scalability and continuous improvement.
Each model was trained using the respective country’s data subset, underscoring the value of localized insights in credit rating prediction.
4.3.3. Credit Rating Prediction
To assess the predictive performance of our models, we utilized the Scikit-learn library in Python 3.10 and evaluated five ML algorithms: LR, RF, GB, SVMs, and Artificial Neural Networks (ANN). Each algorithm was initially implemented using default hyperparameter configurations. Model evaluation was performed through five repetitions of 10-fold cross-validation, a widely adopted technique to ensure robust and reliable performance assessment while mitigating potential biases due to data partitioning.
DT were initially included in the model evaluation process. However, they consistently exhibited lower accuracy and generalization ability compared to ensemble methods such as RF and GB. Given their comparatively weaker performance, they were excluded from the final results table for brevity.
The results, summarized in
Table 6, report the mean accuracy scores for each algorithm across the 20 country-specific datasets. In most cases, the differences in model performance were marginal. However, notable variations were observed in the datasets from the United States, United Kingdom, France, and Australia, where ANN, RF, and GB consistently outperformed the other algorithms. In contrast, LR and SVMs demonstrated comparable performance but generally yielded lower accuracy in these datasets relative to the more complex models.
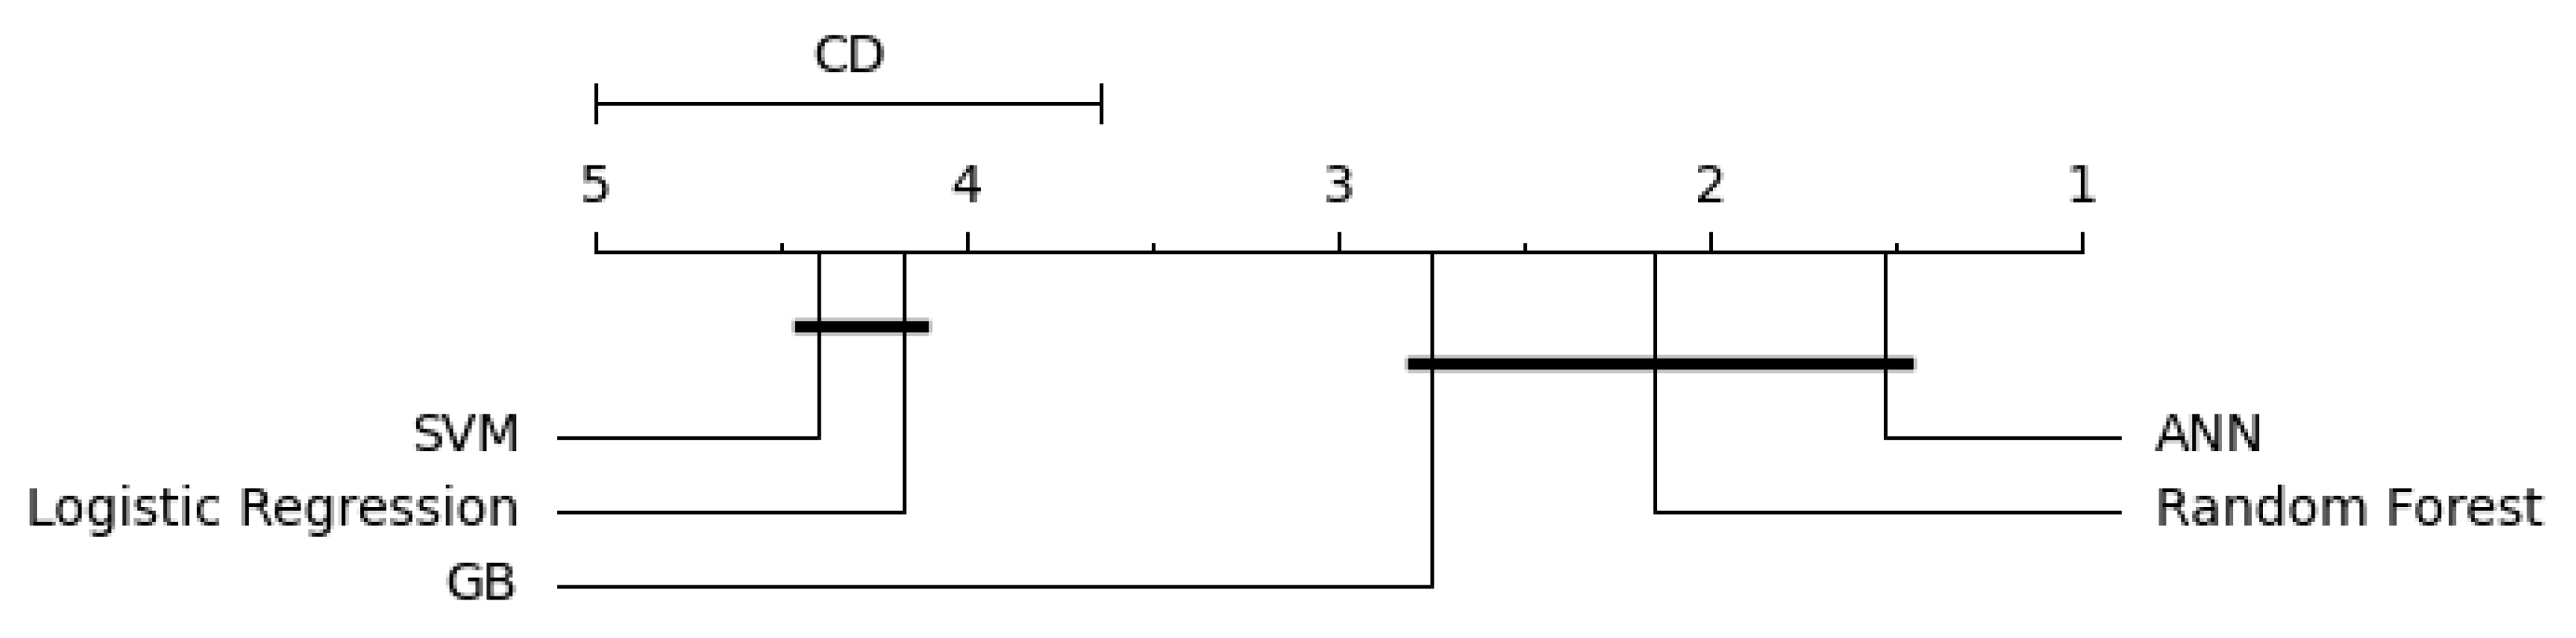
To assess whether the observed performance differences among the algorithms were statistically significant, we employed the methodology outlined by
Demšar (
2006). First, we applied the Friedman test at a significance level of 0.05 to evaluate the null hypothesis that “there is no statistical difference between the algorithms” across country-specific datasets. In cases where the null hypothesis was rejected, we conducted the Nemenyi post hoc test to identify specific pairwise differences, as shown in
Figure 3.
The Friedman test results indicated significant differences in algorithm performance for several countries, particularly those with larger datasets or more complex distributions of credit ratings (e.g., the USA, the UK, and France). For these datasets, the Nemenyi post hoc test revealed that ANN, GB, and RF consistently formed a superior group, significantly outperforming LR and SVMs.
6. Discussion
The results presented in this study demonstrate the predictive performance of various ML models—ANN, GB, LR, RF, and SVMs—across different countries. A comparative analysis of these findings within the context of existing literature on predictive modeling in financial studies yields several key insights.
ML in Financial Prediction: Prior research (e.g.,
Lessmann et al. 2015) has demonstrated that advanced models, particularly ANN and ensemble methods (RF, GB), frequently outperform traditional approaches such as LR in financial prediction tasks. Similarly,
Lokanan and Ramzan (
2024) highlight the strong predictive capabilities of ANN in financial distress modeling, reinforcing the advantages of advanced ML techniques in financial forecasting. These findings are consistent with the results of this study, where ANN and GB demonstrated superior predictive accuracy, particularly in countries such as Brazil and Australia, where accuracy scores exceeded 0.95.
Performance of ANN: The consistently high performance of ANNs observed across multiple datasets aligns with existing research, highlighting their capability to model complex, non-linear relationships in financial data.
Makridakis et al. (
2018) demonstrated that ML methods, including NN, significantly enhance forecasting accuracy across various domains, as evidenced by the M4 Competition results. The superior accuracy of ANNs in this study further substantiates their suitability for tasks such as credit rating prediction and financial forecasting.
Traditional vs. Modern Predictive Techniques: While LR remains a widely used benchmark due to its simplicity and interpretability, its performance, as observed in this study, was generally lower than that of ensemble-based models. These findings align with those of
Lessmann et al. (
2015) and
Ling and Wang (
2024), who demonstrated that LR, while effective in credit-scoring models, is often surpassed by more sophisticated techniques, particularly ensemble-based models. The improved performance of RF and GB suggests that ensemble learning methods, which integrate multiple weak learners, enhance predictive power by capturing intricate patterns within financial data.
Cross-Country Variability in Model Performance: Variations in model performance across different countries—such as the notably high accuracy of ANN and GB in Brazil—can be attributed to disparities in financial markets, economic structures, and data characteristics. This variability underscores the necessity of context-specific model evaluation, as regional differences in macroeconomic indicators, market volatility, and data availability significantly influence predictive model effectiveness.
For instance,
Pagliaro (
2025) emphasizes that ML’s predictive power depends on varying market efficiencies, with AI able to exploit temporary inefficiencies in certain regions. He also highlights that incorporating macroeconomic and contextual variables improves forecasting, particularly in emerging markets with distinct financial structures.
6.1. Interpretability Considerations
This study has demonstrated the superior predictive accuracy of ML algorithms, particularly ANN and GB, in corporate credit rating prediction. However, an equally critical aspect of practical deployment is model interpretability. In financial applications, where credit ratings influence decisions related to capital allocation, regulatory compliance, and stakeholder confidence, the ability to explain model outputs is indispensable. A well-documented challenge in ML is the inherent trade-off between model complexity and interpretability (
Lipton 2018). While complex models like ANN and GB excel at capturing non-linear relationships within financial datasets, they often function as “black box” models, providing limited transparency about how predictions are derived. In contrast, simpler models such as LR or DT offer more transparent decision processes but may underperform in complex contexts like those analyzed in this study. Interpretability is essential for various reasons: regulatory compliance requires transparency and explainability (e.g.,
European Banking Authority 2021); model risk management relies on interpretability for effective validation and bias detection (SR 11-7); and stakeholder trust in credit ratings depends on confidence in model outputs. Moreover, interpretability aids in identifying and mitigating bias, thereby promoting fair and equitable outcomes (
Doshi-Velez and Kim 2017). Several approaches can enhance interpretability without sacrificing predictive power, including post hoc explainability tools like SHAP and LIME, model simplification through surrogate models, or adopting inherently interpretable models such as Generalized Additive Models (GAMs) or Explainable Boosting Machines (EBMs) (
Caruana et al. 2015). Both global (overall behavior) and local (individual prediction) explanations are crucial in financial decision-making. Although this study primarily focused on benchmarking predictive accuracy, future research should incorporate explainability techniques to improve model transparency, regulatory acceptability, and practical utility in corporate credit risk assessment.
6.2. Regulatory Considerations
While this study highlights the significant predictive advantages of ML algorithms in corporate credit rating prediction, it is essential to consider the regulatory implications associated with deploying such models in financial risk management. Regulatory authorities, including the
Basel Committee on Banking Supervision (
2022), the
European Banking Authority (
2021), and national regulators such as the Federal Reserve (SR 11-7), have articulated clear expectations regarding the transparency, interpretability, and governance of risk models.
One of the primary concerns is the opacity of complex ML models, often referred to as “black box” algorithms. Models such as ANN and GB, while demonstrating superior predictive accuracy in this study, lack the intrinsic interpretability required by regulatory frameworks. Financial institutions are expected to justify and explain credit decisions, especially when these decisions impact capital adequacy and loan origination practices. To align with regulatory expectations for explainability, techniques such as SHAP and LIME can be employed to provide transparent and understandable insights into model predictions (
Rudin 2019).
Additionally, regulators emphasize the need for robust Model Risk Management frameworks. According to the Federal Reserve’s SR 11-7 guidance, models must undergo comprehensive validation, back-testing, and stress testing to ensure their reliability under varying economic conditions. This requirement is particularly pertinent for ML models, which may be prone to overfitting or performance degradation in the presence of data shifts or regime changes in financial markets.
Data governance and bias mitigation represent further regulatory priorities. ML models are highly dependent on the quality and representativeness of input data. Poor data governance can lead to biased outcomes, undermining both model fairness and regulatory compliance. For instance, the proposed EU Artificial Intelligence Act mandates that high-risk AI systems, including those used in financial services, be subject to rigorous oversight to prevent discriminatory impacts. Thus, careful data pre-processing, feature selection, and bias audits are necessary steps when developing ML-based credit rating models.
Moreover, financial regulations such as Basel III link credit risk assessments directly to capital requirements, underscoring the importance of using models that are not only accurate but also compliant with regulatory standards. The EBA Guidelines on Loan Origination and Monitoring (
European Banking Authority 2021) explicitly recommend that models used for credit decisions be auditable, transparent, and capable of supporting sound credit risk practices.
In light of these considerations, while ML offers substantial potential to improve the efficiency and accuracy of credit rating prediction, its application in regulated financial environments must be accompanied by adherence to regulatory requirements for transparency, governance, and fairness. Future research should focus on the integration of Explainable AI (XAI) methods and the development of hybrid models that balance predictive power with interpretability. Additionally, collaboration between researchers, financial practitioners, and regulators is necessary to establish best practices for the safe and compliant deployment of ML in financial risk management.
7. Conclusions
This study evaluated the predictive performance of five ML models across multiple countries, yielding several key insights relevant to financial forecasting.
Predictive Performance Hierarchy: ANN consistently achieved the highest accuracy, reinforcing their capacity to model complex, non-linear relationships in financial data. Ensemble methods, including GB and RF, demonstrated strong predictive capabilities, further validating their effectiveness in financial applications.
Robustness of LR: Despite the increasing adoption of advanced ML techniques, LR exhibited competitive accuracy, underscoring its continued relevance as a benchmark model in financial prediction.
Cross-Country Variability: The observed variation in model performance across different countries highlights the potential influence of regional economic structures, financial market dynamics, and data characteristics on predictive accuracy.
These findings align with existing literature, supporting the superiority of modern ML approaches over traditional statistical methods for financial predictions. Future research should focus on improving model interpretability and incorporating additional economic indicators to further enhance predictive performance and practical applicability in diverse financial contexts.


