1. Introduction
Insurance and its regulation have been central issues in the fields of insurance and economics research.
Weiss and Choi (
2008) found that insurers in some states regulate rates in ways that are less efficient in terms of revenue and cost compared to those in competitive states.
Cummins et al. (
2001) found that market prices for automobile insurance are different between regulated and non-regulated states. These studies indicate that differences in state-level regulation in the marketplace can change the behavior of consumers and businesses. However, only a limited number of studies have examined whether regulations affect insurance demand.
The Japanese market for bicycle insurance is the best context in which to analyze the relationship between regulations and insurance demand. In Japan, there are already cases where compensation of around JPY 100 million has been awarded for bicycle accidents. In relation to these awards, the compulsory status of bicycle insurance has spread to other prefectures after it became compulsory in the Hyogo Prefecture in October 2015. As of 2024, 35 prefectures out of 47 have made it compulsory to purchase bicycle insurance.
The regulations in the US differ greatly from state to state on various matters, making the US a less desirable market for analyzing whether differences in regulations lead to differences in consumer behavior. However, Japan is a centralized state, and the discretion of each prefecture is largely restricted. Therefore, it is rare for laws and regulations to differ among prefectures, making regulations regarding bicycle insurance in some prefectures unique. What is particularly interesting is that although bicycle insurance has become compulsory in many prefectures, a considerable number of bicycle users still do not purchase it. Therefore, the Japanese market for bicycle insurance is a desirable environment for testing whether insurance demand differs in prefectures where purchasing insurance is compulsory compared to those where it is not. In addition, it is a suitable market to clarify whether people’s behaviors change simply after introducing compulsory membership, even without any penalties.
In this study, I also test other hypotheses. For example, consumers with a high level of insurance knowledge may be aware that accidents involving bicycles can result in payments of over JPY 100 million and, therefore, may be more likely to purchase bicycle insurance. I also examine whether consumers who use bicycles frequently purchase insurance.
In October 2024, I conducted a survey on bicycle use and its insurance coverage, taking into account “prefectures where bicycle insurance is mandatory” and “prefectures where bicycle insurance is not mandatory”. In addition, information on the characteristics of bicycle users who had insurance and those who did not was obtained from a total of 421 respondents. In this study, the method of obtaining data through questionnaire surveys enabled analyses that are not possible using conventional publicly available information, such as the status of bicycle insurance purchase, insurance knowledge, and the frequency of bicycle use.
As a result of the analysis undertaken based on this survey, in this study, I show that in prefectures where bicycle insurance is compulsory, users tend to purchase that insurance. In other words, even if there are no penalties for not buying insurance, the results indicate that making it compulsory has the effect of promoting the purchase of bicycle insurance. I also found that consumers with a high level of insurance knowledge tend to purchase bicycle insurance. Furthermore, the results indicate that people who use bicycles frequently tend to purchase insurance.
This study contributes to the existing research in two ways. First, to my knowledge, it is one of the first studies on mandatory insurance for micromobility vehicles. While automobile insurance is mandatory in many countries and violations are subject to fines, bicycle insurance is not mandatory. This study clarifies who is most likely to purchase insurance if mandatory insurance without penalties is introduced for the many micromobility vehicles that exist around the world. Second, this is one of the first studies to clearly show that consumers with insurance knowledge tend to purchase insurance. The results suggest that promoting insurance education will lead to an increase in the number of consumers who are able to adequately cover their risks.
The structure of this study is as follows: In
Section 2, I review the studies on insurance demand and present my hypothesis. In
Section 3, I introduce the data and methods used. In
Section 4, I provide the results and discuss them in some detail. Finally, I review the results and discuss their implications for future research.
2. Overview of Studies and Hypotheses
Studies have attempted to infer causality from changes in social institutions. For example,
Card and Krueger (
1994) surveyed 410 fast food restaurants in New Jersey and eastern Pennsylvania to examine the effects of New Jersey’s 1992 minimum wage increase from USD 4.25 to USD 5.05 per hour. The results of the study showed that, despite the increase in the minimum wage, employment did not decrease, and employment in fast food restaurants in New Jersey increased by 13%. In recent years,
Chambers et al. (
2019) found that regulations promoted higher consumer prices and that these price increases had a disproportionately negative effect on low-income households. In other words, the research shows how various systems across states and countries can affect people’s behavior.
Many studies have also been conducted on individual insurance demand.
Schlesinger (
2000) presented basic theoretical models of insurance demand in a one-period expected utility setting, and the effects of coinsurance and deductible insurance were examined.
Liang et al. (
2023) studied insurance demand via a two-period framework in which an individual faced risks in both current and future periods as a result of introducing savings. In a recent empirical study on household insurance demand,
Wang et al. (
2024) found that people were more likely to buy commercial insurance in later life after a famine. In addition,
Dionne and Liu (
2021) found that with industry commitment, the addition of an experience-rated premium based on past claims and traffic violations reduced the number of claims by 12%.
There have been several studies on compulsory insurance
1.
Faure (
2006) suggested that the major argument in favor of compulsory liability insurance is the insolvency of the potential injurer and that the moral hazard problem cannot be addressed if insurance is not sufficiently available. Therefore, making insurance compulsory may create more problems than it solves. Moreover, it is argued that a major disadvantage of compulsory insurance is that it may make governments too dependent on the insurance market
2. In other words, compulsory insurance seems to have both positive and negative aspects.
By using data obtained from experiments,
Mol et al. (
2020) found that investments in damage-reducing measures increased when the expected value of the damage increased under conditions of compulsory insurance coverage for low-probability/high-impact risk.
Osberghaus et al. (
2023) found that compulsory flood insurance did not undermine citizens’ support for public flood risk reduction. While previous empirical studies have largely highlighted the positive aspects of mandatory insurance, empirical research on mandatory insurance for vehicles, such as automobiles and bicycles, is limited to studies such as that by
Kim (
2021), despite its importance. Therefore, in this study, data on bicycle insurance in Japan were used to clarify how mandatory bicycle insurance (without penalties) affects the purchase of bicycle insurance.
Following these previous studies, I employ variables and attempt to clarify whether regulatory differences among Japanese prefectures, such as “prefectures with mandatory bicycle insurance” and “prefectures without mandatory bicycle insurance”, have an effect on the uptake of bicycle insurance. Japan’s Ministry of Land, Infrastructure, Transport and Tourism’s Headquarters for Promotion of Bicycle Use states in its “Current Situation Concerning Compensation for Damage Caused by Bicycle Accidents” (29 March 1991) that the subscription rate for bicycle insurance has increased in municipalities that require it, and that promoting subscription through ordinances is effective. On the other hand, since there are no penalty provisions in bicycle insurance, making it compulsory may not have any effect when other factors are controlled for. In other words, since there is not necessarily any agreement on the effectiveness of compulsory bicycle insurance, verification through empirical analyses of its effect is needed. Therefore, the first hypothesis of this study is as follows:
Hypothesis 1. Users are more likely to have bicycle insurance in prefectures where it is compulsory.
Lusardi and Mitchell (
2014) surveyed the research on financial literacy around the world and found that women had lower levels of financial knowledge.
Sekita (
2011) also used Japanese data to show that consumers with lower levels of financial knowledge were less prepared for old age.
van Rooij et al. (
2012) found that those with low literacy were much less likely to invest in stocks. In other words, it is clear that the amount of financial knowledge people have influences their financial choices.
Tennyson (
2011) conducted a survey of American consumers and identified factors that determine insurance knowledge, such as the fact that men have a higher level of insurance knowledge than women. However, there is still much that is not clear about the impact of insurance knowledge on consumer behavior.
Therefore, in this study, I attempt to clarify whether the level of insurance knowledge has an effect on the decision to purchase a bicycle insurance policy. The second hypothesis of this study is as follows:
Hypothesis 2. Bicycle users with a high level of insurance knowledge are more likely to purchase an insurance policy.
Generally, in the case of automobile insurance, the longer the annual mileage, the higher the insurance premium. In other words, it can be assumed that the longer the annual mileage, the higher the likelihood of accidents. Additionally, according to
Cohen and Dehejia (
2004), states with higher traffic accident rates tend to have higher insurance enrollment rates. It is expected that higher bicycle usage frequency will lead to higher accident rates and encourage the purchase of bicycle insurance. Therefore, the third hypothesis of this study is as follows:
Hypothesis 3. The more frequently a person uses a bicycle, the more likely they are to purchase bicycle insurance.
3. Data and Methodology
3.1. Data
From 11 to 22 October 2024, I commissioned My Voice Inc. to survey insurance use for bicycles, mopeds, and motorcycles. The sample consisted of responses from individuals who agreed to have their responses analyzed in a manner that does not identify them personally for use in academic research. According to the 2024 Information and Communications White Paper, the internet usage rate (individuals) in 2023 was 86.2%, making this sample representative of the overall situation in Japan.
The classification of whether bicycle insurance is compulsory or not is valid as of April 2024. There were 421 responses from bicycle users. The sample comprised 200 from the 12 prefectures where bicycle insurance is not compulsory and 221 from the remaining 35 prefectures where bicycle insurance is compulsory. In addition to asking about whether they had bicycle insurance and their knowledge of insurance, I also asked about the amount of compensation and how often they use their bicycle.
Following the main survey, for example, the rate of subscription was found to be 54.4% (including subscriptions to personal liability insurance, etc.). In a survey conducted by My Voice Communications itself in July 2024, “Questionnaire Survey on Bicycle Insurance (3rd)”, out of 9227 respondents, 61.8% of bicycle users (approximately 45% of the total) responded that they had insurance, so the response rate of this study was not different from the rate of the survey. In other words, the results of this survey are not based on biased data.
Among the 221 respondents who had bicycle insurance, 37 (16.7%) had coverage of JPY 10 million or less, 50 (22.6%) had coverage between JPY 10 million and JPY 100 million, 13 (5.9%) had coverage of JPY 300 million or less, 35 people (15.9%) had unlimited coverage, and 86 people (38.9%) responded “I don’t know.” In reality, most bicycle insurance policies have a coverage amount of JPY 100 million and a similar insurance premium. Since purchasing personal liability insurance is a mechanism for covering bicycle accidents, this study also conducted tests based on scenarios in which the risk of bicycle accidents is covered (bicycle insurance + personal liability insurance).
3.2. Methodology and Dependent Variables
In this study, I used a probit model, a logit model, and ordinary least squares (OLS). In a survey conducted in October 2024, the respondents were asked to select one option that best described their bicycle usage. Those who responded “electric assist bicycles (owned by oneself, family, friends, or close acquaintances)” or “bicycles other than electric assist bicycles (owned by oneself, family, friends, or close acquaintances)” were defined as bicycle users. Those who responded “do not use bicycles” were defined as non-bicycle users. In this study, bicycle users were primarily analyzed as the target population.
Table 1 shows the descriptive statistics of the variables used in this study. In response to the question, “Please select the most appropriate option regarding your bicycle insurance status,” 71.2% of respondents answered, “I have continuously purchased bicycle insurance (personal liability insurance) since purchasing my bicycle,” and 28.8% answered, “I did not purchase insurance when I purchased my bicycle, but I am currently insured.” These respondents were defined as “bicycle insurance purchasers.” Of those who used bicycles, the percentage who had insurance (including personal liability insurance) was 54.4%. The variable used as the explanatory variable was one if the person had bicycle insurance and zero if they did not.
Table 2 compares the percentage of bicycle insurance policyholders in prefectures where bicycle insurance is not mandatory with the percentage of bicycle insurance policyholders in prefectures where bicycle insurance is mandatory. In prefectures where bicycle insurance is not mandatory, the percentage was 48.0%, while in prefectures where bicycle insurance is mandatory, the percentage was 60.2%, indicating that there is a tendency for more people to purchase bicycle insurance in prefectures where it is mandatory.
3.3. Independent Variables
First, in order to consider the effect of compulsory insurance on bicycle users, I divided the users into two categories: “35 prefectures where bicycle insurance is compulsory” and “12 prefectures where bicycle insurance is not compulsory (prefectures where there is a voluntary obligation or where compulsory insurance is not being considered)”
3. I then assigned a variable that had a value of one if the user lived in a prefecture where bicycle insurance is compulsory and zero if the user lived in a prefecture where bicycle insurance is not compulsory.
Second, I prepared the following six questions, based on
Tennyson (
2011), to measure insurance knowledge. Some of these questions were the same as those used by
Tennyson (
2011), while the remaining questions specific to property insurance knowledge were the same as those used by
Yamori (
2016). Since bicycle insurance is related to personal liability insurance, the questions were mainly about non-life insurance. In this study, the underlined answers are considered to be correct. The average number of correct answers was 2.8. I prepared easy questions with a correct answer rate of around 80% and difficult questions with a correct answer rate of around 20%. The insurance-related questions are listed below.
Generally speaking, people with older (cheaper) cars purchase less insurance than those with newer (more expensive) ones. Correct answer rate: 37.2%.
1. Correct. 2. Incorrect. 3. Don’t know.
Mopeds (motorized bicycles) do not need to purchase compulsory bicycle liability insurance. Correct answer rate: 79.0%.
1. Correct. 2. Incorrect. 3. Don’t know.
Insurance with a large deductible (the portion you pay out of your own pocket in the event of a loss) is a contract that always results in a loss because the amount paid out by the insurance company in the event of a loss is small. Correct answer rate: 50.9%.
1. Correct. 2. Incorrect. 3. Don’t know.
Insurance is a risk management tool that is suited to cases where the frequency of losses is low, but the severity of losses is high when they do occur. Correct answer rate: 71.1%.
1. Correct. 2. Incorrect. 3. Don’t know.
Fire insurance does not cover losses caused by strong winds such as typhoons (wind damage), so it is necessary to add a special clause. Correct answer rate: 19.6%.
1. Correct. 2. Incorrect. 3. Don’t know.
Earthquake insurance does not cover damage caused by tsunamis. Correct answer rate: 22%.
1. Correct. 2. Incorrect. 3. Don’t know.
Figure 1 shows the number of correct answers to the questions about insurance knowledge. The horizontal axis represents the number of correct answers. The most common outcome was that three questions were answered correctly.
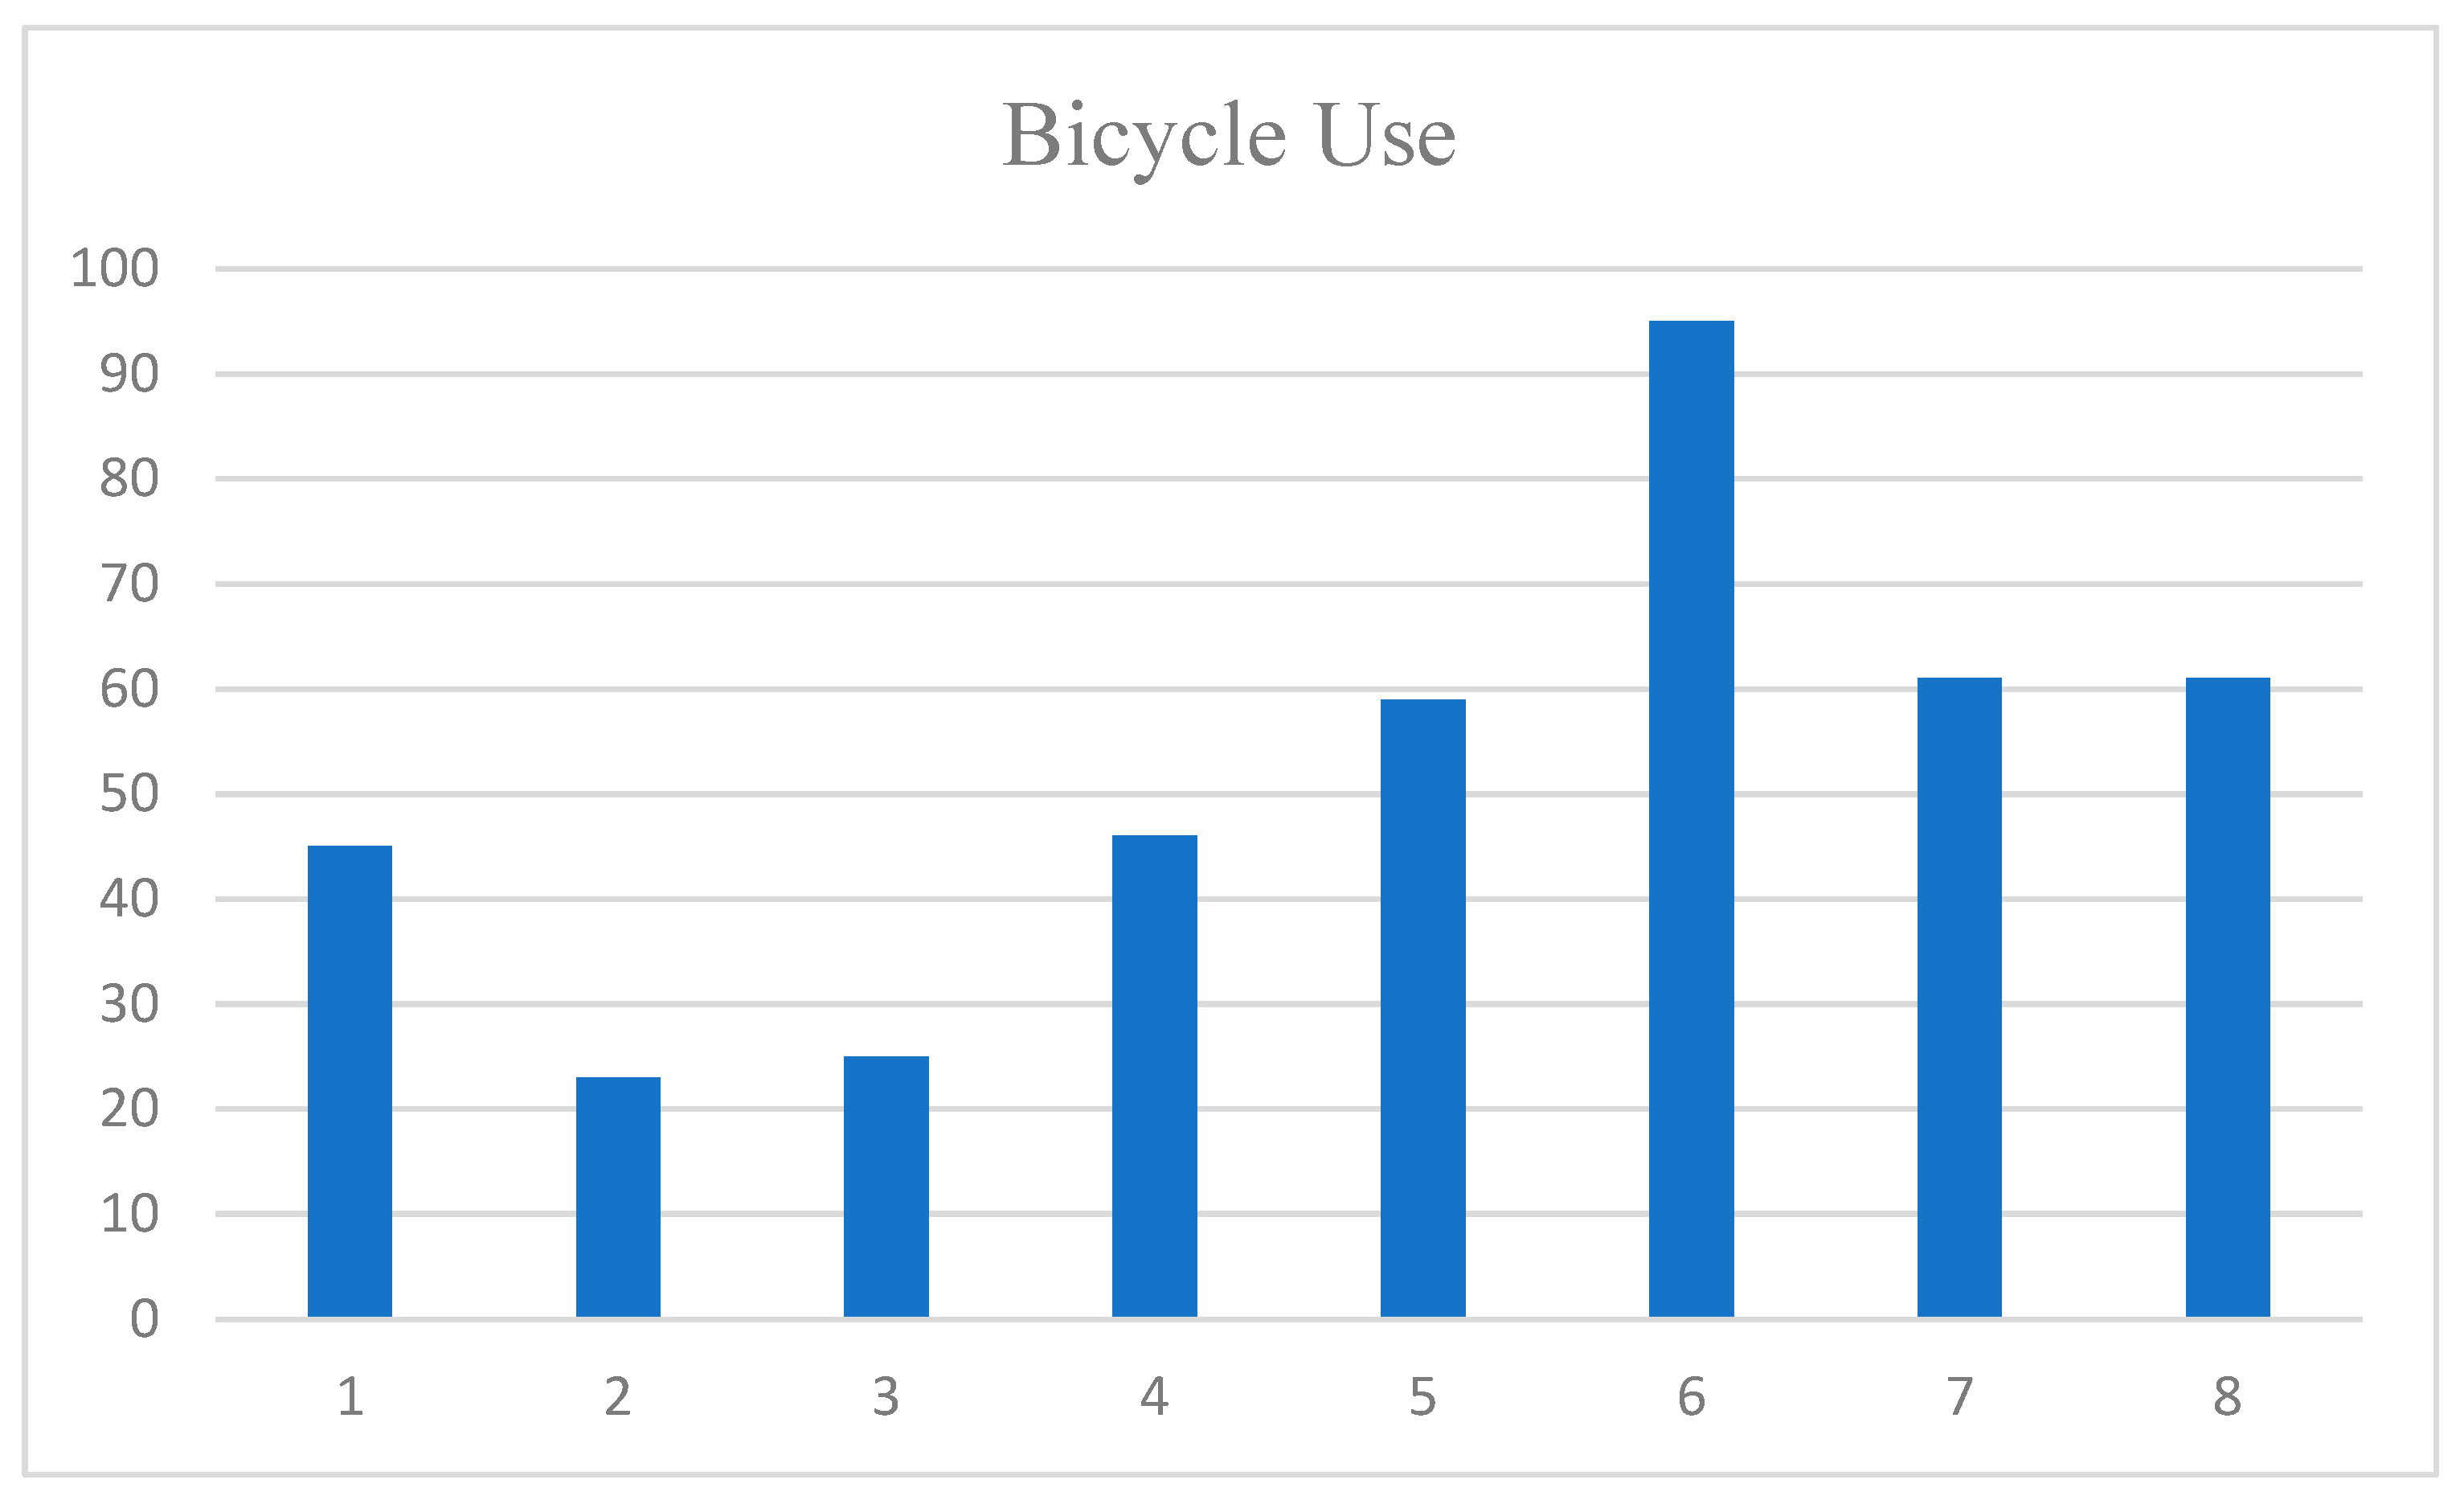
Third, I asked about the frequency of bicycle use by asking, “Please choose one answer from the following that best applies to you.” The options were “1. A few times a year, 2. A few times every six months, 3. Once a month, 4. A few times a month, 5. Once a week, 6. A few times a week, 7. Four or five times a week, 8. Almost every day (six or seven times a week),” with the response, “9. Don’t know” excluded.
Figure 2 indicates the number of times people ride bicycles. Except for those who ride several times a year, the distribution is fairly even.
The other variables were those that are often used in research into people’s insurance demand. For the question “Are you married?”, if the respondent answered, “I am married”, then the variable Married was set to one, and if not, then it was set to zero. For “personal annual income”, I prepared the following categories: 1. JPY 0 (none); 2. Less than JPY 1 million; 3. JPY 1–2 million; 4. JPY 2–3 million; 5. JPY 3–4 million; 6. JPY 4–5 million; 7. JPY 5–6 million; 8. JPY 6–7 million; 9. JPY 7–8 million; 10. JPY 8 ~9 million; 11. JPY 9 million~10 million; 12. JPY 10~15 million; 13. JPY 15 million or more.
Age is the age of the respondent. Education is a variable with six levels: 1. Junior high school; 2. High school; 3. Vocational school; 4. Junior college/technical college; 5. University; 6. Graduate school.
4. Results
4.1. Factors Involved in Purchasing Bicycle Insurance
The results in
Table 3 show that the coefficient for
Compulsory is positive and significant at the 1% level, supporting Hypothesis 1, according to which bicycle users in prefectures where insurance is compulsory are more likely to purchase it
4. The results also show that the sign and significance level of the coefficient are the same in the probit model, the logit model, and OLS. These results collectively show that there is a stronger tendency for bicycle users to purchase insurance in prefectures where it is compulsory.
Table 3 also shows that
Knowledge is positively significant. In other words, it shows that bicycle users with a high level of insurance knowledge are more likely to purchase bicycle insurance. Third, the results in
Table 3 show that
Times is significantly positive. In other words, the more frequently people use bicycles, the more likely they are to purchase that insurance.
Furthermore,
Married is significant at the 10% level, showing that married bicycle users are more likely to purchase insurance. That is, married people are more likely to have bicycle insurance
5.
Bernheim et al. (
2001) and
Lin and Grace (
2007) found that family composition affected insurance purchases, and the results of this study are consistent with those findings. Although there is often a positive relationship between insurance demand and income, in the case of bicycle insurance, the coefficient is positive, but no significant relationship can be confirmed. The coefficient for
Age is negative but not significant.
4.2. Robustness Tests
In the analysis presented in the previous section, I attempted to clarify the factors that influence people’s decision to purchase bicycle insurance, focusing on “bicycle users only”. However, in reality, individuals must first decide whether or not to use a bicycle, followed by whether or not to purchase bicycle insurance. Therefore, in this study, I conducted an analysis following the method of
Heckman (
1979), and the results of the analysis are shown in
Table 46.
The explanatory variables in the choice model for determining whether to use a bicycle were the same as those used in
Table 3. Specifically, I used
Marital status,
Age, and
Income, as used by
Yamada et al. (
2014) in the first stage. Similarly, the independent variables in the results model were Knowledge, Compulsory, and Times.
The results presented in
Table 4, when non-cyclists are added, show that the coefficients for
Compulsory,
Knowledge, and
Times are significant at the 1% level. In other words, the results of the analysis obtained in
Table 3 do not change even when non-cyclists are taken into account.
In addition, since endogeneity is possible, we conducted an analysis using instrumental variable methods. Education, Compulsory, Knowledge, Times, Married, Income, and Age were used as instrumental variables. According to the Sarga test, it is desirable for the p-value of the test statistic to be 10% or higher, and the results of this study show a p-value of 0.168, suggesting that the manipulative variables are exogenous.
Table 5 shows the results of the analysis. These results suggest that the coefficients for
Compulsory,
Knowledge, and
Times are significant at the 1% level. In addition, the coefficient for
Married is significant at the 10% level. Therefore, even when considering the issue of endogeneity, the results in
Table 3 remain unchanged.
Therefore, the following results have been confirmed to be robust. Bicycle users in prefectures where insurance is compulsory are more likely to purchase it, as are those with a high level of insurance knowledge. In addition, the more frequently people use bicycles, the more likely they are to purchase insurance.
There were 200 samples from prefectures where insurance is not mandatory and 221 samples from prefectures where insurance is mandatory.
5. Conclusions
In this study, I surveyed whether people had bicycle insurance as of October 2024 and attempted to clarify whether differences in regulations among prefectures, such as whether bicycle insurance is compulsory, affect whether people purchase it. I also attempted to clarify whether the level of insurance knowledge affects whether people purchase bicycle insurance and whether factors other than regulations influence whether people purchase bicycle insurance.
The results of this study’s analysis show the following. First, I found that in prefectures where bicycle insurance is compulsory, users tend to purchase it. I also found that bicycle users with a high level of insurance knowledge tend to purchase bicycle insurance. Therefore, promoting education on financial matters, including insurance, in high schools and other institutions may encourage the purchase of bicycle insurance. Furthermore, I found that consumers who use bicycles more frequently tend to purchase bicycle insurance.
The results of this study have the following implications. Even without penalties, the fact that bicycle insurance enrollment rates increase in prefectures where bicycle insurance is mandatory clearly shows that “mandatory enforcement” influences people’s behavior and has a positive effect on the spread of bicycle insurance. On the other hand, the fact that enrollment rates are far from 100% without penalties suggests that “mandatory enforcement without penalties” has its limits. The results of this study have important implications for the relationship between insurance and behavioral prompts and may provide insights for the design of other insurance systems, such as health insurance.
The issues and future prospects of this research are as follows. Since this study employed only one data period, it was not possible to perform DID (difference-in-difference) analysis, but if the data can be expanded in the future, it will be possible to perform additional analysis. In addition, the analysis was based on a sample of bicycle users in prefectures where bicycle insurance is compulsory (221 people) and prefectures where it is not (200 people), but the population structures of the two groups differ from that of the general population, so the results may not accurately reflect the population as a whole. In future research, it will be necessary to confirm the results of this study based on large-scale data that accurately reflect the population structure of each prefecture.


