Forecasting Volatility of the Nordic Electricity Market an Application of the MSGARCH
Abstract
1. Introduction
2. Literature Review
3. Nordic Electricity Markets and Data
3.1. Nordic Electricity Markets
3.2. The Data
4. Methodology
4.1. Regime-Switching GARCH Models
4.2. State Dynamic
4.3. Conditional-Variance Dynamics
4.4. Conditional Distribution
4.4.1. Normal Distribution
4.4.2. Model Computation
5. Empirical Findings
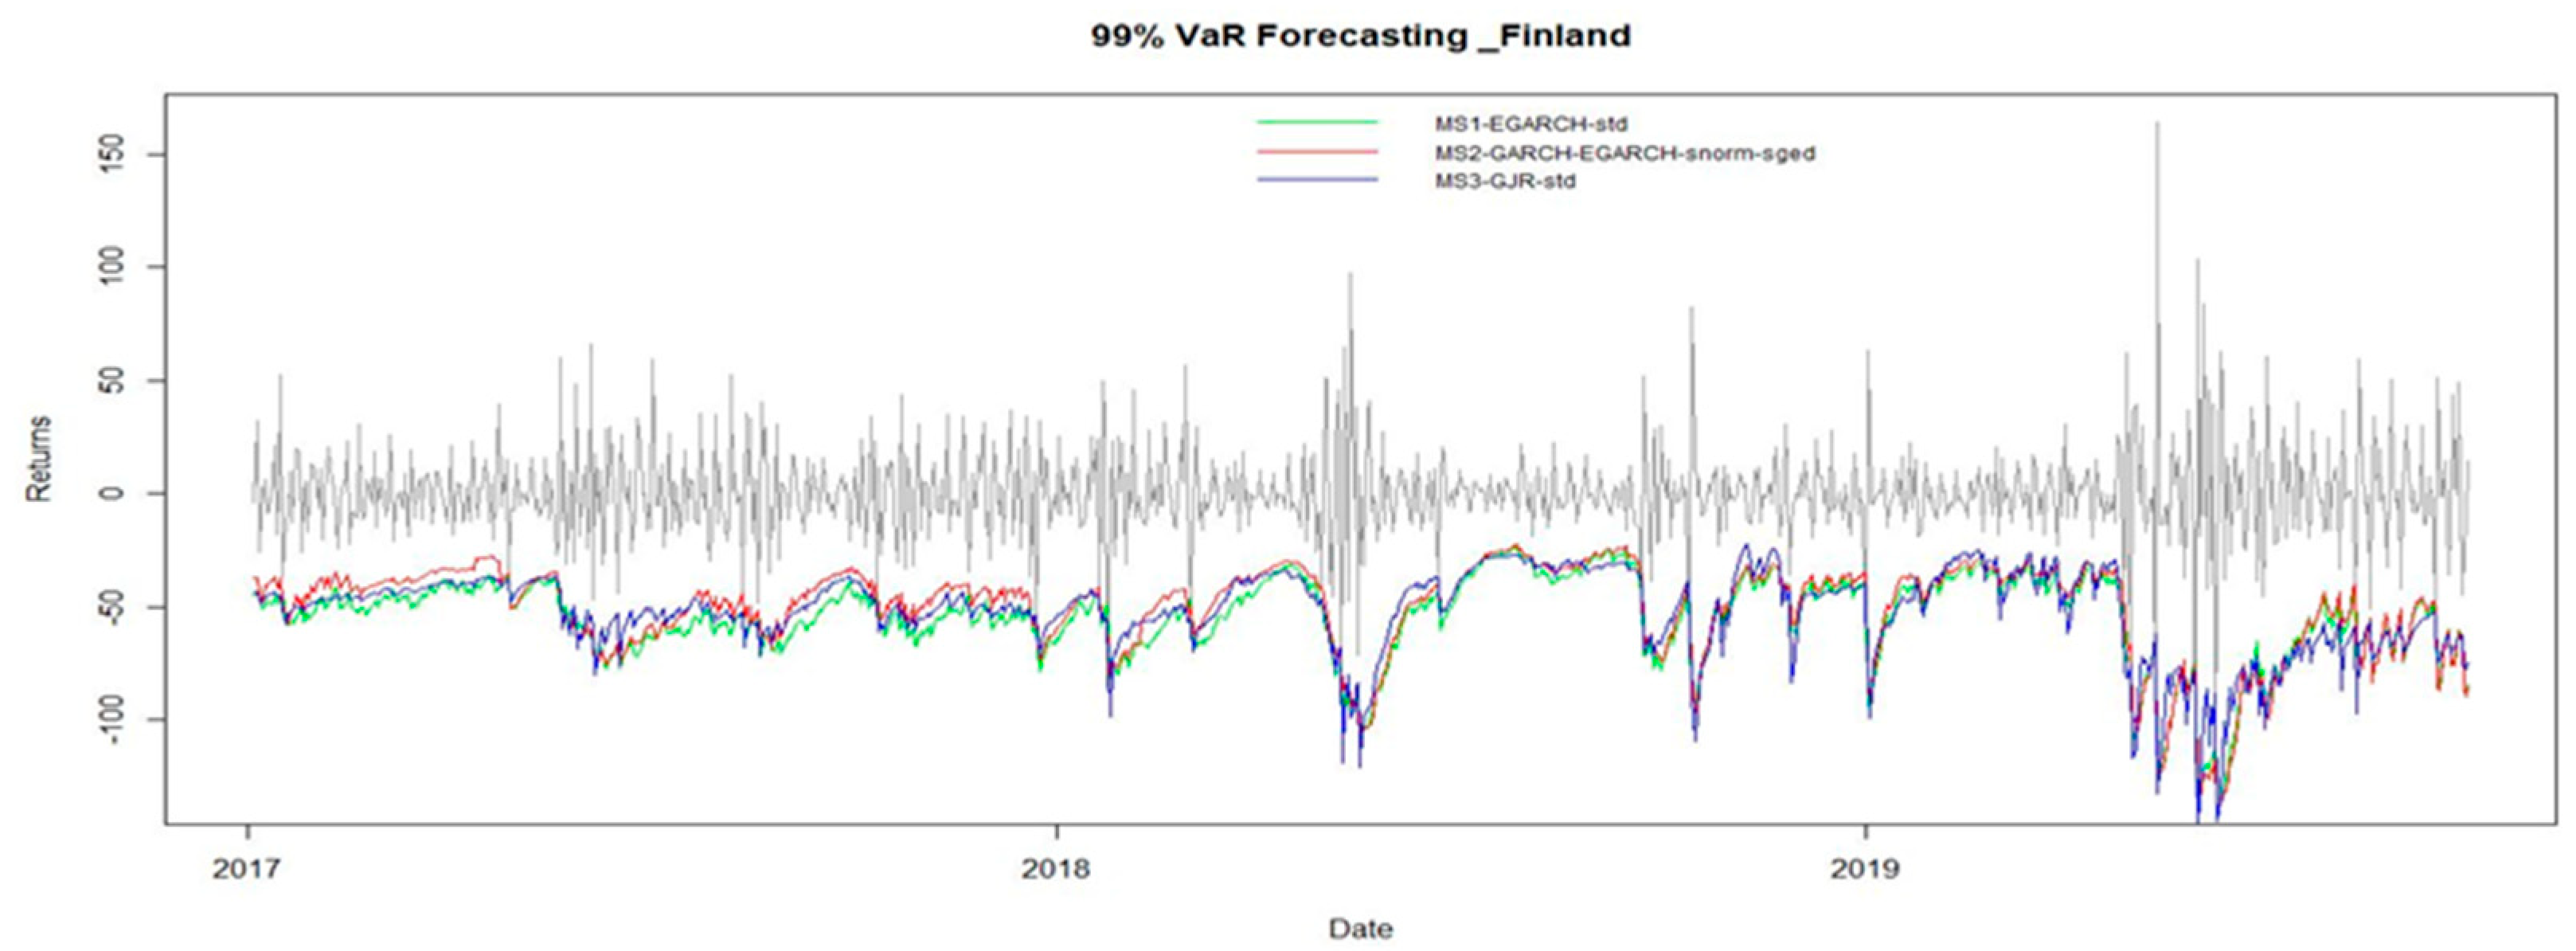
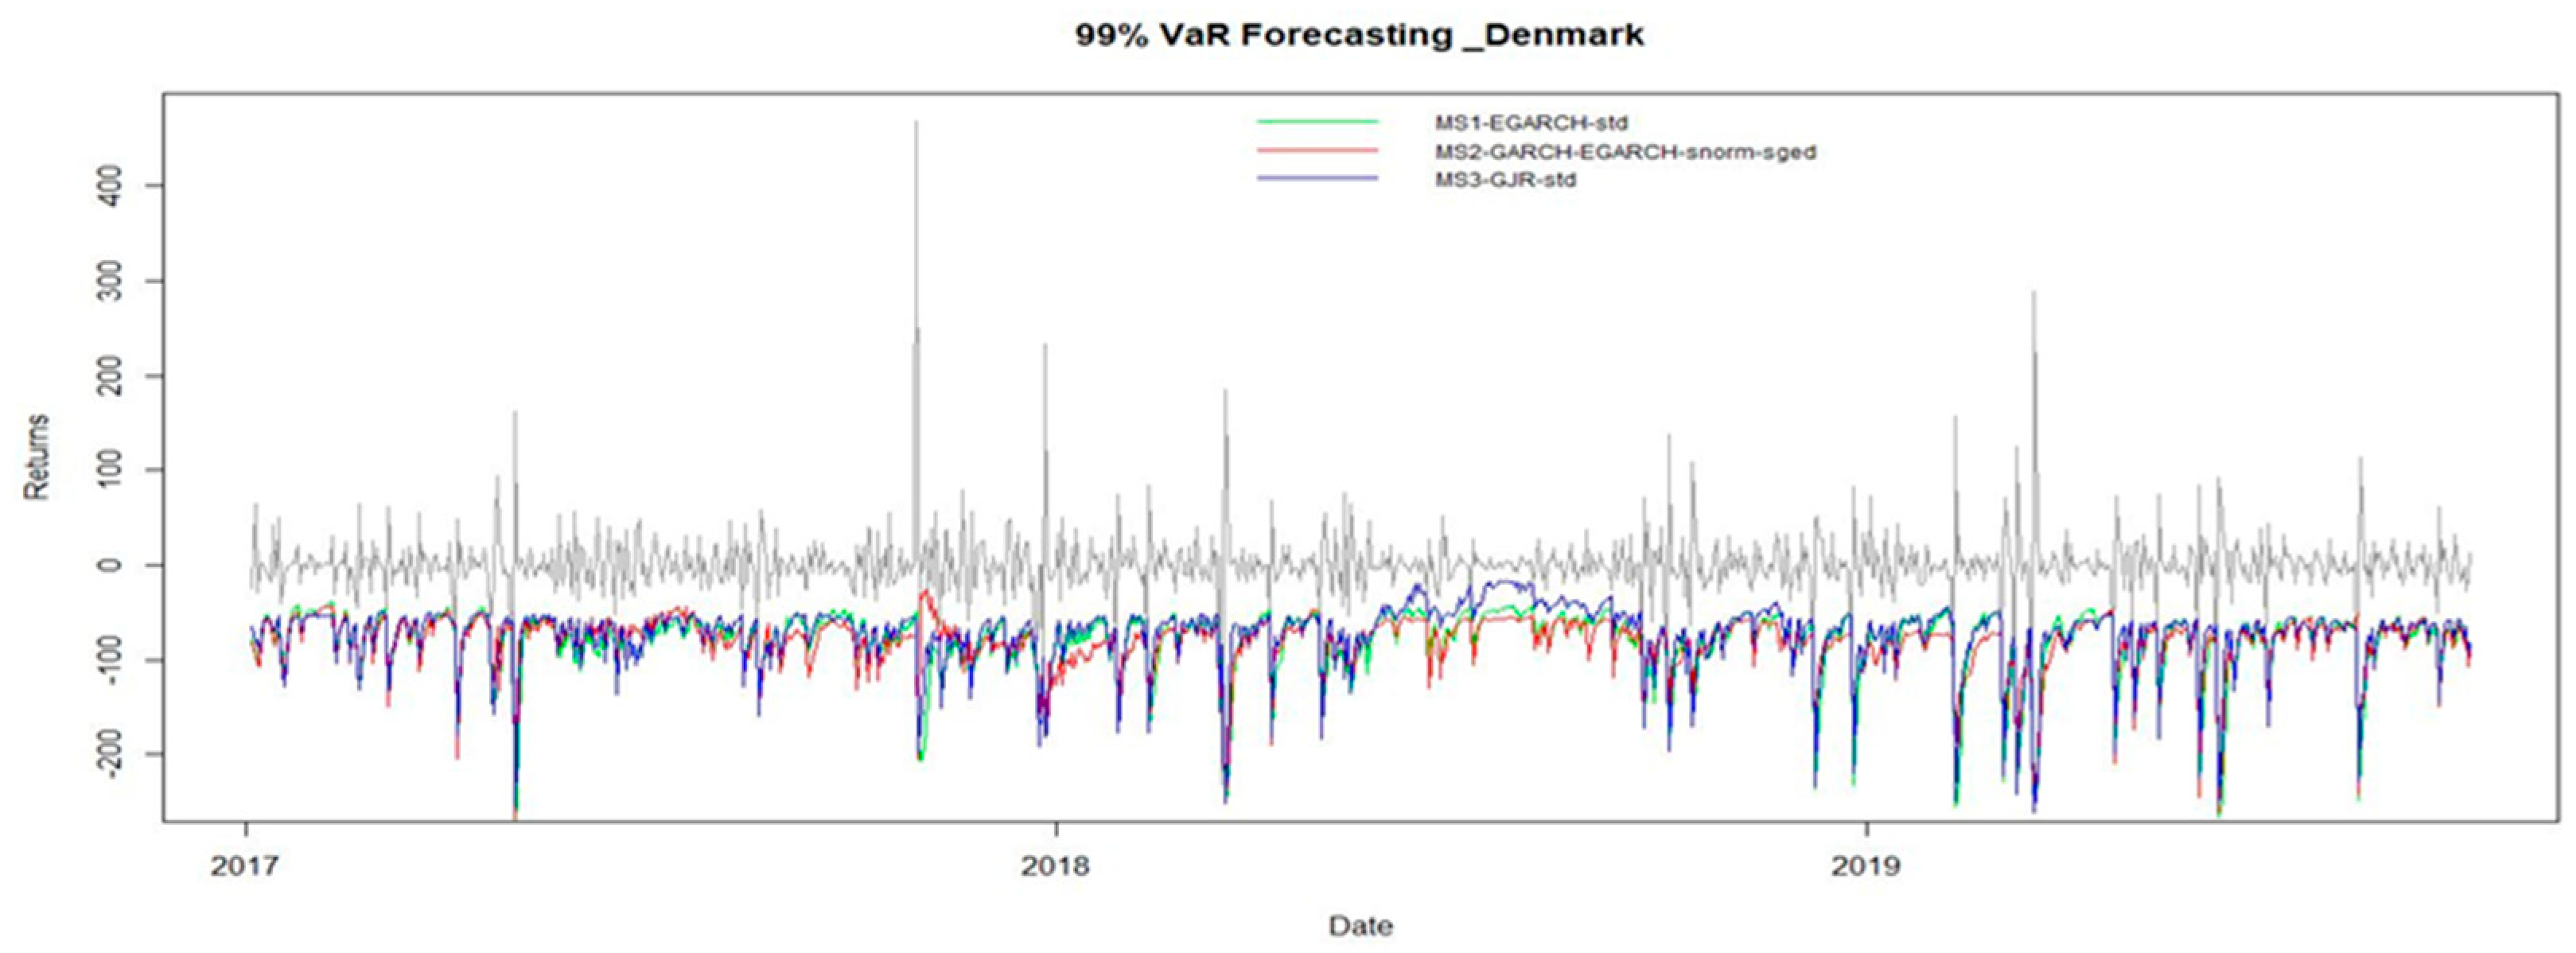
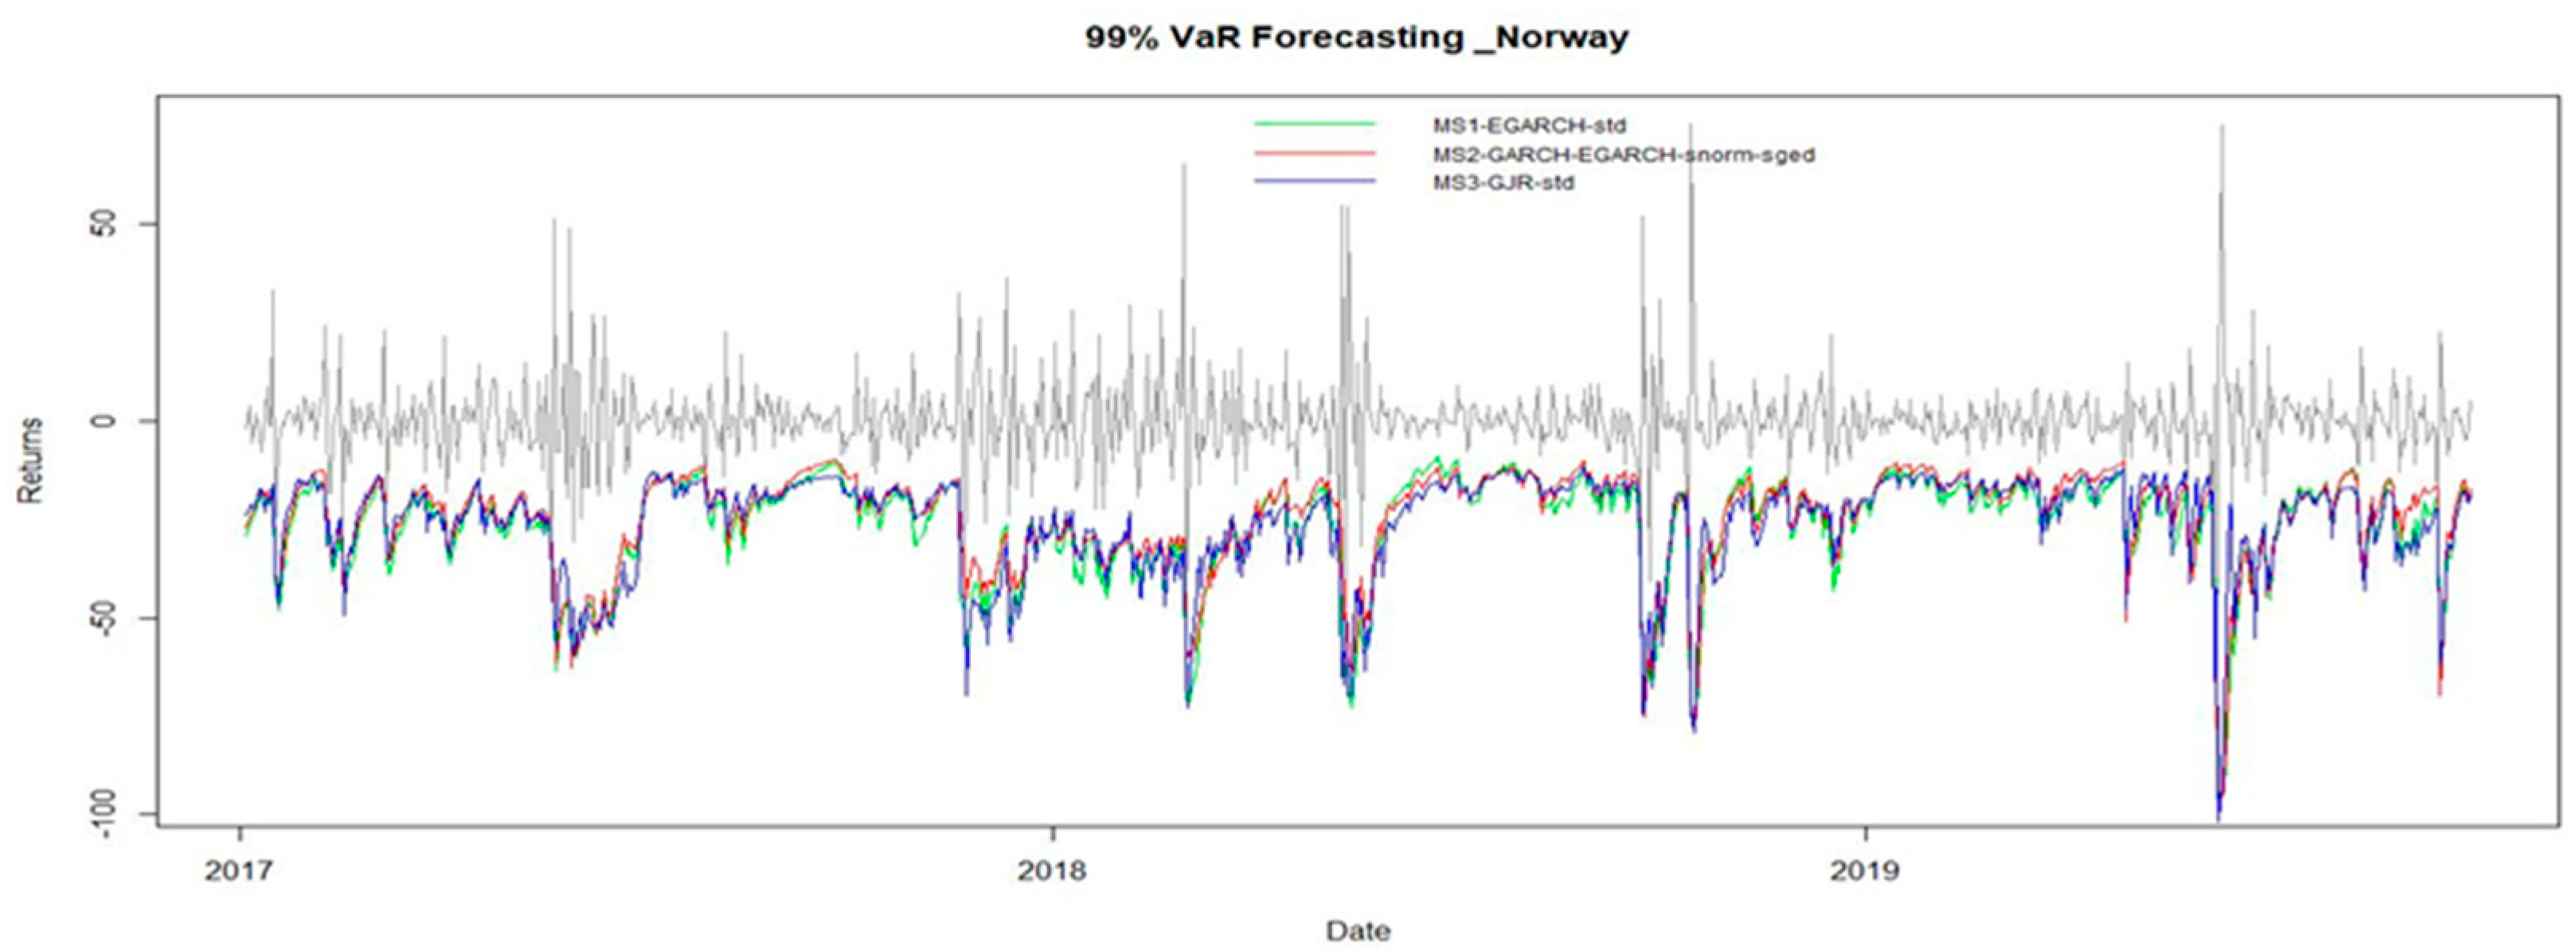
Insights from Value-at-Risk Analysis
6. Conclusions and Policy Implications
6.1. Discussion
6.2. Limitations and Future Research
Author Contributions
Funding
Data Availability Statement
Conflicts of Interest
| 1 | As mentioned below, the parametric construction of the continuous distribution can be diverse across regimes. The symbolization would be much suitable in this case. The same employ for the function in Equation (2). We have the simpler symbolization to progress readability. We initialize for t = 1, the regime possibilities and the conditional variance at their unrestricted stages as well. To shorten exposition, we apply in future for t = 1 the similar symbolization as for specific t, then there is no misperception possible. |
| 2 | Beginning values are chosen in the following manner: (1) construct the model’s static form with using the expectation maximization method; (2) using the Viterbi algorithm (Viterbi 1967), assign each observation to a different regime of the Markov chain, and aggregate the entire series into a single k-vector for each regime; (3) calculate the volatility using the quasi-maximum likelihood technique for each vector of deciphered observations; (4) Calculate the shape-parameter of the constrained distribution of the standardized decoded observation using machine learning. Through a thorough parameter-mapping function, covariance stationarity and positivity limitation are confirmed. |
References
- Andriosopoulos, Kostas, and Nikos Nomikos. 2013. Risk management in the energy markets and Value-at-Risk modelling: A hybrid approach. The European Journal of Finance 21: 548–74. [Google Scholar] [CrossRef]
- Ardia, David, Keven Bluteau, Kris Boudt, and Leopoldo Catania. 2018. Forecasting risk with Markov-switching GARCH models: A large-scale performance study. International Journal of Forecasting 34: 733–47. [Google Scholar] [CrossRef]
- Ardia, David, Keven Bluteau, Kris Boudt, Leopoldo Catania, and Denis-Alexandre Trottier. 2019. Markov-switching GARCH models in R: The MSGARCH package. Journal of Statistical Software 91: 1–38. [Google Scholar] [CrossRef]
- Amaro, Raphael, Carlos Pinho, and Mara Madaleno. 2022. Forecasting the Value-at-Risk of energy commodities: A comparison of models and alternative distribution functions. Applied Econometrics 65: 77–101. [Google Scholar] [CrossRef]
- Bollerslev, Tim. 1986. Generalized autoregressive conditional heteroskedasticity. Journal of Econometrics 31: 307–27. [Google Scholar] [CrossRef]
- Cai, Jun. 1994. A Markov model of switching-regime ARCH. Journal of Business & Economic Statistics 12: 309–16. [Google Scholar]
- Chen, Yi-kuang, Anne Hexeberg, Knut Einar Rosendahl, and Torjus F. Bolkesjø. 2021. Long-term trends of Nordic power market: A review. Wiley Interdisciplinary Reviews: Energy and Environment 10: e413. [Google Scholar] [CrossRef]
- Christie, Andrew A. 1982. The stochastic behavior of common stock variances: Value, leverage and interest rate effects. Journal of Financial Economics 10: 407–32. [Google Scholar] [CrossRef]
- Christoffersen, Peter F. 1998. Evaluating interval forecasts. International Economic Review 39: 841–62. [Google Scholar] [CrossRef]
- Cifter, Atilla. 2013. Forecasting electricity price volatility with the Markov-switching GARCH model: Evidence from the Nordic electric power market. Electric Power Systems Research 102: 61–67. [Google Scholar] [CrossRef]
- Dhingra, Barkha, Shallu Batra, Vaibhav Aggarwal, Mahender Yadav, and Pankaj Kumar. 2024. Stock market volatility: A systematic review. Journal of Modelling in Management 19: 925–52. [Google Scholar] [CrossRef]
- Dong, Shuaili, Hailong Li, Fredrik Wallin, Ander Avelin, Qi Zhang, and Zhixin Yu. 2019. Volatility of electricity price in Denmark and Sweden. Energy Procedia 158: 4331–37. [Google Scholar] [CrossRef]
- Engle, Robert F. 1982. Autoregressive conditional heteroscedasticity with estimates of the variance of United Kingdom inflation. Econometrica: Journal of the Econometric Society 50: 987–1007. [Google Scholar] [CrossRef]
- Engle, Robert F., and Simone Manganelli. 2004. CAViaR: Conditional autoregressive value at risk by regression quantiles. Journal of Business & Economic Statistics 22: 367–81. [Google Scholar]
- Franses, Philip Hans, and Dick Van Dijk. 1996. Forecasting stock market volatility using (non-linear) Garch models. Journal of Forecasting 15: 229–35. [Google Scholar] [CrossRef]
- Glosten, Lawrence R., Ravi Jagannathan, and David E. Runkle. 1993. On the relation between the expected value and the volatility of the nominal excess return on stocks. The Journal of Finance 48: 1779–801. [Google Scholar] [CrossRef]
- Gray, Stephen F. 1996. Modeling the conditional distribution of interest rates as a regime-switching process. Journal of Financial Economics 42: 27–62. [Google Scholar] [CrossRef]
- Haas, Markus, Stefan Mittnik, and Marc S. Paolella. 2004a. A new approach to Markov-switching GARCH models. Journal of Financial Econometrics 2: 493–530. [Google Scholar] [CrossRef]
- Haas, Markus, Stefan Mittnik, and Marc S. Paolella. 2004b. Mixed normal conditional heteroskedasticity. Journal of Financial Econometrics 2: 211–50. [Google Scholar] [CrossRef]
- Hamilton, James D. 1989. A new approach to the economic analysis of nonstationary time series and the business cycle. Econometrica: Journal of the Econometric Society 57: 357–84. [Google Scholar] [CrossRef]
- Hamilton, James D. 1994. Time Series Econometrics. Princeton: Princeton University Press. [Google Scholar]
- Hamilton, James D., and Raul Susmel. 1994. Autoregressive conditional heteroskedasticity and changes in regime. Journal of Econometrics 64: 307–33. [Google Scholar] [CrossRef]
- Hasanov, Akram Shavkatovich, Robert Brooks, Sirojiddin Abrorov, and Aktam Usmanovich Burkhanov. 2024. Structural breaks and GARCH models of exchange rate volatility: Re-examination and extension. Journal of Applied Econometrics 39: 1403–7. [Google Scholar] [CrossRef]
- Hillebrand, Eric. 2005. Neglecting parameter changes in GARCH models. Journal of Econometrics 129: 121–38. [Google Scholar] [CrossRef]
- Kim, Chang-Jin, and Charles R. Nelson. 1999. Has the US economy become more stable? A Bayesian approach based on a Markov-switching model of the business cycle. Review of Economics and Statistics 81: 608–16. [Google Scholar] [CrossRef]
- Kosater, Peter, and Karl Mosler. 2006. Can Markov regime-switching models improve power-price forecasts? Evidence from German daily power prices. Applied Energy 83: 943–58. [Google Scholar] [CrossRef]
- Londoño, Adriana A., and Juan D. Velásquez. 2023. Risk Management in Electricity Markets: Dominant Topics and Research Trends. Risks 11: 116. [Google Scholar] [CrossRef]
- Loutfi, Ahmad Amine, Mengtao Sun, Ijlal Loutfi, and Per Bjarte Solibakke. 2022. Empirical study of day-ahead electricity spot-price forecasting: Insights into a novel loss function for training neural networks. Applied Energy 319: 119182. [Google Scholar] [CrossRef]
- Marcucci, Juri. 2005. Forecasting Stock Market Volatility with Regime-Switching GARCH Models. Studies in Nonlinear Dynamics & Econometrics 9. [Google Scholar] [CrossRef]
- McNeil, Alexander J., Rüdiger Frey, and Paul Embrechts. 2015. Quantitative Risk Management: Concepts, Techniques and Tools-Revised Edition. Princeton: Princeton University Press. [Google Scholar]
- Naeem, Muhammad, Aviral Kumar Tiwari, Sana Mubashra, and Muhammad Shahbaz. 2019. Modeling volatility of precious metals markets by using regime-switching GARCH models. Resources Policy 64: 101497. [Google Scholar] [CrossRef]
- Nelson, Daniel B. 1991. Conditional heteroskedasticity in asset returns: A new approach. Econometrica: Journal of the Econometric Society 59: 347–70. [Google Scholar] [CrossRef]
- Peña, Juan Ignacio, Rosa Rodríguez, and Silvia Mayoral. 2020. Tail risk of electricity futures. Energy Economics 91: 104886. [Google Scholar] [CrossRef]
- Queiroz, Rhenan G. S., and Sergio A. David. 2023. Performance of the Realized-GARCH Model against Other GARCH Types in Predicting Cryptocurrency Volatility. Risks 11: 211. [Google Scholar] [CrossRef]
- Ren, Xiaohang, Jingyao Li, Feng He, and Brian Lucey. 2023. Impact of climate policy uncertainty on traditional energy and green markets: Evidence from time-varying granger tests. Renewable and Sustainable Energy Reviews 173: 113058. [Google Scholar] [CrossRef]
- Shen, Zhiwei, and Matthias Ritter. 2016. Forecasting volatility of wind power production. Applied Energy 176: 295–308. [Google Scholar] [CrossRef]
- Szczygielski, Jan Jakub, and Chimwemwe Chipeta. 2023. Properties of returns and variance and the implications for time series modelling: Evidence from South Africa. Modern Finance 1: 35–55. [Google Scholar] [CrossRef]
- Teterin, Pavel, Robert Brooks, and Walter Enders. 2016. Smooth volatility shifts and spillovers in US crude oil and corn futures markets. Journal of Empirical Finance 38: 22–36. [Google Scholar] [CrossRef]
- Urom, Christian, Julien Chevallier, and Bangzhu Zhu. 2020. A dynamic conditional regime-switching GARCH CAPM for energy and financial markets. Energy Economics 85: 104577. [Google Scholar] [CrossRef]
- Vaissalo, Joonas Tapani. 2021. Volatility Dynamics Between EU ETS and Nordic Electricity Market. Available online: https://urn.fi/URN:NBN:fi-fe2021062139345 (accessed on 18 April 2024).
- Viterbi, Andrew. 1967. Error bounds for convolutional codes and an asymptotically optimum decoding algorithm. IEEE Transactions on Information Theory 13: 260–69. [Google Scholar] [CrossRef]
- Wu, Xiaofei, Shuzhen Zhu, and Junjie Zhou. 2020. Research on RMB Exchange Rate Volatility Risk Based on MSGARCH-VaR Model. Discrete Dynamics in Nature and Society 2020: 8719574. [Google Scholar] [CrossRef]
- Xiao, Yang. 2020. The risk spillovers from the Chinese stock market to major East Asian stock markets: A MSGARCH-EVT-copula approach. International Review of Economics & Finance 65: 173–86. [Google Scholar]
- Zhang, Yue-Jun, and Lu Zhang. 2015. Interpreting the crude oil price movements: Evidence from the Markov regime switching model. Applied Energy 143: 96–109. [Google Scholar] [CrossRef]
- Zhang, Yue-Jun, Ting Yao, Ling-Yun He, and Ronald Ripple. 2019. Volatility forecasting of crude oil market: Can the regime switching GARCH model beat the single-regime GARCH models? International Review of Economics & Finance 59: 302–17. [Google Scholar]
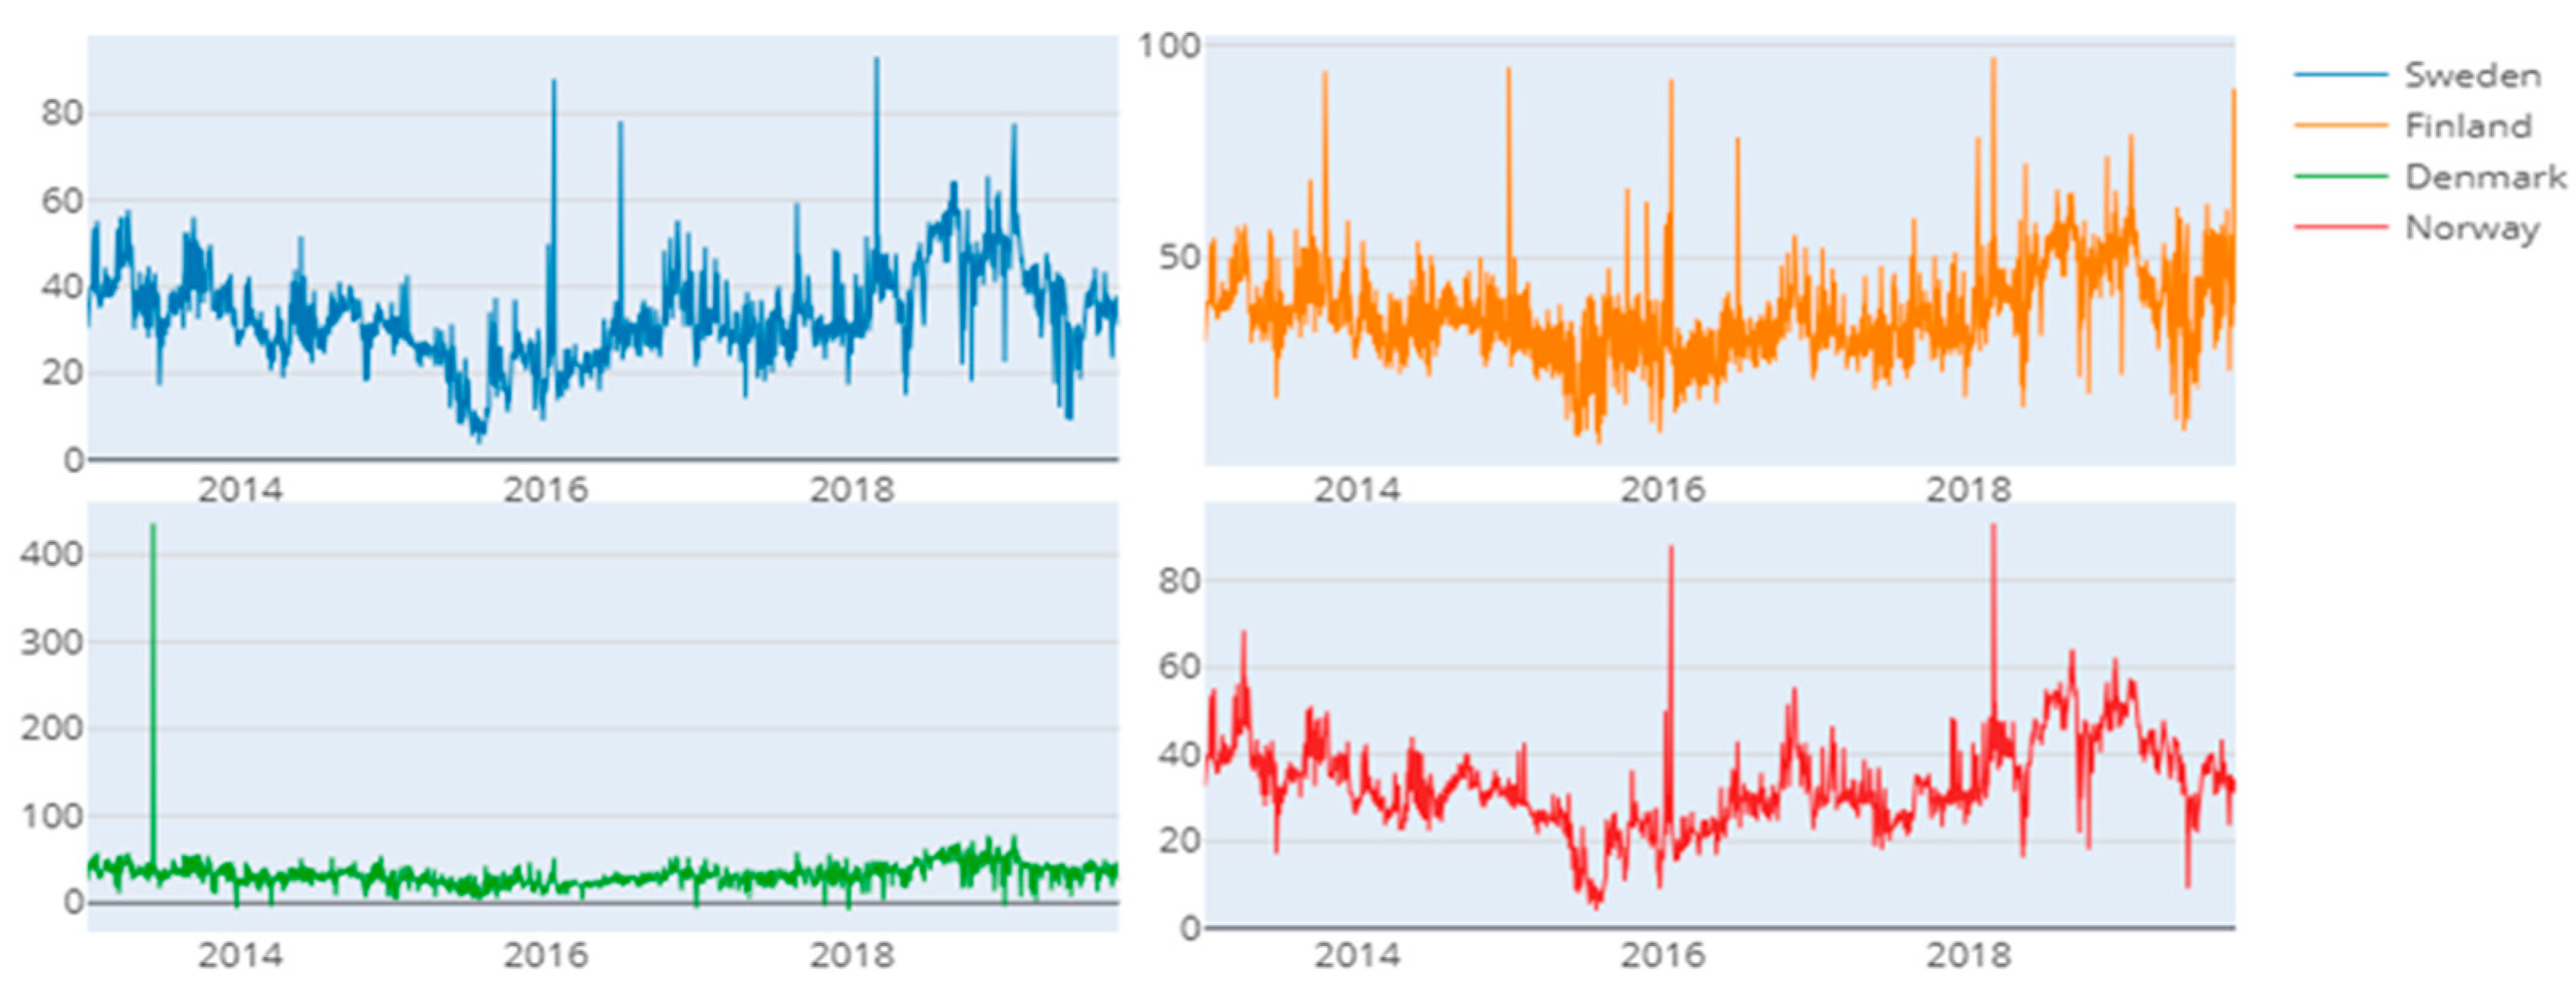


| Sweden | Finland | Denmark | Norway | |
|---|---|---|---|---|
| Mean | −0.001 | −0.006 | −0.001 | 0.001 |
| Variance | 22.363 | 57.109 | 181.8 | 13.519 |
| Skewness | −0.193 | −0.351 | 1.913 | −0.197 |
| Kurtosis | 14.061 | 7.405 | 557.987 | 29.801 |
| JB | 20,306.060 * | 5678.239 * | 31,953,708.792 * | 91,154.892 * |
| Q (10) | 228.909 * | 394.840 * | 360.922 * | 224.302 * |
| Q2(10) | 601.378 * | 292.904 * | 606.240 * | 646.738 * |
| ADF test | −57.5070 * | −57.1508 * | −52.4757 * | −70.5293 * |
| ARCH-LM | 406.2097 * | 104.1579 * | 448.5787 * | 148.8755 * |
| Countries | Sweden | Finland | Denmark | Norway |
|---|---|---|---|---|
| Models | GJR-GARCH | GJR-GARCH | GJR-GARCH | GJR-GARCH |
| (regime = 3) | (regime = 3) | (regime = 3) | (regime = 3) | |
| Distribution | std-std-std | std-std-std | std-std-std | std-std-std |
| Parameters | ||||
| Regime 1 | ||||
| α0–1 | 4.967 | 56.1902 | 15.2273 | 38.608 |
| (2.1194) | (16.398) | (11.1783) | (10.3523) | |
| α1–1 | 0.0229 | 0.0003 | 0.0057 | 0.3354 * |
| (0.018) | (0.0022) | (0.0147) | (0.1424) | |
| α2–1 | 0.0004 | 0.2394 | 0.1983 | 0.0002 |
| (0.003) | (0.153) | (0.2358) | (0.0032) | |
| β−1 | 0.9341 * | 0.3985 * | 0.8908 * | 0.2058 * |
| (0.0157) | (0.1345) | (0.012) | (0.1372) | |
| ν−1 | 9.7953 * | 4.2092 * | 11.0146 * | 3.7899 * |
| (4.5887) | (0.9195) | (6.6024) | (0.7265) | |
| Regime 2 | ||||
| α0–2 | 24.7002 | 2.9905 | 271.4789 | 10.7384 |
| (5.4427) | (2.3036) | (65.0001) | (2.4515) | |
| α1–2 | 0.0003 | 0.0002 | 0.0007 | 0 |
| (0.0161) | (0.0049) | (0.006) | (0.0007) | |
| α2–2 | 1.2908 * | 0.0228 | 1.666 * | 1.155 * |
| (0.1933) | (0.0171) | (0.1024) | (0.3097) | |
| β−2 | 0.2565 * | 0.9794 * | 0.1065 * | 0.3785 * |
| (0.0884) | (0.0082) | (0.052) | (0.0825) | |
| ν−2 | 3.6721 * | 4.3517 * | 3.0817 * | 3.717 * |
| (0.5427) | (0.7954) | (0.323) | (0.5421) | |
| Regime 3 | ||||
| α0–3 | 54.416 | 106.3726 | 24,841.56 | 107.0368 |
| (29.3901) | (58.0858) | (21,319.97) | (57.087) | |
| α1–3 | 0.0001 | 0 | 0.0595 | 0.195 |
| (0.0021) | (0.000) | (0.4527) | (0.1254) | |
| α2–3 | 0.1531 | 0.3466 * | 0.0007 | 0.0849 |
| (0.2441) | (0.1841) | (0.0043) | (0.152) | |
| β−3 | 0.9214 * | 0.7573 * | 0.0016 | 0.452 * |
| (0.006) | (0.0545) | (0.0103) | (0.1626) | |
| ν−3 | 99.9112 * | 3.9358 * | 73.042 | 4.4527 * |
| (1.2583) | (0.6558) | (416.7) | (0.9248) | |
| Probabilities | ||||
| ρ−1–1 | 0.9245 | 0.9865 | 0.974 | 0.986 |
| (0.4144) | (0.000) | (0.0091) | (0.0183) | |
| ρ−1–2 | 0.0345 | 0.007 | 0.0249 | 0.0032 |
| (0.1012) | (0.0062) | (0.3973) | (0.0052) | |
| ρ−2–1 | 0.0299 | 0 | 0.0089 | 0.0086 |
| (0.0236) | (0.0487) | (0.0423) | (0.0033) | |
| ρ−2–2 | 0.9615 | 0.9936 | 0.9827 | 0.9913 |
| (0.000) | (0.000) | (0.3201) | (0.0995) | |
| ρ−3–1 | 0.2813 | 0.009 | 0.0942 | 0.0095 |
| (0.0216) | (0.0448) | (0.0007) | (0.0063) | |
| ρ−3–2 | 0 | 0 | 0.6105 | 0.0085 |
| (0.1187) | (0.0444) | (0.0071) | (0.000) | |
| ρ−3–3 | 0.7187 | 0.9910 | 0.2953 | 0.9819 |
| AIC | 18,971.47 | 21,160.01 | 22,325.9007 | 17,421.9354 |
| BIC | 19,093.47 | 21,281.99 | 22,447.8926 | 17,543.9273 |
| LL | −9464.73 | −10,559.00 | −11,141.9504 | −8689.9677 |
| Test | CC Test | DQ Test | ||||||
|---|---|---|---|---|---|---|---|---|
| Country | Sweden | Finland | Denmark | Norway | Sweden | Finland | Denmark | Norway |
| Var 1% | ||||||||
| Regime 1 | 0.84 | 0.39 | 0.006 | 0.17 | 0.99 | 0.92 | 0.26 | 0.003 |
| Regime 2 | 0.16 | 0.05 | 0.003 | 0.02 | 0.84 | 0.34 | 0.079 | 0.00 |
| Regime 3 | 0.71 | 0.15 | 0.003 | 0.17 | 0.92 | 0.78 | 0.067 | 0.002 |
| Var 5% | ||||||||
| Regime 1 | 0.83 | 0.36 | 0.94 | 0.04 | 0.75 | 0.34 | 0.998 | 0.14 |
| Regime 2 | 0.85 | 0.33 | 0.28 | 0.07 | 0.81 | 0.25 | 0.995 | 0.09 |
| Regime 3 | 0.67 | 0.44 | 0.60 | 0.26 | 0.69 | 0.49 | 0.999 | 0.04 |
Disclaimer/Publisher’s Note: The statements, opinions and data contained in all publications are solely those of the individual author(s) and contributor(s) and not of MDPI and/or the editor(s). MDPI and/or the editor(s) disclaim responsibility for any injury to people or property resulting from any ideas, methods, instructions or products referred to in the content. |
© 2025 by the authors. Licensee MDPI, Basel, Switzerland. This article is an open access article distributed under the terms and conditions of the Creative Commons Attribution (CC BY) license (https://creativecommons.org/licenses/by/4.0/).
Share and Cite
Naeem, M.; Jassim, H.S.; Saleem, K.; Fatima, M. Forecasting Volatility of the Nordic Electricity Market an Application of the MSGARCH. Risks 2025, 13, 58. https://doi.org/10.3390/risks13030058
Naeem M, Jassim HS, Saleem K, Fatima M. Forecasting Volatility of the Nordic Electricity Market an Application of the MSGARCH. Risks. 2025; 13(3):58. https://doi.org/10.3390/risks13030058
Chicago/Turabian StyleNaeem, Muhammad, Hothefa Shaker Jassim, Kashif Saleem, and Maham Fatima. 2025. "Forecasting Volatility of the Nordic Electricity Market an Application of the MSGARCH" Risks 13, no. 3: 58. https://doi.org/10.3390/risks13030058
APA StyleNaeem, M., Jassim, H. S., Saleem, K., & Fatima, M. (2025). Forecasting Volatility of the Nordic Electricity Market an Application of the MSGARCH. Risks, 13(3), 58. https://doi.org/10.3390/risks13030058


