1. Introduction
The classical Cramér–Lundberg model, or the classical compound Poisson risk model, assumes that the surplus process of an insurance company follows the dynamics:
where
is the premium rate and
is a compound Poisson process, where
is a Poisson process with intensity
and claim sizes
are i.i.d. positive random variables independent of the Poisson process with
. One central question in the ruin theory is to study the ruin probability
, where
.
In recent years, there have been a lot of studies in the insurance and finance literature on the so-called dual risk model, see, e.g., (
Afonso et al. 2013;
Avanzi et al. 2013;
Avanzi et al. 2007;
Bayraktar and Egami 2008;
Cheung 2012;
Cheung and Drekic 2008;
Ng 2009,
2010;
Rodríguez-Martínez et al. 2015;
Yang and Sendova 2014), with wealth process following the dynamics:
where
is the cost of running the company and
, is the stream of profits, where
is a Poisson process with intensity
and
are i.i.d.
valued random variables with common probability density function
,
, independent of the Poisson process. The dual risk model is used to model the wealth of a venture capital, whose profits depend on the research and development. The classical risk model (
1) is most often interpreted as the surplus of an insurance company. On the other hand, the dual risk model (
2) can be understood as the wealth of a venture capital or high-tech company. The analogue of the premium in the classical model is the running cost in the dual model, and the claims become the future profits of the company. The ruin probability and the Laplace transform of the ruin time have been well studied for the dual risk model; see, e.g.,
Afonso et al. (
2013). When there is a random delay for the innovations turned to profits, the dual risk model becomes time-inhomogeneous and the ruin probabilities and the distribution of the ruin times are studied in
Zhu (
2017).
One of the most fundamental questions in the dual risk model is the optimal dividend strategy.
Avanzi et al. (
2007) worked on optimal dividends in the dual risk model where the optimal strategy is a barrier strategy.
Avanzi et al. (
2013) studied a dividend barrier strategy for the dual risk model, whereby dividend decisions are made only periodically, but still allow ruin to occur at any time. A dual model with a threshold dividend strategy with exponential interclaim times was studied in
Ng (
2009).
Afonso et al. (
2013) also worked on dividend problem in the dual risk model, assuming exponential interclaim times. A new approach for the calculation of expected discounted dividends was presented and ruin and dividend probabilities, number of dividends, time to a dividend, and the distribution for the amount of single dividends were studied. Dividend moments in the dual risk model were considered in
Cheung and Drekic (
2008). They derived integro-differential equations for the moments of the total discounted dividends which can be solved explicitly assuming the jump size distribution has a rational Laplace transform. The expected discounted dividends assuming the profits follow a Phase Type distribution were studied in
Rodríguez-Martínez et al. (
2015). The Laplace transform of the ruin time, expected discounted dividends for the Sparre–Andersen dual model were derived in
Yang and Sendova (
2014). More recently,
Yang et al. (
2020) obtained an explicit expression of the expected discounted discounted dividends in a dual risk model with the threshold dividend strategy and the optimal threshold level were derived.
Avanzi et al. (
2020) considered the optimal periodic dividend strategies for a general class of dual risk models with fixed transaction costs. In
Fahim and Zhu (
2022), they obtained the asymptotic analysis for optimal dividends in the dual risk model.
Liu et al. (
2023) studied the optimal dividend strategy for the dual model with surplus-dependent expense.
So far, the optimization problems studied in the literature on dual risk models have been almost exclusively devoted to the optimal dividend strategy. In this paper, we consider a different type of optimization problem. For a venture capital, or a high-tech company, the investment strategy on research and development (R&D) is crucial. A decision to increase the investment on research and development will increase the running cost of the company, but that will also boost the possibility of the future profits. Therefore, we believe that it is of fundamental interest to understand the optimal investment strategy to strengthen the position of the company.
It is well known that research and development is a basic engine of economic and social growth. It is a considerable amount of spending among many leading corporations in the world. A 2014 FORTUNE article listed the top ten biggest R&D spenders worldwide in the year 2013, including Volkswagen, Samsung, Intel, Microsoft, Roche, Novartis, Toyota, Johnson & Johnson, Google and Merck, with Intel spending as much as 20.1% of their revenue on R&D, see
Casey and Hackett (
2014). Many technology giants increase their R&D spending consistently, year over year, see, e.g.,
Table 1 for the R&D and percentage of the revenues of Alphabet, Amazon, Tesla in the years 2018–2021
1. Notice that in the case of Alphabet, even though the R&D expenditure increases year by year, it increases in line with the increase of the total revenues so that as the percentage of revenues, the number does not change much. The same can be said about Amazon. For some companies, both the absolute R&D expenditure amount and the percentage as the revenues remain reasonably stable, see, e.g.,
Table 1 for Merck in the years 2018–2021, with the year of 2020 being the only exception which witnessed an unusually high R&D expenditure. For some companies, both the absolute R&D expenditure amount and the revenues can change dramatically, see, e.g.,
Table 1 for Alphabet, Amazon, Tesla in the years 2018–2021. The case of Tesla is exceptional but not unusual for a new high-tech company in the sense that the total revenues has astronomical growth and the R&D expenditure as the percentage of revenues actually declines during this period even though it had a spectacular increase in R&D expenditure in the year of 2021. Another company that has enjoyed similar phenomenal growth as Tesla is Amazon, see
Table 1. However, Amazon’s overall growth is not as fast as Tesla.
Since it is expensed rather than capitalized, cuts on research and development increase profit in the short term, but they can hurt the strength of a company in the long run, even if the detrimental impact of the cuts may not be felt for a few years. In the most recent recession, firms with revenues greater than 100 million USD reduced their research and development intensity (divided by revenue) by 5.6%, even though the advertising intensity actually increased 3.4%, see
Marie Knott (
2012). In the long run, the research and development does help the company grow and increase the value of a company. Using a measure of the so-called research quotient, a study over all publicly traded US companies from 1981 through 2006 suggested that a 10% increase in research quotient results in an increase in market value of 1.1%, see
Marie Knott (
2012). Indeed, the US government also encourages the research and development activities. The Research & Experimentation Tax Credit is a general business tax credit passed by the Congress in 1981, as a response to the concerns that research spending declines had adversely affected the country’s economic growth, productivity gains, and competitiveness within the global marketplace. According to a study by Ernst & Young, in the year 2005, 17,700 US corporations claimed 6.6 billion USD R&D tax credits on their tax returns
2.
Optimal investment problems have a long history in finance and related fields. For example,
Merton (
1969,
1971) formulated and studied the problem of optimal allocation between risky assets and a risk-free asset to maximize expected utility;
Fleming and Zariphopoulou (
1991) considered the optimal investment and consumption problem where short-selling is not allowed but borrowing is allowed.
Davis (
1990), and
Shreve and Soner (
1994) studied optimal investment and consumption with proportional transaction costs and
Morton and Pliska (
1990) considered optimal portfolio management with fixed transaction costs.
Grossman and Zhou (
1993) studied optimal investment strategies for controlling drawdowns.
Fleming and Sheu (
2000) studied the optimal investment problem to maximize the long-term growth rate of expected utility of wealth.
Hipp and Plum (
2000) studied the optimal investment for insurers.
Carr et al. (
2001) considered the problem of optimal investment in a risky asset, and in derivatives written on the price process of this asset. Finally, there are also a limited number of works on the optimal venture capital investments, see, e.g.,
Bayraktar and Egami (
2008). However, to the best of our knowledge, the optimal investment in research and development for the dual risk model has never been studied in the previous literature, and our paper is the first one that considers this problem.
We propose to study the optimal investment strategy on research and development for the dual risk models to minimize the ruin probability of the underlying company. In addition to the investment in research and development, we will also allow the investment in a risky asset, e.g., a market index. The possibility that an insurer can invest part of the surplus into a risky asset to minimize the ruin probability was studied by
Browne (
1995) for the case that the insurance business is modeled by a Brownian motion with constant drift and the risky asset is modeled as a geometric Brownian motion. Later,
Hipp and Plum (
2000) studied the optimal investment in a market index for insurers in the classical compound Poisson risk model. We will study the optimal investment problem when both investment in research and development and investment in a risky asset are allowed. Unlike the problem of minimizing the ruin probability for an insurer in the classical risk model
Hipp and Plum (
2000), we will obtain closed-form formulas in the dual risk model.
Since the works of
Browne (
1995) and
Hipp and Plum (
2000), the optimal investment in the market for the classical risk model and related models have been extensively studied. In
Liu and Yang (
2004), they generalized the works by
Hipp and Plum (
2000) by including a risk-free asset. In
Schmidli (
2002), the optimization problem of minimizing the ruin probability for the classical risk model is studied when investment in a risky assent and proportional reinsurance are both allowed. The asymptotic ruin probability for the classical risk model under the optimal investment in a risky asset is obtained by
Gaier et al. (
2003) for large initial wealth. The asymptotics for small claim sizes were obtained in
Hipp and Schmidli (
2004). In
Yang and Zhang (
2005), they studied the optimal investment for an insurer when the risk process is compound Poisson process perturbed by a standard Brownian motion and the insurer can invest in the money market and in a risky asset. In
Gaier and Grandits (
2002), the case when the claim sizes are of regularly varying tails were studied. The results were then extended to include interest rates in
Gaier and Grandits (
2004). The case for subexponential claims was investigated in
Schmidli (
2005). In
Promislow and Young (
2005), they studied the problem of minimizing the probability of ruin of an insurer when the claim process is modeled by a Brownian motion with drift optimizing over the investment in a risky asset and purchasing quota-share reinsurance. In
Wang et al. (
2007), they adopted the martingale approach to study the optimal investment problem for an insurer when the insurer’s risk process is modeled by a Lévy process with possible investment in a security market described by the standard Black–Scholes model. When the underlying investor is an individual rather than an insurance company, the optimal investment problem of minimizing the ruin probability was studied in, e.g.,
Bayraktar and Young (
2007). In
Azcue and Muler (
2009), they studied the minimization of the ruin probability for the classical risk model with possible investment in a risky asset that follows a geometric Brownian motion under the borrowing constraints. There have been many other works in this area. For a survey, we refer to
Paulsen (
2008) and the references therein.
This paper is organized as follows. We first introduce a state-dependent dual risk model that generalizes the classical dual risk model (
Section 2). When the size of a company increases, the cost usually also increases, while the resource of income will also increase in general, which makes it natural to study a state-dependent dual risk model. Then, we study the optimal investment strategy on research and development to minimize the ruin probability of the company (
Section 3), with a further discussion of a state-dependent example in
Section 3.1. As a special case, the state-independent model is discussed in
Section 3.2, with a further discussion of a state-independent example in
Section 3.3. Next, we study the joint investment in research and development and a market index to minimize the ruin probability in
Section 4. Finally, we provide some numerical studies in
Section 5 to better understand how the minimized ruin probability and the optimal strategy depend on the parameters in the model.
2. A State-Dependent Dual Risk Model
We introduce a state-dependent dual risk model with the wealth process being defined as follows:
where
, where
is a simple point process with intensity
at time
t, and
are i.i.d. positive random variables with finite mean and independent of
, where
is the natural filtration generated by
process,
is the
i-th arrival time of
and we further assume that
are increasing functions. The state-dependent dual risk model (
3) was first introduced in
Zhu (
2015b), in which ruin probability and the Laplace transform of the ruin time were studied.
The motivation of introducing state dependence for the dual risk model is the following. First, the cost of a company usually increases as the size of the company increases. For example, the running cost of a small business and a Fortune 500 company are vastly different. Second, as the size of a company increases, the arrival intensity of the future profits might increase. It may be due to the fact that the larger a company gets, the more resources for income it will obtain. It is also well known in the finance literature that as a company gets larger and stronger, it can enjoy more benefits, e.g., net present value (NPV), which for example might be due to the opportunities brought by franchising. As we can see from
Table 1, the R&D expenditure may be far from being constant as the size of the company and the revenue of the company change. More realistically, the R&D expenditure and other costs of running the company should be state-dependent.
Let
be the ruin time of
process. The eventual ruin probability is defined as the function
to emphasize the dependence on the initial wealth
x. Note that for the state-independent dual risk model,
and
, under the assumption
, the ruin probability
is less than 1. Indeed,
, where
is the unique solution to the equation; see, e.g.,
Afonso et al. (
2013):
For the state-dependent dual risk model, there is no simple closed-form formula for the ruin probability. Nevertheless, for the special case when the jump sizes
are i.i.d. exponentially distributed, there is a closed-form expression for the ruin probability; see Theorem 1 in
Zhu (
2015b).
Finally, we notice that the
process in (
3) is an extension of the (nonlinear) marked Hawkes process with exponential kernel (see, e.g.,
Brémaud and Massoulié 1996;
Gao and Zhu 2018a,
2018b;
Hawkes 1971;
Zhu 2015a), that is,
is a simple point process with intensity
, where
where
is the
i-th arrival time of
, and
are i.i.d. positive random variables independent of
with finite mean and
are given constants, where
in (
5) satisfies the dynamics (
3) with
. When
is linear, it is called linear Hawkes process, named after
Hawkes (
1971). When
is nonlinear, the Hawkes process is said to be nonlinear which was first introduced by
Brémaud and Massoulié (
1996). Hawkes processes have wide applications in finance, neuroscience, social networks, criminology, seismology, and many other fields; see
Gao and Zhu (
2021) and the references therein. Since the
process in (
3) is an extension of the (nonlinear) marked Hawkes process with exponential kernel, our paper also contributes to the literature on the Hawkes process.
3. Minimizing the Ruin Probability
In this section, we study the optimization control problem of minimizing the ruin probability for the dual risk model. The management of the underlying company can decide whether or not to increase the capital spending on research and development to boost the future profits. Our goal is to find the optimal expenditure on research and development to minimize the probability that the company is eventually ruined.
Before we proceed, we introduce the investment on research and development
, where
is the set of all admissible strategies, defined as
Given the control
, the wealth process has the dynamics
where
is increasing and
, where
are defined same as before and
is a simple point process with intensity
at time
t, where
is measurable in
and increasing in both
x and
c and
for every
, where
is increasing.
We define
as the ruin time of the
process under the control
by
. We are interested in studying the optimization problem:
From the optimal control point of view, it is also interesting to study the state-dependent case, which adds a technical contribution to the literature of stochastic optimal control theory. We will show that the optimal strategy is in general state-dependent when the underlying dual risk model is state-dependent, and it exhibits a closed-form expression.
Theorem 1. The optimal strategy is given byprovided that the minimum exists. Proof of Theorem 1. For any control
, we have
where
, where
is a simple point process with intensity
at time
t and
are i.i.d. with probability density function
defined as before.
Let us introduce a random time change and define the random time
via:
Then, it is easy to see that
and
as
since
is bounded. It follows from (
10) that
Under the random time change (
11), we have
and
is distributed as
, where
is a standard Poisson process with intensity 1; see, e.g.,
Meyer (
1971) for the random time change for simple point processes. Therefore, we obtain
Let us also notice that
. Therefore, the optimal strategy is given by (
9) provided that the minimum exists. This completes the proof. □
In Theorem 1, we obtain the closed-form expression of the optimal strategy
. However, we do not have a closed form for the minimized ruin probability
. Next, we will show that we can obtain a closed form for the ruin probability in the special case when the jump sizes
follow exponential distributions. We first recall the following result from
Zhu (
2015b), which states that the ruin probability for a state-dependent dual risk model with the exponentially distributed
has a closed-form expression.
Theorem 2 (Theorem 1 in
Zhu (
2015b))
. Consider the dual risk model: , where , , where are exponential random variables with the probability density function , , and is a simple point process with intensity at time t, where are increasing functions. Then, As a corollary of Theorems 1 and 2, we obtain the closed form for the minimized ruin probability when the jump sizes are i.i.d. exponentially distributed.
Proposition 1. Assume , where . Assume also the integralexists and is finite. Then, Proof of Proposition 1. The proposition follows immediately from Theorems 1 and 2. □
3.1. A State-Dependent Example
In this section, we study a state-dependent example in detail. We assume that
where
is increasing, and
. We recall that
is increasing and thus,
. Let us also assume that
. Under our assumptions,
is increasing in both
x and
c, and
.
Notice when
, for any constant strategy
, where
is sufficiently large, the ruin probability is bounded above by the ruin probability of the following process:
where
is compound Poisson with
being the Poisson process with intensity
.
By the ruin probability for state-independent dual risk model (see, e.g.,
Afonso et al. 2013), the ruin probability of the
process defined in (
17) is given by
, where
is the unique positive solution to the equation:
We can rewrite this equation as:
The right-hand side of the above equation is bounded between 0 and 1. In the left-hand side of the above equation, , which implies that as . Hence, and the minimized ruin probability is trivially zero.
Therefore, in the rest of this section, we only consider two cases: (i) ; (ii) .
3.1.1. The Case
Under the assumption that
, it is easy to see from Theorem 1 that the optimal strategy
is the strategy that minimizes the drift:
It is easy to compute from (
20) that the optimal strategy satisfies
Therefore, for any
, the optimal strategy
satisfies
It is clear that the optimal strategy
is a function of
and we denote it as
. Then, under the optimal strategy,
where
, where
has intensity
at time
t.
When the probability density function of jump sizes is exponential, it follows from Proposition 1 that we have the following result:
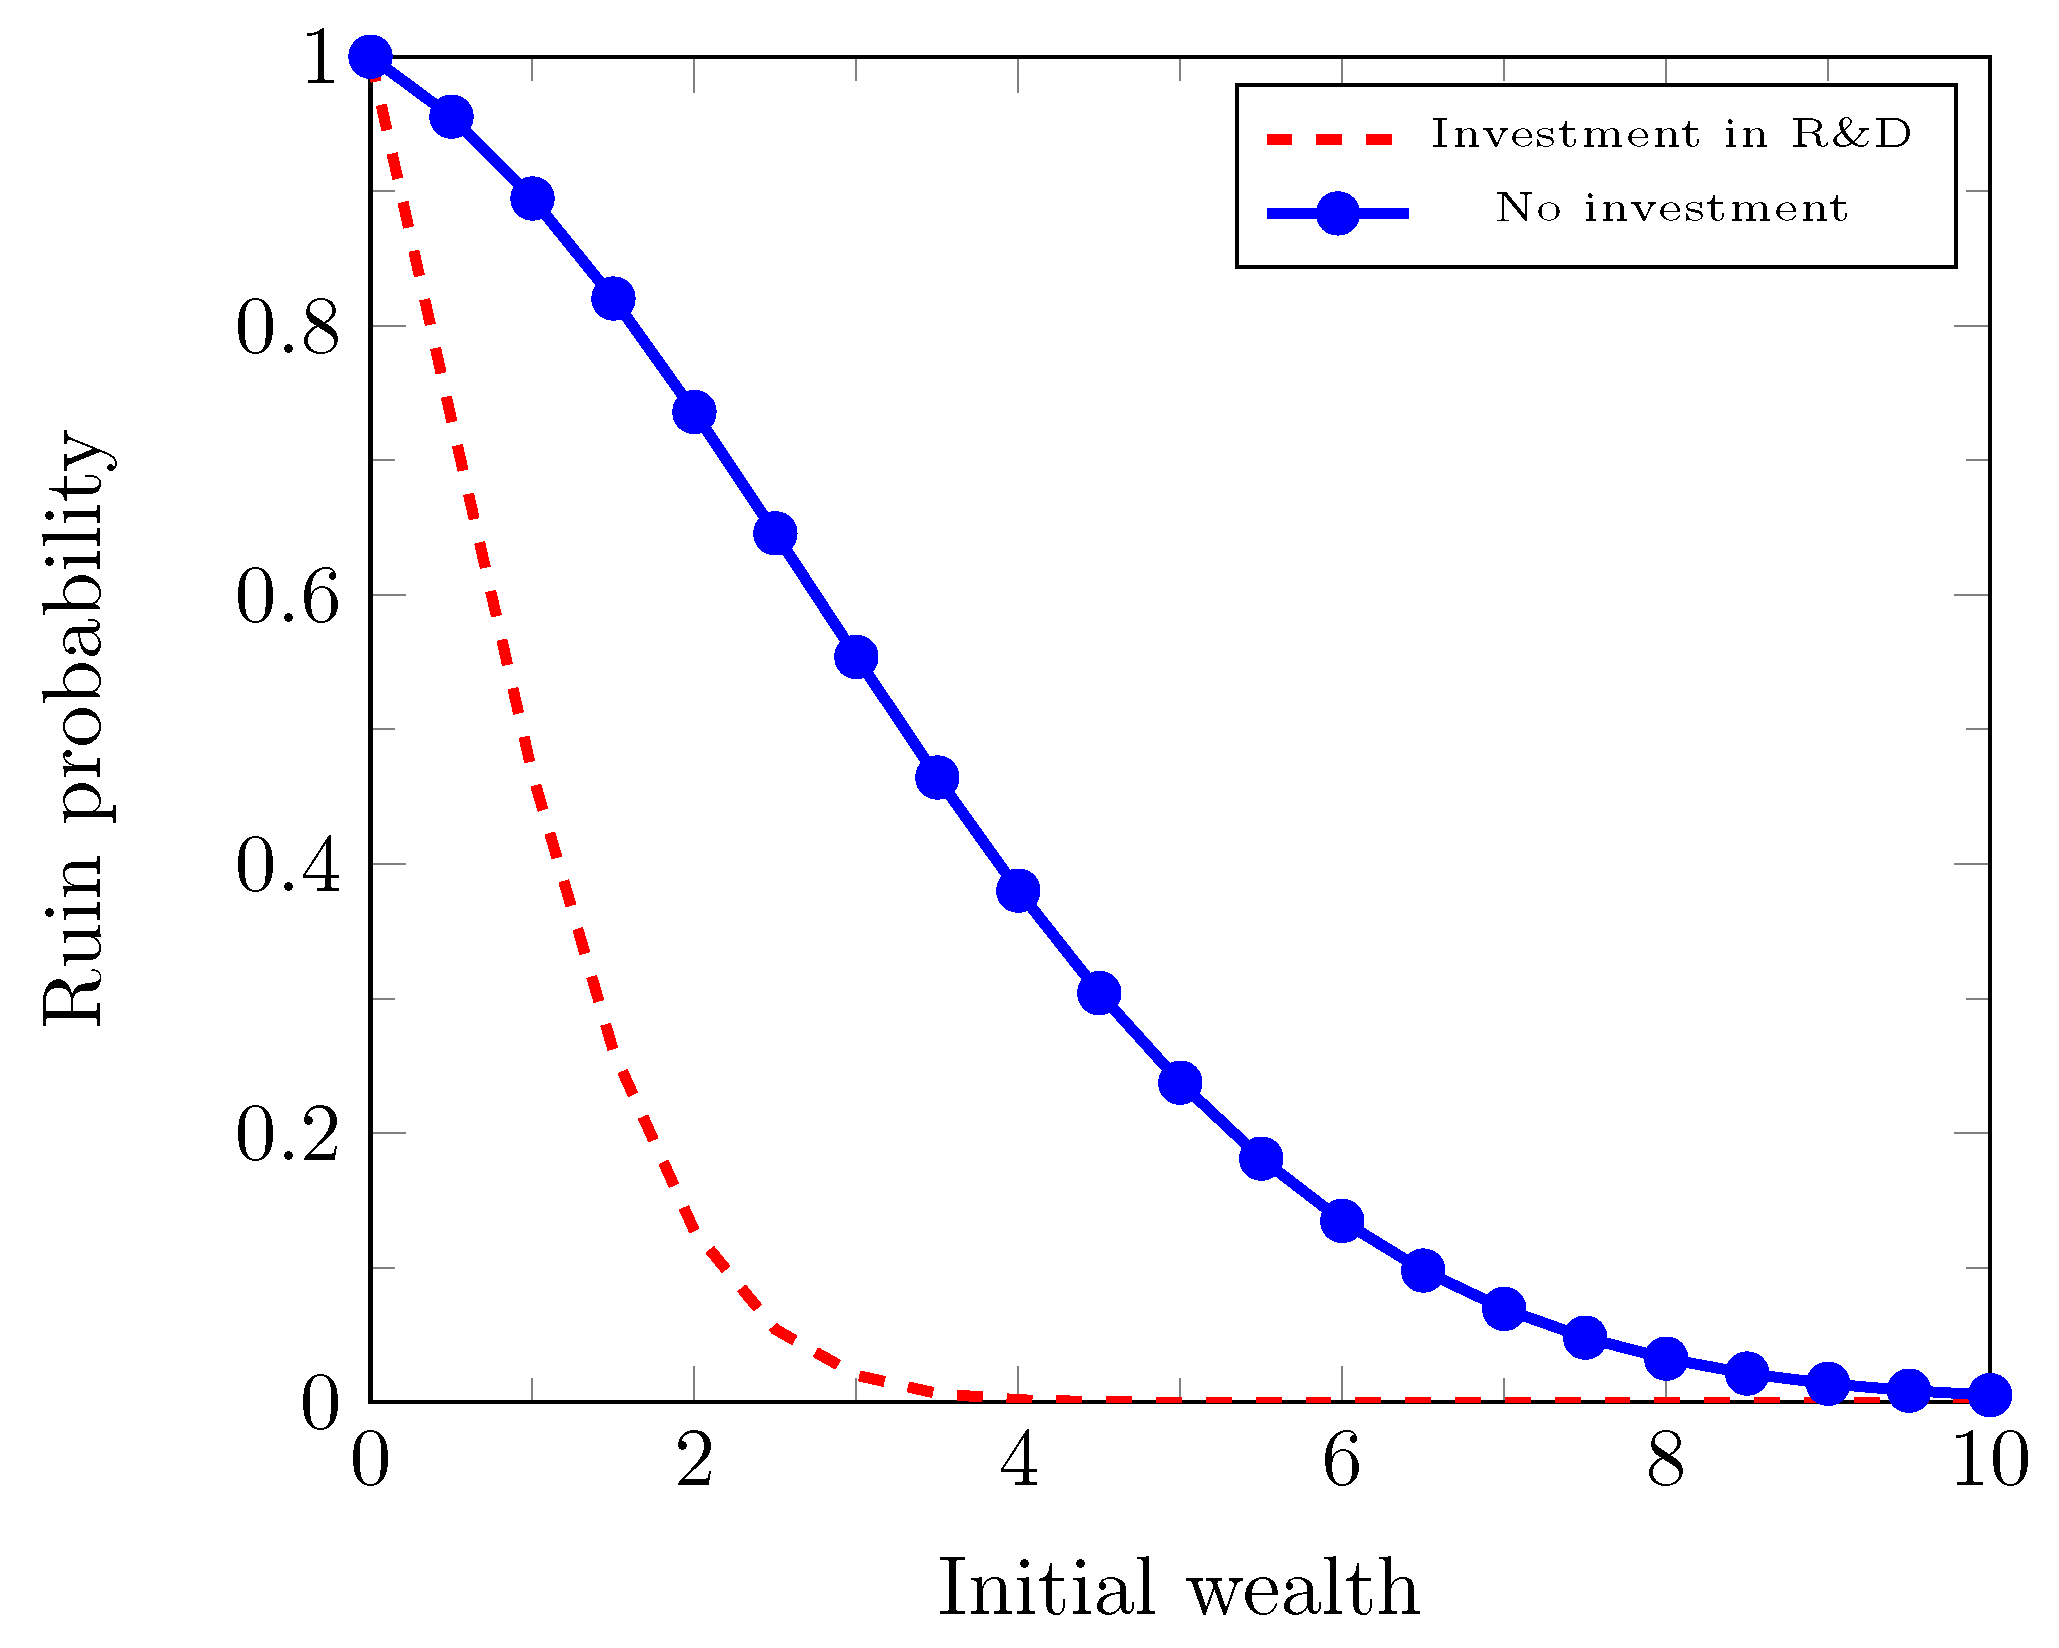
Proposition 2. Assume , where . Assume also the integralexists and is finite. Then, Proof of Proposition 2. The proposition follows immediately from Proposition 1. □
Next, in the following example, we show that with particular model specifications, the optimal
and the minimized ruin probability
in (
24) admit a simpler closed-form formula.
Example 1. Let , , and , where are positive constants. Then, the optimal investment rate is a constant , where is the unique positive solution to the equation:Hence, the minimized ruin probability in (24) can be computed as:where is the error function and is the complementary error function and , , and 3.1.2. The Case
When , it follows from Theorem 1 that the optimal satisfies in the region where and the “optimal” in the region where .
Remark 1. If we impose a research and development budget constraint by , the maximum capacity, then the admissible set of controls is given by . Then, the above analysis implies that in the region and in the region .
Next, in the following example, we show that with particular model specifications, the optimal the minimized ruin probability admit simpler closed-form formulas.
Example 2. Let , , and , where are positive constants. We further assume that . Then, the optimal is given by:Let us define:Then, we can compute that for any ,and for any ,Therefore, for , we haveand for , we haveHence, we conclude that for , we haveand for , we have 3.2. The State-Independent Case
In this section, we consider the state-independent case, that is,
and
where
and
is increasing. Under the assumptions (
36) and (
37), we have the following result, which is a corollary of Theorem 1 and the ruin probability for the state-independent dual risk model (Equation (
4)).
Theorem 3. The optimal strategy is constant, given byprovided that the minimum exists and the minimized ruin probability is , where Proof of Theorem 3. Under the assumptions (
36) and (
37), it follows from Theorem 1 that the optimal strategy
is constant, which is given by
. With the optimal
, we have
where
is compound Poisson, where
is Poisson with intensity
.
By the formula for the ruin probability for the state-independent dual risk model, see, e.g., Equation (
4), we have
, where
satisfies the equation (
39). This completes the proof. □
3.3. A State-Independent Example
In this section, we consider a state-independent example, that is,
and
In this special case, by Theorem 3, the optimal strategy
is constant and given by
By following the discussions in the more general state-dependent case in
Section 3.1, the case
is trivial and in the rest we only consider the cases
and
.
3.3.1. The Case
We first consider the case that . In this case, the intensity is a concave and increasing function of . What this indicates is that the initial investment of research and development can boost the prospect of future profits, but the margin decreases with the increase of the investment.
When it is allowed to invest in research and development, we will see later that the condition
is sufficient to guarantee that
. Note that this is weaker than the usual condition
for the dual risk model. We have the following result.
Proposition 3. Under the assumption (44),where β is the unique positive value that satisfies the equation:and the optimal strategy is given bywhich also satisfies the following equation: Proof of Proposition 3. It follows from Theorem 3 that the optimal strategy is given by
and the minimized ruin probability
satisfies Equation (
46).
To show that (
46) has a unique positive solution, it is equivalent to show that
has a unique positive solution where
and
It is easy to compute that for
,
Let , . Then, and as . Moreover, for . Thus, for any and therefore, for any and is a decreasing function of .
Note that
for
if and only if
for
, where
Note that by L’Hôpital’s rule,
. Therefore,
On the other hand, as ; therefore, as . Since is a decreasing function in and , it follows that is increasing in . Hence, we conclude that has a unique positive solution. This completes the proof. □
In the following example, we show that when are exponentially distributed, we are able to compute out and in simple closed forms.
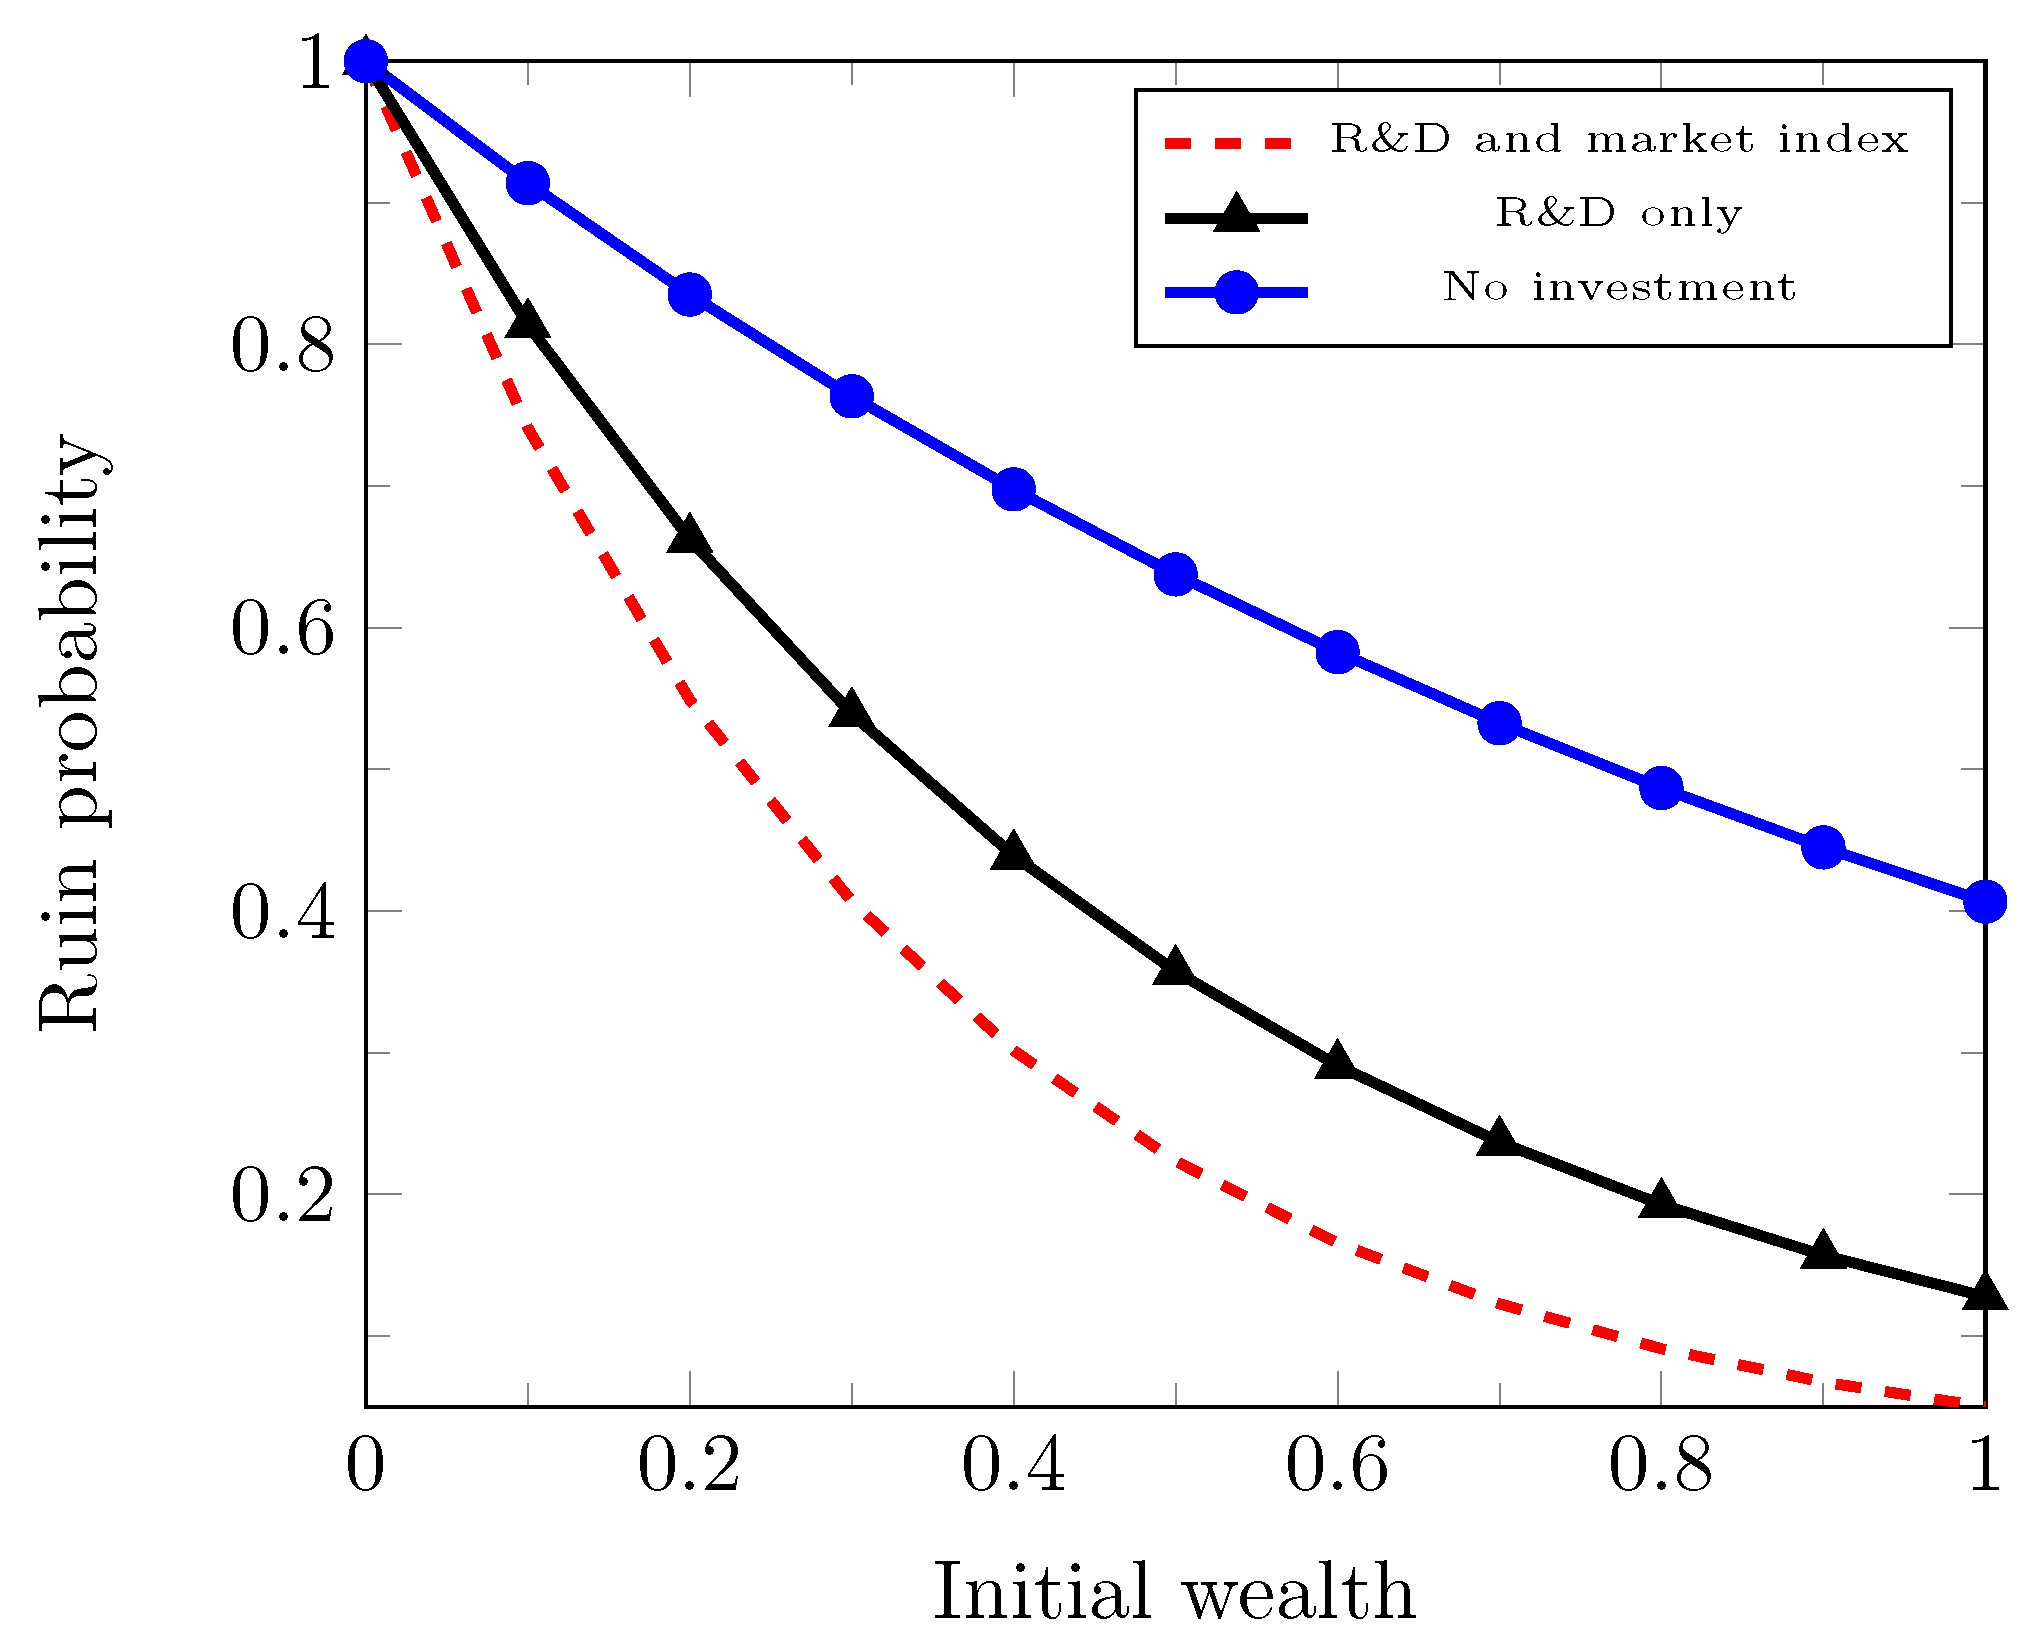
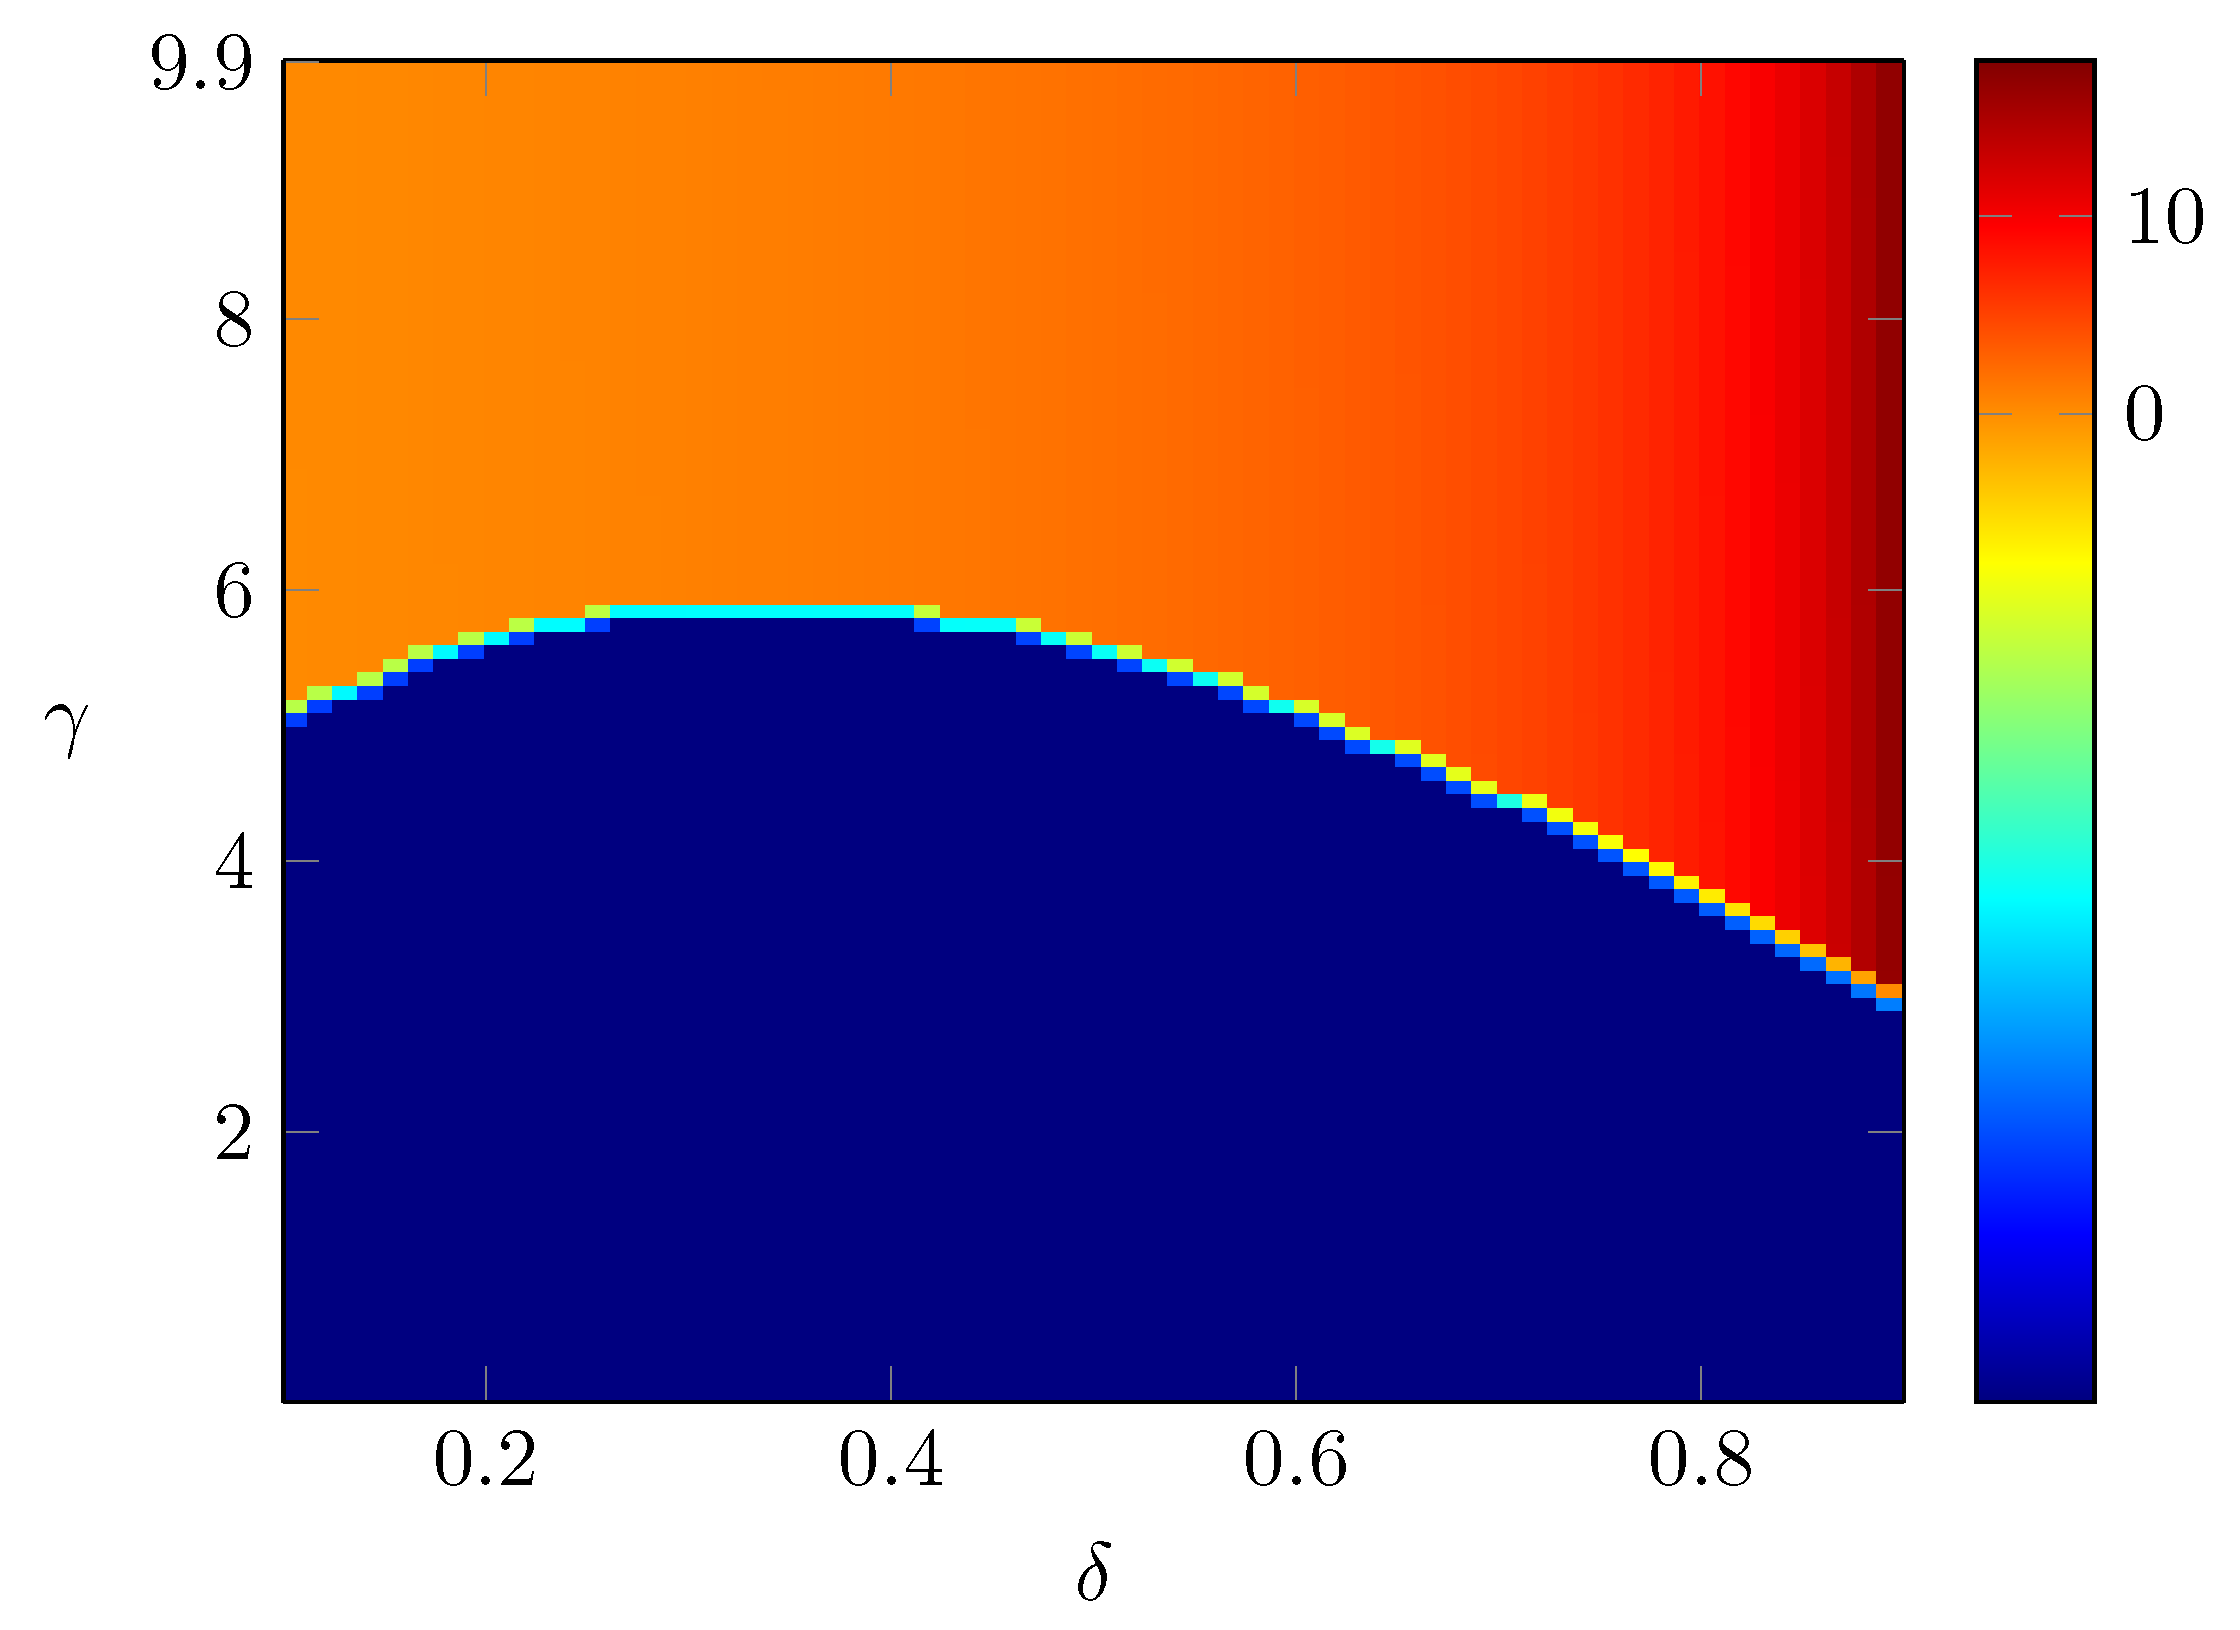
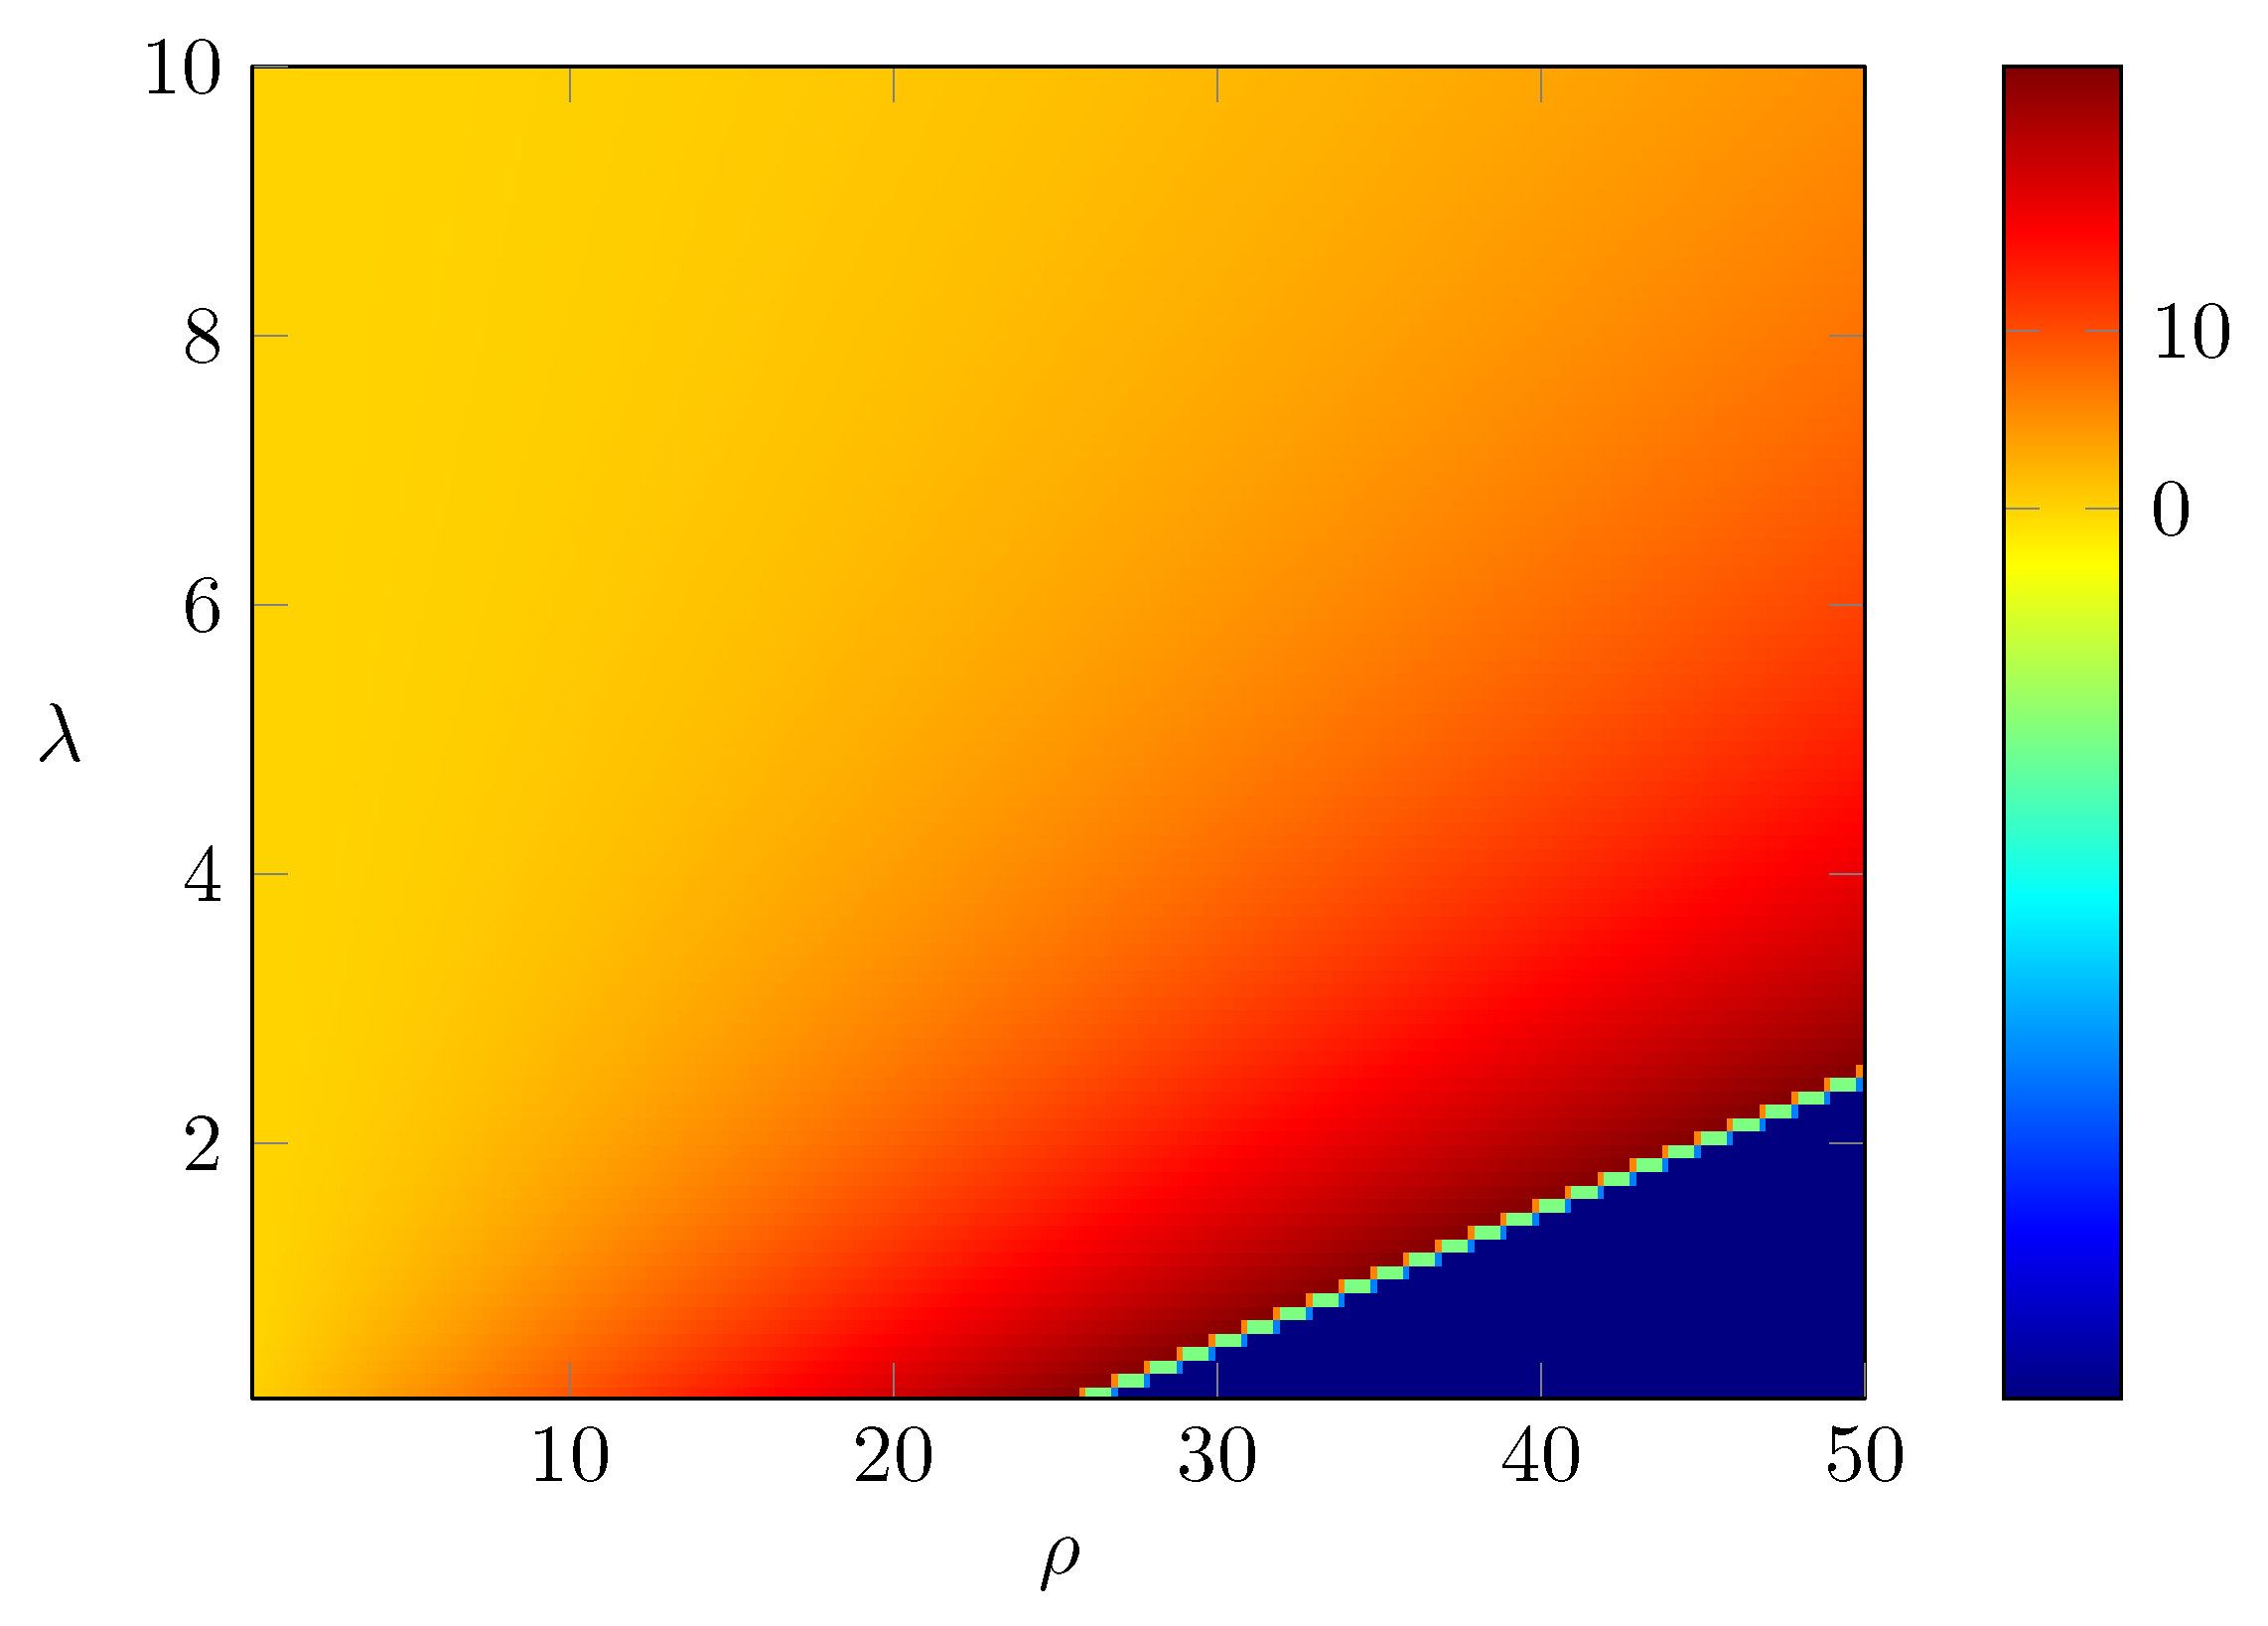
Example 3. When , , β satisfieswhich implies that In particular, when , we obtain , which implies , and thus, the optimal is given by Remark 2. We have already shown in Proposition 3 that , where β is the unique positive solution to Equation (46) and that it is equivalent towhere is defined in (51). Now, let us discuss how the value β (and hence the value function ) and the optimal investment rate depend on the parameters ρ, λ and δ. By (58), we have the following observations: (i) As ρ increases, increases. Since is decreasing in β, we conclude that β decreases as ρ increases. Intuitively, this means that as the fixed running cost for research and investment increases, the ruin probability increases. Asymptotically, as , . When , since , we must have . Therefore, by (58), as , we have . From the definition of , we have as . Hence, we conclude that , as . Therefore, the optimal satisfies (ii) As δ increases, decreases. Since is decreasing in β, we conclude that β increases as δ increases. Intuitively, this indicates that if the prospect of future profits given the investment in research and development increases, then the ruin probability decreases. Asymptotically, as , we have , and thus, , which implies that as , we have . Since as , we conclude that , as . Moreover, the optimal satisfies:Now, if , then . Therefore, as , , where we recall that α is the unique positive value so that , which is the same as defined in (4). Moreover, the optimal satisfiesIntuitively, it says that as , there is no value investing in research and development. (iii) Similarly, as λ increases, β increases, and the ruin probability decreases. As , we have . Thus, , and . Since as , we conclude that , as . Moreover, the optimal satisfies: (iv) Assume that the parameters are chosen so that Then, it follows that and . More precisely, as , if , and (58) becomesas . Then, it follows thatas . Hence, we conclude that Moreover, the optimal satisfies: Remark 3. The value function and the optimal investment rate also depend on the parameter γ. We will study the case in details later. For the moment, let us try to understand the asymptotic behavior of the value function and the optimal investment rate as . We will also obtain the asymptotics as . Let us recall that the optimal satisfies the equation: Thus, we have which implies that . Thus, as . Note that . Therefore, we can check thatNow, let us consider the limit. Let us rewrite that Equation (68) aswhere . Let us first consider the case . Notice first that . First, D cannot go to 0 as , because otherwise, the left-hand side of (70) goes to λ and as D goes to 0, and , so the right-hand side of (70) is greater than . Then, in the limit as , we obtain , which is a contradiction. Second, D cannot go to ∞ as . To see this, notice that as , the left hand side of (70) goes to ∞ and in the right-hand side of (70), for large D, and and hence, the right-hand side is less than , which is a contradiction. Therefore, if , D converges to a positive constant, which from (70) we can see that the limit is , and we have If , then the optimal as . To see this, notice that if , then in (68), we have and , which is a contradiction since . If , then for , we have from (68) that , which is again a contraction. Hence, we must have . Since , , and thus If , the optimal satisfies the equation: Assume that is fixed, then by L’Hôpital’s rule, Therefore, as , converges to the unique positive solution to the equation: .
3.3.2. The Case
When
, it follows from Theorem 3 that the optimal strategy
is constant and it is given by
When
, then
and the optimal strategy is
. In this case, the value function
, where
When
, then
. Additionally, for any
and
, the strategy
is more optimal than
C. The “optimal strategy” is
. Let us also assume that
. In this case, the value function
, where
When , in terms of ruin probability, it does not make a difference whether the company decides to invest in research and development or not.
Remark 4. When , , where β satisfies (77) that is independent of ρ and λ. Asymptotically, when , it is easy to see that . Example 4. In the special case that , when , then the optimal and , and when and , then the optimal and .
4. Investing in a Market Index
We have already studied the optimal investment in research and development for a venture capital or high-tech company in the dual risk model in
Section 3, and now, let us also add the possibility of the alternative investment in a risky asset in the market, which is a capital market index modeled by a geometric Brownian motion.
For simplicity, we restrict our discussions to the state-independent case as in
Section 3.3:
where
and
Let us assume that the market index
follows a geometric Brownian motion:
where
and
is a standard Brownian motion.
Assume that at time
t, the company can invest
shares of the market index
and
in research and development. Thus, the wealth process of the company satisfies the dynamics:
The invested amount in the market index is at time t.
We are interested in finding optimal investment strategies to minimize the probability of ruin:
where
is the same as defined before and
is the admissible strategies for investment in the market index, defined as:
For any given and , we write to emphasize the dependence on C and A.
With additional investment in a market index, the random time change argument in the analysis in
Section 3 no longer applies. Instead, we rely on the stochastic optimal control theory (see, e.g.,
Fleming and Soner 1993), which suggests that the Hamilton–Jacobi–Bellman equation for
is given by
with boundary condition
.
Similar to the case in
Section 3, the case
leads to triviality and for the rest, we consider two cases:
and
.
4.1. The Case
In this section, we consider the case. We start with the following technical lemma.
Lemma 1. is a solution to the Hamilton–Jacobi–Bellman Equation (84), where is the unique solution to the equation: Given and let Proof of Lemma 1. Assume that
and
, then the optimal
C and
A are given respectively by
and the Hamilton–Jacobi–Bellman equation becomes
We can see that
, where
is the unique solution to the equation:
Recall the definition
and we want to show that the equation
has a unique positive solution. It is easy to see that
and
. Thus,
as
and
as
. We have already proved that
is decreasing in
. Moreover,
is also decreasing in
. Therefore,
is increasing in
and hence, there exists a unique positive value
so that
.
Finally, we can compute that the optimal
and
are given by (
87). This completes the proof. □
A Verification Theorem
Let us recall from (
84) that the Hamilton–Jacobi–Bellman equation is given by
with boundary condition
.
Theorem 4 (Vertification)
. If is a solution of (92) with , such that for any and then, . In addition, ifare such thathas a solution and and , then . Proof of Theorem 4. We follow the supermartingale argument presented in (
Rogers 2013, Theorem 1.1). Since
w is bounded and continuously differentiable with bounded derivative, by Itô lemma for jump processes, we have
for any
and
. Therefore,
is a submartingale. Let
be the first time that the
process hits
. Since
w is uniformly bounded, by optional stopping theorem,
It follows from (
93) and monotone convergence theorem that the right-hand side above converges to
as
and thus,
By taking infimum over and , we obtain . All the above inequalities change to equality for and . This completes the proof. □
Corollary 1. with β defined in (85) satisfies (93) and thus, . Proof of Corollary 1. We already showed, in Lemma 1, that
w is a classical solution of the boundary value problem (
92). Moreover, since
and
defined by (
86) are admissible controls (constants). By Theorem 4 and because (
93) trivially holds, we have
. The proof is complete. □
Next, we provide some asymptotic analysis.
Remark 5. As in Remark 2, let us discuss the dependence of , β and hence, on the parameters ρ, λ and δ. Since the results are similar to Remark 2, we omit the details and only summarize the results here. Note that β satisfieswhere is defined in (51). (i) As , we have , and .
(ii) As , we have , and . As , we have , where α is the unique positive value so that Moreover, as , we have .
(iii) As , we have , and .
Remark 6. Here, we investigate the asymptotic behavior of the value function and the optimal investment rate as and . Note that the optimal and β satisfyand (i) As , for some and for some . It is easy to check that satisfy and . Thus (ii) Next, let us consider .
If , then there exists a unique value such that . Assume further that . Then, we have and as , where .
If , the optimal as and and as . We can check that satisfy the equations and . As , we have .
If , then, as , we have that converges to the unique positive solution to the equation .
4.2. The Case
Consider the case where
, i.e., for
. Then, we have a singular control problem on
(see, e.g.,
Fleming and Soner 1993) and the value function
satisfies the Hamilton–Jacobi–Bellman equation:
with boundary condition
. Optimizing over
A, it reduces to the following equation:
with boundary condition
.
For
, we define
(ii) On
,
w satisfies
(iii) .
Lemma 2. is a classical solution of (101) where is the unique positive solutions of and is the unique positive solution of if it exists or zero otherwise. Here, F and G are given by Proof of Lemma 2. If
, then
and
. This implies that
. By straightforward calculations,
If
and
, then
and we have
. Similar to the previous paragraph, we obtain that
w is a classical solution. If
and
, then
and we have
. Thus,
The proof is complete. □
A Verification Theorem
Theorem 5 (Verification)
. .
Let be a decreasing classical solution of problem (101) such that condition (93) holds. Then, , where is the value function of the ruin probability minimization problem with investment.In addition, if , then .
Proof of Theorem 5. Let
be an admissible strategy and
be a non-decreasing singular function, i.e.,
where
is a non-negative measure. Then,
where
where
is a simple point process with compensator
. Then, by Itô’s formula for
functions, we have
Here,
where
is the continuous part of
C and
is the pure jump part of
. Notice that by the definition of classical solution, (
102) holds and therefore, the first two terms inside the expectation above are non-negative. In addition, since
w is non-increasing, we have
. Thus,
and
is a submartingale. Similar to the arguments in the proof of Theorem 4, (
93) implies that
. By taking the infimum over
, we obtain
.
Now, assume that
and set
. It follows from the definition of
and Itô’s formula that
In the above, satisfies . If we let , we obtain where is the ruin time for process . The proof is complete. □
Corollary 2. The classical solution of boundary value problem (92) satisfies the assumption of the verification and thus, . Proof of Corollary 2. First, the condition (
93) trivially holds. Therefore, if
, then
and
is followed by Theorem 5. It remains to show the result for the case that when
, i.e.,
. For
, let
with
with
. Then, immediately, we obtain
. We want to show that
as
. Notice that
satisfies the equation
with the boundary condition
. The unique bounded solution of the above equation is given by
where
satisfies
Notice that for any
,
is uniquely determined and is continuous on
c. In addition, straightforward calculations show that
is increasing, i.e.,
Thus,
exists and
and after dividing (
103) by
c and taking limit when
, we obtain
Since G has a unique positive solution, we must have and therefore, we obtain . This completes the proof. □


