FMEA Model in Risk Analysis for the Implementation of AGV/AMR Robotic Technologies into the Internal Supply System of Enterprises
Abstract
:1. Introduction
1.1. Automated Material Handling
- Enhancing the efficiency of electric motors and batteries, as well as introducing energy recovery systems during braking or decreasing the load while transporting goods, the overall energy consumption can be reduced.
- Employing modern, long-cycle lithium batteries, which research has shown to significantly improve overall greenhouse gas emissions throughout their lifecycle.
1.2. Literature Review
2. Materials and Methods
- Risk management: FMEA plays a critical role in risk management, as it helps identify and rank risks based on their severity, probability, and detection. The approach allows project managers to focus their efforts on addressing high-priority risks, thereby minimizing potential negative impacts on project milestones, budgets, and objectives (Stamatis 2003).
- Reliability engineering: The origins of FMEA are in the reliability engineering, where it emerged as a method to assess potential failure points in systems (particularly in the aerospace, military, and nuclear industries) to ensure dependable performance and safety. In the context of project management, the implementation of FMEA contributes to the design of more robust, reliable, and safe solutions, reducing the chances of project delays or failures (Latino and Latino 2006).
- Quality management: FMEA is also commonly used in various quality management systems, such as Six Sigma, Lean Manufacturing, and the ISO 9001 quality management standard (https://www.iso.org/iso-9001-quality-management.html, accessed on 9 September 2023). In these contexts, it serves as a tool to identify potential sources of errors or defects and to develop appropriate preventive actions. By integrating FMEA into project management processes, project managers can enhance overall project quality and stakeholder satisfaction by proactively addressing possible failure points (Naslund and Williamson 2010).
3. Results
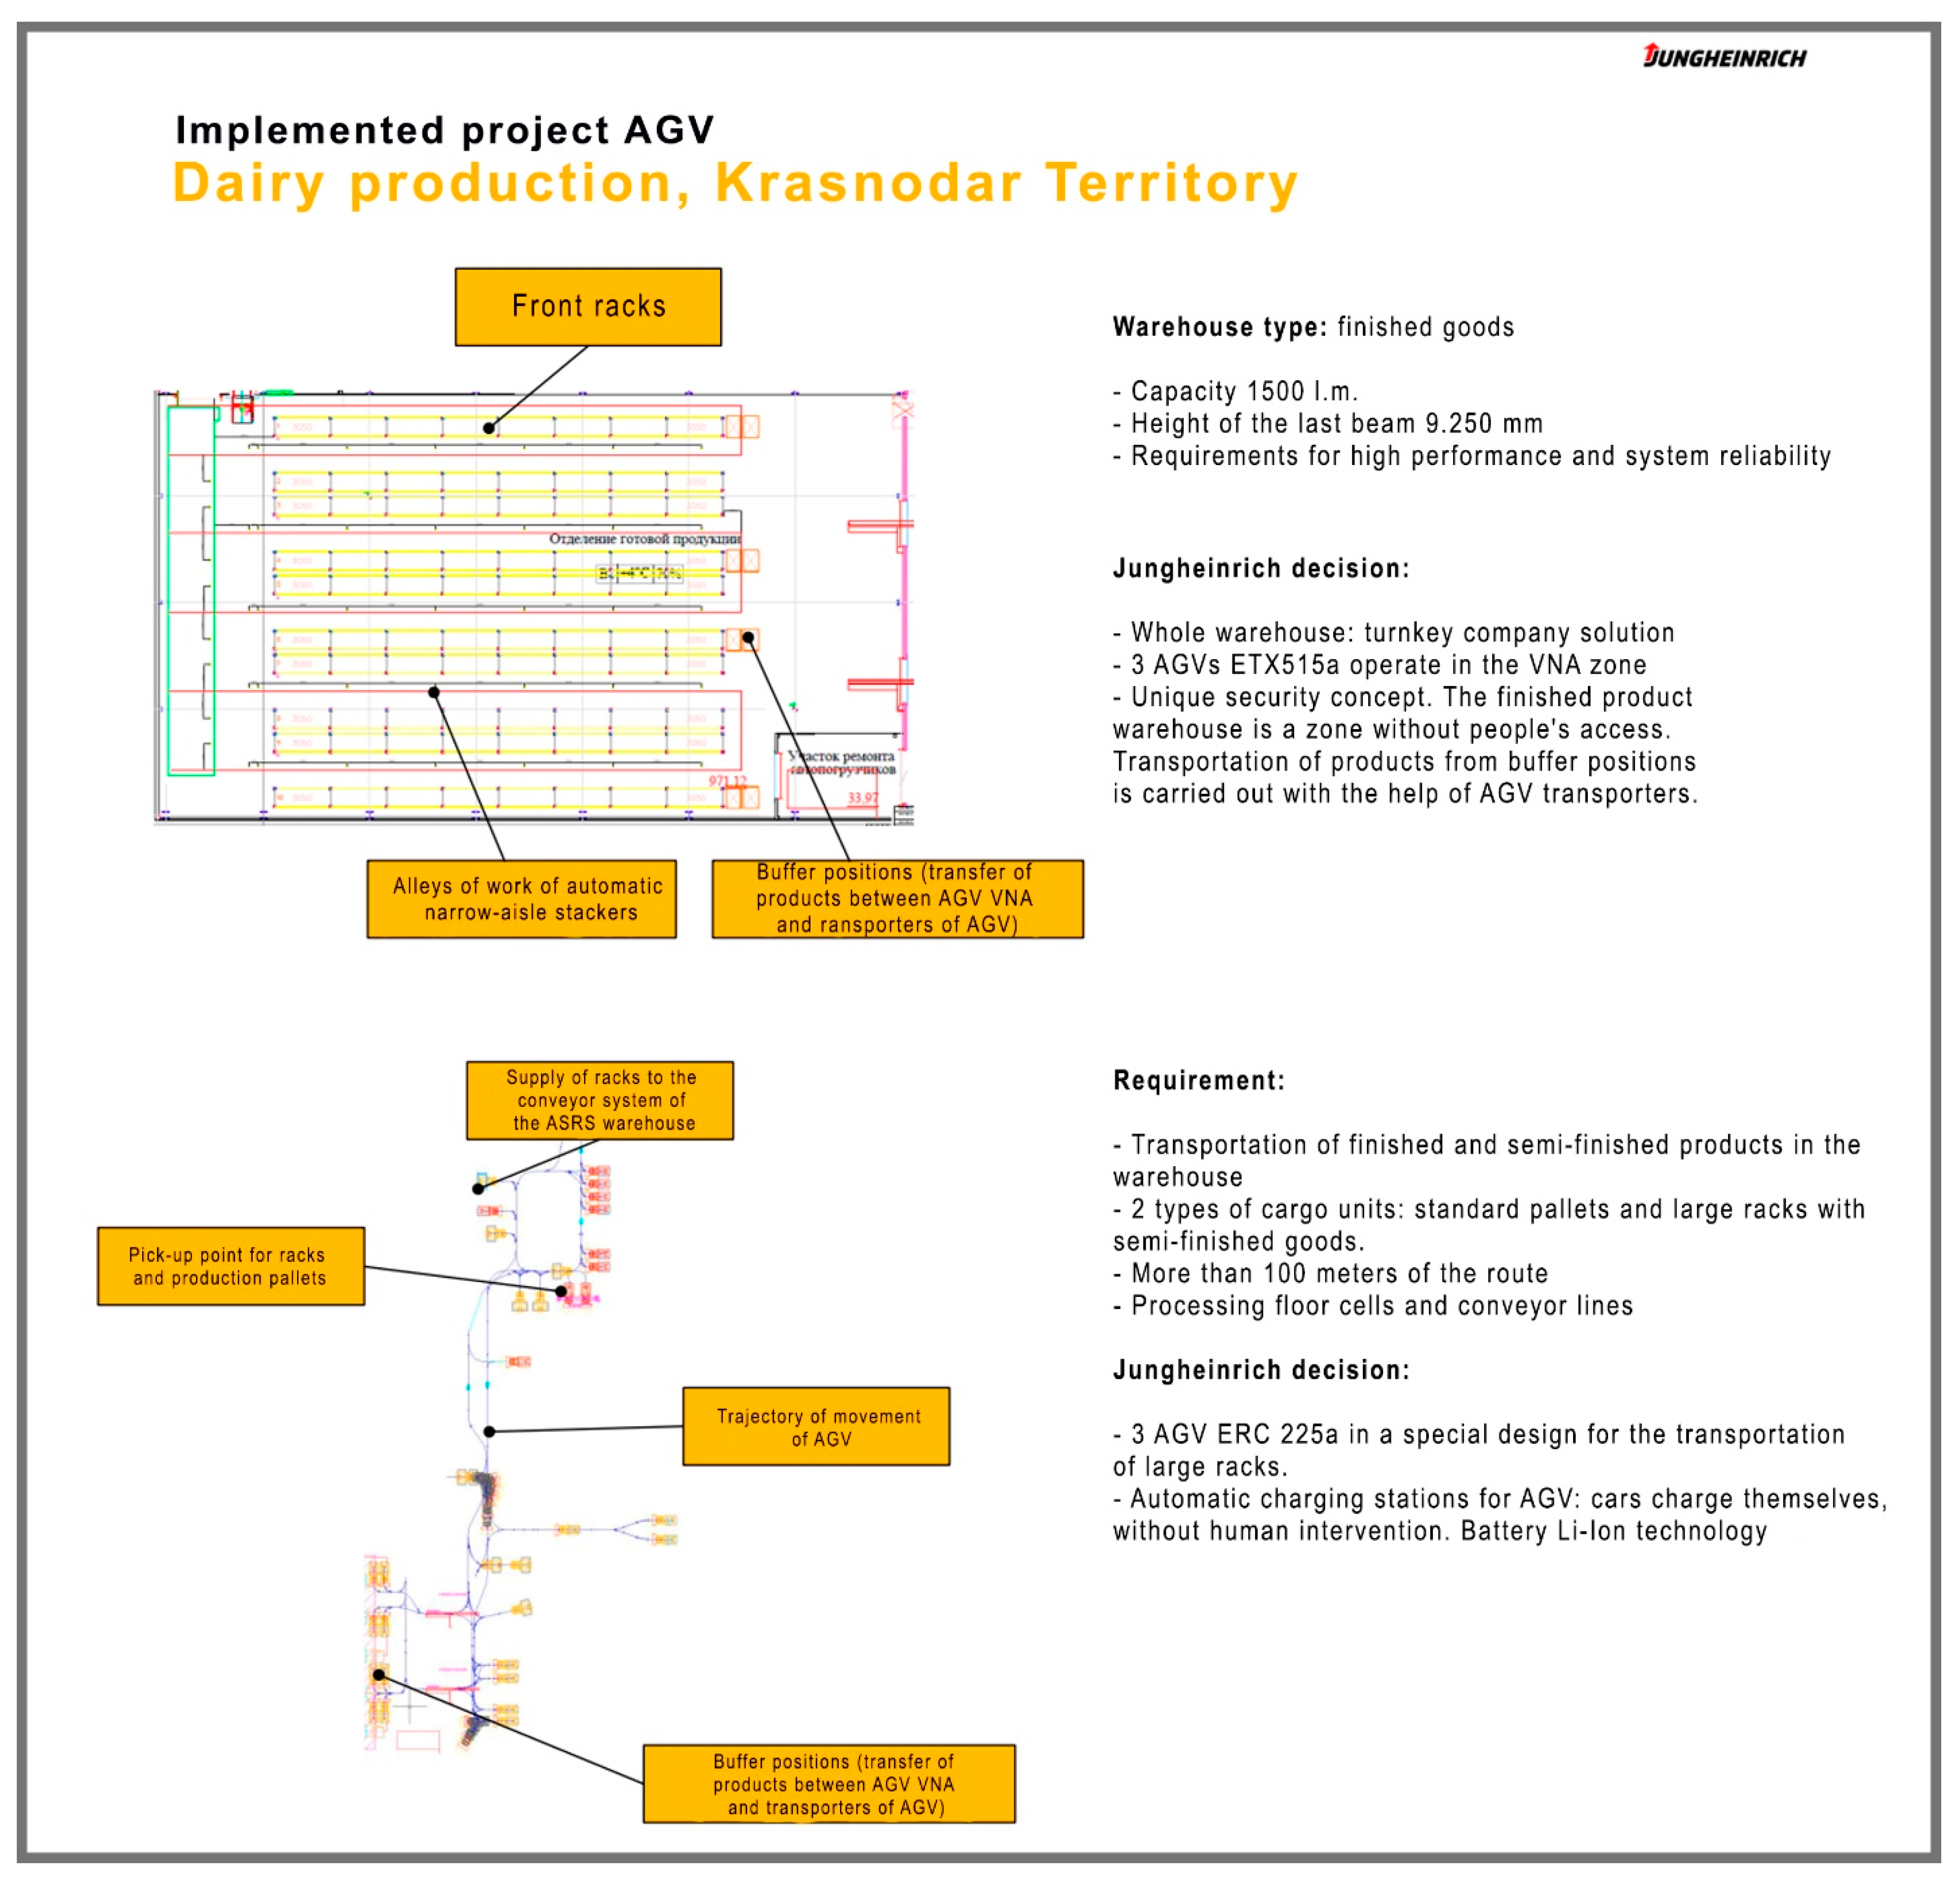
- Customized AGV: The AGVs used in the facility were tailored to suit the size, weight, and type of goods being transported. The vehicles also featured washdown-compatible bodies designed to withstand rigorous cleaning processes required in the dairy industry.
- Navigation System: The AGV system included a precise navigation system that allowed for identifying optimal routes, avoiding obstacles, and maintaining a safe distance from other AGVs and employees.
- Software Integration: AGV software was integrated into the dairy production facility’s existing warehouse management system, ensuring seamless communication and coordination between multiple processes and operations.
- (1)
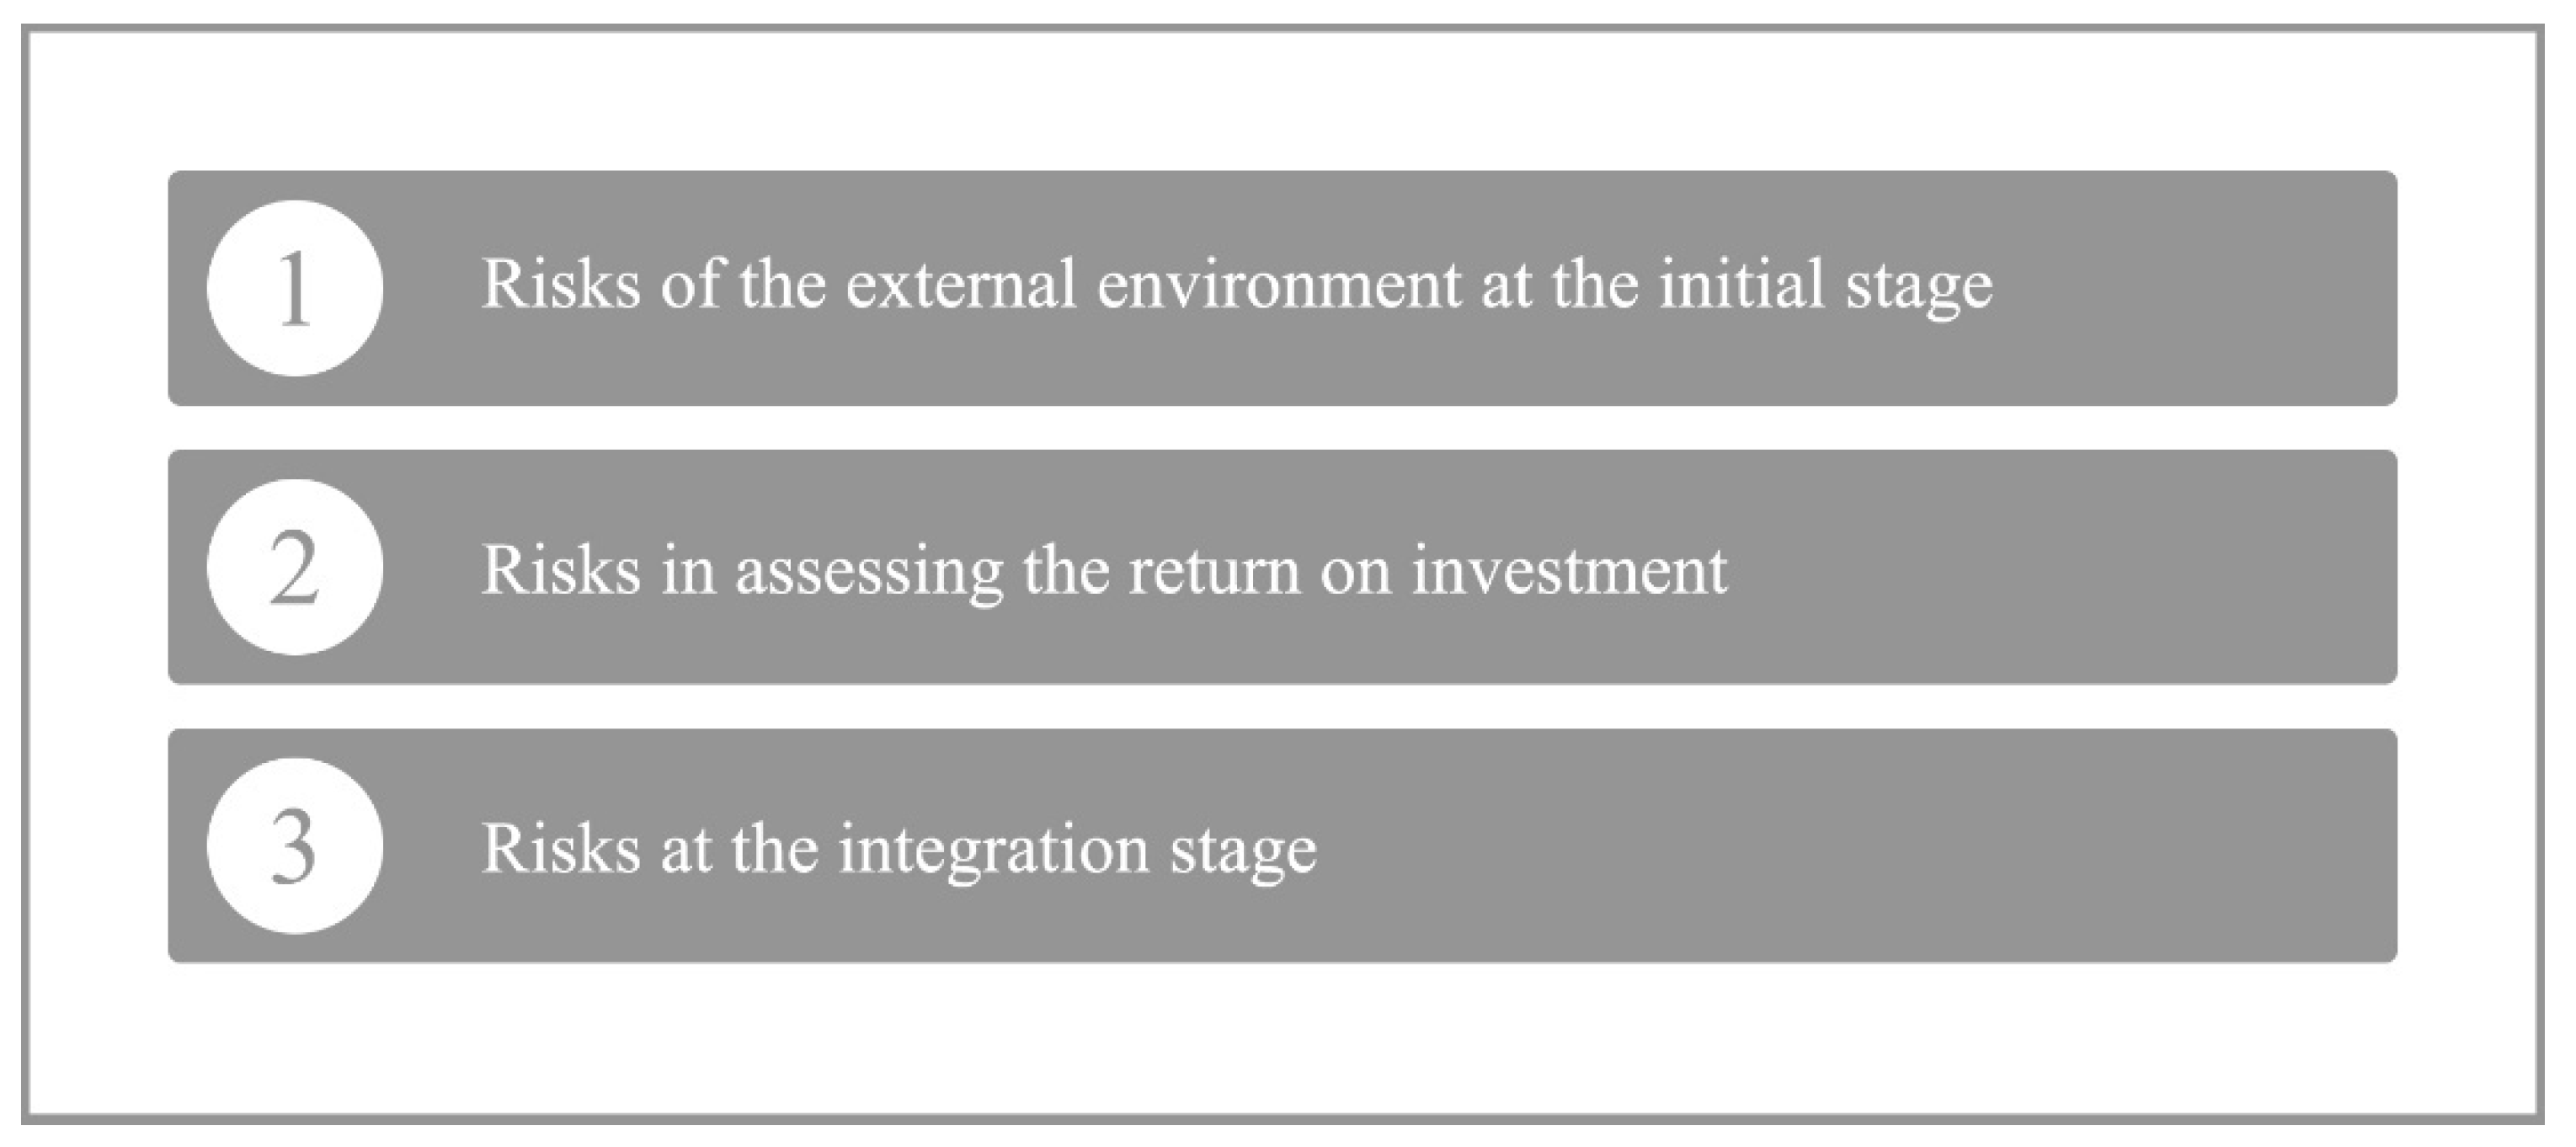
- Risks of the external environment at the initial stage.
- Disruptions in the supply of AGV/AMR components due to a shortage. This problem is especially acute now, and specifically with a shortage in the semiconductor markets, which are an integral part of the electronics of mobile robots. The shortage can significantly prolong the project, but also make it irrational or even dangerous on the part of the customer’s management. In addition, there is a risk of “hiding” the shortage problem from the supplier side, the purpose of which may be to obtain a contract at any cost.
- Pandemics or any other acute crises that have a strong impact on the logistics of the components. The consequences of this risk are the same as those in the previous one, with one exception: in this case, the movement of a highly qualified workforce for the installation and debugging phase in the field of robotics also stops. This problem particularly affects the Russian market, where the AGV/AMR sector is under development.
- Increases in customs duties and taxes. Due to the globalization of production chains, many components are usually manufactured and assembled in different countries, and the cost of semifinished products in the final assembly can be greatly increased. This is especially true for the transitive markets: the production of most components and robotic devices abroad causes a number of additional costs, and due to the relatively low wages in the emerging markets, when assessing the return on investment (ROI), even a slight increase in the cost of a project can lead to a failure on its implementation.
- The compulsion of robotics suppliers, because of market fragmentation, to provide standardized solutions with no local differentiation across diverse markets due to varying regulations. SMEs face challenges as large international corporations with vast financial and intellectual resources adopt AGV/AMR technologies worldwide. This not only shrinks the local market supply, potentially leaving businesses without optimal providers, but also creates barriers for smaller organizations in those countries. These companies become less appealing to AGV/AMR integrators due to their low order volume. Though more prevalent in Europe, this issue is also relevant for transitional markets, especially in countries with extensive territories and uneven economic development.
- The creation of new ESG challenges due to global energy transitions. Companies are assessed on short-, medium-, and long-term goals for reducing greenhouse gas emissions across Scopes 1, 2, and 3, using renewable energy sources and improving energy efficiency in production processes. These additional evaluation criteria can be expensive for companies. With the energy agenda increasingly driving investment decisions, Russia-based companies in initial stages of compliance face obstacles to implementing automation and robotization projects.
- Lack of legal support due to the lack of regulations related to health and safety and the use of autonomous robots. Due to the relative short period of the Russian robotization market existence, regulatory basis is still at the development stage. As part of this, the Ministry of Economic Development of the Russian Federation issued the “Concept for the development of regulation of relations in the field of AI and robotics technologies until 2024” (Decree of the Government of the Russian Federation 2020), which became the first document in the RF that forms the basis for regulation of AI and robotics technologies (Xiangnan et al. 2019).
- Miscalculations in energy consumption, which can occur when companies adopt navigation technologies to reduce labor costs by expanding their robotics fleet, leading to decreased energy efficiency during turbulent times. However, optimizing material handling with AGV/AMR devices typically increases production per unit of time, reducing the need for other electrical appliances in the production chain and thereby decreasing overall electricity consumption. This highlights the goal of improving energy efficiency through the implementation of AGVs/AMRs, which is often overlooked in calculations that only account for the devices and their energy consumption.
- (2)
- Risks in assessing the return on investment.
- Financial. Any company replacing the physical labor of a person with robotic equipment wins on the labor rate of the employee, as well as on all other payments associated with this employee (i.e., social security, health and safety, etc. (Pisarenko 2014).
- Safety. Enhancing safety culture through AGV/AMR technology in warehousing offers a more secure alternative to human-operated systems. As large companies prioritize industrial robotics adoption, the safety benefits can offset financial losses from such projects.
- Reputational. Industry 4.0 projects in transitional economies garner significant media attention, shaping positive public perception. These initiatives allow companies to showcase their competitive edge, both against external competitors and within their corporation, even among different departments. Moreover, automation projects involving AGV/AMR technology can reduce carbon emissions, as they replace traditional gasoline or diesel-fueled vehicles. This alignment with the green economy further enhances a company’s image and reputation.
- Risks in inaccurate ROI estimation. While assessing a project’s ROI, management takes into account financial, safety, and reputational benefits. However, gauging risks for financial prospects is not always clear-cut. Automated navigation technologies may reduce employee count, and in countries with low labor costs, implementing these technologies might face challenges.
- Risk of errors in staff workload calculations. When assessing return on investment (ROI) or other methods, companies typically focus on direct financial benefits from projects, such as a worker’s salary, equipment maintenance costs, and energy consumption. However, robotic integration does not always result in employee layoffs; often, employees are reassigned to different tasks. Consequently, a worker’s workload may decrease, e.g., from 87% to 65%, with the remaining 22% allocated to other tasks or unaccounted overtime. These factors are often overlooked in conventional computation methods, leading to potential inaccuracies.
- Risks of equipment damage due to industrial safety violations/low qualification of personnel. This is when the client and the customer cannot come to a common agreement on the responsibility of the parties in situations involving damage to the equipment, infrastructure of the enterprise, or injury to employees of the company when using AGV/AMR robotic equipment. In the event of such a conflict, both parties should refer to the existing regulations and rules in the legislation of the country in which the customer enterprise is located. However, in cases where the legislative framework of the state does not state clear boundaries for the allocation of liability on this issue, or it is insufficiently elaborated, a situation arises when both sides of the project will not be able to come to a common agreement.
- Reputation risks. From the side of obtaining reputation benefits, there may be a reverse effect if the project goes into operation, but will not be implemented at the enterprise for one reason or another, unrelated to insurmountable circumstances. This applies not only to the CEO of the company and their responsibility to shareholders, but also to line managers as well as employees of those departments within which an attempt was made to implement the project.
- (3)
- Risks at the integration stage
- Ensuring uniformity and compatibility: Automated carriers rely on precise navigation and require uniform loading equipment and materials. Suppliers’ packaging may vary, making it difficult to achieve uniformity. Transferring materials to AGV/AMR-compatible materials can be time-consuming and challenging.
- Preparing pick-up locations: Companies must assess the sufficiency of floor space for AGV/AMR devices when integrating them into high-altitude storage systems. Coordination between human labor and AGV/AMR technology is crucial for a seamless transition.
- Addressing delivery path issues: Proper infrastructure, including flooring, elevators, and ramps, is necessary for the implementation of AGVs/AMRs. In some cases, adjustments might need to be made to accommodate the technology, such as widening passages.
- Managing challenges in the receipts-holding area: Sufficient floor space in operational areas must be ensured for automated equipment. To manage the buffering of materials, companies must account for variable factors such as the manual lifting of tables and empty containers. Developing an algorithm within the AGV/AMR program to navigate these constraints is essential for successful integration.
FMEA
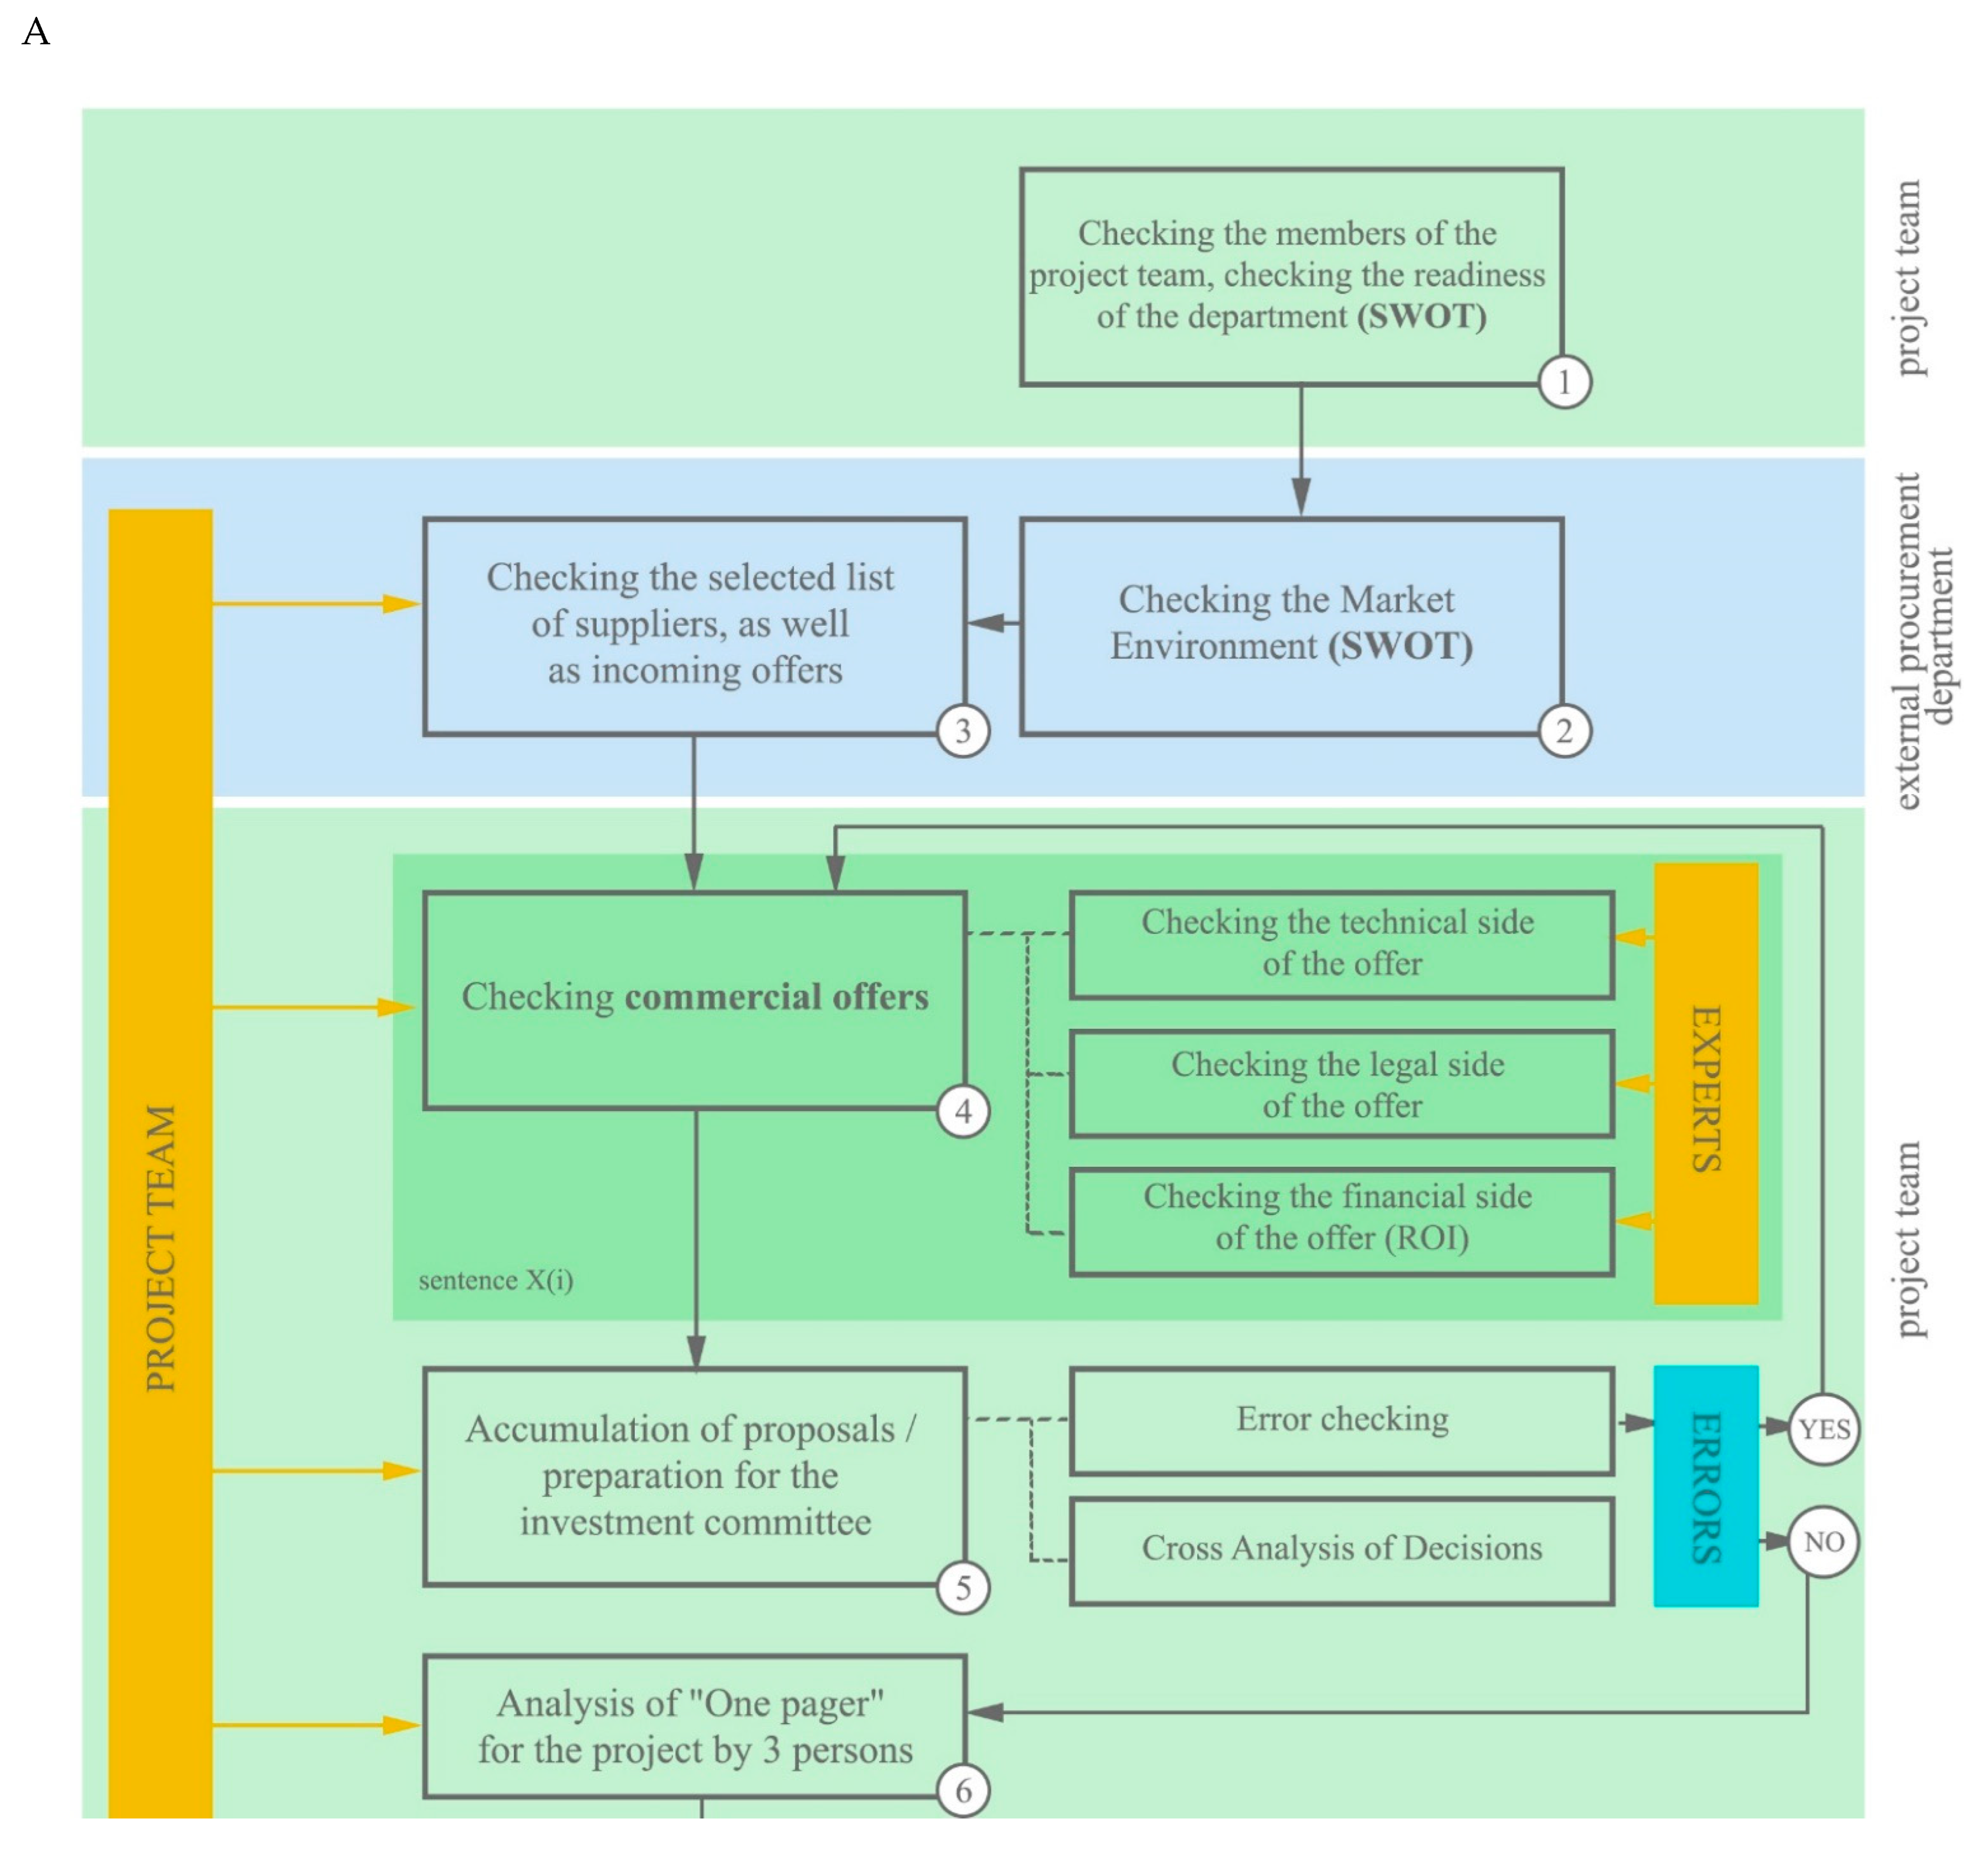
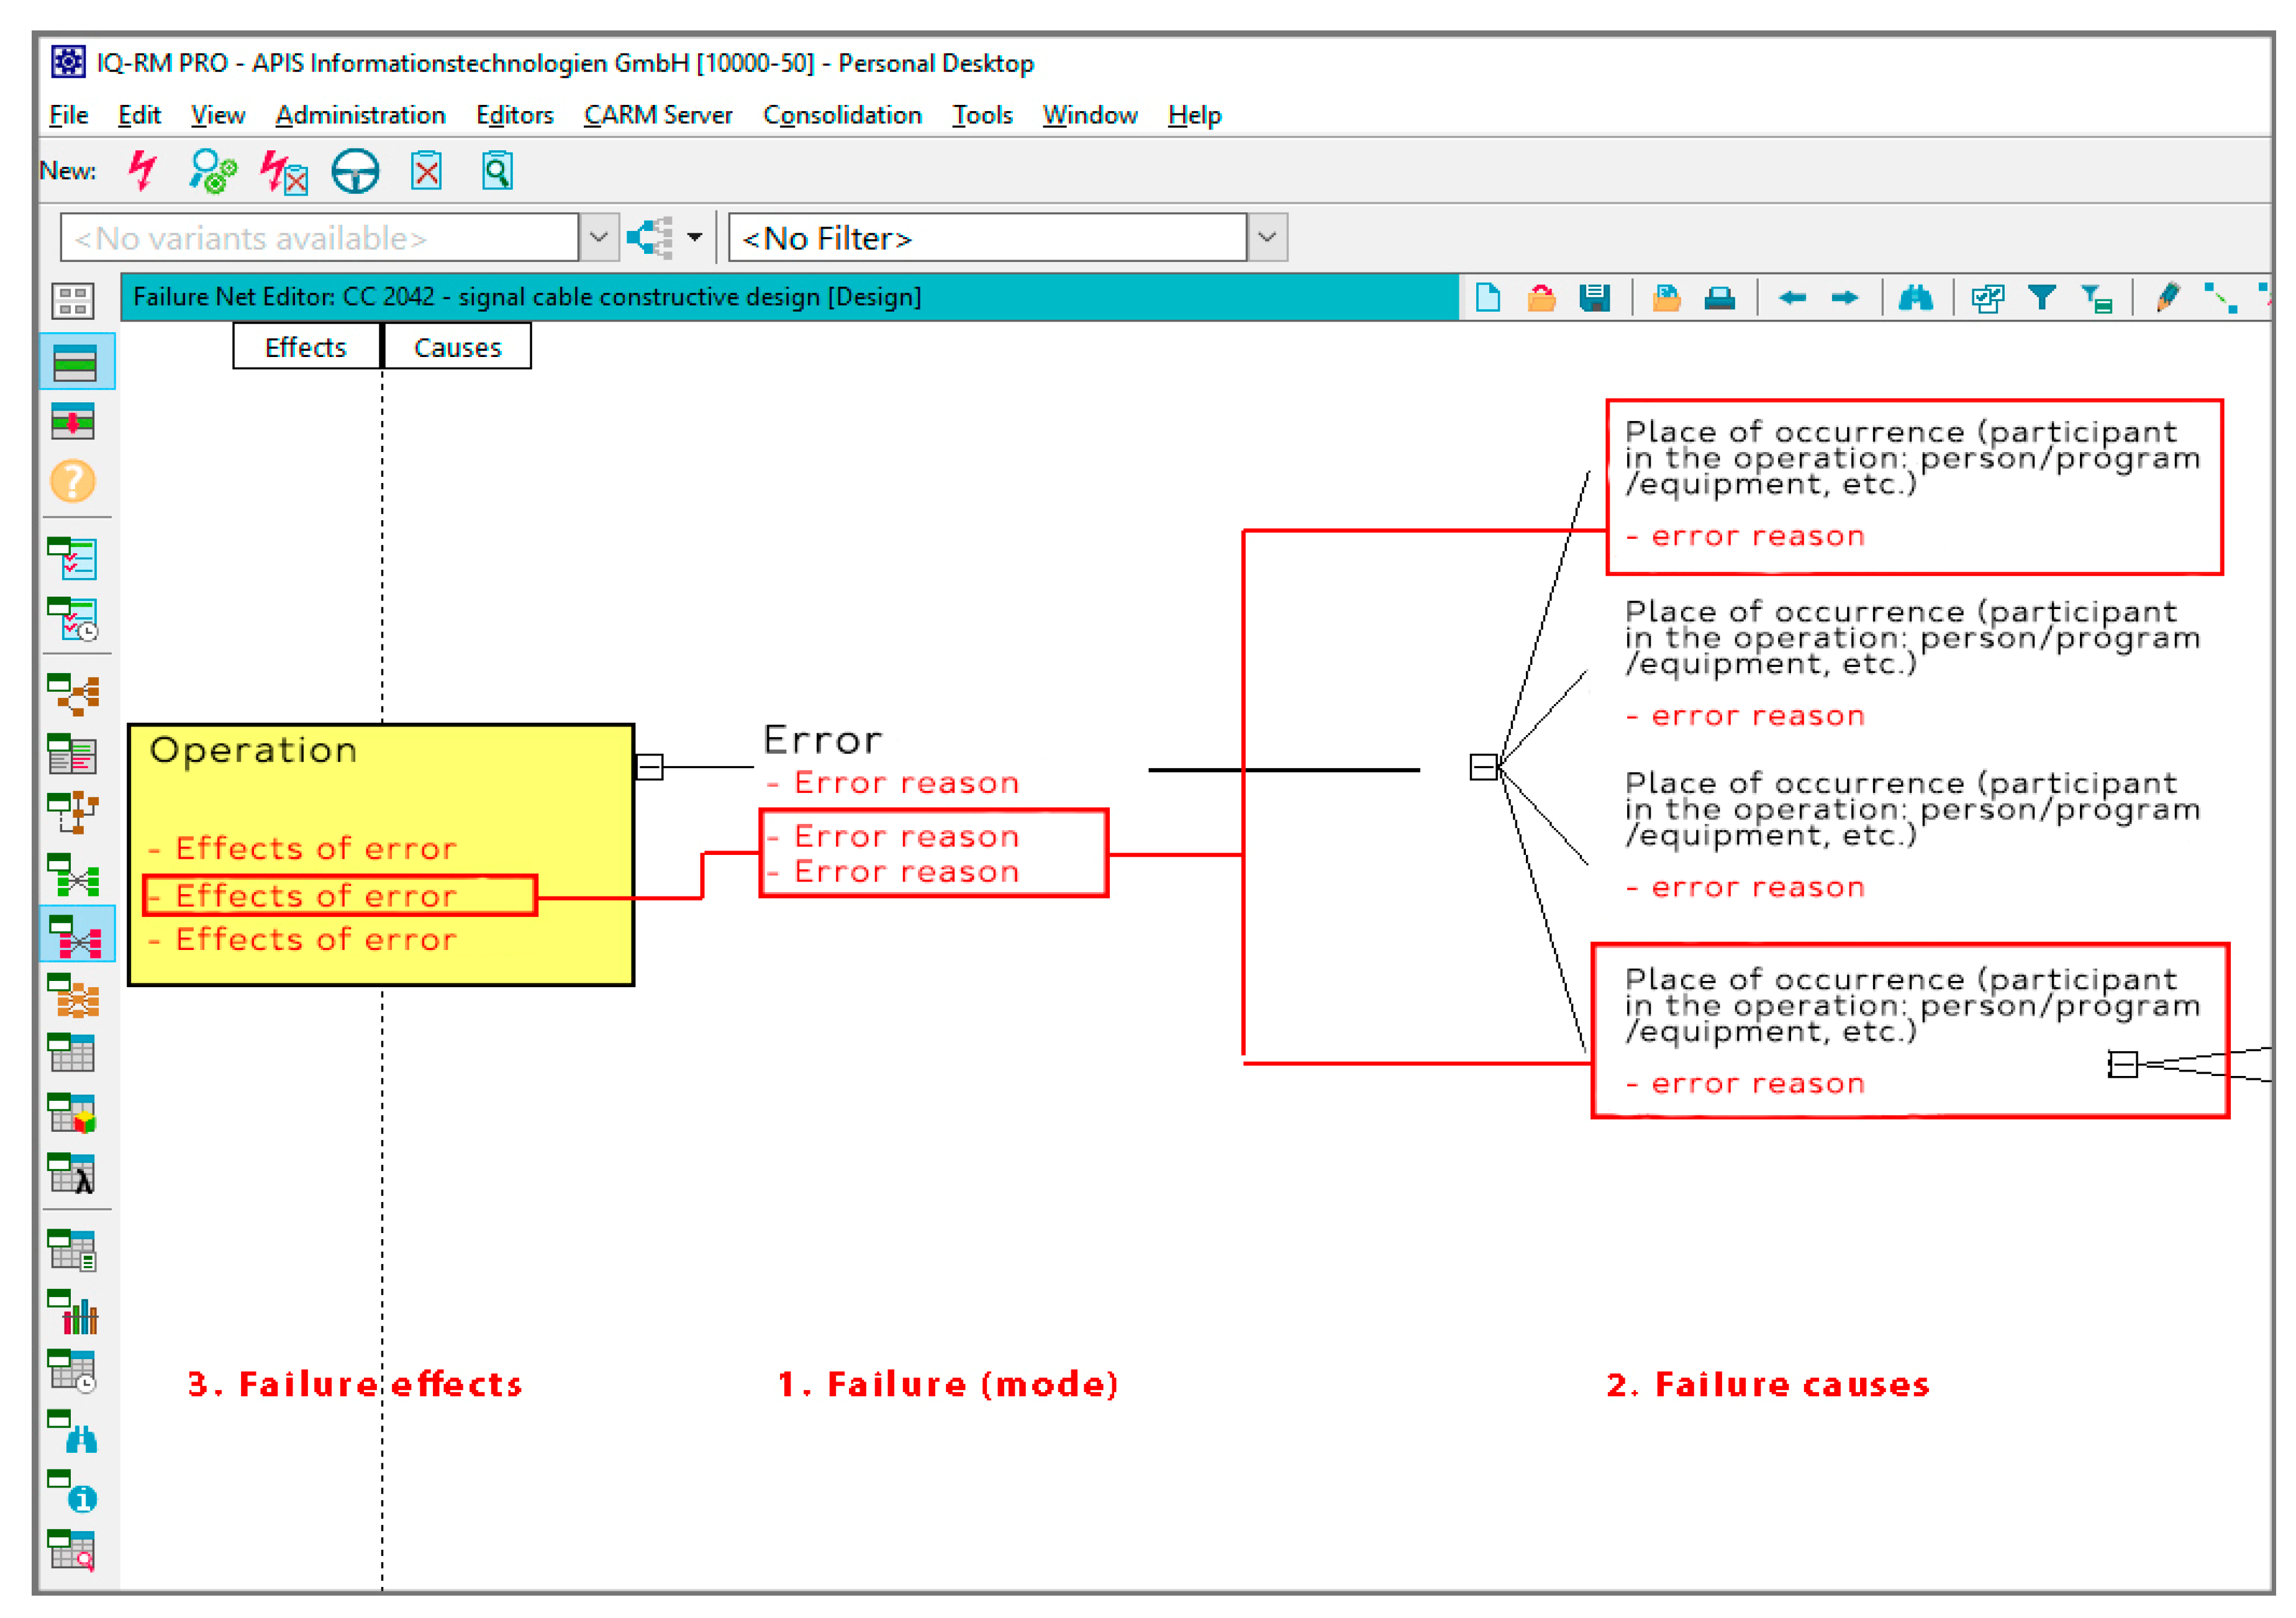
- Draw up a visual flowchart describing the supply process itself. This is necessary in order to step-by-step identify the participants (addressees) of the risk, as well as to consider all kinds of situations in which these dangers are possible;
- Enter all the information into the APIS “IQ-Tools” program so that it is possible to build a block diagram of the links between the risk, its cause, and its consequences;
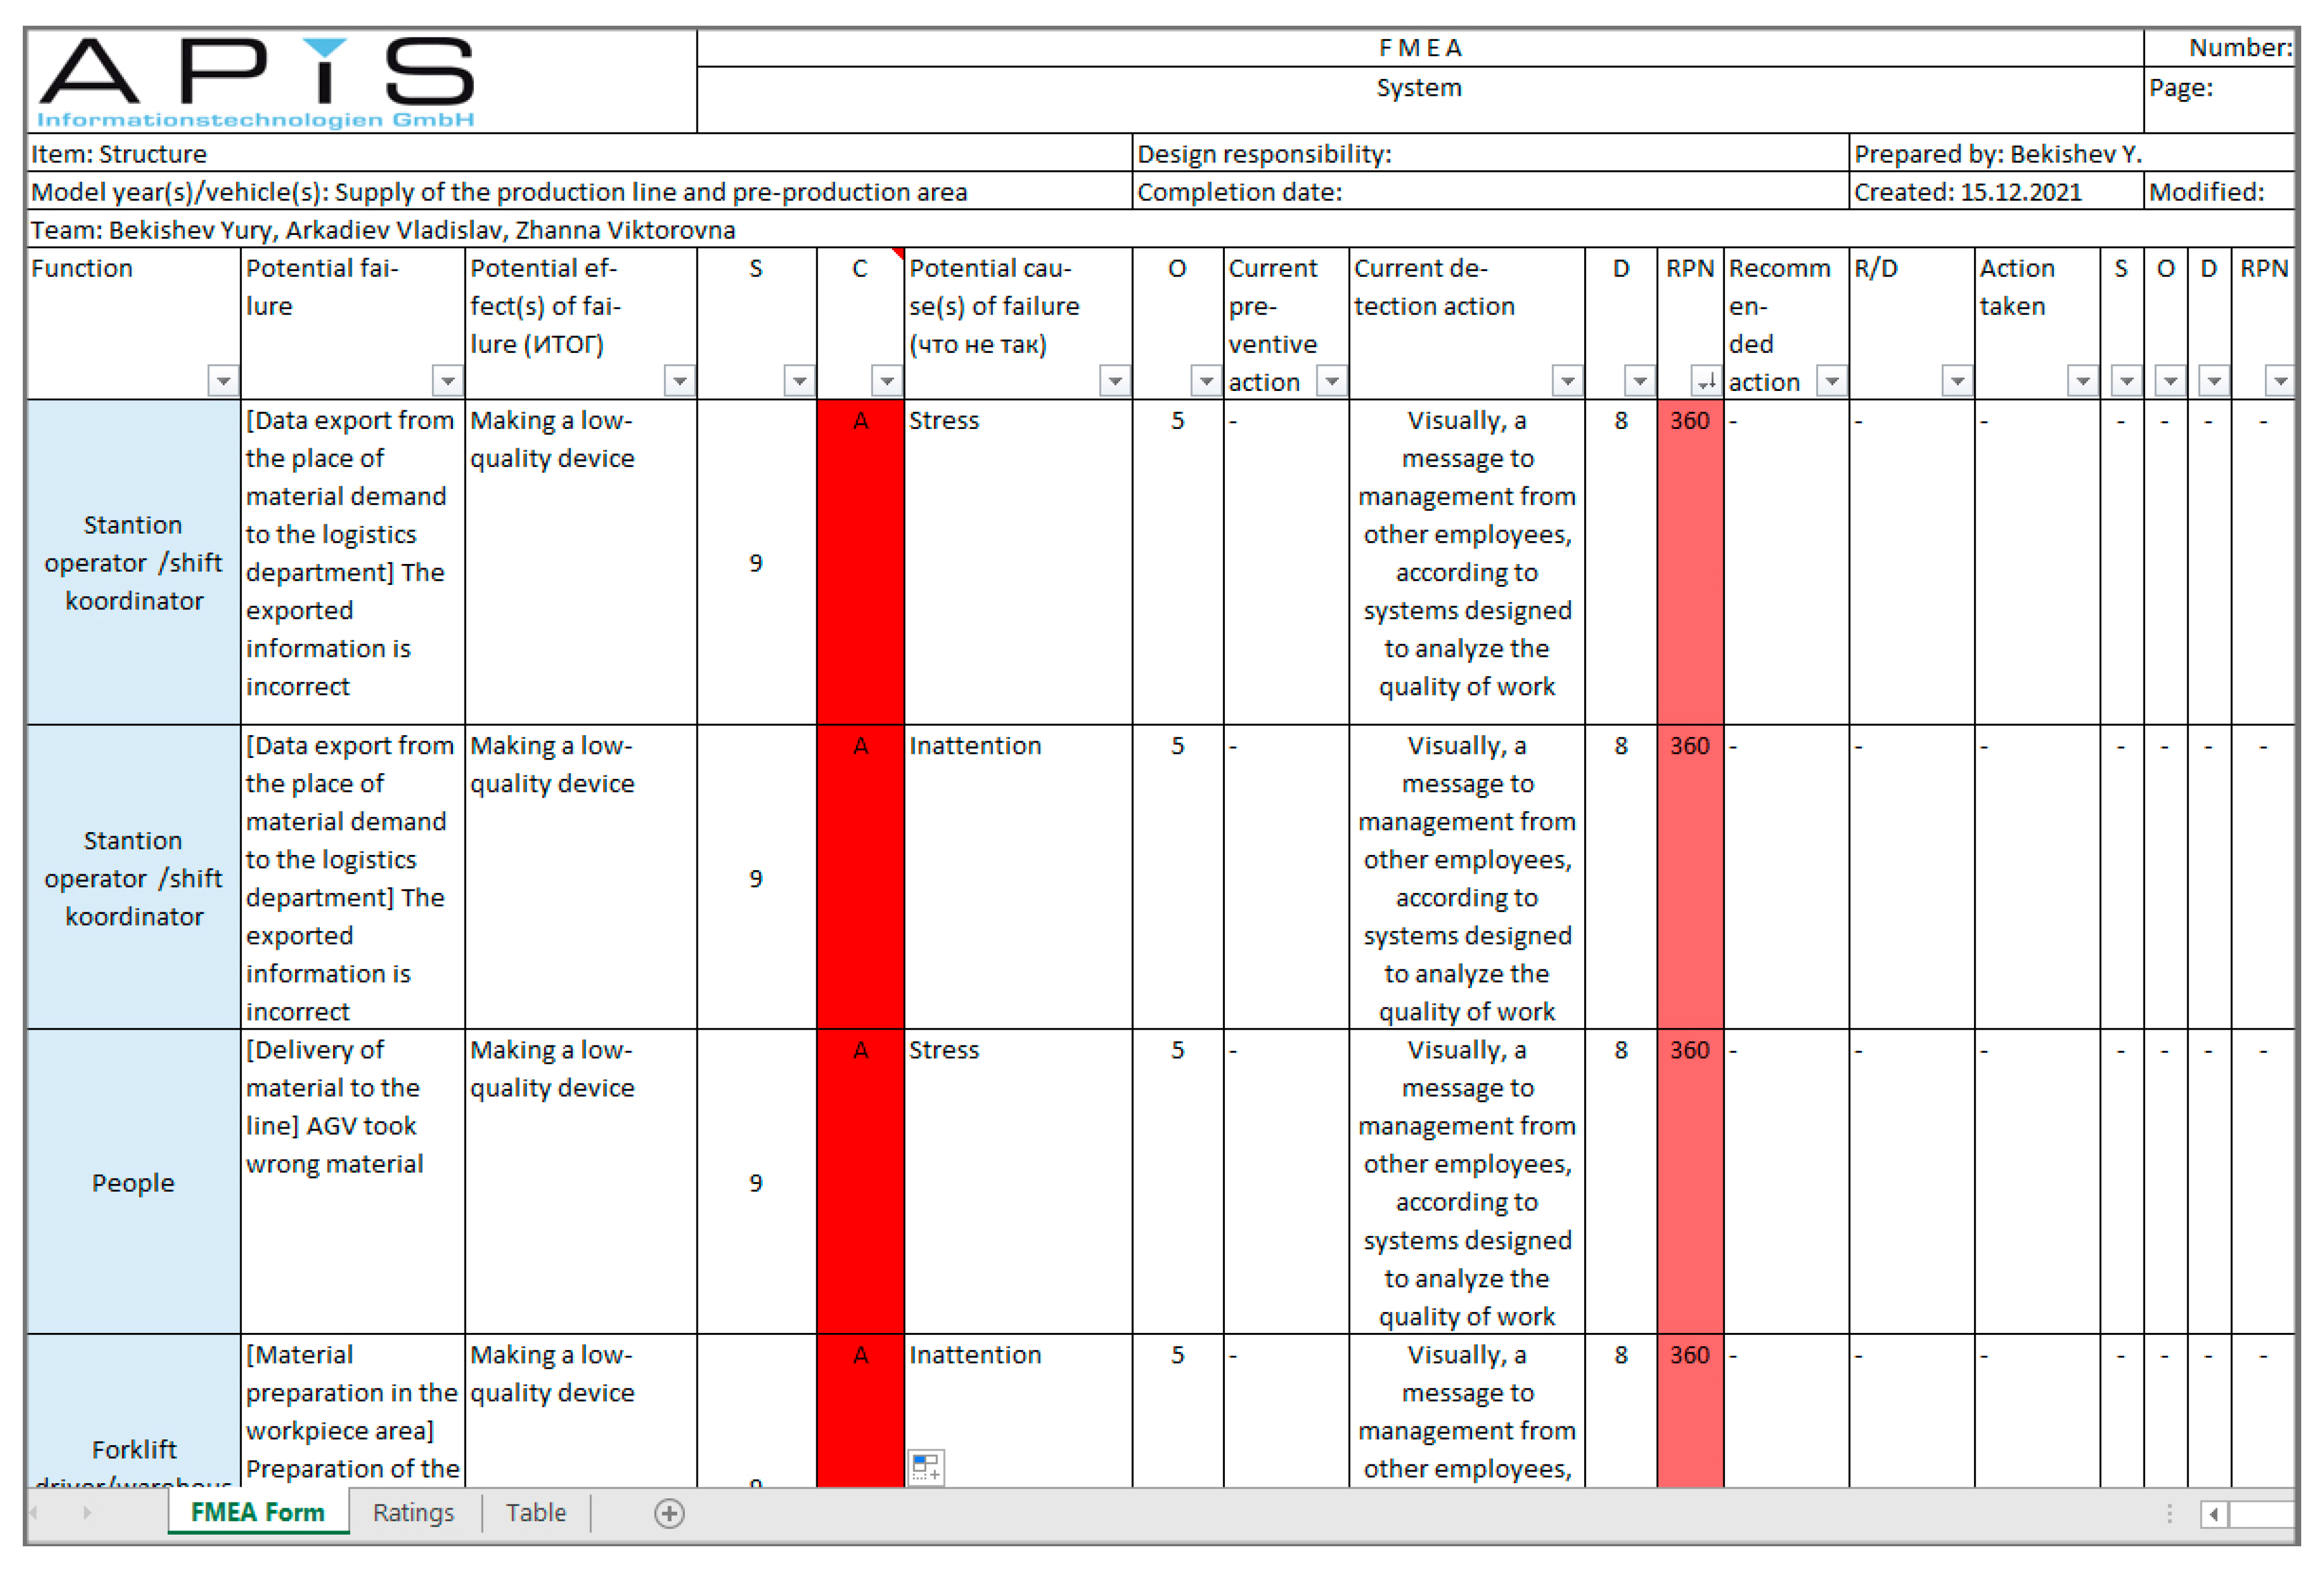
- Download the program report, where it will be possible to rate each risk and review the main trends.
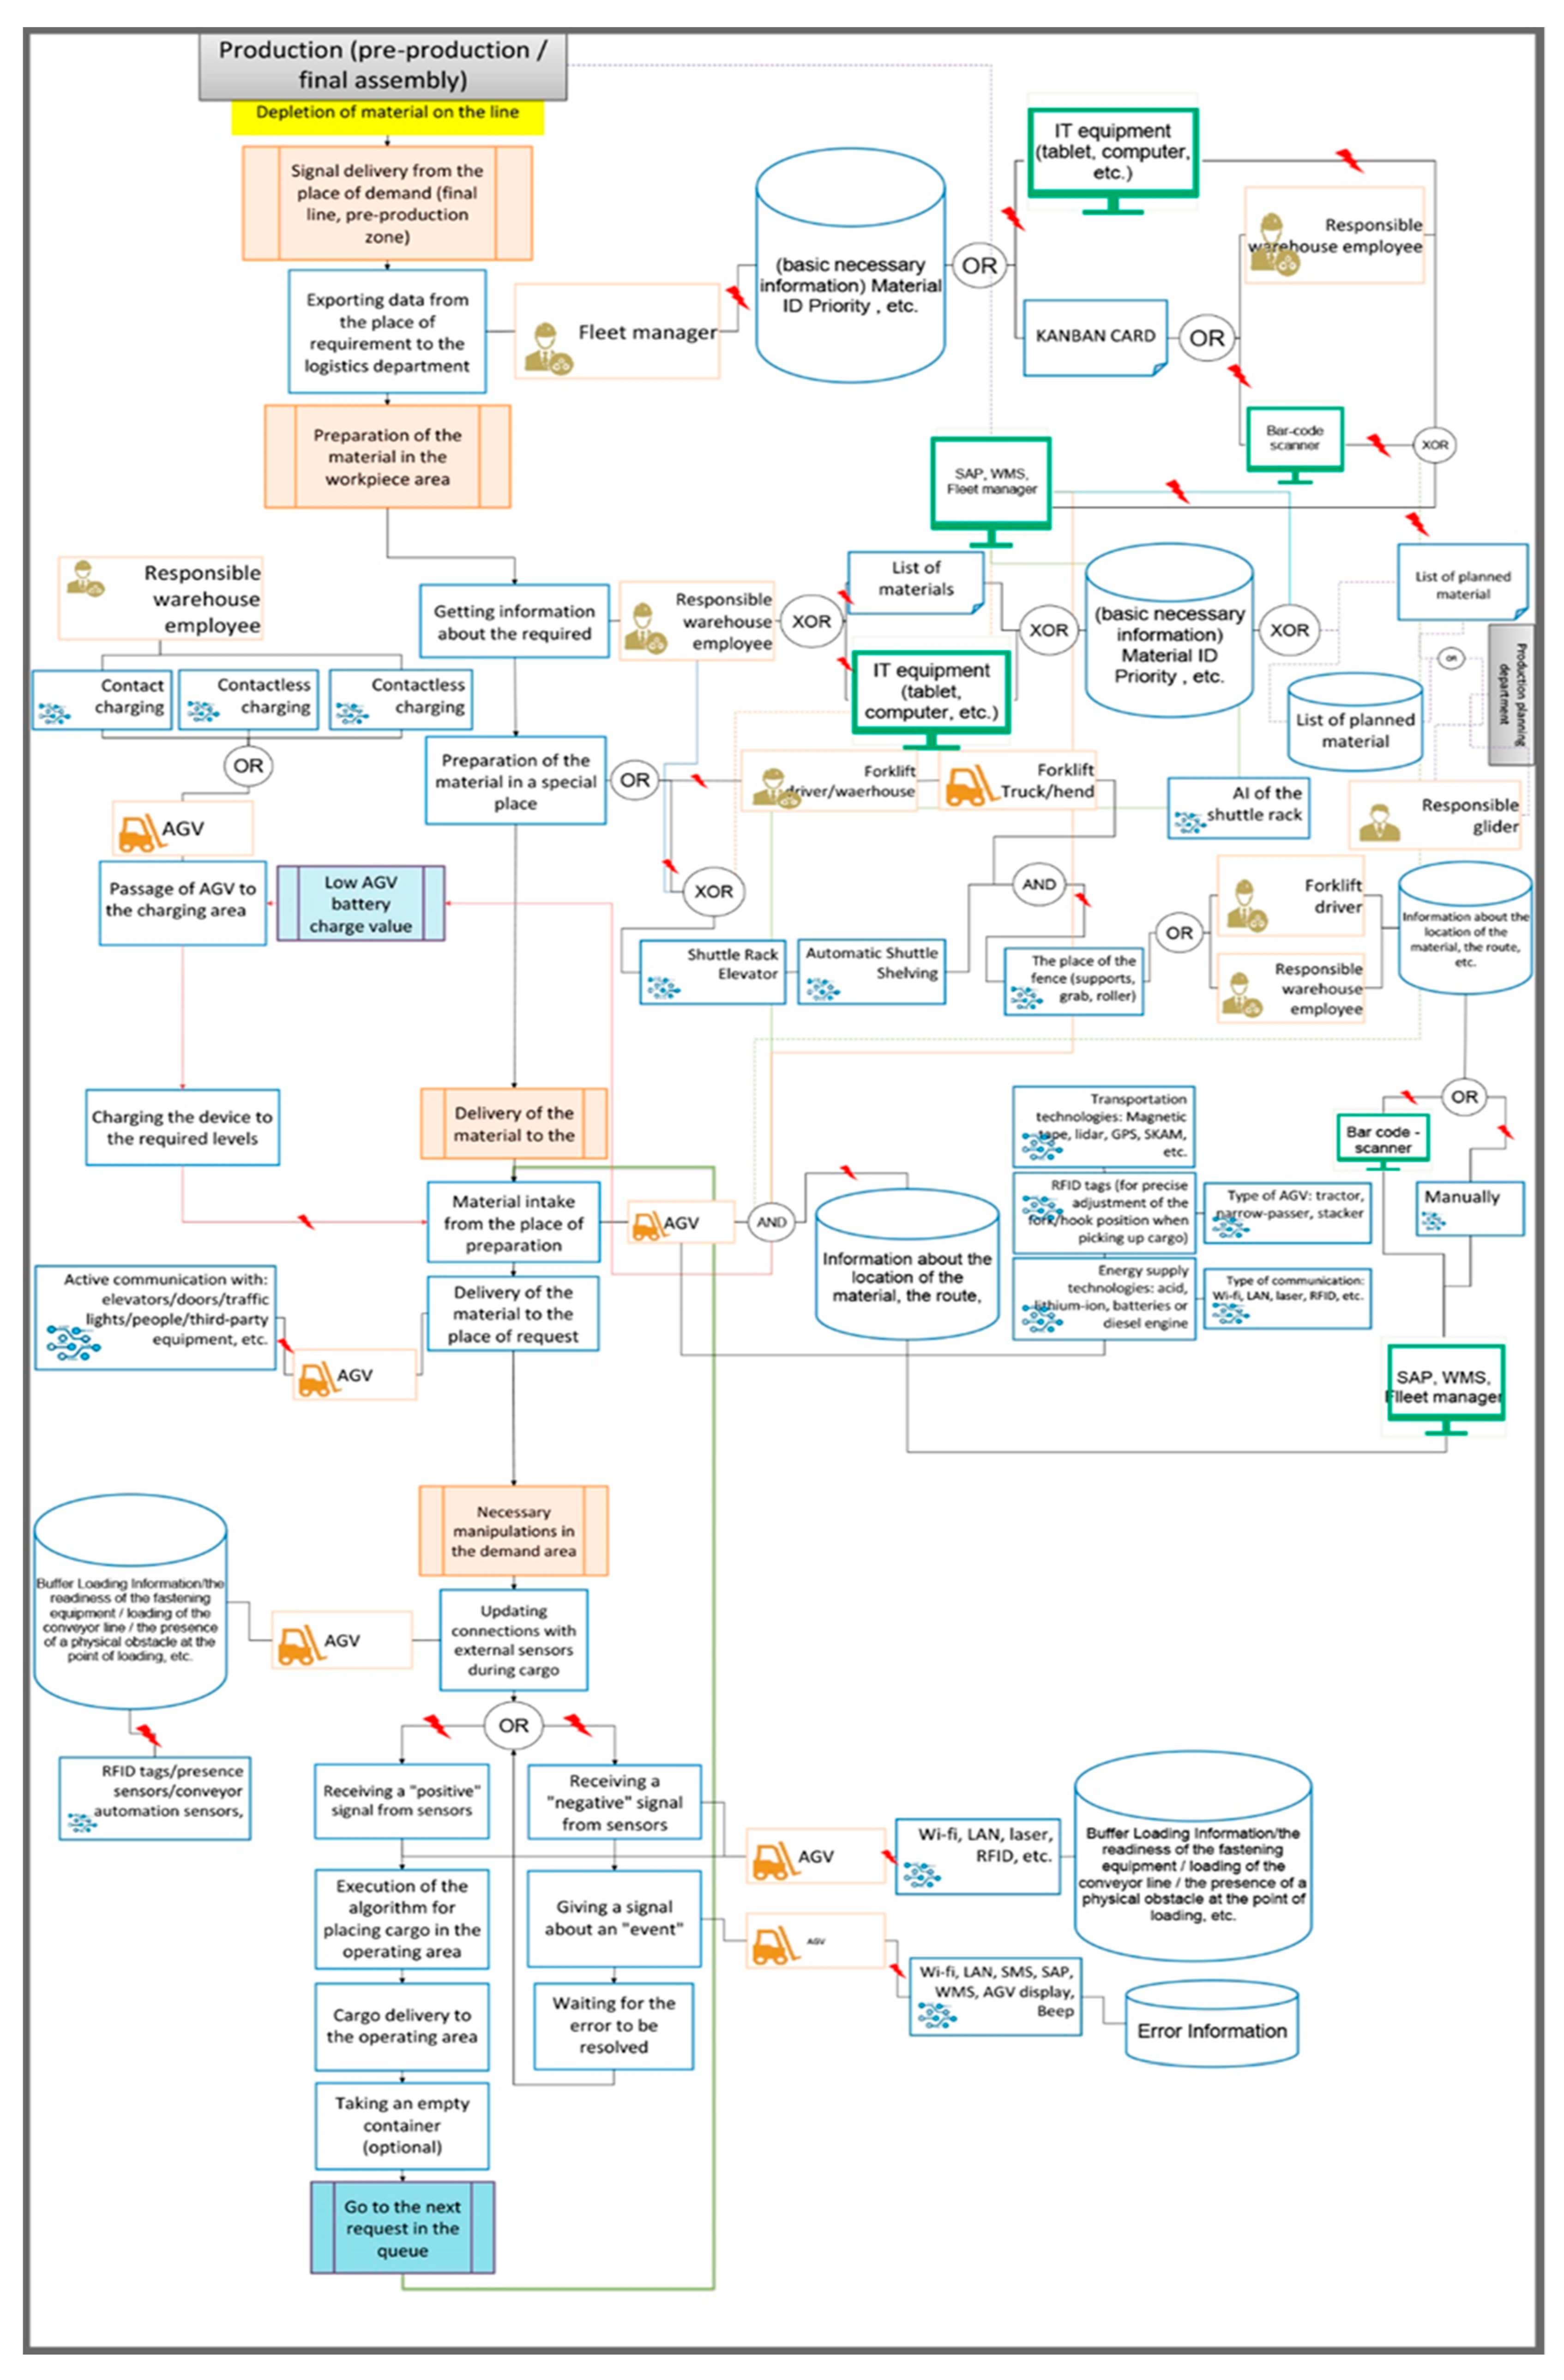
- Signaling a material requirement at the assembly line and relaying data to the logistics department. The signal can be sent by various staff members and through different methods, such as the Kanban card system or digital systems like SAP or WMS.
- Receiving requests in the material preparation zone managed by production logistics. Depending on whether AGV/AMR technology is adapted for stock bins, materials are prepared in designated locations, with assigned storage location numbers provided to the AGV/AMR via software.
- AGV/AMR robot material transportation: Upon receiving information about material quantity and location, the robot executes commands using different material-handling technologies. Important rules include using standardized containers and ensuring that the material weight is within the robot’s capacity. Navigation technology choices, such as lidar and magnetic tape, affect costs, functionality, and reliability. AMR devices use smart spatial orientation by memorizing or downloading map data.
- Material delivery manipulations: AGV/AMR devices perform various actions upon material delivery to the requested site, such as removing empty containers or rearranging spare materials. The devices require sufficient space for these activities because of the safety sensors that ensure the equipment is safe for employees. Not all AGV robots allow human presence in the material-handling area.
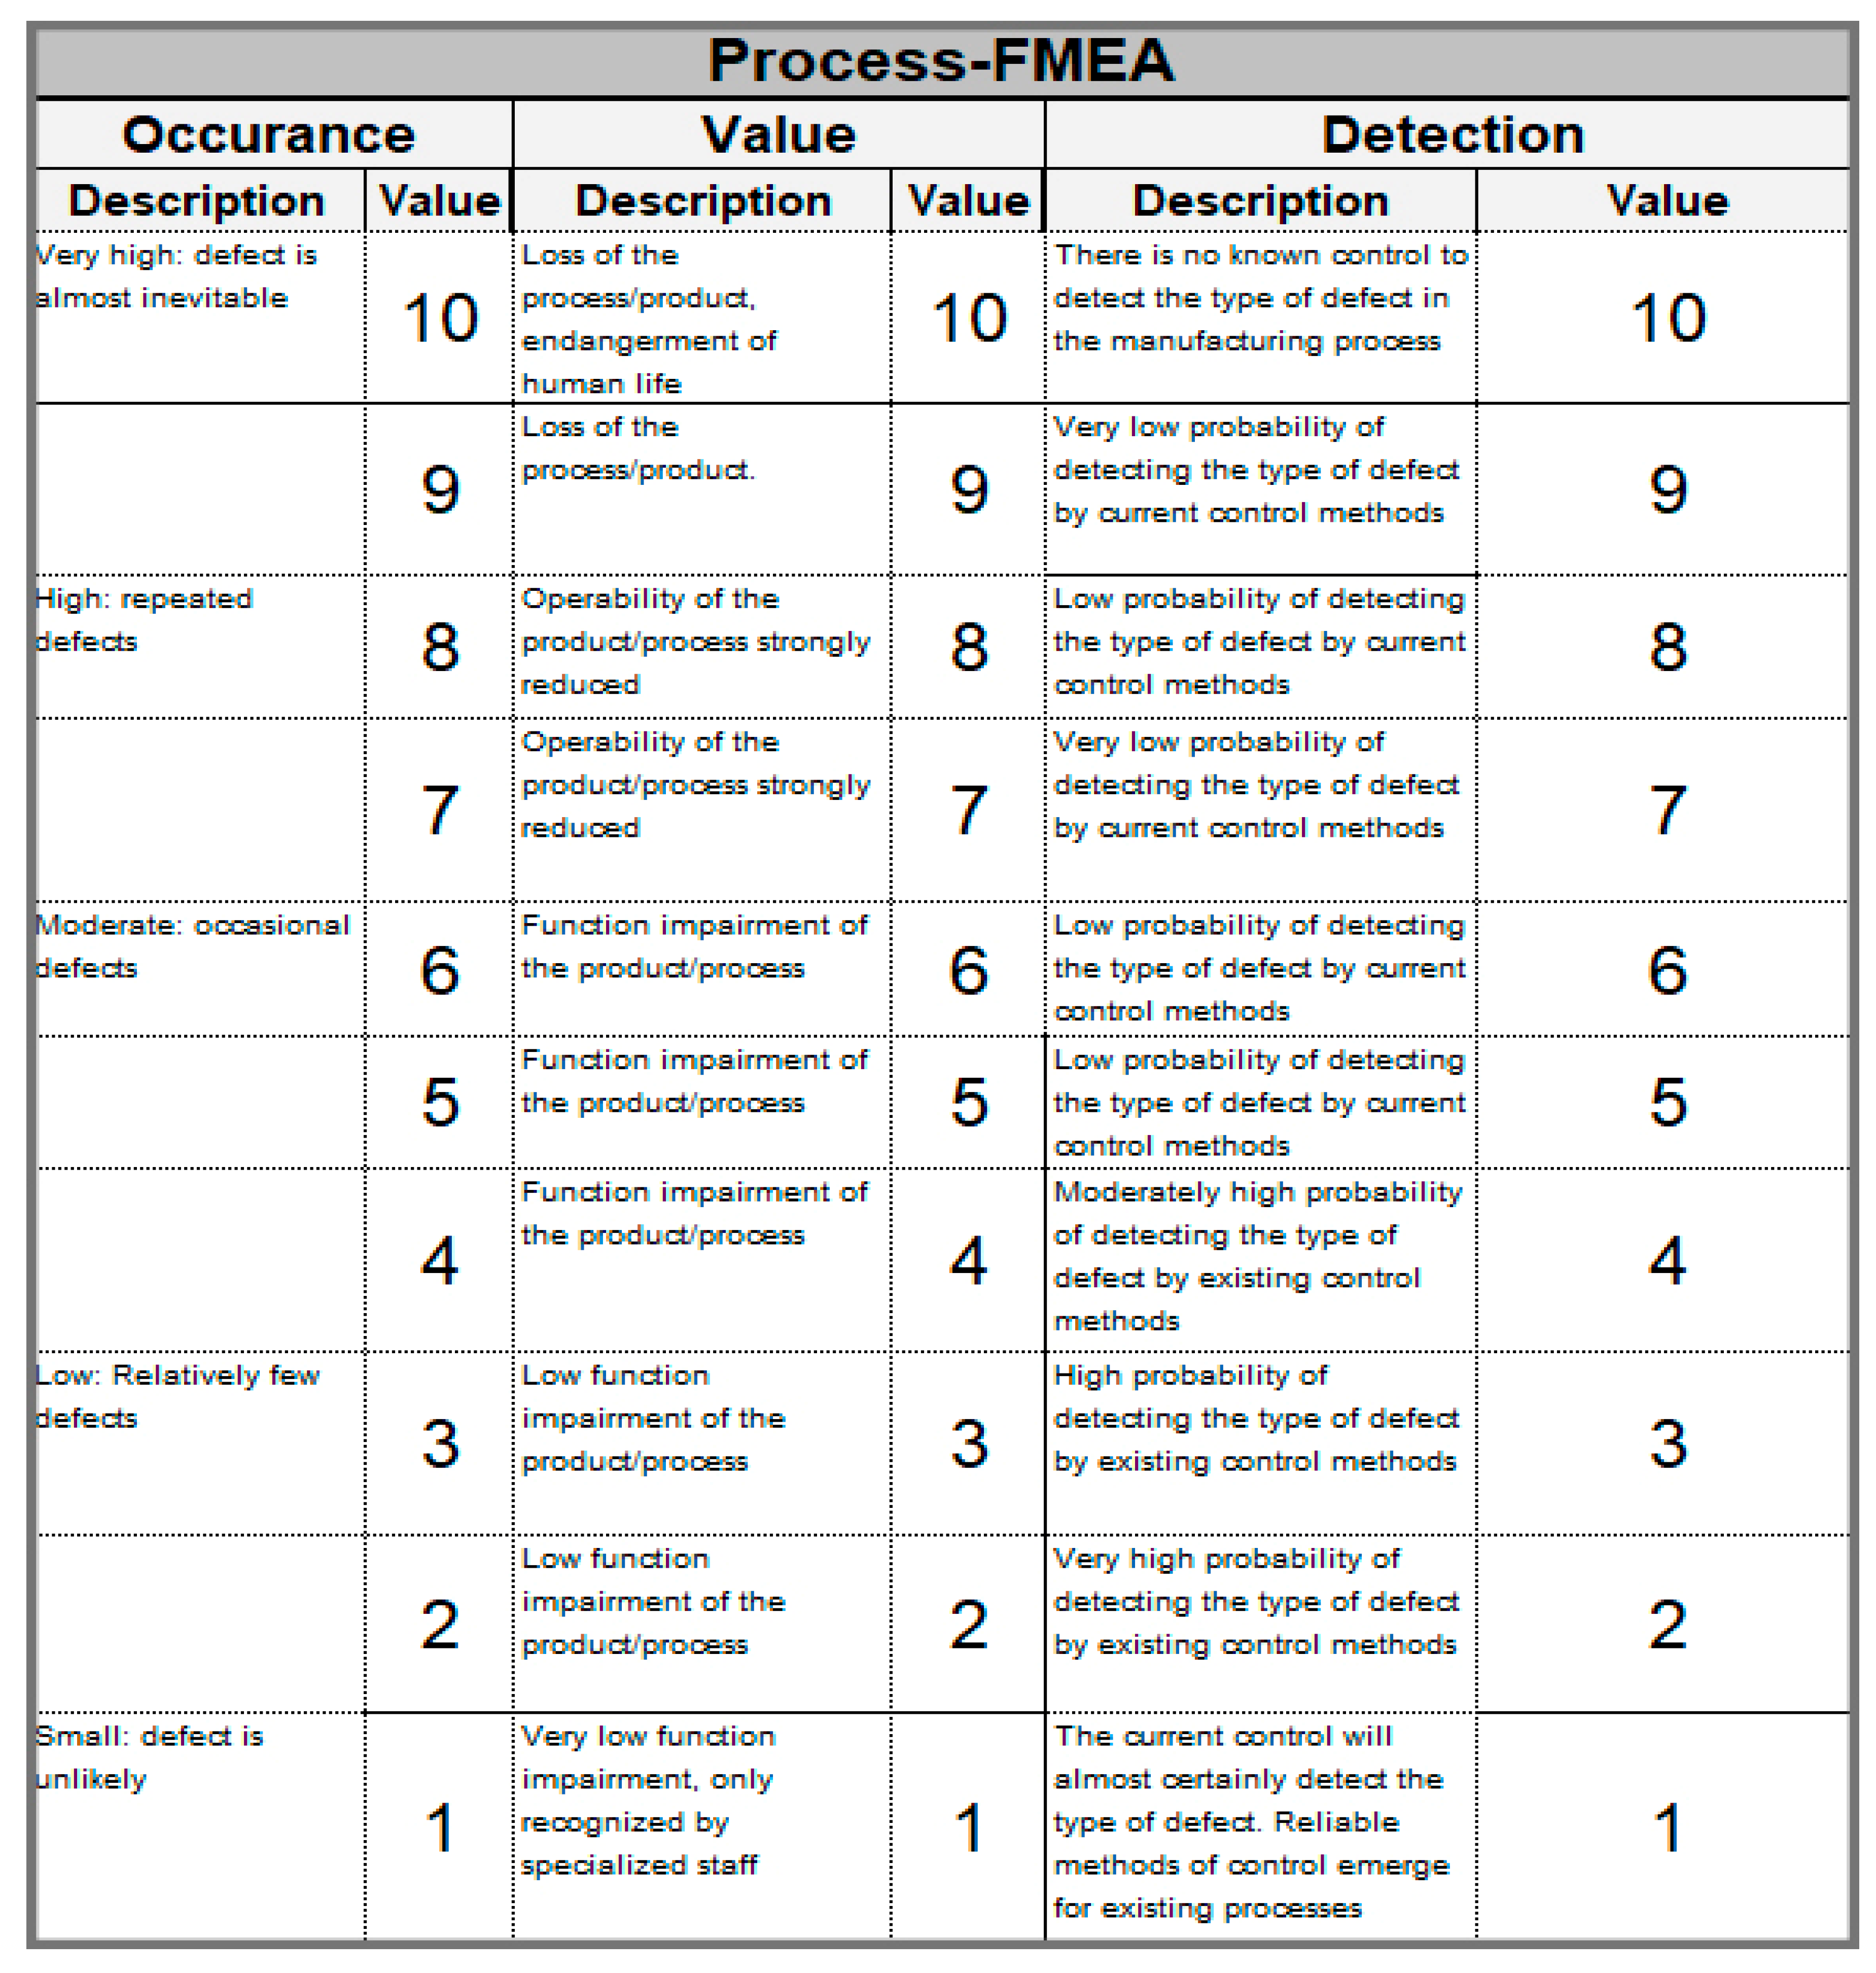
- SEV—severity, the significance of the consequences of the risk;
- OCC—occurrence, risk frequency;
- DET—detection, the ability to detect risk.
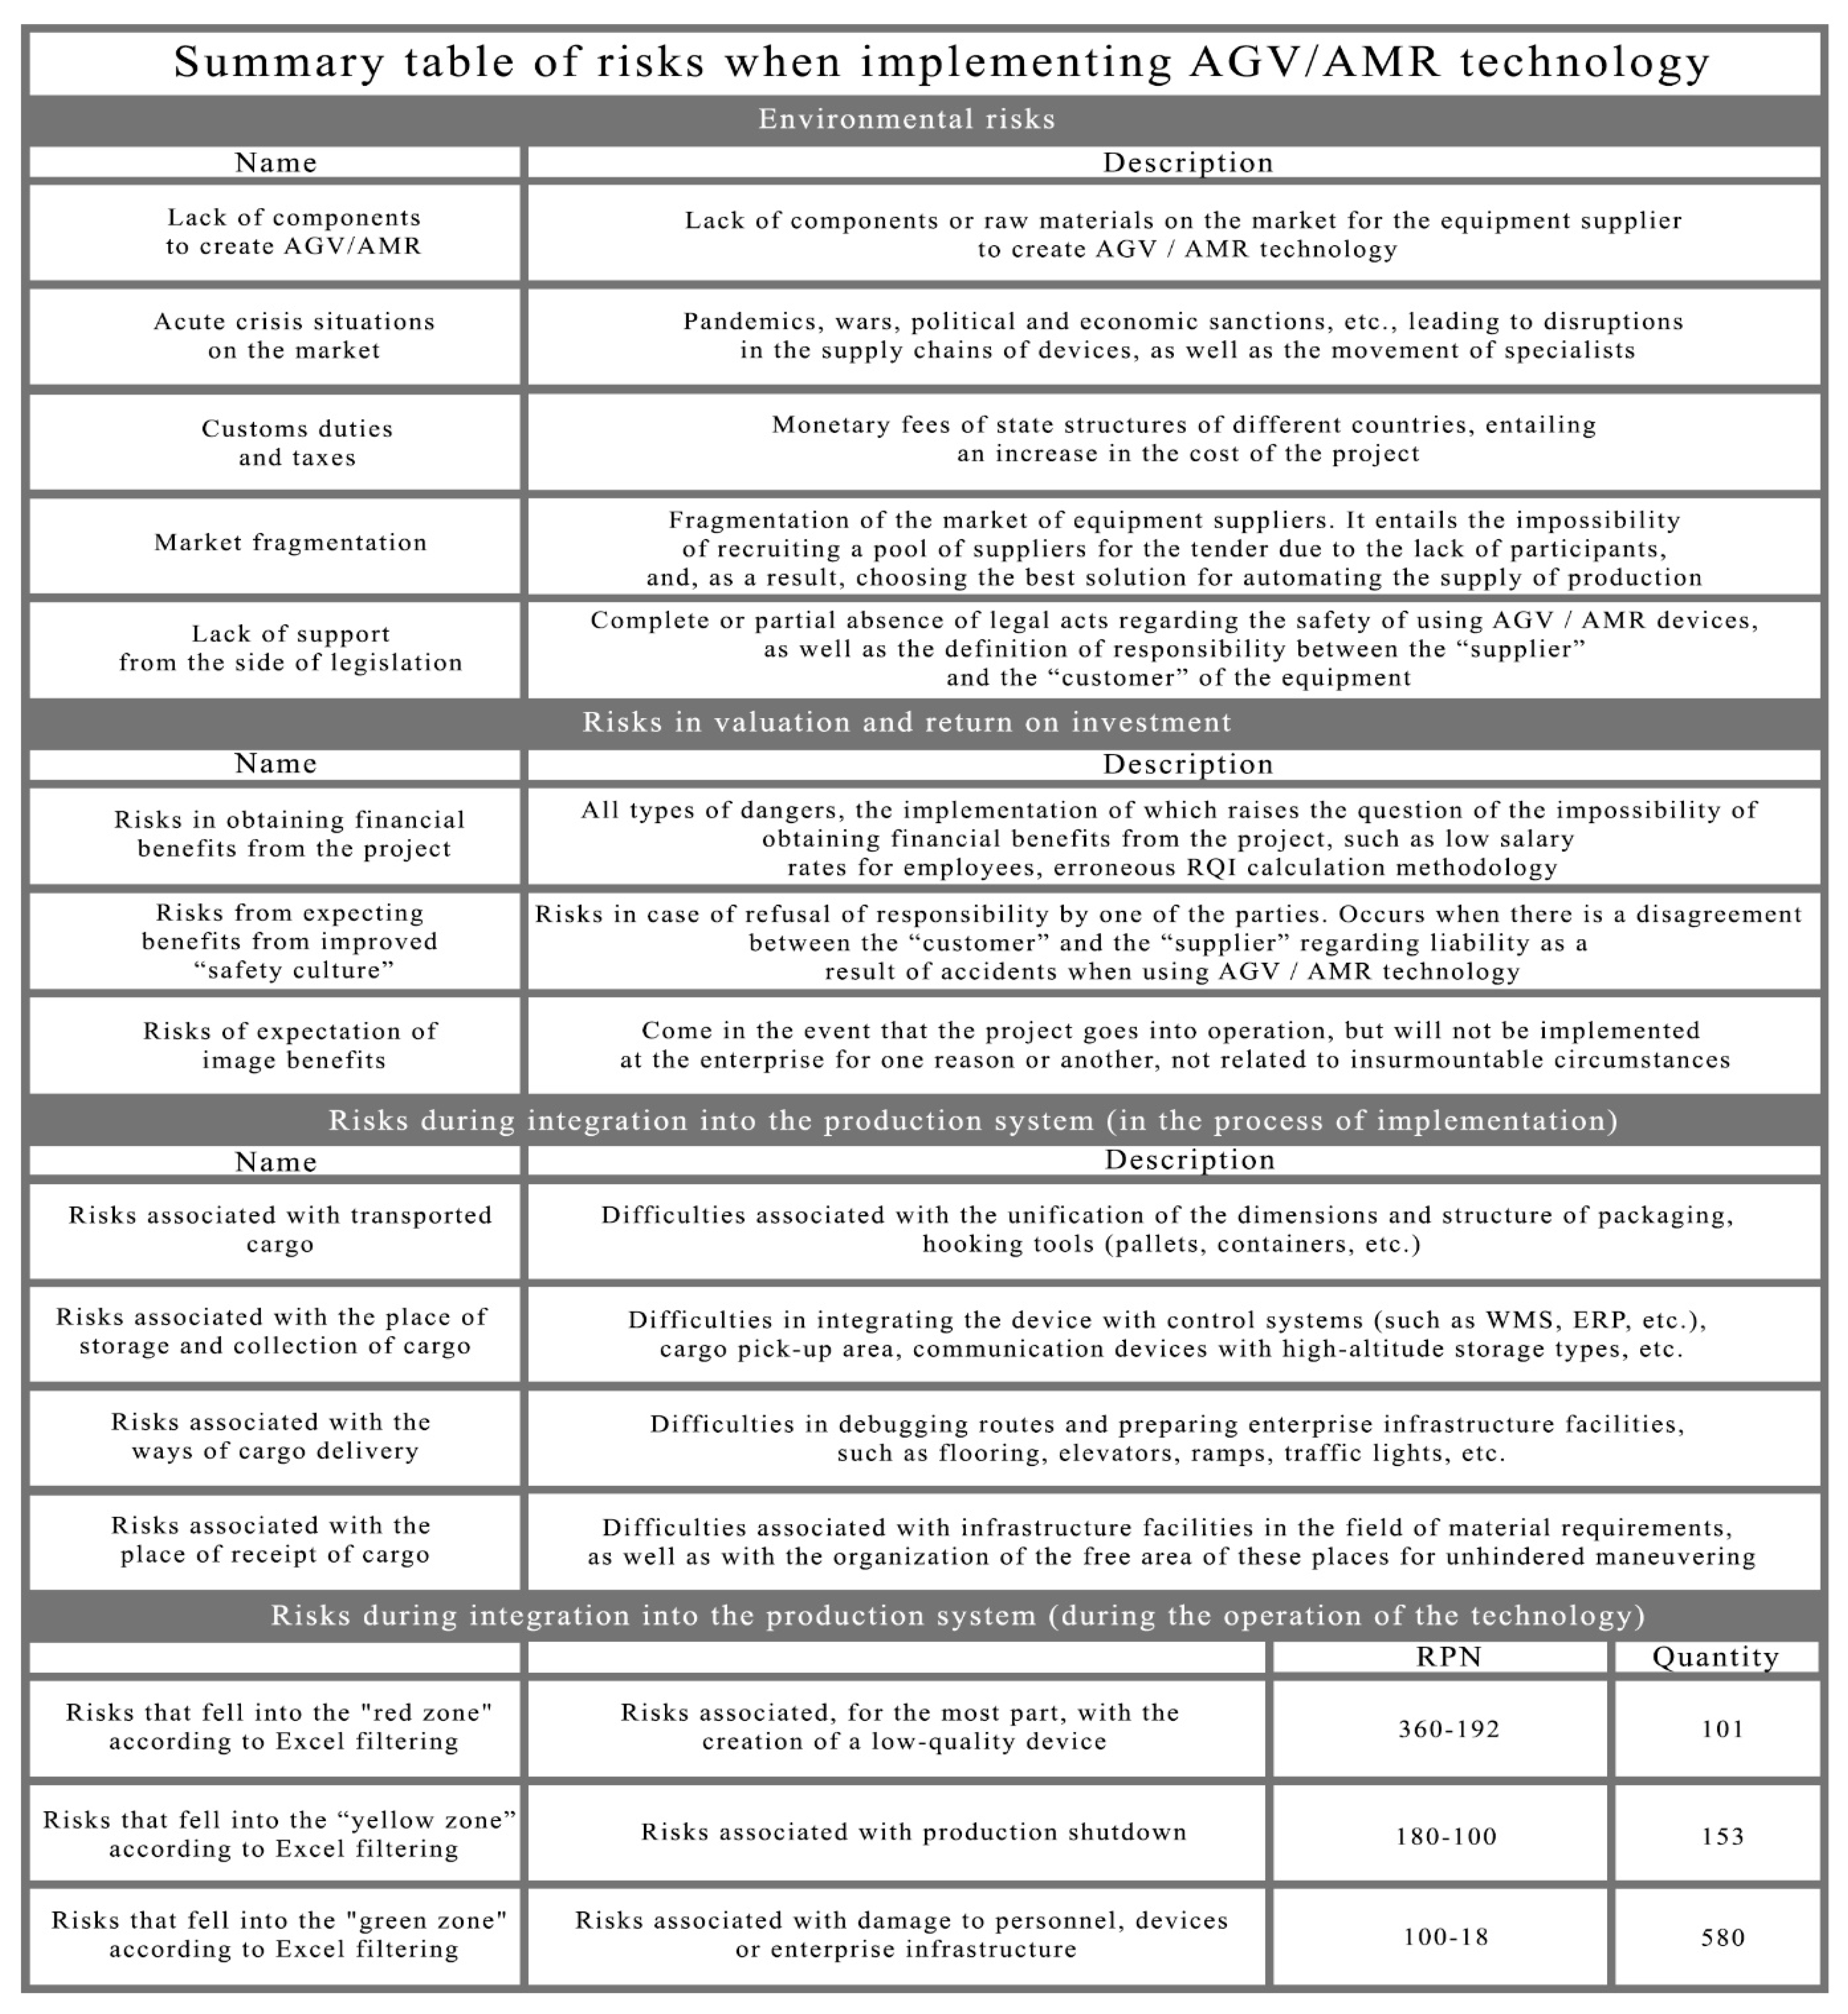
- Using Excel’s filtering and conditional formatting method, the red zone primarily consists of risks related to producing low-quality final devices (101 out of 834). This is due to high severity scores given by company experts and the frequent involvement of enterprise personnel. The analysis highlights challenges in real-time detection of employee stress and inattention, which can lead to errors with consequences such as production stoppage, disrupted supply plans, or the production of low-quality devices.
- The yellow zone primarily encompasses risks related to potential production stoppages during work hours (153 out of 834 risks). Most stem from Wi-Fi network failures and issues with internal communication devices in automated production infrastructure interacting with AGV/AMR technology, such as elevators, doors, and ramps. This can be attributed to fluctuating network coverage affected by external factors, including nearby communication devices and jammers. Additionally, a significant portion of risks involves breakdowns in devices interacting with AGVs/AMRs due to improper maintenance, wear, and incorrect equipment use by factory staff.
- The green zone includes risks mostly related to collision between AGV/AMR devices and plant personnel/equipment/devices. Despite the fact that the “severity” indicator for these risks is set to the maximum (10 points), due to the minimum indicators of “occurrence” and “detection”, these risks fell into the lowest limit of the table. Such low values in the variables are due to the fact that the possibility of occurrence (frequency) of such events is very unlikely due to the safety systems being integrated into AGVs/AMRs, their low speed of movement, and the high possibility of detecting a risk.
4. Discussion
- The occurrences of minor cuts and bruises are not considered to be significant risks as they are covered by the basic medical insurance provided in the social packages. Bosch Russia, for instance, recorded only four nonfatal incidents in more than a decade despite their large workforce of over 700 employees. This scenario is applicable to most companies, which have strict occupational health and safety regulations and comply with labor regulation. This is also confirmed by the conducted FMEA, which has shown that the frequency of realized risks is significantly lower than others.
- Most companies prioritize employee safety and health, as reflected by high FMEA severity scores. However, payouts for employee deaths are much lower than those for defects or production stoppage, which can harm a company’s reputation. Our analysis rates the severity of these risks as very high, indicating their importance in FMEA results. While the value of human life may vary, our findings reflect the current reality in transitive economies.
- Our research is focused on implementing high-tech and safe equipment where human risks are virtually eliminated.
- Choose project team members carefully, assigning them based on each stage’s tasks.
- Evaluate suppliers by analyzing the market and utilizing available resources.
- Examine relevant legislation to ensure smooth collaboration.
- Ask probing questions to understand suppliers’ viewpoints.
- Establish project deadlines and responsibilities to minimize disputes.
- Account for external risks from the beginning, and maintain communication with both parties’ management.
- To understand where, at the moment, it is possible to apply the technology. The option may differ from the one that was originally set by the management and offer a new option to the company’s management;
- Often, a project for the introduction of automated tools is long-term; most often it does not bring benefits when introducing 1–2 pieces of equipment, but works when you replace them with entire layers of operations performed at the factory;
- Top management who invests in the project at the time of its presentation may ask a completely fair question: “how do you see the future development of the project?”, as they will want to see the development of their capital over time, as well as understand the final cost of the entire project, which will help them in future planning.
- Team selection: It is essential to carefully select a team best suited for the task at hand, considering both the members’ competencies and interpersonal compatibility. Establishing clear roles, responsibilities, and communication channels for the project manager, team members, and stakeholders (internal or external) is crucial for proper interaction and the prompt resolution of issues. Conducting an internal SWOT analysis to accurately gauge the department’s capabilities and resources prior to project initiation will help mitigate the risk of failure and associated negative consequences.
- SWOT analysis: Conducting an external SWOT analysis involves sending the project concept and goals to the procurement department. This offers two benefits: first, it streamlines understanding project needs, while procurement handles market analysis, saving time. Second, it prevents resource-wasting, unique solutions by leveraging standard options. Once requirements are shared, the procurement team evaluates the market for components, specialists, and solution viability, while the project team conducts a parallel analysis, ensuring cost-effective and optimal solutions for the project.
- Reviewing supplier lists and incoming proposals: Once the procurement department posts a cooperation request or sends proposals to organizations working on similar projects, responses will start coming in. However, before the initial meeting between the supplier and the project team, the supplier must be vetted for reliability and adherence to the organization’s external procurement criteria and policies.
- Revision and streamlining of the quote validation process: After a supplier has been approved and initial meetings have occurred, they submit a preliminary quote. At this stage, involve all relevant experts associated with the project’s objectives and those with expertise in various fields (e.g., engineering, design, logistics, finance). Conduct a workshop to evaluate each aspect of the quote and forward any questions from the experts to the supplier to refine the initial offer.
- Accumulation of proposals/preparation for the investment committee: After receiving a number of proposals agreed on with experts, it is necessary to prepare a summary of the proposed solutions and make the decision on which further orientation will be made. It is important that several vendors offer such a solution. Further, based on all available information on the project, it is necessary to prepare a one pager, which will summarize all the information for defending the project at the investment committee.
- One-page project analysis by third parties: After preparing a one-page project summary, it is essential to consult third parties for feedback, which can help avoid simple errors due to inattention. Despite approval from top management or organizational boards and guaranteed funding, thorough preparation is crucial. Management opinions may change, and projects often require multiple approvals, including potential opposition to certain aspects. Keep this in mind throughout the process.
- Checking of the project by the investment committee: After the project is submitted and defended in the investment committee and before a decision is made to allocate funds for it, the project is checked by special experts of the organization according to the rules and procedures that are enshrined in it (the organization).
- Fine-tuning of project details with specialists: Once funding is secured, proposals from each supplier must be thoroughly examined. Every decision should be meticulously addressed, and the final commercial offer should not have ambiguities or vague statements. This is crucial because making changes post-tender or prepayment becomes extremely challenging.
- Conducting of a parallel FMEA of financial risks alongside the debugging process: This enables error reduction and provides refined commercial offerings. This paper demonstrates utilizing FMEA in an automated enterprise technology project.
- Document and report preparation for the tender: Once final commercial proposals are received, suppliers must be notified in advance about required documentation. Timely notification is crucial due to preparation time involved. The organization then prepares terms of reference for the tender. If the project’s total cost increases after finalizing preliminary proposals, a new approval request is submitted to the investment committee. Either the updated amount is approved, or the project is adjusted to fit within the original scope.
- Conducting of the tender: During this stage, only personnel handling technical aspects of the tender can intervene in the process. Notably, companies not involved in approvals can also participate. These firms undergo integrity and risk checks and can become suppliers if successful. Rigorous evaluation of applications by procurement, as well as re-examination of previous partners, is crucial at this stage.
- Assessment of payment integrity: During advance payment and financial risk analysis, the financial and accounting departments should ensure the payment’s integrity and protect the organization from fraudulent schemes. The division of pre- and postpayment is necessary for safeguarding both the project’s customer and contractor.
- Risk management: Throughout the project, the team must work with the FMEA risk table, monitor progress, hold workshops on risk management, and oversee the integration of the infrastructure into the organization. It is crucial to communicate project information to all relevant employees to ensure proper understanding in case of future issues.
- Quality assurance: Afterward, the team must analyze and stress-test the developed solution to ensure its regular function and stability.
- Manager handover: Once tests are complete, the project is handed over to the manager, who decides if further questions or issues remain regarding the project and evaluates whether the supplier fully fulfilled the contract’s requirements.
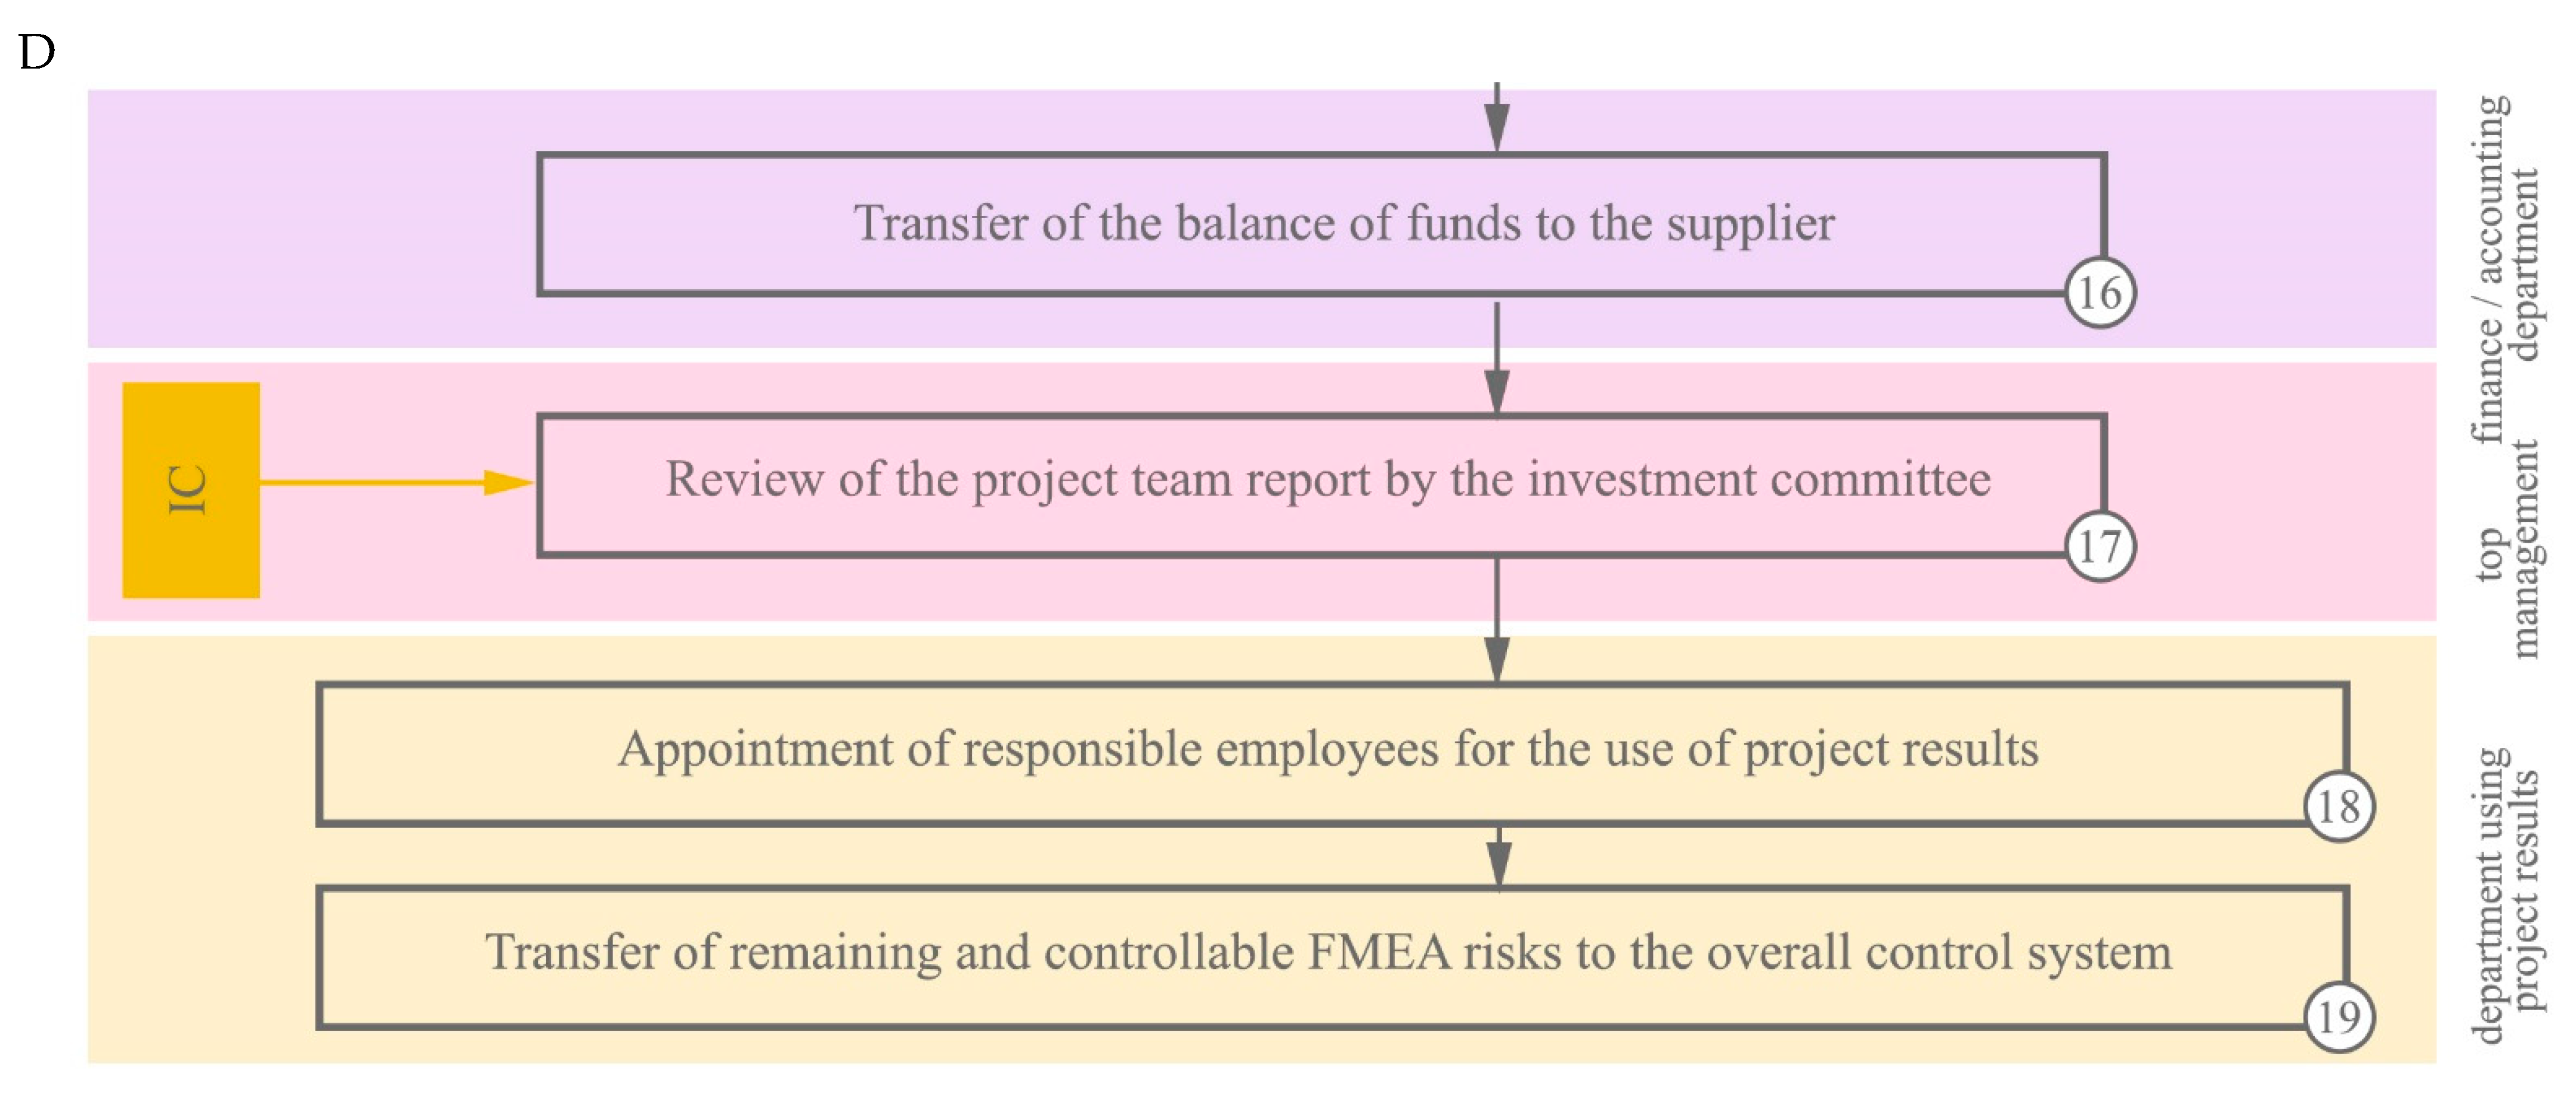
- Financial assessment: When the project is handed over, the finance and accounting departments must address potential threats during the subsequent balance-of-funds transfer to the supplier.
- Investment committee review: The investment committee reviews the project team’s report, signed by the project’s supervising head, to analyze the validity of the money spent.
- Oversight: After project implementation, designate responsible employees for its ongoing use and oversight. Ideally, those informed about the project since its inception should be appointed.
- Generalization: Concurrently with the assignment of responsible employees, transfer the remaining and controlled FMEA risks to the enterprise’s general hazard control system for future monitoring and management.
- Risk Reduction: FMEA identifies various failure modes and their effects on the system, enabling project managers to prioritize risks and focus on the most severe and likely occurrences. This can lead to better mitigation strategies, decreasing the probability of failure and improving overall reliability.
- Cost Savings: Addressing potential failure modes and their effects early in the project can help prevent costly errors and rework later on. This can lead to significant cost savings in development, production, and maintenance stages.
- Improved Efficiency: FMEA can optimize the deployment of robotic technologies by identifying bottlenecks and inefficiencies in the system. This understanding can lead to performance enhancements, ultimately improving system efficiency and productivity.
- Enhanced Safety: Robotic technologies can pose safety risks to workers, especially when implemented in industrial settings. FMEA allows project teams to pinpoint potential hazards and develop safeguards to prevent accidents, leading to a safer work environment.
- Quality Improvement: By identifying and addressing failure modes, FMEA helps improve the quality and consistency of projects. This, in turn, leads to higher customer satisfaction and potential increases in market share.
- Streamlined Communication: FMEA requires extensive collaboration between various teams, such as engineering, software development, and operations. This cross-functional communication fosters a unified understanding of the project’s risks and fosters a problem-solving culture.
- Regulatory Compliance: Many industries subject to safety and quality regulations require the use of risk-management tools like FMEA. Employing FMEA can help demonstrate due diligence and ensure compliance with applicable standards and regulations.
5. Conclusions
- The red zone: risks primarily associated with the creation of a low-quality final production device.
- The yellow zone: any possible production shutdowns during the working day (mostly due to Wi-Fi and internal communication devices of automatic production infrastructure facilities failure).
- The green zone: risks of a collision between AGV/AMR devices and plant personnel/equipment/devices.
- Assemble a diverse project team comprising stakeholders from various relevant departments.
- Implement responsibility clauses in contracts with deadlines for project suppliers and customers.
- Assess the operational impact of AGV/AMR technology on resources, energy consumption, and long-term costs.
- Determine responsibility for damages or malfunctions caused by AGV/AMR equipment in contracts with suppliers.
- Ensure that the design team understands all of the process algorithms involved, discussing risk analysis with all parties involved.
- Adaption of FMEA for Industry 4.0 Technologies: With Industry 4.0 rapidly evolving, it would be worthwhile to study how FMEA integrates with technologies such as the Internet of Things (IoT), machine learning, and artificial intelligence to improve risk analysis and mitigation in AGV/AMR systems.
- Cross-functional Collaboration: Investigate the impact of cross-functional collaboration among various departments (design, engineering, logistics) on the effectiveness and efficiency of FMEA during AGV/AMR implementation.
- Development of Agile FMEA: Assess the potential of incorporating agile methodologies into the FMEA process, allowing for quicker, iterative, and incremental risk assessment throughout the AGV/AMR integration.
- FMEA Model Performance Metrics: Develop a set of performance metrics for evaluating the effectiveness of different FMEA implementations in AGV/AMR projects, which can help stakeholders select and refine the best risk-management practices.
- FMEA for Multiagent Systems: Investigate FMEA’s applicability for multiagent systems (MAS), where multiple AGVs or AMRs work simultaneously, to better assess the risks associated with complex interaction and communication patterns.
- Standardization of FMEA for AGV/AMR Integration: Develop guidelines and standard processes for using FMEA in the context of AGV/AMR system integration, facilitating easier comparison and adoption of best practices.
- FMEA Training and Education: Examine the role of targeted training and education programs in improving the application of FMEA for AGV/AMR system integration projects.
- Integration of FMEA with Other Risk Assessment Tools: Investigate the potential benefits of combining FMEA with other risk-analysis tools, such as Bayesian networks, fault tree analysis (FTA), or risk matrices, to deliver a more comprehensive risk assessment of AGV/AMR projects.
- FMEA for AGV/AMR Cybersecurity: Assess and develop an FMEA framework focused specifically on cybersecurity threats within AGV/AMR and internal supply systems, aiming to ensure the reliable and secure operation of smart factory environments.
6. Limitations
Author Contributions
Funding
Data Availability Statement
Acknowledgments
Conflicts of Interest
Appendix A
Appendix B
Appendix C
Appendix D
Appendix E
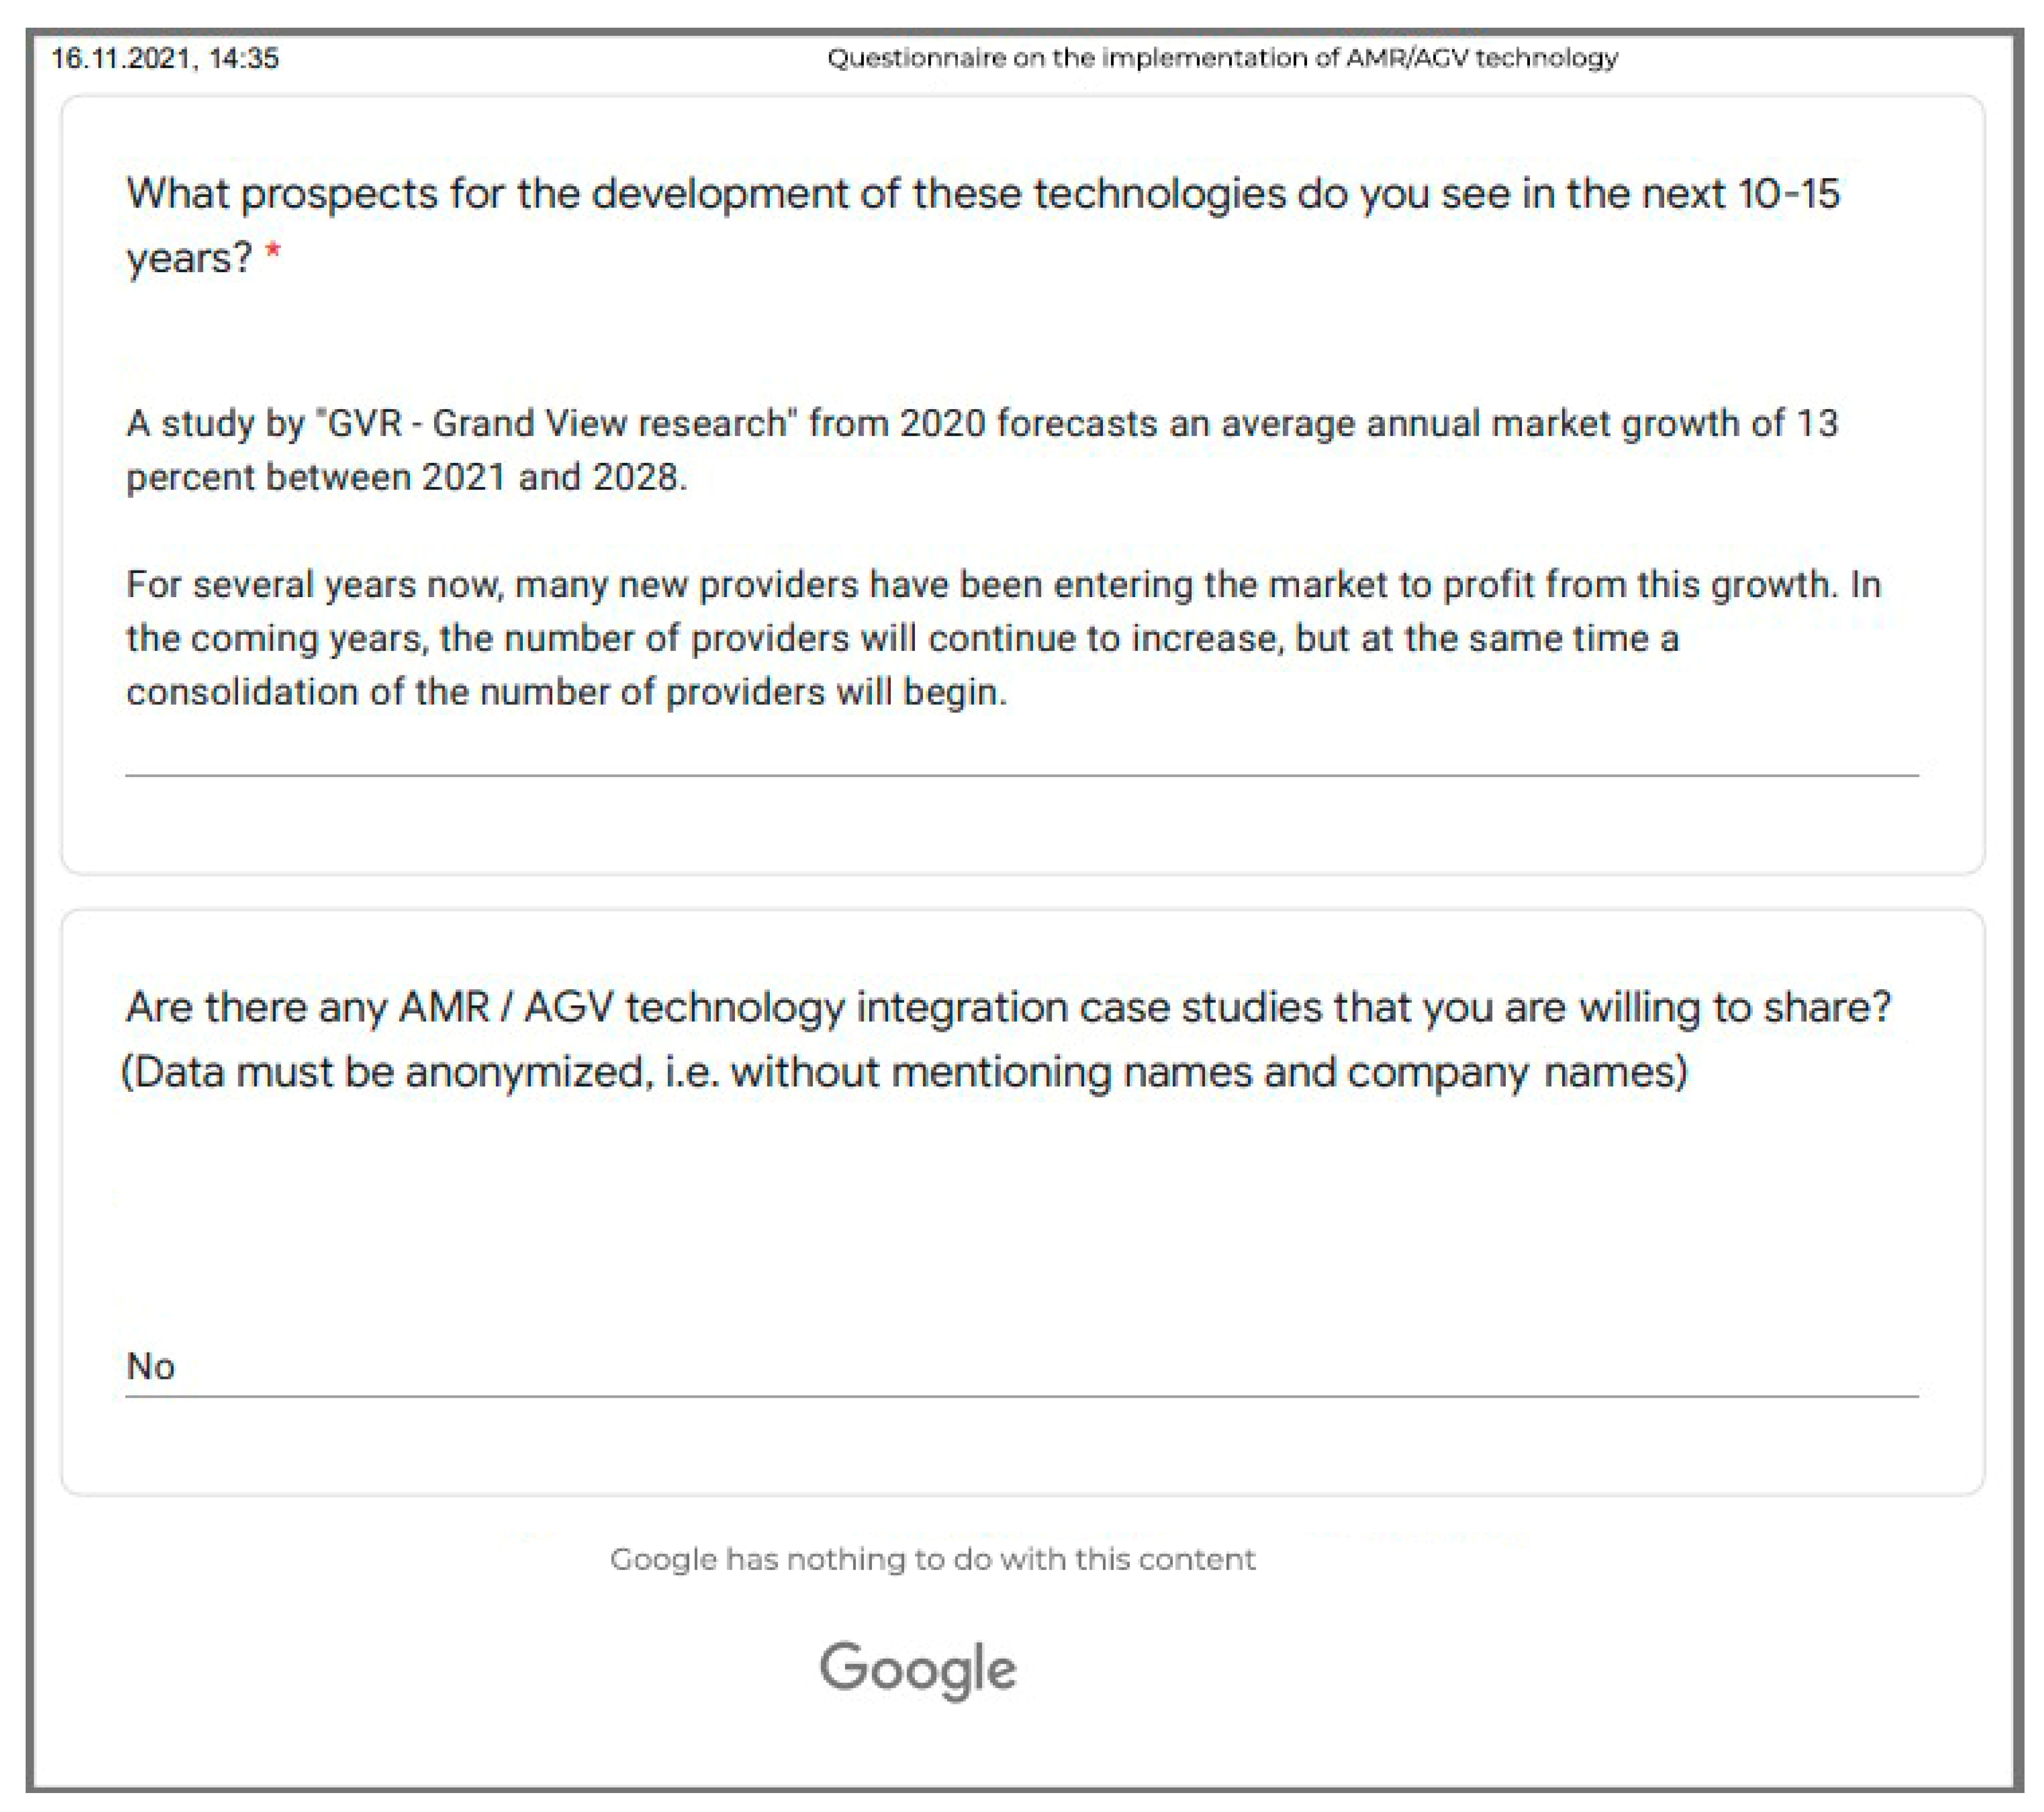
Appendix F
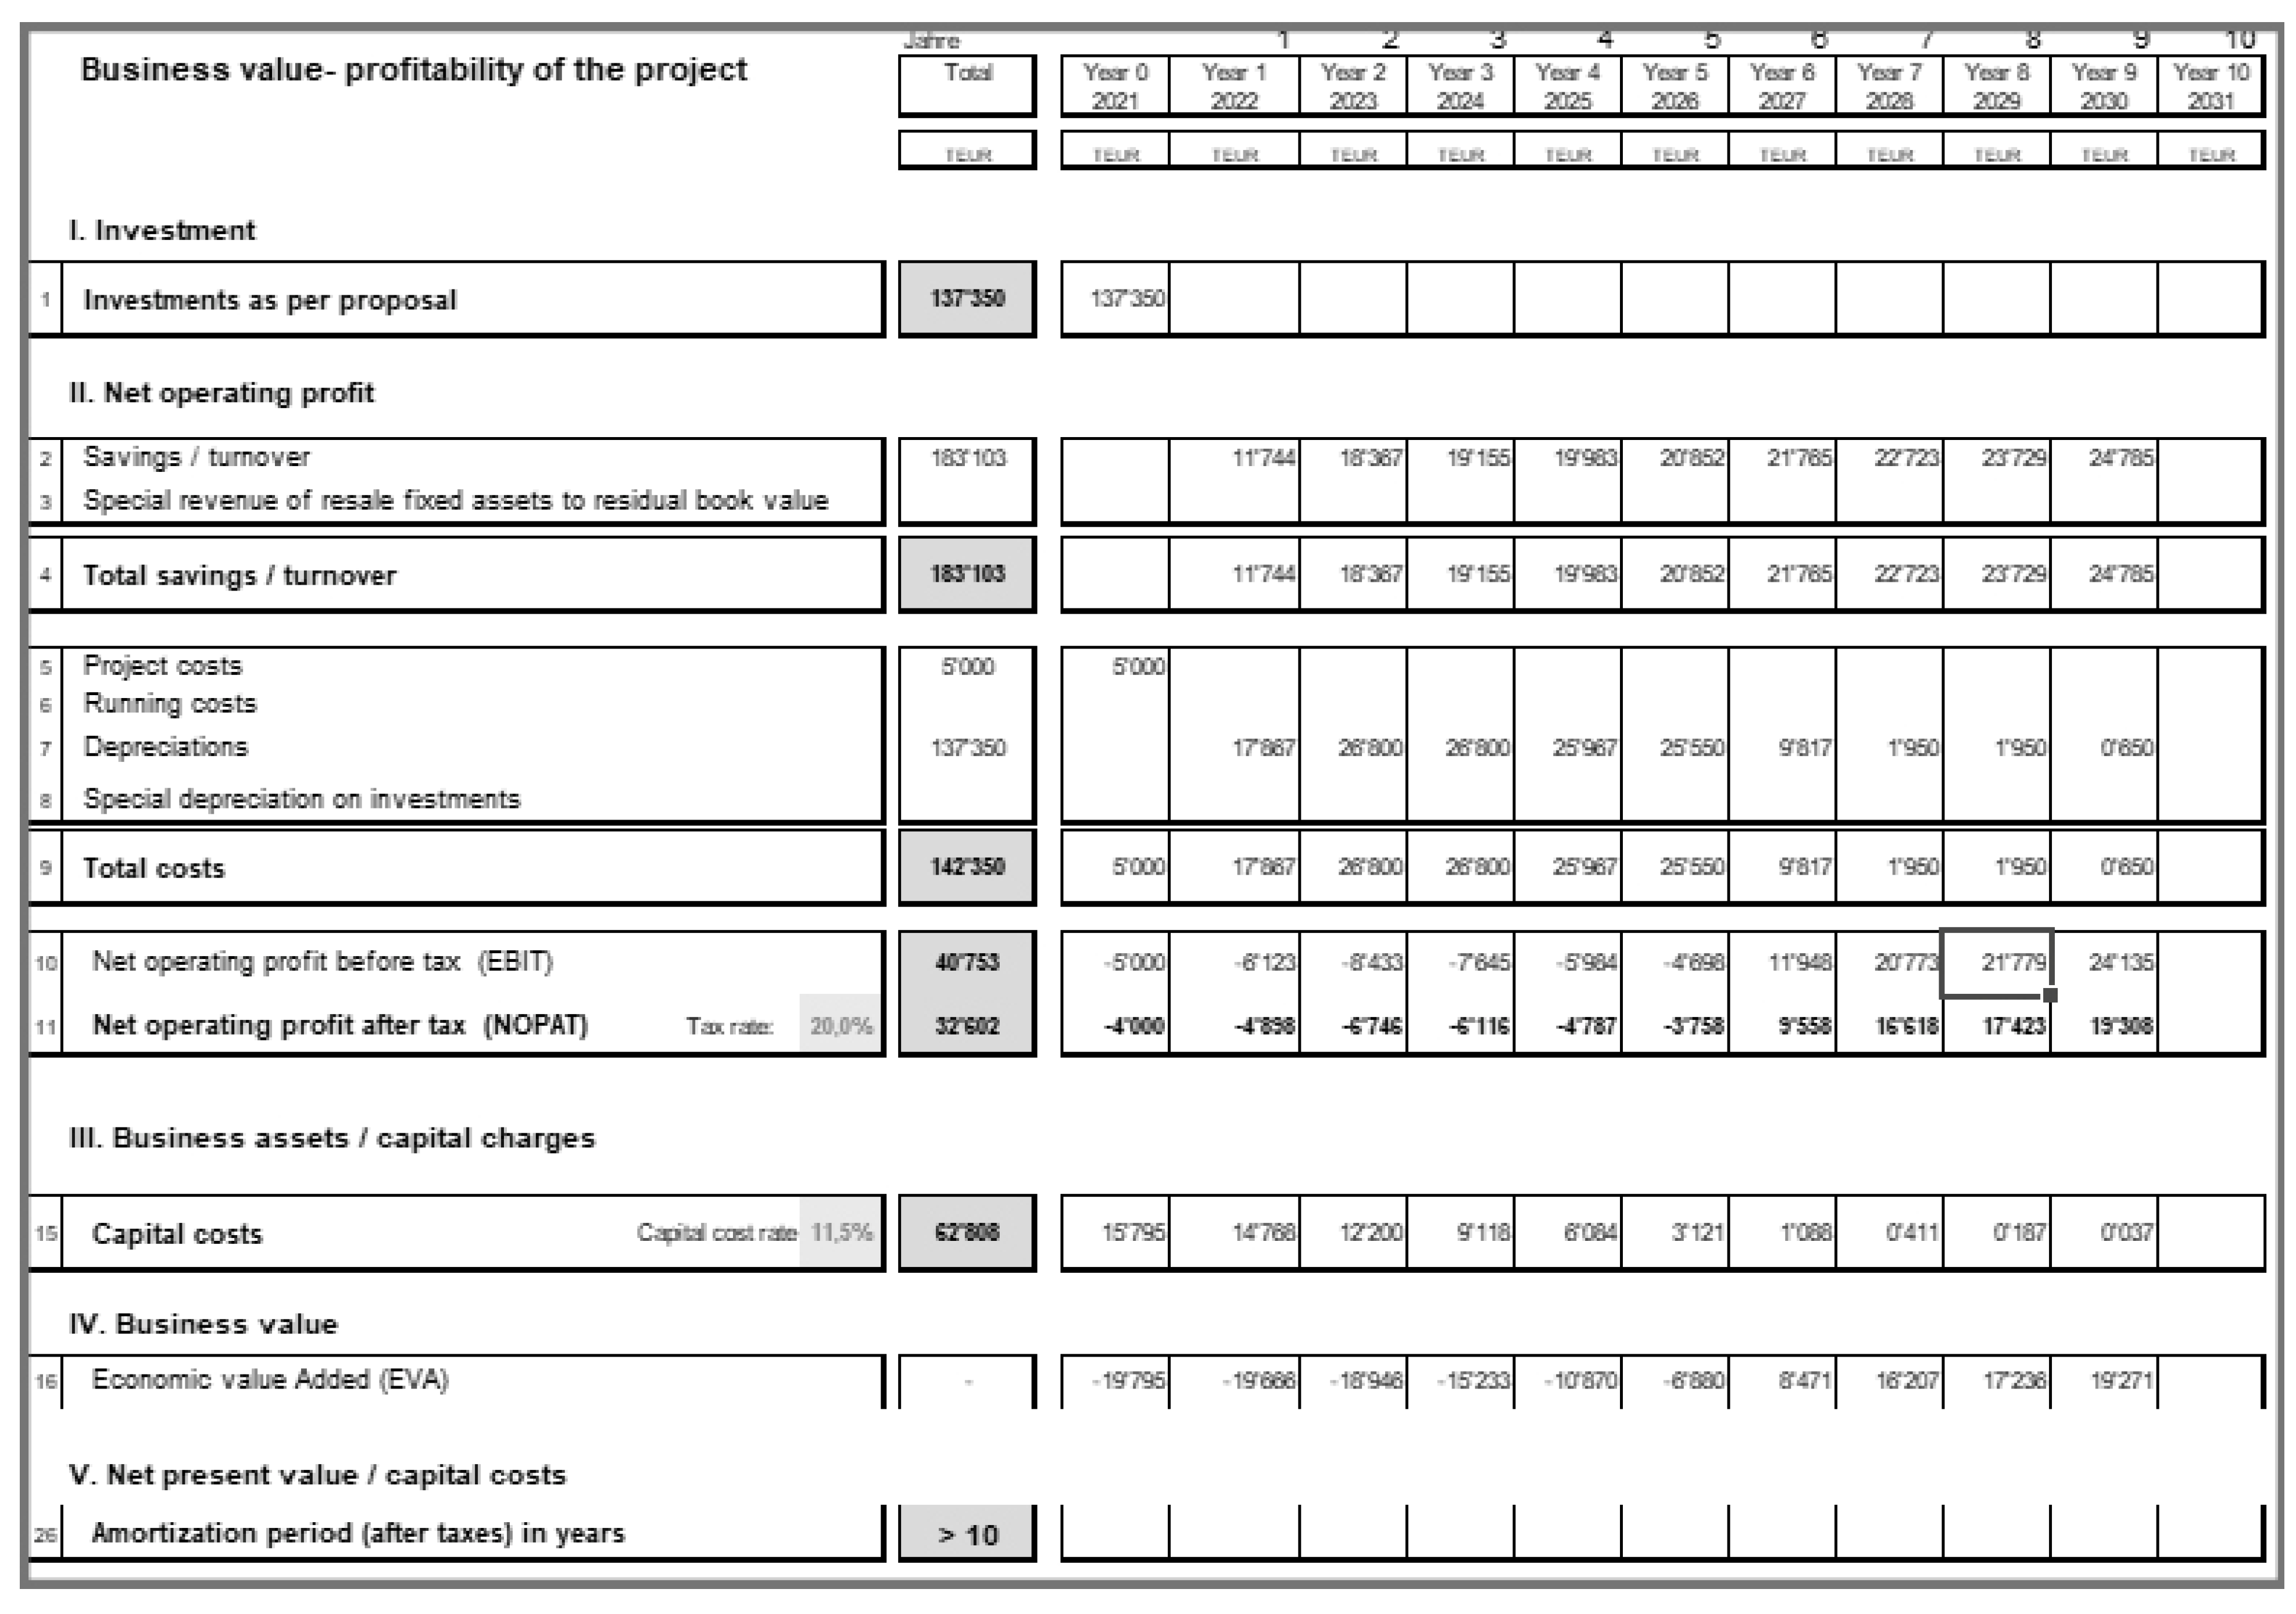
Appendix G
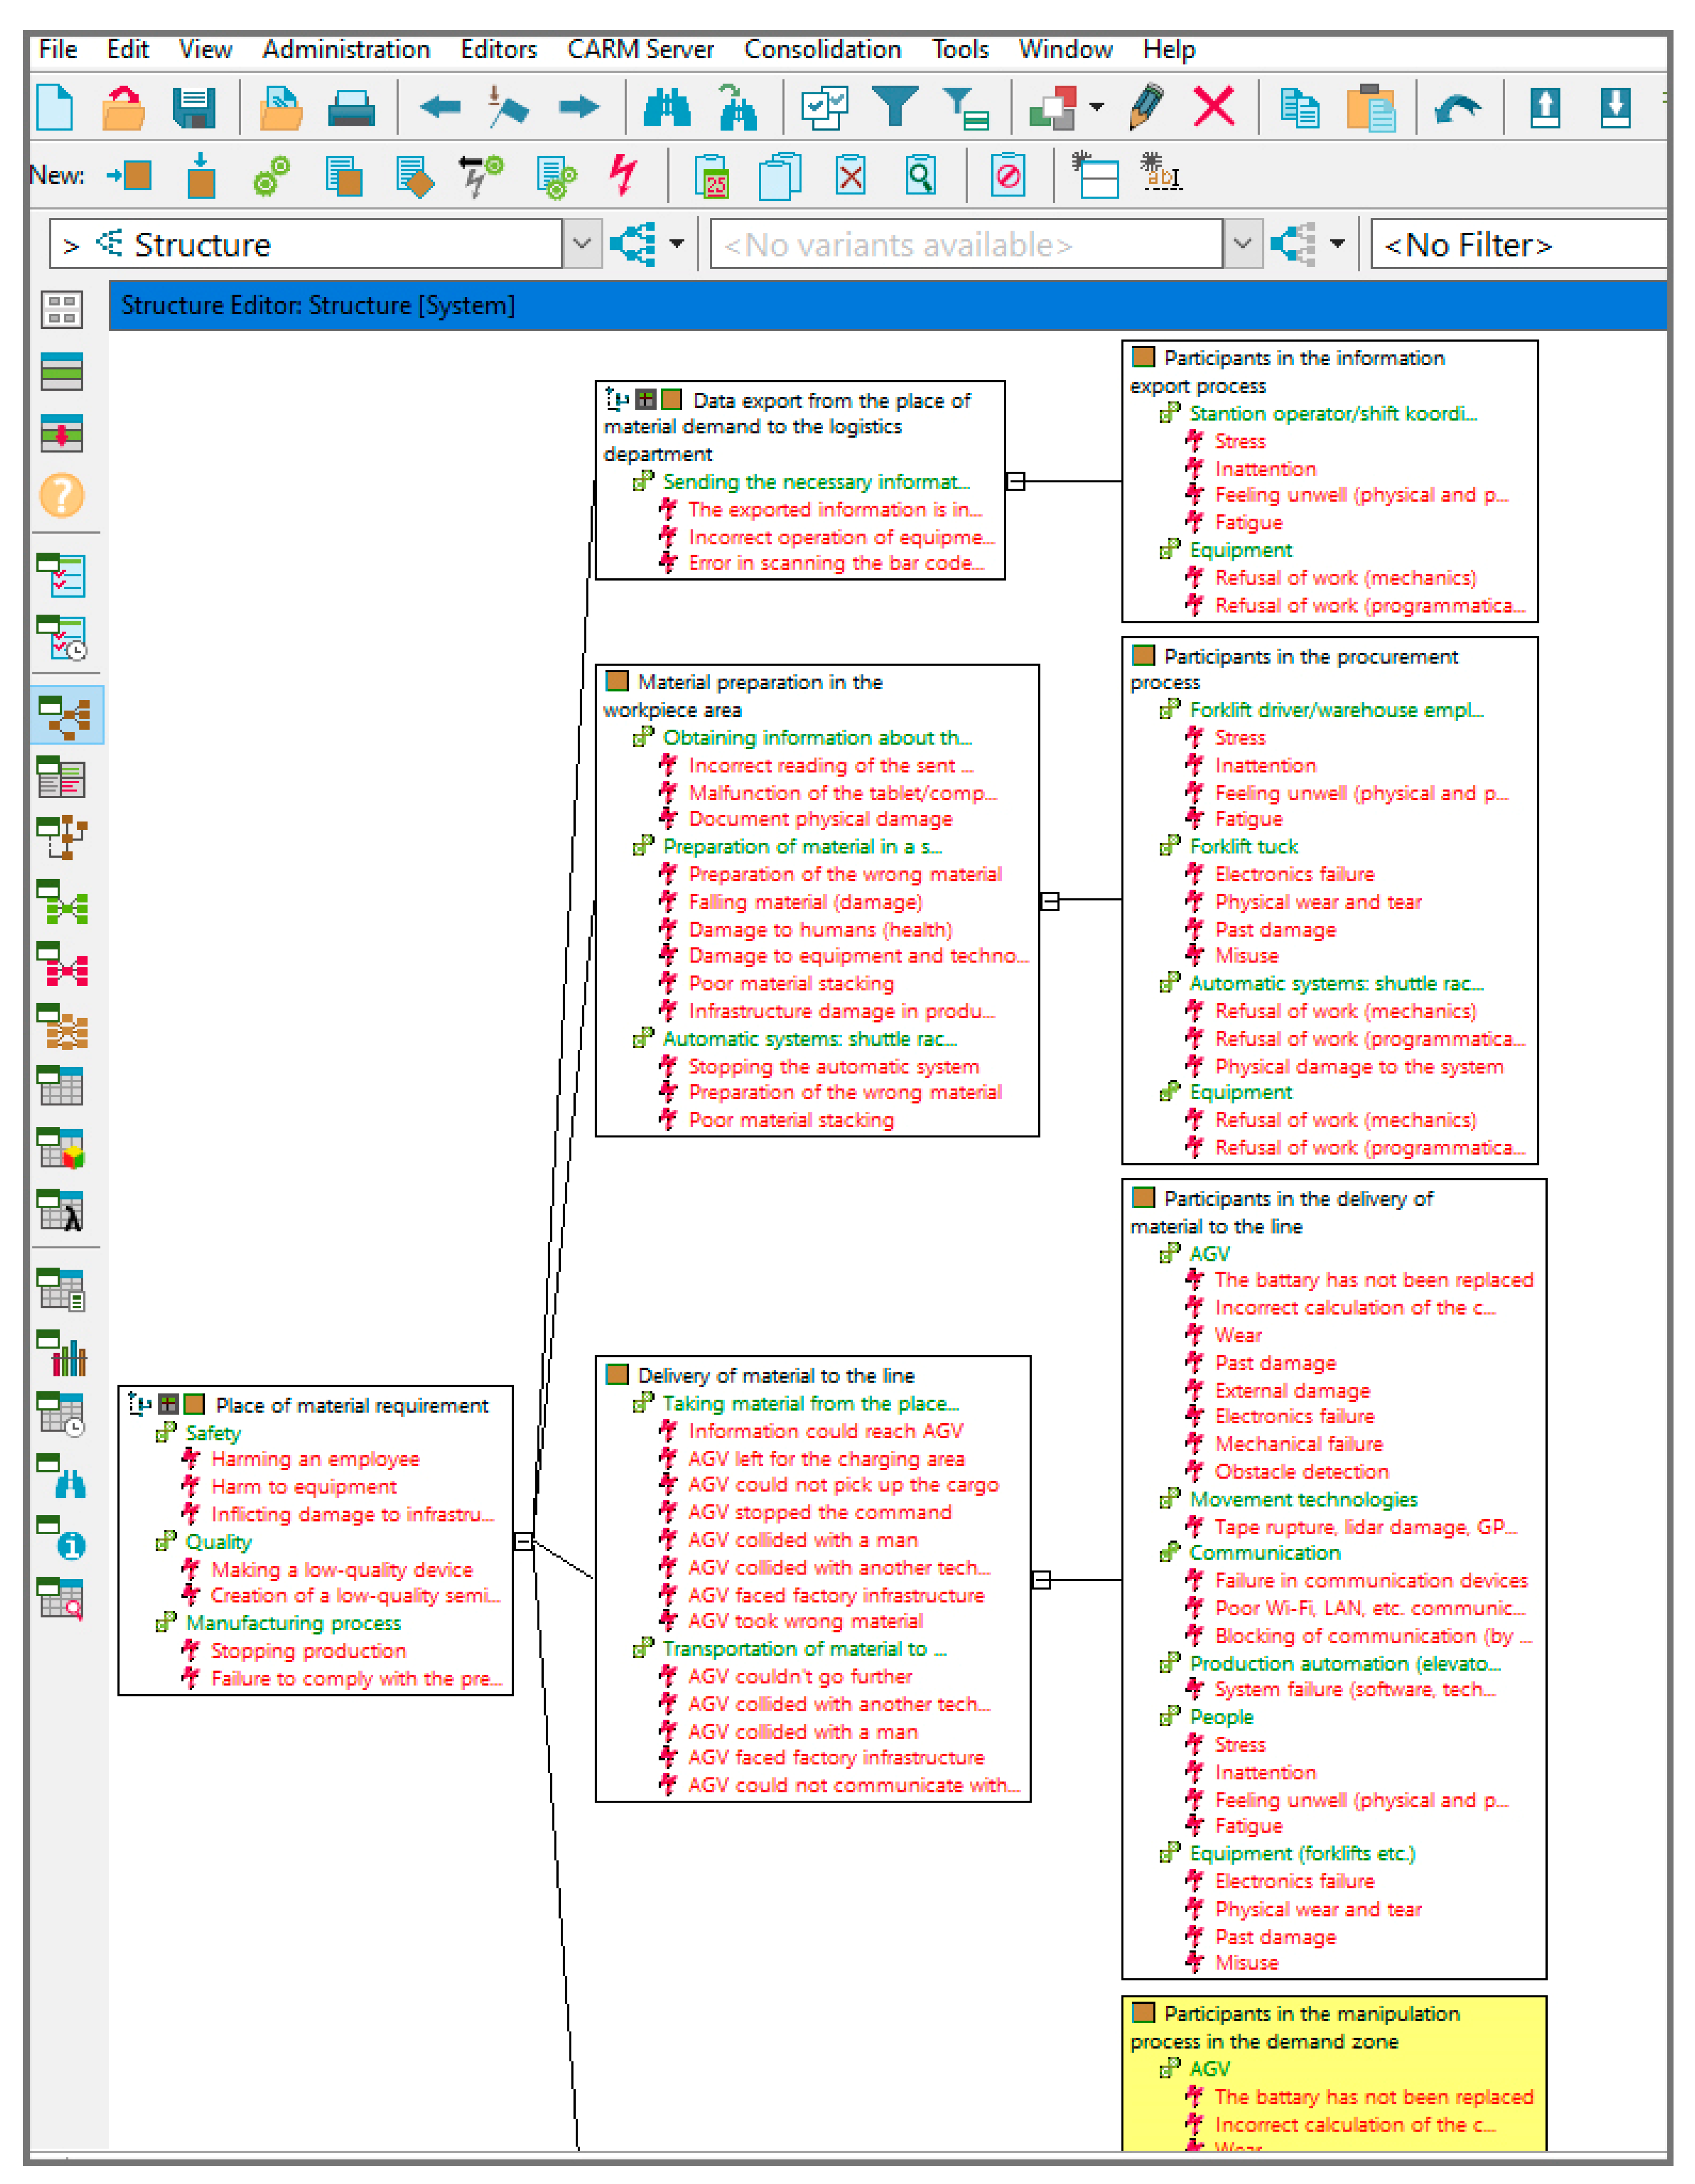
Appendix H
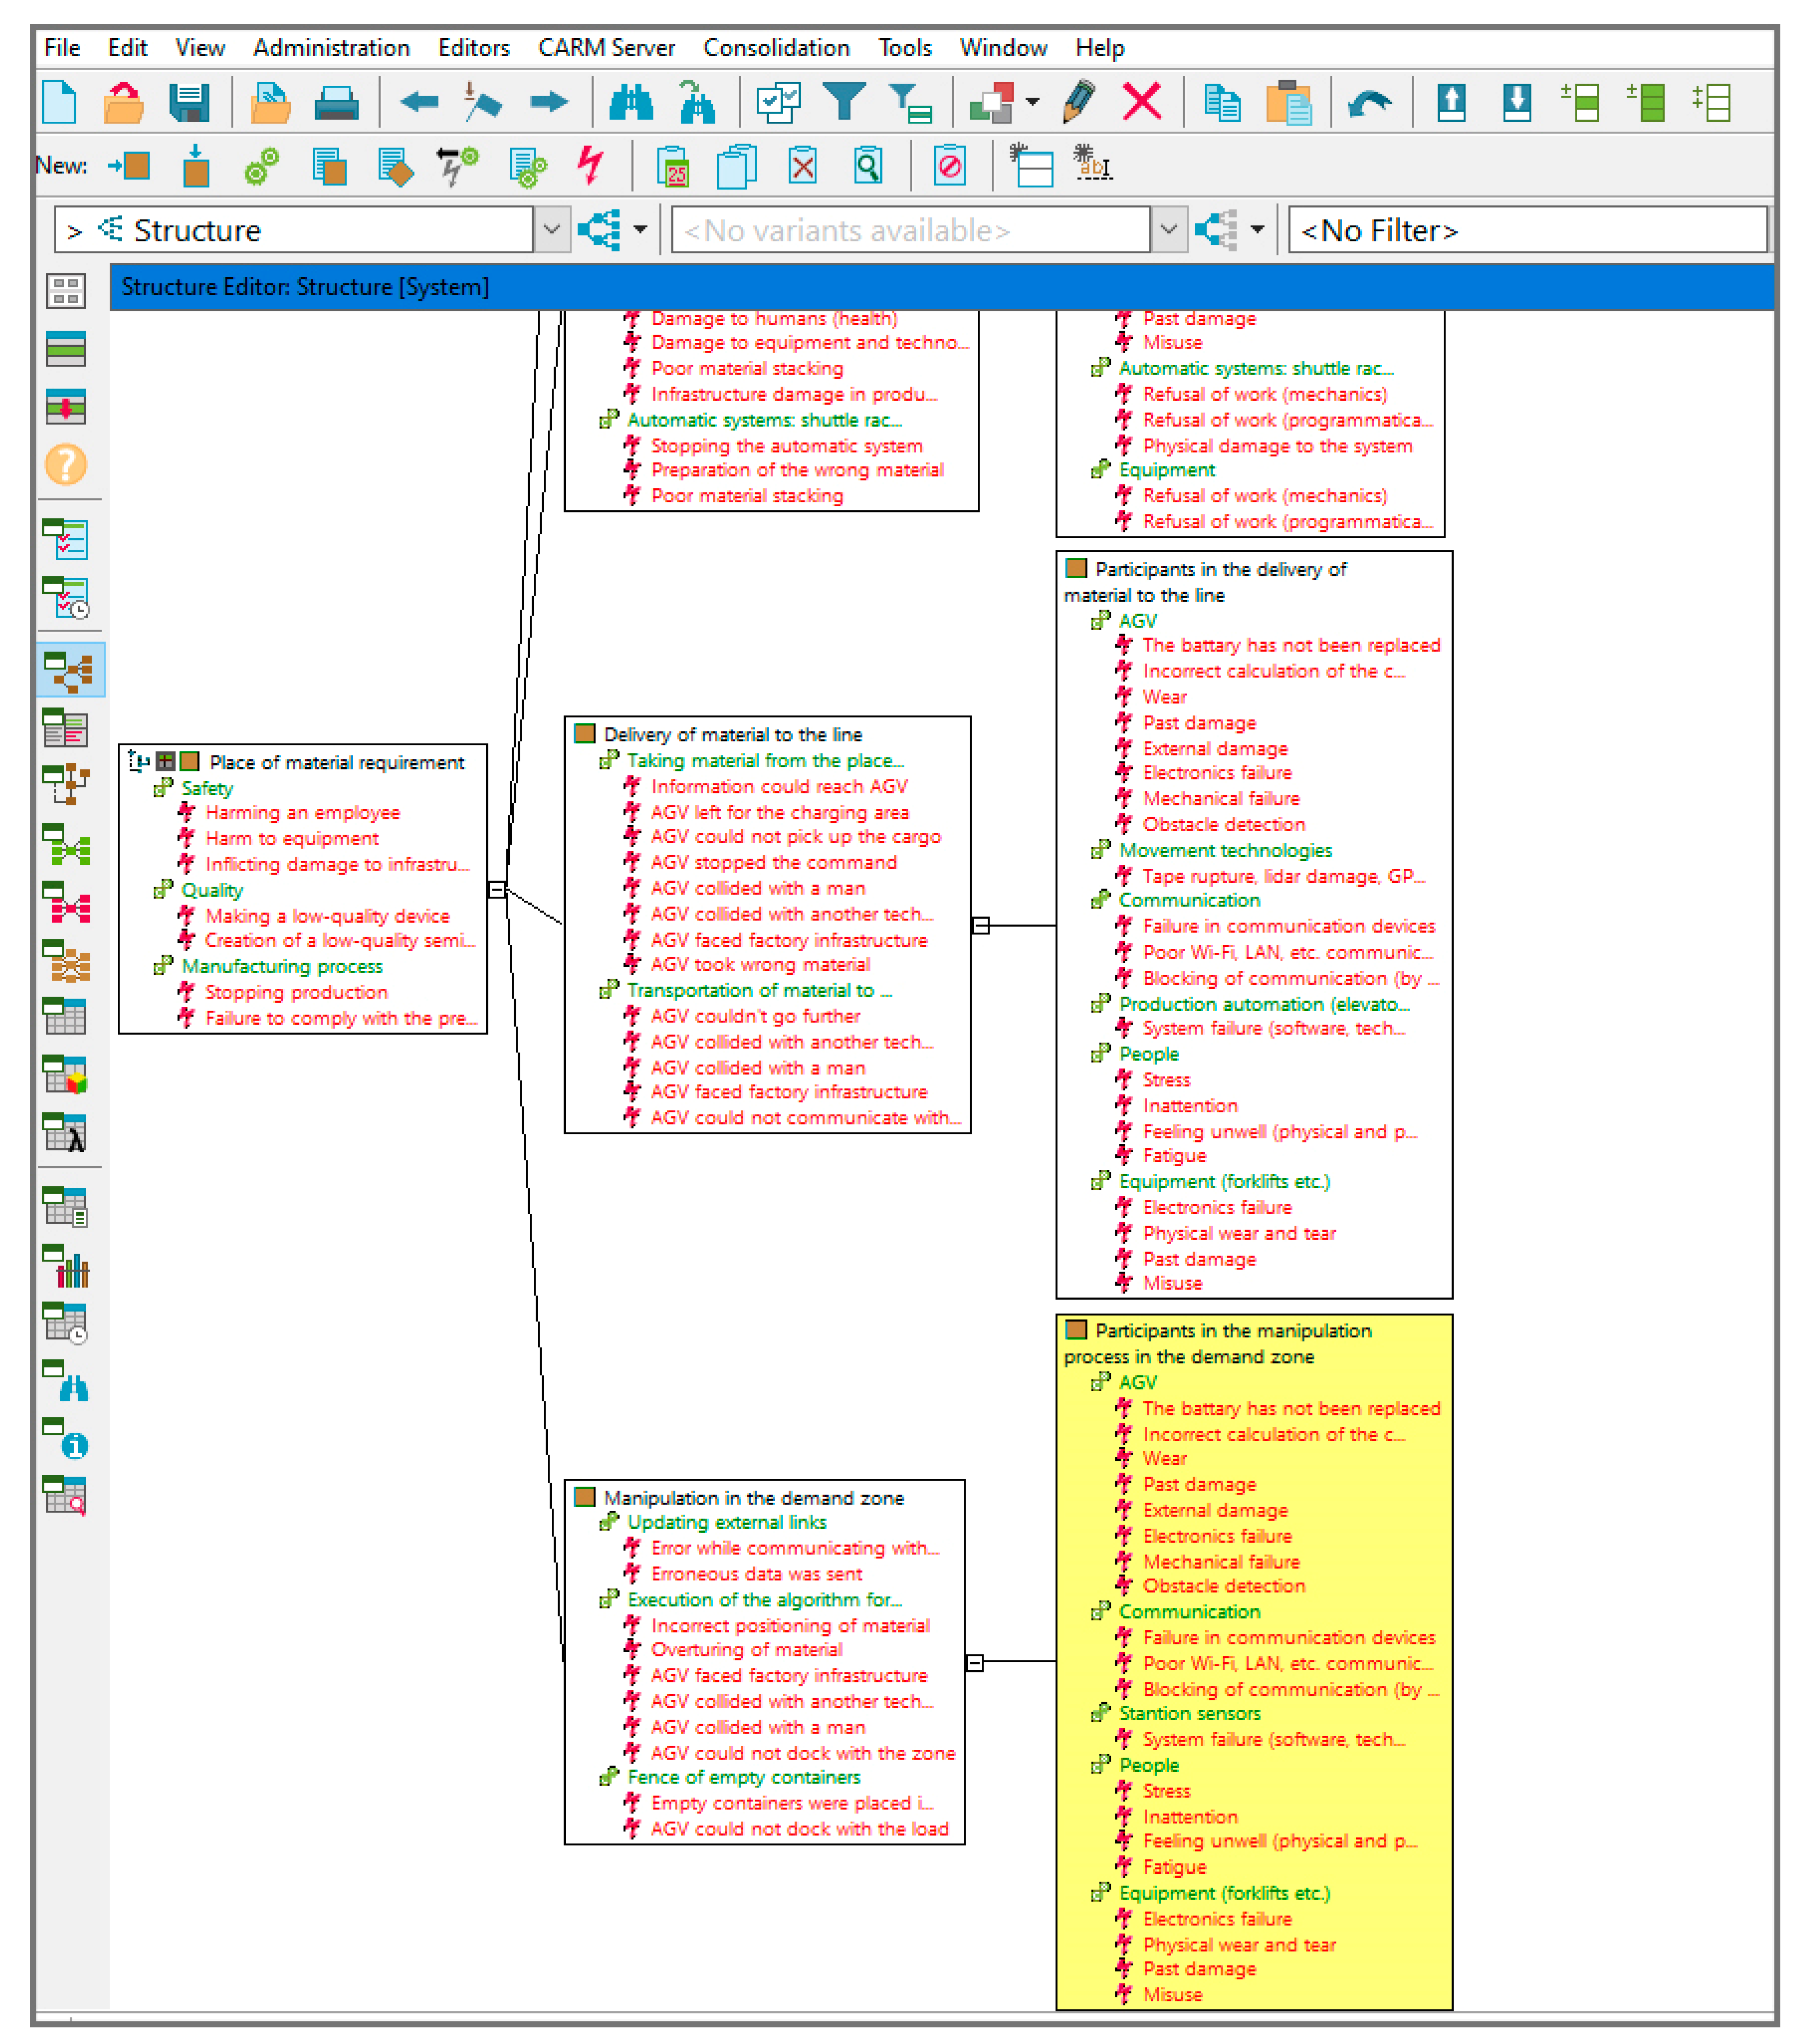
Appendix I


References
- Abdurrahman, Yılmaz, and Temeltas Hakan. 2019. Self-adaptive Monte Carlo method for indoor localization of smart AGVs using LIDAR data. Robotics and Autonomous Systems 122: 103285. [Google Scholar]
- Bogue, Robert. 2022. The changing face of the automotive robotics industry. Industrial Robot 49: 386–90. [Google Scholar]
- Bohacs, Gabor, Zs Győrváry, and Daniel Gaspar. 2021. Integrating scheduling and energy efficiency aspects in production logistic using AGV systems. IFAC-PapersOnLine 54: 294–99. [Google Scholar] [CrossRef]
- Decree of the Government of the Russian Federation on the Approval of the Document «Concept for the Development of Regulation of Relations in the Field of Artificial Intelligence Technologies and Robotics Until 2024». First Edition. 2020. Available online: https://www.economy.gov.ru/material/file/57ff642339b16c479b12030fb5f1b6e3/19082020_2129-p.pdf (accessed on 22 December 2021).
- De Ryck, Matthias, Davy Pissoort, Tom Holvoet, and Eric Demeester. 2021. Decentral task allocation for industrial AGV-systems with resource constraints. Journal of Manufacturing Systems 59: 310–19. [Google Scholar] [CrossRef]
- De Ryck, Matthias, Davy Pissoort, Tom Holvoet, and Eric Demeester. 2022. Decentral task allocation for industrial AGV-systems with routing constraints. Journal of Manufacturing Systems 62: 135–44. [Google Scholar] [CrossRef]
- Francisco, Rubio, Llopis-Albert Carlos, and Valero Francisco. 2021. Multi-objective optimization of costs and energy efficiency associated with autonomous industrial processes for sustainable growth. Technological Forecasting and Social Change 173: 121115. [Google Scholar]
- Guilherme, T. Aguiar, Gilson Oliveira Aguiar, Hua Tan Kim, Kazantsev Nikolai, and Setti Dalmarino. 2019. Sustainable Implementation Success Factors of AGVs in the Brazilian Industry Supply Chain Management. Procedia Manufacturing 39: 1577–86. [Google Scholar]
- Hana, Neradilova, and Fedorko Gabriel. 2017. Simulation of the Supply of Workplaces by the AGV in the Digital Factory. Procedia Engineering 192: 638–43. [Google Scholar]
- Hee-Woon, Cheong, and Lee Hwally. 2018. Requirements of AGV (Automated Guided Vehicle) for SMEs (Small and Medium-sized Enterprises). Procedia Computer Science 139: 91–94. [Google Scholar]
- Jittima, Varagul, and Ito Toshio. 2016. Simulation of Detecting Function object for AGV Using Computer Vision with Neural Network. Procedia Computer Science 96: 159–68. [Google Scholar]
- Johannes, Schmidt, Meyer-Barlag Claas, Eisel Matthias, M. Lutz, and Appelrath Hans-Jürgen. 2015. Using battery-electric AGVs in container terminals—Assessing the potential and optimizing the economic viability. Research in Transportation Business & Management 17: 99–111. [Google Scholar]
- Latino, Robert J., and Kenneth. C. Latino. 2006. Root Cause Analysis: Improving Performance for Bottom-Line Results. Boca Raton: CRC Press. [Google Scholar]
- Ludger, Overmeyer, Podszus Florian, and Dohrmann Lars. 2016. Multimodal speech and gesture control of AGVs, including EEG-based measurements of cognitive workload. CIRP Annals 65: 425–28. [Google Scholar]
- Martijn, Cramer, Cramer Jeroen, De Schepper David, Aerts Peter, Kellens Karel, and Demeester Eric. 2019. Benchmarking low-cost inertial measurement units for indoor localization and navigation of AGVs. Procedia CIRP 86: 204–9. [Google Scholar]
- Naslund, Dag, and Steven Williamson. 2010. Applying FMEA to Supply Chain Management. International Journal of Logistics Economics and Globalisation 2: 228–44. [Google Scholar]
- Ning, Ma, Zhou Chenhao, and Stephen Aloisius. 2021. Simulation model and performance evaluation of battery-powered AGV systems in automated container terminals. Simulation Modelling Practice and Theory 106: 102146. [Google Scholar]
- Nitish, Singh, Dang Quang, Akcay Alp, Adan Ivo, and Martagan Tugce. 2022. A metaheuristic for AGV scheduling with battery constraints. European Journal of Operational Research 298: 855–73. [Google Scholar]
- Ozan, Yesilyurt, Bauer Dennis, Emde Alexander, and Sauer Alexander. 2021. Why should the automated guided vehicles’ batteries be used in the manufacturing plants as an energy storage? E3S Web of Conferences 231: 01004. [Google Scholar]
- Pisarenko, Zhanna Viktorovna. 2014. Institutional Foundations for the Development of Pension Systems. St. Petersburg: Publishing House of St. Petersburg State University. 202p. [Google Scholar]
- Puneeth, Valmiki, Simha Abhinav, Gowtham P. Reddy, Panchakarla Gowtham, Kumar Kranthi, Purohit Rajesh, and Suhane Amit. 2018. A Study on Simulation Methods for AGV Fleet Size Estimation in a Flexible Manufacturing System. Materials Today: Proceedings 5: 3994–99. [Google Scholar]
- Quang-Vinh, Dang, Singh Nitish, Adan Ivo, Martagan Tugce, and Dirk van de Sande. 2021. Scheduling heterogeneous multi-load AGVs with battery constraints. Computers & Operations Research 136: 105517. [Google Scholar]
- Saadettin, Erhan Kesen, and Faruk Ömer. 2007. Simulation of automated guided vehicle (AGV) systems based on just-in-time (JIT) philosophy in a job-shop environment. Simulation Modelling Practice and Theory 15: 272–84. [Google Scholar]
- Stamatis, Dean H. 2003. Failure Mode and Effect Analysis: FMEA from Theory to Execution. Milwaukee: ASQ Quality Press. [Google Scholar]
- Stoychich, Mirko, Zeljko Stevic, Andrey Nikolic, and Zdravko Bozhichovich. 2019. Multi-criteria model for evaluation and selection of automatically guided vehicles (AGV) for warehouses. Modern Problems of the Risk Complex of Russia 9: 4–20. [Google Scholar]
- The European Bank for Reconstruction and Development (EBRD). 2022. What Is the EBRD’s Green Economy Transition Approach? Available online: https://www.ebrd.com/what-we-do/get.html (accessed on 15 December 2022).
- Vitalii, Naumov, Kubek Daniel, Więcek Paweł, Skalna Iwona, Duda Jerzy, Goncerz Robert, and Derlecki Tomasz. 2021. Optimizing Energy Consumption in Internal Transportation Using Dynamic Transportation Vehicles Assignment Model: Case Study in Printing Company. Energies 14: 4557. [Google Scholar]
- Weiyang, Lin, Ren Xinyang, Hu Jianjun, He Yuzhe, Li Zhan, and Tong Mingsi. 2018. Fast, robust and accurate posture detection algorithm based on Kalman filter and SSD for AGV. Neurocomputing 316: 306–12. [Google Scholar]
- Wiferion. 2022. Energy Supply of AGVs & Co—A Lot of Potential for Optimization. Available online: https://www.wiferion.com/en/news/energy-supply-agvs-optimization (accessed on 10 March 2022).
- Xiangnan, Zhan, Xu Liyun, Zhang Jian, and Li Aiping. 2019. Study on AGVs battery charging strategy for improving utilization. Procedia CIRP 81: 558–63. [Google Scholar]
Disclaimer/Publisher’s Note: The statements, opinions and data contained in all publications are solely those of the individual author(s) and contributor(s) and not of MDPI and/or the editor(s). MDPI and/or the editor(s) disclaim responsibility for any injury to people or property resulting from any ideas, methods, instructions or products referred to in the content. |
© 2023 by the authors. Licensee MDPI, Basel, Switzerland. This article is an open access article distributed under the terms and conditions of the Creative Commons Attribution (CC BY) license (https://creativecommons.org/licenses/by/4.0/).
Share and Cite
Bekishev, Y.; Pisarenko, Z.; Arkadiev, V. FMEA Model in Risk Analysis for the Implementation of AGV/AMR Robotic Technologies into the Internal Supply System of Enterprises. Risks 2023, 11, 172. https://doi.org/10.3390/risks11100172
Bekishev Y, Pisarenko Z, Arkadiev V. FMEA Model in Risk Analysis for the Implementation of AGV/AMR Robotic Technologies into the Internal Supply System of Enterprises. Risks. 2023; 11(10):172. https://doi.org/10.3390/risks11100172
Chicago/Turabian StyleBekishev, Yuriy, Zhanna Pisarenko, and Vladislav Arkadiev. 2023. "FMEA Model in Risk Analysis for the Implementation of AGV/AMR Robotic Technologies into the Internal Supply System of Enterprises" Risks 11, no. 10: 172. https://doi.org/10.3390/risks11100172
APA StyleBekishev, Y., Pisarenko, Z., & Arkadiev, V. (2023). FMEA Model in Risk Analysis for the Implementation of AGV/AMR Robotic Technologies into the Internal Supply System of Enterprises. Risks, 11(10), 172. https://doi.org/10.3390/risks11100172


