Abstract
This paper analyzes the joint association of emotions and knowledge in decision-making under uncertainty on a TV game show setting. The objective of this research is to understand the impact of emotions and knowledge on the preference for uncertainty (PU), which have mostly been investigated separately in Economics and Psychology until now. We examine the preference for uncertainty, proxied by a preference for gambling against a sure payoff, in 59 contestants in the TV game show “JOKER”. The data used contain individuals’ characteristics, as well as the decisions regarding the game, including the choice to carry on playing or accept a sure payoff, the level of knowledge of the topic, and the emotions experienced by the contestant. The methodology adopted includes a bivariate association between PU and knowledge and emotions, respectively. Additionally, we test a multivariate association using a Classification and Regression Tree (CART) method, which is suited for a complex nonlinear decision process that robustly mimics human decision-making. We find that preference for uncertainty increases when the contestants have a full domain or total absence of knowledge. Our results suggest, also, that emotions are the factor that only determines the preference for uncertainty when contestants have a restricted level of knowledge. Our results are robust across different proxies for knowledge and emotions and for different methodological thresholds. Results matter for investors, regulators, and policymakers, since it provides novel insights about the relative impact of knowledge and emotional status on risk behavior in general.
1. Introduction
Given the importance of decision-making and its consequences, it is essential to understand how individuals make their decisions. In addition to the individual characteristics that several studies have proven to be valid in affecting the preference for uncertainty, there is a generalized notion that decisions taken by individuals are systematically biased and that, as a result of the existence of cognitive limitations of individuals and the influence that emotions have on them, the expected results tend to deviate from those predicted by rational models (see, for example, Saraiva and Gonçalves 2022; Gonçalves 2021).
In the last decades, the neoclassical view of human behavior, assuming individuals as totally rational, has been challenged by an alternative called Behavioral Economics1, which has sought to offer new, complementary perspectives in decision-making, demonstrating that the way individuals use their knowledge, as well as the fact that they are affected by their emotions, influences the way they make decisions.
In this paper, we analyze the joint association of emotions and knowledge in decision-making under uncertainty on a TV game show setting. The objective of this research is to understand the impact of emotions and knowledge on the preference for uncertainty, which have mostly been investigated separately in Economics and Psychology until now. We examine the preference for uncertainty, proxied by a preference for gambling against a sure payoff, in 59 contestants in the TV game show “JOKER”.
We define a preference for uncertainty when an individual chooses a stochastic payoff rather than a guaranteed gain. In our study, preference for uncertainty occurs when a contestant decides on Game, having a 25% chance of winning a higher payoff if the answer is correct and a 75% chance of lowering his current payoff if the answer is incorrect, instead of opting for No Game, guaranteeing a payoff with a lower certain value. This concept is associated with risk-seeking behavior under uncertainty in the extant literature.
The data from the broadcasted TV game shows used in this paper contain individuals’ characteristics, such as gender, age, marital status, and education, as well as the decisions regarding the game, including the choice to carry on playing or accept a sure payoff, the level of knowledge of the topic, and the emotions experienced by the contestants.
The methodology adopted includes a bivariate association between PU and knowledge and emotions, respectively. Additionally, we test a multivariate association using a Classification and Regression Tree (CART) method, which is suited for a complex nonlinear decision process that robustly mimics human decision-making.
The results show that the preference for uncertainty increases when the contestants have a full domain or total absence of knowledge. Our results suggest also that emotions are the factor that only determines the preference for uncertainty when contestants have a restricted level of knowledge. These results are robust across different proxies for knowledge and emotions and for different methodological thresholds.
Our paper contributes to the literature by analyzing the relationships between preference for uncertainty, knowledge, and emotions in behavioral bias. It is an area that has received separate analysis and discussion in the literature. Our approach involves first identifying the presence of knowledge and the positive or negative emotions in decision-making and then examining the joint effect of knowledge and emotions on those decisions. We find that knowledge plays a more prominent role in the preference for uncertainty during the decision process, with emotions being the factor that determines the preference for uncertainty when there is no domain of knowledge or total absence of knowledge, regardless of whether emotions are positive or negative.
This research also extends the understanding of emotions’ impacts on risk-seeking behavior in general, by using the Facial Action Coding System (FACS) approach, which allows us to distinguish facial muscle movements to identify the emotions that individuals may be transmitting (Ekman and Friesen 1974; Cohn et al. 2005). The use of face-lifeing to assess emotions is scarce to the extant literature, though it is significantly trending as a robust measurement system. We used FaceReader software, which allowed us to automatically analyze facial expressions for several emotional states (Ekman et al. 1969; Cootes et al. 2001; Ekman and Cordano 2011; Ley et al. 2019).
Finally, we overcome the limitations identified in a significant number of research pieces in these areas: the ad hoc designing of experiments that could deviate from real-life decision-making. By using a natural experiment, since the individuals are participating on a real TV game with payoffs and rulings that differ from an experiment set for research, our results are less affected by a poor experiment design or the lack of relevant controls.
These results matter for investors, regulators, and policy makers, since it provides novel insights about the relative impact of knowledge and emotional status on risk behavior in general. For instance, a significant number of policies are designed around (emotional) nudges and (financial) literacy. We show that emotions and knowledge impact decision-making asymmetrically, with the former playing a prominent role only for extreme (high and low) levels of the latter. Policy design can and should consider these nonlinearities.
2. Literature Review
Knowledge and emotions may influence a preference for uncertainty. The way individuals make their decisions always involves uncertainty, whether about the meaning of the stimuli or the possible consequences of their decisions. Decision-making is a complex process that usually involves several levels of uncertainty. We define a preference for uncertainty when an individual chooses a stochastic payoff rather than a guaranteed gain.
Knowledge is essential for decision-making under uncertainty, as it increases confidence and contributes to higher returns (Fischhoff et al. 1977, 1983; Griffin and Tversky 1992; Ratcliff et al. 2016; Cox and Shiffrin 2017). According to Bayar et al. (2020), as the awareness of individuals of their knowledge increases, they tend to prefer uncertainty. Furthermore, Hall et al. (2007) stated that the greater the knowledge, the greater the precision in predicting uncertain results and, simultaneously, the greater the level of confidence in the forecast (Holsapple 2008). This confidence also was increased with information or knowledge (Parmitasari et al. 2022; Gonçalves 2021). However, in the process, individuals will face a level of uncertainty that depends on the estimated probability of that event and the accuracy of the estimate, but also on their general knowledge and understanding of the context (Tversky and Kahneman 1992; Tversky and Fox 1995; Abdellaoui et al. 2011; Maffioletti and Santoni 2019). If individuals feel they are knowledgeable or competent, they prefer to play on events that they have some knowledge, rather than on random events about which they feel ignorant (Heath and Tversky 1991; Goodie 2003).
Emotions are part of any individual’s decision-making and affect their attitudes toward uncertainty (Fazio 1995; Damasio 2006; Slovic et al. 2007). Studies have shown that positive emotions can signal that the cognitive process is unnecessary by inducing individuals to trust simpler heuristics (Kahneman 2012; Thaler 2017). On the other hand, negative emotions can induce individuals to process the information available with greater attention, which facilitates rational thinking (Kahneman 2012; Schwarz 2012; Thaler 2017). Emotions are seen as a response to external or internal events, resulting in a set of reactions, including subjective feelings and bodily responses, that play a relevant role in an individual’s decision-making (e.g., Scherer 2000; Loewenstein 1996, 2000; Loewenstein et al. 2001; Slovic et al. 2004; Ifcher and Zarghamee 2011; Schwarz 2012; Gabbi and Zanotti 2019). Several investigations seek to explore how specific emotions, even when incidental to the decision in question, can systematically affect individuals’ perceptions, judgments, and behaviors (e.g., Johnson and Tversky 1983; Benartzi and Thaler 1995; Thaler et al. 1997; Damasio 2006; Rick and Loewenstein 2008; Maffioletti and Santoni 2019; Vamossy 2021).
The literature has analyzed the impact of emotions and knowledge separately. Significantly less has been concluded on the joint role of both on risk-seeking behavior or has addressed the preference for uncertainty.
Consistently, the main goals of this paper are to analyze how individuals’ knowledge influences the preference for uncertainty, given that it can improve accuracy in predicting uncertain results and, simultaneously, increase the level of confidence in the forecast. On the other hand, it analyzes the influence of emotions in the decision-making process, given that emotions can make these decisions incoherent or unreasonable when evaluated according to strictly rational criteria.
Consequently, this study’s main contribution will also be to highlight a joint investigation of emotions and knowledge in an attempt to assess the role of both variables in the decision context in which uncertainty is generated by the game. It explores the preference for uncertainty when it is represented by decision-making in a television contest which can be framed as a dependence on knowledge and emotions. Thus, we investigate the relationships between preference for uncertainty, emotions, and knowledge, which have mostly been investigated separately in economics and psychology to date (Heath and Tversky 1991; Rottenstreich and Hsee 2001), except for the work of Maffioletti and Santoni (2019).
3. Data and Methods
This study used a real-life, broadcasted Portuguese TV game and examined 59 contestants shown between 1 July 2020 and 3 October 2020. The natural laboratory of JOKER, analyzed in this paper, incorporated 59 television episodes, broadcasted on RTP 1 from 1 July 2020 to 3 October 2020. The data were transcribed from original Portuguese television broadcasts. The JOKER contest is produced by Valentim de Carvalho Filmes, SA for Rádio Televisão de Portugal and is presented by Vasco Palmeirim. It has been on air since 27 August 2018. Any citizen over the age of 18 can enter the contest. Contestants are pre-selected via telephone and then, if they move on to the next stage of the selection, via face-to-face casting. The selection of contestants is at the discretion of the production. This contest consists of a knowledge test in which the contestant must answer a set of twelve questions while having at his/her disposal seven jokers to help them with the answers. The game ends only at the twelfth question.
In our research, we define the following hypotheses:
H1.
The greater the knowledge, the greater the preference for uncertainty.
H2.
The preference for uncertainty increases with the individual’s confidence.
H3.
Individuals who express negative emotions in decision-making have a greater preference for uncertainty.
H4.
Knowledge and emotions influence decision-making simultaneously.
3.1. Data
Data were collected using recordings of the programs, which were obtained from RTP 1, the broadcaster of the JOKER contest. We examined 59 games shown between 1 July 2020 and 3 October 2020. JOKER television contest consists of a game in which contestants answer 12 general knowledge questions that vary in difficulty and time to answer according to the level of the payoff. In each question, the contestant has 4 possible answers (25% probability per option). If a correct answer is chosen, the contestant climbs one level in the payoff ladder; with each incorrect answer, they drop three levels in the payoff ladder. The game ends with the twelfth and final question, where contestants can choose either Game or No Game. If they opt for Game and answer correctly, they win a higher payoff. If they answer incorrectly, they win a lower payoff. If they opt for No Game, they receive an insurance payoff (one level below). We defined Preference for Uncertainty (PU), the dependent variable, measured by the decision to game in JOKER’s final question, as a dummy variable created to represent two categories: 0—No Game and 1—Game.
3.2. Variables and Methods
To assess the level of knowledge of the contestants with the themes of the questions, they were classified according to the 6 categories of the general culture game Trivial Pursuit: Geography, History, Art and Literature, Sports and Leisure, Science and Nature, and Entertainment. During the period for answering the last question, the confidence about the topic was classified, assigning one of three levels: 0—no knowledge about the topic (when the contestant used expressions such as “I do not know”, “I have no idea”, “I have never heard of this”, etc.), 1—if the topic is the contestant’s general knowledge (when the contestant used expressions such as “I have doubts between two answers”, “I’m not sure, but I think it is” or “I have an idea it is”), 2—if the topic is within the contestant’s domain (when the contestant used expressions such as “I know the answer”, “I am almost sure”, “if all the questions were like these”, “I’m absolutely sure that it is”, “certainly/without a doubt”). Knowledge level was also assessed by response time (latency effect); as documented in several studies, there is an inverse relationship between the time required to respond and mastery of the topic and confidence expressed in that response (Kimble and Seidel 1991; Varas and Watson 1994; Fazio 1995; Huizingh et al. 2002; Voss et al. 2004; Koriat et al. 2006; Ratcliff et al. 2016; Cox and Shiffrin 2017). Finally, to support the study of the knowledge variable, we measured the number of correct answers given by the contestants in questions with the same subject area as the last question. According to Hall et al. (2007) and Holsapple (2008), the greater the knowledge in an area, the greater the precision in predicting uncertain results. It is, therefore, to be expected that if individuals feel knowledgeable in a specific area and have prior positive outcomes, they will have a greater preference for uncertainty (see, for example, Heath and Tversky 1991; Goodie 2003).
In this study, to measure the emotional state of individuals in the decision to go to the game, we used the model by Barakova et al. (2015) who define an emotional event as any event that influences the emotions and, therefore, the facial expressions of the contestants. The model assumes that the components of facial expressions are given by the last emotion-causing event and by the facial expression at the moment of the event :
where k gives the position of the last emotional event and i is the number of time intervals between the given facial expression and the moment when the last event happened. Moreover, is the response function because it determines the response of facial expressions to emotional events, assuming that after any emotional event, the facial expression changes from the current state to a state corresponding to the emotional event. Other studies also present emotional expressions as manifestations of internal emotional states (Ekman and Friesen 1974; Levenson et al. 1990; Pollak et al. 2009).
To measure the impact of emotions on uncertainty preference in the twelfth and final question, we decided to use the Facial Action Coding System (FACS) approach, which allows us to distinguish facial muscle movements to identify the emotions that individuals may be transmitting (Ekman and Friesen 1974; Cohn et al. 2005). We use FaceReader 8.1 software, which allowed us to automatically analyze facial expressions for 7 emotional states: happiness, sadness, anger, surprise, fear, disgust, and neutral, which refers to the absence of any significant emotion (Ekman et al. 1969; Cootes et al. 2001; Ekman and Cordano 2011; Ley et al. 2019).
For the joint analysis of knowledge and emotions on preference for uncertainty (PU), we selected the Classification and Regression Trees method (CART). CART presents a decision process that is very similar to individual decision-making and fits into the decision that contestants make for the twelfth question. Consistently, as the Game function of contestants is unknown, this method allows the relationship between explanatory variables and the decision to game to vary as an unconstrained function of other variables, implicitly incorporating nonlinearities and interactions between those, including each contestant’s knowledge and emotions. CART is very appropriate for capturing the possibly increasingly subtle ways in which individuals’ decisions on whether to game reflect the results (Pestana and Gageiro 2009; Bart et al. 2021). The corresponding regression model predicts Y with a constant cm in the region Rm, as in Equation (2).
This model can be represented by a binary tree. The complete dataset is at the top of the tree. Observations that satisfy the condition at each junction are assigned to the left branch and the others to the right branch. The terminal nodes correspond to regions R1 to R5.
4. Results and Discussion
4.1. Summary Statistics
Table 1 reports the summary statistics. Among the contestants in the sample, approximately 71% are males, 78% are aged 31 to 59 years old, 75% are married, 59% don’t have children, and only 8% have studies in finance or similar.

Table 1.
Descriptive Statistics.
Knowledge of contestants is another factor that can influence the preference for uncertainty in a general culture contest. Therefore, we found that, on average, the contestants in the twelfth question take about 29 s to answer. Restricting the analysis to competitors who have a preference for uncertainty, we found that contestants who get the answer right (with mastery of the topic) need 27 s less, on average, than contestants with no knowledge of the topic. Another factor that can explain whether knowledge influences the preference for uncertainty is the confidence of contestants in the answer given in the final question. We found that, on average, JOKER’s contestants have some knowledge of the topic (1.24), but not total mastery.
Finally, we analyzed the contestants’ specific emotions, even when incidental to the decision in question, since they can systematically affect the perceptions, judgments, and behaviors of individuals in the preference for uncertainty in the twelfth question. We found that, on average, the facial expressions of the JOKER contestants with the highest expression are neutral (0.52), happy (0.125), and angry (0.093). Based on valence (calculation based on FaceReader 8.1 software), we found that, on average, competitors show negative emotions (1.38).
4.2. Empirical Results
We estimated the decision to game in the final question to measure the knowledge variable, with a series of one-way ANOVA tests on the explanatory variables. Table 2 presents the estimated marginal effects and p-values for each of these variables.
Table 2.
Bivariate Analysis of Knowledge.
The mean preference for uncertainty is greater than the center of the scale for any given response time. According to the ANOVA test, there are differences in means between the response times in the final question (p-value = 0.00). We can define that the average response time of a contestant with high knowledge of the topic is significantly different from that of a contestant without knowledge. On average, it takes 27 s less for a contestant with mastery of a topic to answer the final question. These results are in line with several previous studies, where an inverse relationship between the time required to respond and the confidence expressed in that response is documented (Kimble and Seidel 1991; Varas and Watson 1994; Fazio 1995; Huizingh et al. 2002; Voss et al. 2004; Koriat et al. 2006; Ratcliff et al. 2016; Cox and Shiffrin 2017). After categorizing the latency variable, contestants who take less than the average time to answer the last question (0.00) have a greater preference for uncertainty compared to contestants who take more than the average time to answer the final question (0.56). The difference in means is statistically significant (p-value = 0.00). Therefore, when the contestant dominates a topic or is an expert in an area, it takes, on average, less time to answer the final question. To ensure that the latency variable in our study measures the knowledge of contestants, we analyzed the response time for all the previous questions (from the 1st to the 11th question), concluding that, in any of the questions, the contestants who get the answer right need, on average, less time to respond (p-value = 0.00).
Regarding the perceived knowledge, we found that the contestants have significantly different behaviors in the decision to game in the final question. According to the ANOVA test, there are differences in means between the levels of confidence in the response and the preference for uncertainty, and these differences are statistically significant (p-value = 0.00). Contestants who show greater confidence in the correct answer are more likely to decide to game on the final question, and contestants with no confidence mostly opt for the safety payoff. According to Turkey’s post hoc tests, contestants who have no confidence about the answer tend to opt for a certain payoff, contestants with high confidence about the answer prefer to answer on the twelfth question, and contestants with some confidence about their answer tend to answer (Table 3).
Table 3.
Turkey’s Post Hoc Test of Confidence.
These results are consistent with those defended by Heath and Tversky (1991), Goodie (2003), Kilka and Weber (2001), and Maffioletti and Santoni (2019); if individuals feel knowledgeable or competent, they prefer to gamble on events on which they have some knowledge than in random events or in events about which they feel ignorant.
For the analysis of emotions, the facial expressions of the contestants of 59 episodes were recorded directly and examined by the RTP Play platform. From the recorded videos, between five to ten seconds of the contestants’ frontal faces were selected, when contestants must decide Game or No Game (after the presentation of the final question), using FaceReader.
According to the results presented in Table 4, we verified that, on average, the contestants present facial expressions that show negative emotions (valence with −0.042). Subsequently, to measure the emotion variable, we estimated the decision to game in the last question with an independent sample t-test on the explanatory variable Facial. This variable results from the valence calculation obtained by FaceReader
which results from the difference between the intensity of the positive expression (Ep) and the intensity of the negative expression with the greatest strength (En). Table 5 presents the estimated marginal effects and p-values for this variable.
Table 4.
Descriptive Statistic about Emotions.
Table 5.
Bivariate Analysis of Emotions.
Both contestants with positive (0.76) and negative (0.87) emotions show a preference for uncertainty above the center of the scale, being higher in contestants with negative emotional states. The difference in means is statistically significant (p-value = 0.05). Contestants with positive emotions tend to be more satisfied with the payoff achieved in the last question, taking into account game performance, knowledge, and sociodemographic characteristics, while contestants with negative emotions tend to be more rational because they are not satisfied with their progress in the game or, despite not having mastered the topic of the last question, they are more likely to opt for a preference for uncertainty to try to recover or show their cognitive abilities. If we evaluate these results in the light of the Theory of Expected Utility (Von Neumann and Morgenstern 1947), a rational individual, regardless of their emotional state, should always choose the option with the highest value, since the game’s alternatives are evaluated separately and independently, and the option with the highest value is always selected. Bearing in mind that in JOKER, for any payoff in the game, the expected value of playing is always higher than the certain payoff, the contestant should always choose Game regardless of how they feel emotionally. Considering Cumulative Prospect Theory (Tversky and Kahneman 1992), individuals systematically tend to overestimate small probabilities and undervalue large probabilities. Consequently, they exhibit uncertainty-prone behavior when buying a lottery ticket, overestimating the low probability of winning, and exhibit uncertainty-averse behavior when buying auto insurance because they underestimate the high probability of not being harmed. Therefore, in a television contest where the jackpots are represented as the “lottery ticket”, there seems to be a greater preference for uncertainty. The hypothesis that contestants with negative emotions are more likely to game in the last question is valid and is in agreement with the literature that argues that negative emotions can induce individuals to process the available information with greater attention, which facilitates rational thinking and a preference for uncertainty (e.g., Kahneman 2012; Schwarz 2012; Thaler 2017).
To validate the joint role of knowledge and emotions in the preference for uncertainty, we defined the explanatory variables: Latency (time used to answer the final question), Confidence (dummy variable that has a value of zero when the contestant does not have confidence in the response, one when having some confidence, and two when having high confidence), and Emotions Type (dummy variable that presents the value of zero for contestants with neutral emotions, one for negative emotions, and two for positive emotions).
The representation for the CART model is a binary tree, which is presented in Figure 1. Each root node represents a single input variable (Latency, Confidence, and Emotion type) and a split point on that variable (which was defined at the median of each variable).
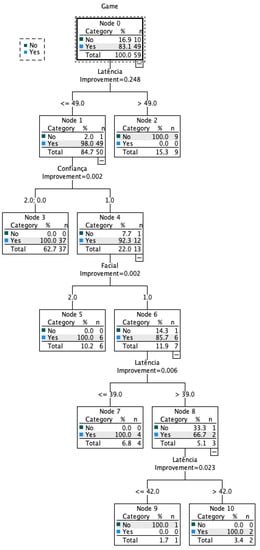
Figure 1.
Decision Tree.
The leaf nodes of the tree contain an output variable (decision to game, i.e., preference for uncertainty) which is used to make a prediction.
With the binary tree representation of the CART model described, we are able to make predictions and explain the output. Given a new input, the tree is traversed by evaluating the specific input started at the root node of the tree. A learned binary tree is actually a partitioning of the input space. One can think of each input variable as a dimension on a p-dimensional space. The decision tree split this up into rectangles (or final nodes). New data are filtered through the tree and land in one of the rectangles, and the output value for that rectangle is the prediction made by the model.
CART analysis was centered on the variables of knowledge and emotions since this method reflects a decision tree and endogenizes the variables that the individual considers in the decision. In JOKER, after the presentation of the final question, the contestant only depends on knowledge and emotions. Based on the improvements, we obtained the importance of variables as shown in Table 6:
Table 6.
CART—Independent Variables.
Our results show asymmetrically large importance of Latency (Knowledge) in explaining an individual’s preference for uncertainty (decision to game) and only a residual impact of Confidence and Emotions Type on that decision.
Our classification results are robust. The estimated risk of misclassification is zero. The total of correct classifications is 100%, and the model equally predicts the preference for uncertainty (Game) or the option for the payoff insurance (No Game), both with 100% (Table 7).
Table 7.
CART—Classification and Risk.
We analyze the results of our CART to understand the differential impact of Knowledge and Emotions by looking at the terminal nodes obtained on the classification tree, presented in Figure 1.
Node 3, made up of contestants who take less time to respond (less than 49 s) and who are either totally confident or completely lacking in confidence, represents 62.7% of the sample. This is the segment where most individuals show a preference for uncertainty (100%), as shown in Table 8. The next highest concentrations of preference for uncertainty are located at nodes 5, 7, and 10. Node 5 includes contestants who respond quickly, have some confidence in the answer, and show positive emotions in decision-making. Nodes 7 and 10 include an improvement in the Latency variable, and node 7 presents individuals who respond in less than 39 s, while node 10 presents individuals who respond in more than 42 s; both nodes have contestants with some confidence in the answer and show negative emotions in decision-making.
Table 8.
CART—Gains for Nodes.
CART is used in research about, for example, facial recognition, spam detection in e-mail, and disease diagnosis (Verikas et al. 2011). The CART estimation function is difficult to visualize and does not generate estimates of coefficients and confidence intervals. Thus, it is not possible to define tables and figures that characterize it succinctly. One of the key advantages of the recursive binary tree is its interpretation. The resource space partition is fully described by a single tree. With more than two entries, partitions like the one in our study are difficult to draw, but the representation of the binary tree works the same way.
Results obtained with CART analysis allow us to argue that knowledge plays a more immediate role in the preference for uncertainty and that emotions are considered, regardless of being positive or negative, when individuals do not have complete confidence in their response. Firstly, superior knowledge and total lack of knowledge were generally associated with a greater willingness to game. These results are in line with the literature, namely the competence hypothesis of Heath and Tversky (1991) in which individuals who feel knowledgeable tend to bet on their judgment and in the case of total absence of knowledge (when they feel ignorant) they choose by the lottery. In the field of emotions, positive or negative, the results showed that they were only associated with a decision to game when the contestant’s confidence in the response was medium. Unlike Maffioletti and Santoni (2019) that concluded that individuals who showed stronger positive emotions and superior knowledge of the decision context were more willing to opt for a preference for uncertainty, while negative emotions were associated with a more neutral attitude towards uncertainty. In our study, both individuals with positive and negative emotions showed a preference for uncertainty. Thus, regardless of the emotional state of a contestant in the face of the twelfth question, we find that preference for uncertainty increases when the contestants have a full domain or total absence of knowledge. This result is in line with Tversky and Fox (1995), who argue that any uncertain choice involves feelings of hope or fear that may reflect the affective responses of individuals to positive and negative outcomes. If the contestant had the opportunity to have an additional question, it would likely increase their hope and, therefore, their choice preference for uncertainty, but it would not double their probability of winning. Therefore, emotions influence decision-making under uncertainty but are neutral to the outcome. These results are in line with the study by Conte et al. (2018) which observed that both happy and sad, fearful, and angry participants are more tolerant of uncertainty than participants in a neutral state. In this study, the authors demonstrated that positive and negative emotions involve separate cognitive processes, so different models are needed to explain their effect on preference for uncertainty. Happy participants, who are in a positive emotional state, seem more likely to evaluate uncertainty positively. Sad, fearful, and angry participants who are in a negative emotional state appear to be willing to change that unwanted state because they hope to improve their current state. Understanding the reasons for the different cognitive mechanisms induced by positive and negative emotions can enhance the theoretical framework of the decision-making process under uncertainty.
Consequently, our results support the idea that preference for uncertainty can be modeled as a two-stage process in which decision weights are a function of judgment probability and that knowledge and emotions impact the decision. Hence, we argue that either knowledgeable and more competent individuals or individuals with a total lack of knowledge opt for a preference for uncertainty. The former act accordingly because they trust their abilities, and the latter because they prefer uncertainty over opting for payoff insurance (Heath and Tversky 1991; Kilka and Weber 2001; Rottenstreich and Hsee 2001; Conte et al. 2018). Emotions are also responsible for the preference for uncertainty and play a leading role when individuals’ trust is not full and, as such, can be used as an excuse and/or justification for the decision taken (De Sousa 1987; Fazio 1995). Our results differ from the study by Maffioletti and Santoni (2019), where stronger positive emotions are associated with a greater willingness to choose uncertainty and negative emotions are associated with neutral behaviors under uncertainty. Both positive and negative emotions drive the preference for uncertainty in our study. Hypothetically, and in line with several studies, positive emotions, when inducing individuals to trust simpler heuristics, may signal that the cognitive process is not necessary, and they choose to prefer uncertainty because they feel positive about their choice (Kahneman 2012; Thaler 2017; Conte et al. 2018). On the other hand, negative emotions can induce individuals to process the available information with greater attention, which facilitates rational thinking, in which case they will choose the preference for uncertainty as it always leads to higher results, being the most rational option of the game for any payoff (Kahneman 2012; Schwarz 2012; Thaler 2017).
5. Conclusions
In this paper, we investigated the joint effects of knowledge and emotions in decision-making under uncertainty, on a TV game show setting. The objective of this research was to understand the impact of emotions and knowledge on the preference for uncertainty, which has mostly been investigated separately in Economics and Psychology. We examined the preference for uncertainty, proxied by a preference for gambling against a sure payoff.
In order to answer the research hypotheses, we used data from 59 episodes of the JOKER television contest to test behavioral hypotheses.
The methodology adopted includes a bivariate association between PU and knowledge and emotions, respectively. Additionally, we test a multivariate association using a Classification and Regression Tree (CART) method, which is suited for a complex nonlinear decision process that robustly mimics human decision-making.
We find that knowledge plays a more prominent role in the preference for uncertainty during the decision process, with emotions being the factor that determines the preference for uncertainty when there is a high level of knowledge or a total absence of it, regardless of whether emotions are positive or negative. These variables matter for two dimensions of the preference for uncertainty: a willingness to game and an insensitivity to the game’s odds.
Our results contribute to ongoing research on the factors that influence a preference for uncertainty. Our findings allow us to argue that in models of analysis of decision-making, knowledge and emotions should not be ignored since most deviations from rationality can be the result of these factors. This has, also, implications for analyzing present risk-taking behavior and its determinants, leading to policy implications, namely for financial literacy programs, as well as market-related impact associated with the potential influence of individuals’ emotions and behaviors on asset prices.
This research also extends the understanding of emotions’ impacts on risk-seeking behavior in general, by using the Facial Action Coding System (FACS) approach, which allows us to distinguish facial muscle movements to identify the emotions that individuals may be transmitting (Ekman and Friesen 1974; Cohn et al. 2005). The use of facial reading to assess emotions is scarce in the extant literature, though it is significantly trending as a robust measurement system. We used FaceReader software, which allowed us to automatically analyze facial expressions for several emotional states (Ekman et al. 1969; Cootes et al. 2001; Ekman and Cordano 2011; Ley et al. 2019).
Additionally, we overcame the limitations identified in a significant number of research pieces in these areas: the ad hoc designing of experiments that could deviate from real-life decision-making. By using a natural experiment, since the individuals are participating on a real TV game with payoffs and rulings that differ from an experiment set for research, our results are less affected by poor experiment design or lack of relevant controls.
Finally, it should be noted that previous research has also addressed game-specific variables as relevant in the context of risk preferences, which can affect emotions and knowledge. As a potential venue for further research, we argue that from the point of view of a broader exploratory and configurational analysis, it will be important to understand how these variables interact with the knowledge and emotions of the individuals.
Author Contributions
Investigation, conceptualization, formal analysis, writing, T.S.; review and supervision, T.C.G. All authors have read and agreed to the published version of the manuscript.
Funding
This research received no external funding.
Institutional Review Board Statement
Ethical review and approval were waived for this study, due to the informed consent obtained from all subjects involved in the study.
Informed Consent Statement
Informed consent was obtained from all subjects involved in the study.
Data Availability Statement
Research data are available from the authors upon request.
Conflicts of Interest
The authors declare no conflict of interest.
Note
| 1 | The ideas of emotions affecting human decision-making, thus creating the foundations for behavioral economics, stem back to the duality of human nature recognized by ancient philosophers and, later, theorized in the works of Sigmund Freud (see e.g., Jones 1910); we thank a reviewer for calling this concept to the research. |
References
- Abdellaoui, Mohammed, Aurélien Baillon, Laetitia Placido, and Peter. P. Wakker. 2011. The Rich Domain of Uncertainty: Source Functions and Their Experimental Implementation. American Economic Review 101: 695–723. [Google Scholar] [CrossRef]
- Barakova, Emilia I., Roman Gorbunov, and Matthias Rauterberg. 2015. Automatic Interpretation of Affective Facial Expressions in the Context of Interpersonal Interaction. IEEE Transactions on Human-Machine Systems 45: 409–18. [Google Scholar] [CrossRef]
- Bart, Mary E., Ken Li, and Charles McClure. 2021. Evolution in Value Relevance of Accounting Information. Stanford University Graduate School of Business Research Paper. pp. 17–24. Available online: https://ssrn.com/abstract=2933197 (accessed on 2 October 2022). [CrossRef]
- Bayar, Yilmaz, H. Funda Sezgin, Ömer Faruk Öztürk, and Mahmut Ünsal Sasmaz. 2020. Financial Literacy and Financial Risk Tolerance of Individual Investors: Multinomial Logistic Regression Approach. SAGE Open 10: 2158244020945717. [Google Scholar] [CrossRef]
- Benartzi, Shlomo, and Richard H. Thaler. 1995. Myopic Loss Aversion and the Equity Premium Puzzle. The Quarterly Journal of Economics 110: 73–92. [Google Scholar] [CrossRef]
- Cohn, Jeffrey F., Zara Ambadar, and Paul Ekman. 2005. Observer-Based Measurement of Facial Expression with the Facial Action Coding System. In The Handbook of Emotion Elicitation and Assessment. Edited by James A. Coan and John J. B. Allen. Oxford University Press Series in Affective Science; New York: Oxford: Oxford University Press. [Google Scholar]
- Conte, Anna, Vittoria Levati, and Chiara Nardi. 2018. Risk Preferences and the Role of Emotions. Economica 85: 305–28. [Google Scholar] [CrossRef]
- Cootes, Timothy F., Gareth J. Edwards, and Christopher J. Taylor. 2001. Active Appearance Models. IEEE Transactions on Pattern Analysis and Machine Intelligence 23: 681–85. [Google Scholar] [CrossRef]
- Cox, Gregory E., and Richard M. Shiffrin. 2017. A dynamic approach to recognition memory. Psychological Review 124: 795–860. [Google Scholar] [CrossRef]
- Damasio, A. R. 2006. Descartes’ Error: Emotion, Reason, and the Human Brain. New York: Vintage Publishing. [Google Scholar]
- De Sousa, R. 1987. The Rationality of Emotion. Cambridge: MIT Press. [Google Scholar]
- Ekman, Paul, and Daniel Cordano. 2011. What is meant by calling emotions basic. Emotion Review 3: 364–70. [Google Scholar] [CrossRef]
- Ekman, Paul, and Wallace V. Friesen. 1974. Detecting deception from the body or face. Journal of Personality and Social Psychology 29: 288–98. [Google Scholar] [CrossRef]
- Ekman, Paul, E. Richard Sorenson, and Wallace V. Friesen. 1969. Pan-cultural elements in facial displays of emotion. Science 164: 86–88. [Google Scholar] [CrossRef]
- Fazio, Russel. H. 1995. Attitudes as Object-Evaluation Associations: Determinants, Consequences, and Correlates of Attitude Accessibility. In Attitude Strength: Antecedents and Consequences. Edited by Richard E. Petty and Jon A. Krosnick. Mahwah: Lawrence Erlbaum, pp. 247–82. [Google Scholar]
- Fischhoff, Baruch, Don MacGregor, and Sarah Lichtenstein. 1983. Categorical Confidence. Decision Research—A Branch of Perceptronics. Available online: https://scholarsbank.uoregon.edu/xmlui/bitstream/handle/1794/20625/161.pdf?sequence=1&isAllowed=y (accessed on 29 September 2022).
- Fischhoff, Baruch, Paul Slovic, and Sarah Lichtenstein. 1977. Knowing with Certainty: The Appropriateness of Extreme Confidence. Journal of Experimental Psychology: Human Perception and Performance 3: 552–64. [Google Scholar] [CrossRef]
- Gabbi, Giampaolo, and Giovanna Zanotti. 2019. Sex & the City. Are financial decisions driven by emotions? Journal of Behavioral and Experimental Finance 21: 50–57. [Google Scholar]
- Gonçalves, Tiago Cruz. 2021. The Impact of Discretionary Measurement Criteria on Investors’ Judgement and Decisions. Games 13: 3. [Google Scholar] [CrossRef]
- Goodie, Adam. 2003. The Role of Perceived Control and Overconfidence in Pathological Gambling. Journal of Gambling Studies 21: 481–502. [Google Scholar] [CrossRef]
- Griffin, Dale, and Amos Tversky. 1992. The weighing of evidence and the determinants of confidence. Cognitive Psychology 24: 411–35. [Google Scholar] [CrossRef]
- Hall, Crystal C., Lynn Ariss, and Alexander Todorov. 2007. The illusion of knowledge: When more information reduces accuracy and increases confidence. Organizational Behavior and Human Decision Processes 103: 277–90. [Google Scholar] [CrossRef]
- Heath, Chip, and Amos Tversky. 1991. Preference and belief: Ambiguity and competence in choice under uncertainty. Journal of Risk and Uncertainty 4: 4–28. [Google Scholar] [CrossRef]
- Holsapple, Clyde H. 2008. CHAPTER 2—Decisions and Knowledge. In Handbook on Decision Support Systems 1. Berlin and Heidelberg: Springer, pp. 21–53. [Google Scholar]
- Huizingh, Eelko, John C. Liechty, Arnaud De Bruyn, Ducan Fong, and Greg Elmer. 2002. It’s What You Don’t Like That’s Important: Improving Conjoint Analysis by Incorporating Uncertainty. Groningen: University of Groningen, pp. 1–42. [Google Scholar]
- Ifcher, John, and Homa Zarghamee. 2011. Happiness and Time Preference: The Effect of Positive Affect in a Random-Assignment Experiment. American Economic Review 101: 3109–29. [Google Scholar] [CrossRef]
- Johnson, Eric, and Amos Tversky. 1983. Affect, Generalization, and the Perception of Risk. Journal of Personality and Social Psychology 45: 20–31. [Google Scholar] [CrossRef]
- Jones, E. 1910. Freud’s theory of dreams. The American Journal of Psychology 21: 283–308. [Google Scholar] [CrossRef]
- Kahneman, Daniel. 2012. Pensar, Depressa e Devagar. Lisboa: Temas e Debates. [Google Scholar]
- Kilka, Michael, and Martin Weber. 2001. What determines the shape of the probability weighting function under uncertainty? Management Science 47: 1712–26. [Google Scholar] [CrossRef]
- Kimble, Charles E., and Steven D. Seidel. 1991. Vocal signs of confidence. Journal of Nonverbal Behavior 15: 99–105. [Google Scholar] [CrossRef]
- Koriat, Asher, Hilit Ma’ayan, and Ravit Nussinson. 2006. The intricate relationships between monitoring and control in metacognition: Lessons for the cause-and-effect relation between subjective experience and behavior. Journal of Experimental Psychology General 135: 36–69. [Google Scholar] [CrossRef] [PubMed]
- Levenson, Robert W., Paul Ekman, and Wallace V. Friesen. 1990. Voluntary facial action generates emotion-specific autonomic nervous system activity. Psychophysiology 27: 363–84. [Google Scholar] [CrossRef]
- Ley, Matthias, Maria Egger, and Sten Hanke. 2019. Evaluating Methods for Emotion Recognition based on Facial and Vocal Features. Paper presented at the Conference: Joint Proceeding of the Poster and Workshop Sessions of AmI-2019, the 2019 European Conference on Ambient Intelligence, Rome, Italy, November 13–15. [Google Scholar]
- Loewenstein, George F. 1996. Out of control: Visceral influences on behavior. Organizational Behavior and Human Decision Processes 65: 272–92. [Google Scholar] [CrossRef]
- Loewenstein, George F. 2000. Emotions in Economic Theory and Economic Behavior. American Economic Review 90: 426–32. [Google Scholar] [CrossRef]
- Loewenstein, George F., Elke U. Weber, Christopher K. Hsee, and Ned Welch. 2001. Risk as feelings. Psychological Bulletin 127: 267–86. [Google Scholar] [CrossRef]
- Maffioletti, Anna, and Michele Santoni. 2019. Emotion and Knowledge in Decision Making under Uncertainty. Games 10: 36. [Google Scholar] [CrossRef]
- Parmitasari, Rika Dwi, Alim Syariati, and Sumarlin. 2022. Chain Reaction of Behavioral Bias and Risky Investment Decision in Indonesian Nascent Investors. Risks 10: 145. [Google Scholar] [CrossRef]
- Pestana, Maria Helena, and João Nunes Gageiro. 2009. Análise Categórica, Árvores de Decisão e Análise de Conteúdo—Em Ciências Sociais e da Saúde com o SPSS. Lisboa: LIDEL—Edições Técnicas, Lda. [Google Scholar]
- Pollak, Seth D., Michael Messner, Doris J. Kistler, and Jeffrey F. Cohn. 2009. Development of perceptual expertise in emotion recognition. Cognition 110: 242–47. [Google Scholar] [CrossRef]
- Ratcliff, Roger, Philip L. Smith, Scott D. Brown, and Gail McKoon. 2016. Diffusion Decision Model: Current Issues and History. Trends in Cognitive Sciences 20: 260–81. [Google Scholar] [CrossRef] [PubMed]
- Rick, Scott, and George Loewenstein. 2008. The Role of Emotion in Economic Behavior. In The Handbook of Emotion, 3rd ed. New York: Guilford Press, chp. 9. [Google Scholar]
- Rottenstreich, Yuval, and Christopher K. Hsee. 2001. Money, kisses, and electric shocks: On the affective psychology of risk. Psychological Science 12: 185–90. [Google Scholar] [CrossRef] [PubMed]
- Saraiva, Tânia, and Tiago Cruz Gonçalves. 2022. Should I Play or Should I Go? Individuals’ Characteristics and Preference for Uncertainty. Games 13: 31. [Google Scholar] [CrossRef]
- Scherer, Klaus R. 2000. Psychological models of emotion. In The Neuropsychology of Emotion. Edited by Joan C. Borod. Oxford: Oxford University Press, pp. 137–62. [Google Scholar]
- Schwarz, Norbert. 2012. Feelings-as-information theory. In Handbook of Theories of Social Psychology. Edited by Paul A. M. Van Lange, Arie W. Kruglanski and E. Tory Higgins. Thousand Oaks: SAGE, pp. 289–308. [Google Scholar]
- Slovic, Pauk, Melissa L. Finucan, Ellen Peters, and Donald G. MacGregor. 2004. Risk as Analysis and Risk as Feelings: Some Thoughts about Affect, Reason, Risk, and Rationality. Risk Analysis 24: 311–22. [Google Scholar] [CrossRef] [PubMed]
- Slovic, Paul, Melissa L. Finucane, Ellen Peters, and Donald G. MacGregor. 2007. The affect heuristic. European Journal of Operational Research 177: 1333–52. [Google Scholar] [CrossRef]
- Thaler, Richard. 2017. Comportamento Inadequado—A Construção da Economia Comportamental. Lisboa: Actual Editora. [Google Scholar]
- Thaler, Richard H., Amos Tversky, Daniel Kahneman, and Alan Schwartz. 1997. The Effect of Myopia and Loss Aversion on Risk Taking: An Experimental Test. The Quarterly Journal of Economics 112: 647–61. [Google Scholar] [CrossRef]
- Tversky, Amos, and Craig R. Fox. 1995. Weighing risk and uncertainty. Psychological Review 102: 269–83. [Google Scholar] [CrossRef]
- Tversky, Amos, and Daniel Kahneman. 1992. Advances in prospect theory: Cumulative representations of uncertainty. Journal of Risk Uncertain 5: 297–323. [Google Scholar] [CrossRef]
- Vamossy, Domonkos F. 2021. Investor emotions and earnings announcements. Journal of Behavioral and Experimental Finance 30: 100474. [Google Scholar] [CrossRef]
- Varas, Blas Espinoza, and Charles S. Watson. 1994. Effects of decision criterion on response latencies of binary decisions. Perception & Psychophysics 55: 190–203. [Google Scholar]
- Verikas, Antanas, Adas Gelzinis, and Marija Bacauskiene. 2011. Mining data with random forests: A survey and results of new tests. Pattern Recognition 44: 330–49. [Google Scholar] [CrossRef]
- Von Neumann, John, and Oskar Morgenstern. 1947. Theory of Games and Economic Behavior. Princeton: Princeton University Press. [Google Scholar]
- Voss, Andreas, Klaus Rothermund, and Jochen Voss. 2004. Interpreting the parameters of the diffusion model: An empirical validation. Memory & Cognition 32: 1206–20. [Google Scholar]
Disclaimer/Publisher’s Note: The statements, opinions and data contained in all publications are solely those of the individual author(s) and contributor(s) and not of MDPI and/or the editor(s). MDPI and/or the editor(s) disclaim responsibility for any injury to people or property resulting from any ideas, methods, instructions or products referred to in the content. |
© 2022 by the authors. Licensee MDPI, Basel, Switzerland. This article is an open access article distributed under the terms and conditions of the Creative Commons Attribution (CC BY) license (https://creativecommons.org/licenses/by/4.0/).