
Optimization in Item Delivery as Risk Management: Multinomial Case Using the New Method of Statistical Inference for Online Decision


Abstract
:1. Introduction
2. Literature Review
3. Material and Methods
3.1. Predictive Distribution
3.2. Prediction Accuracy
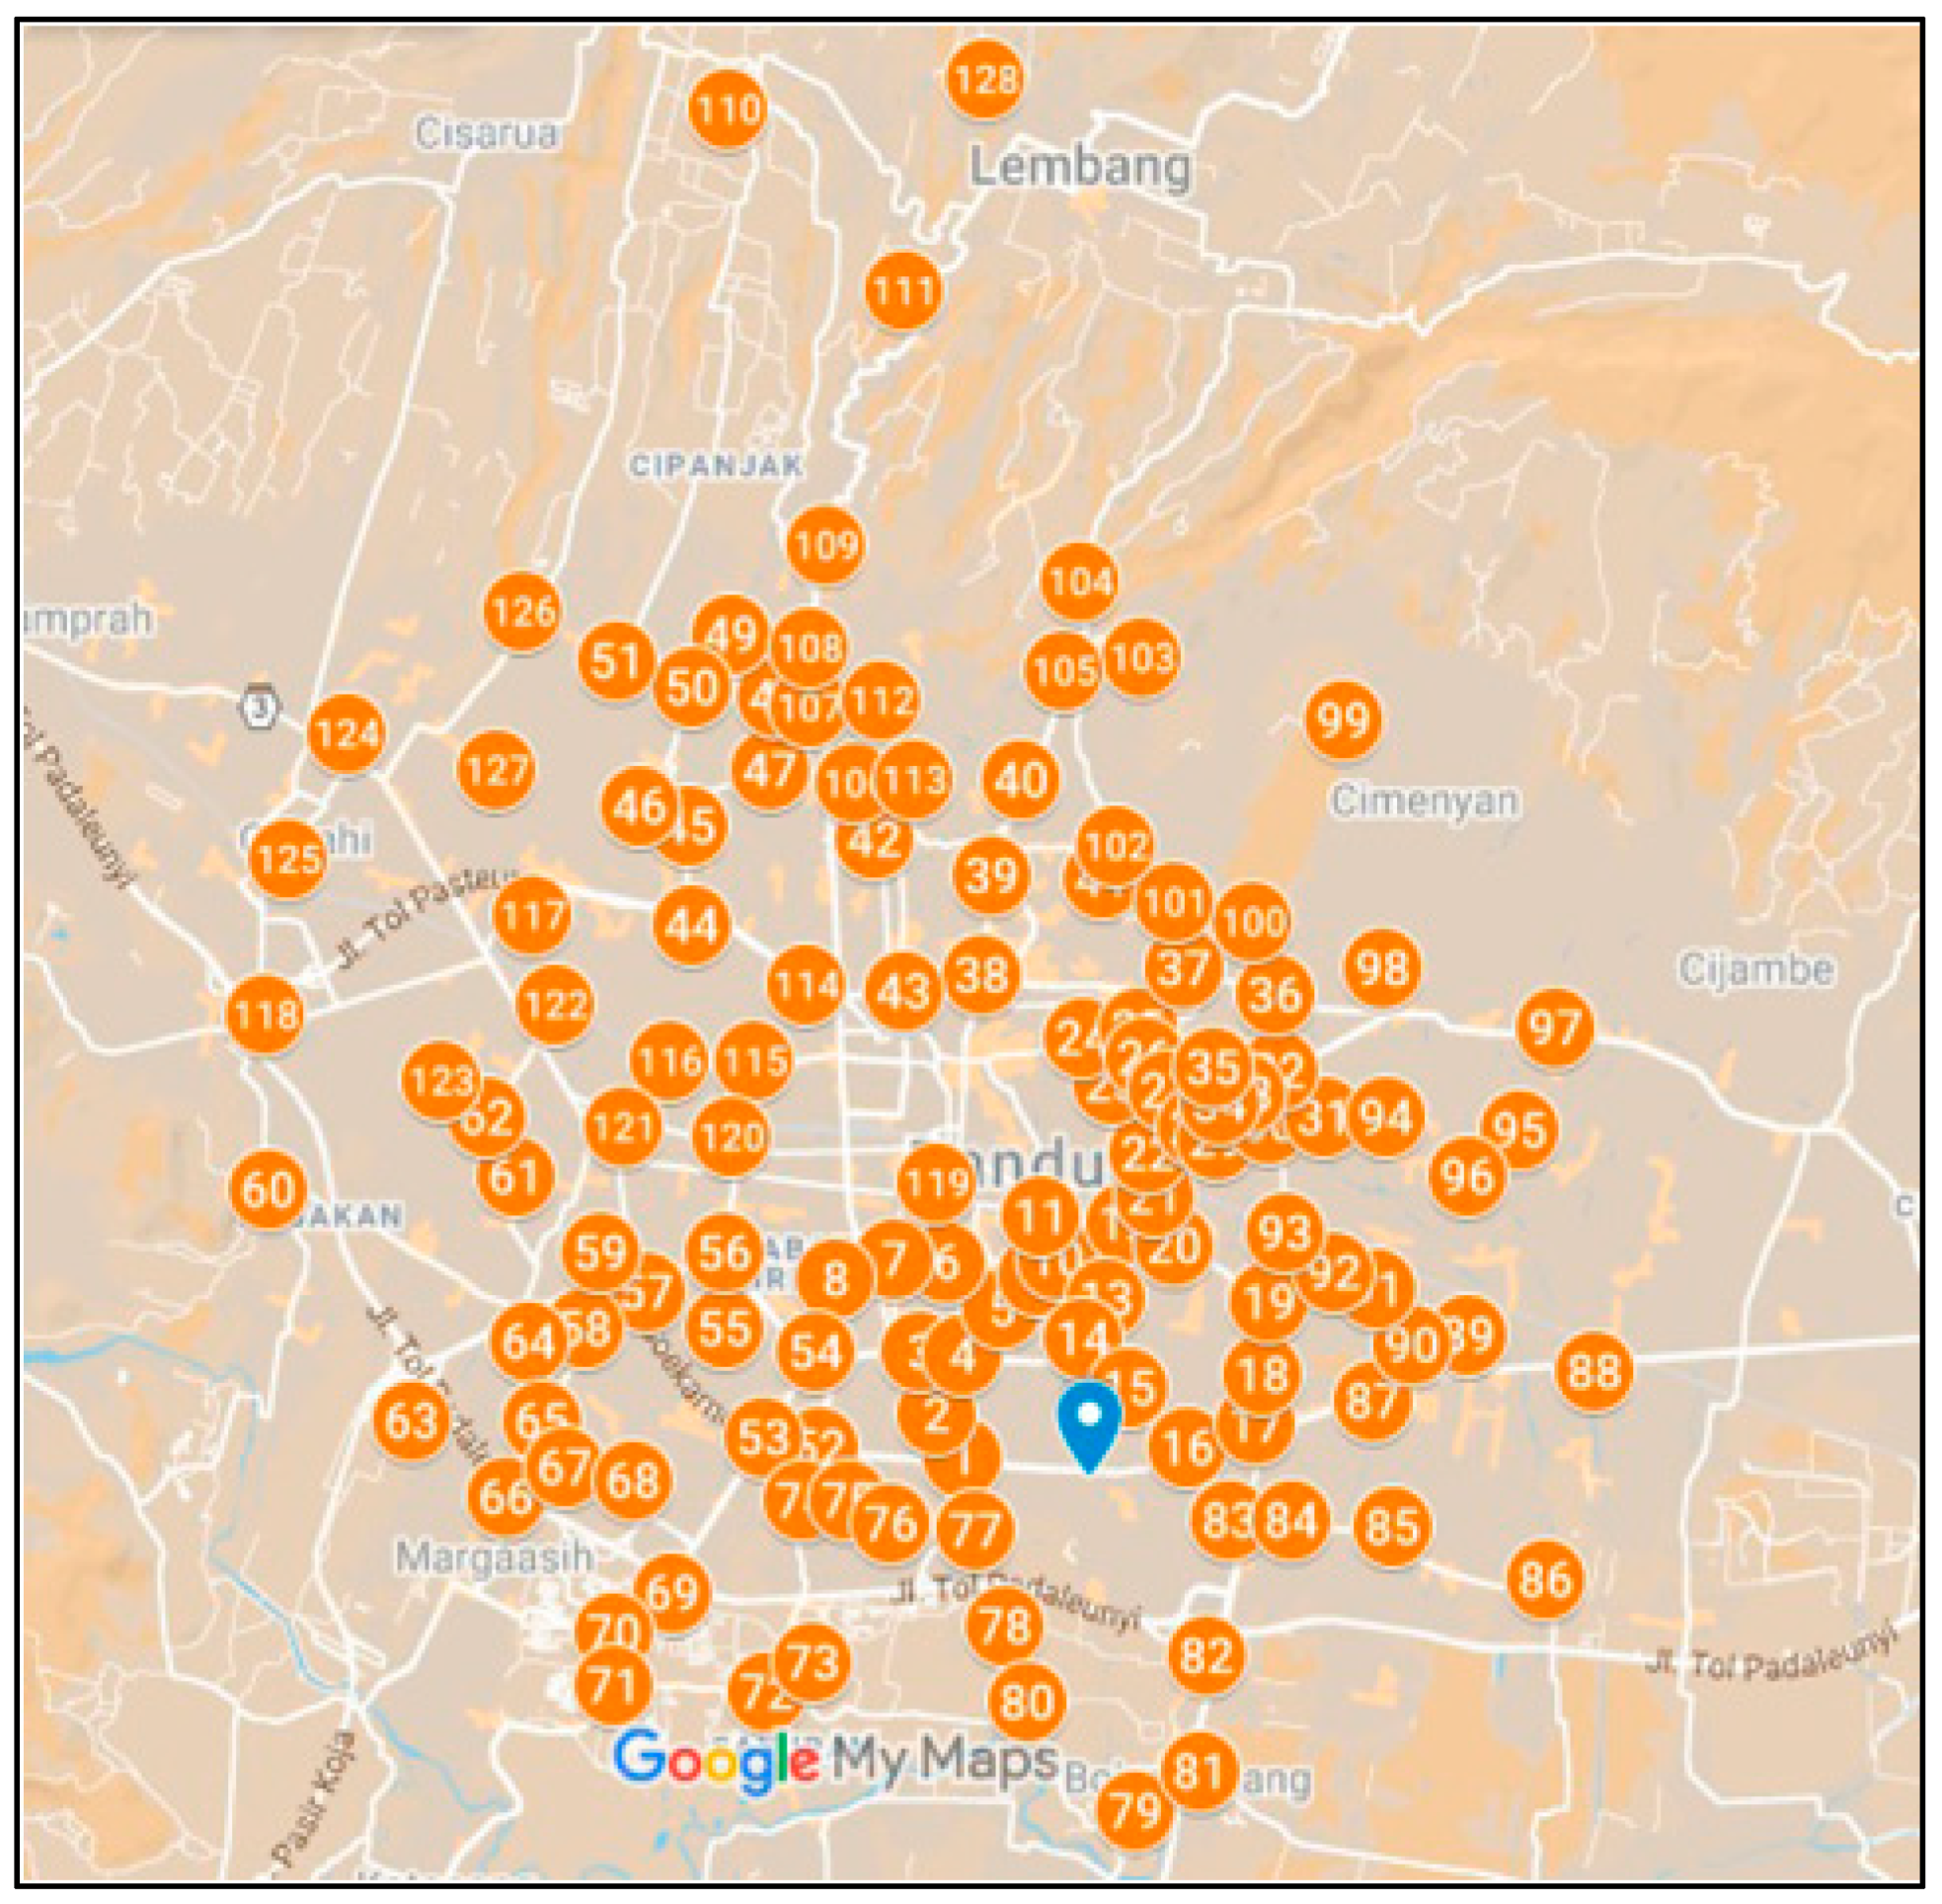
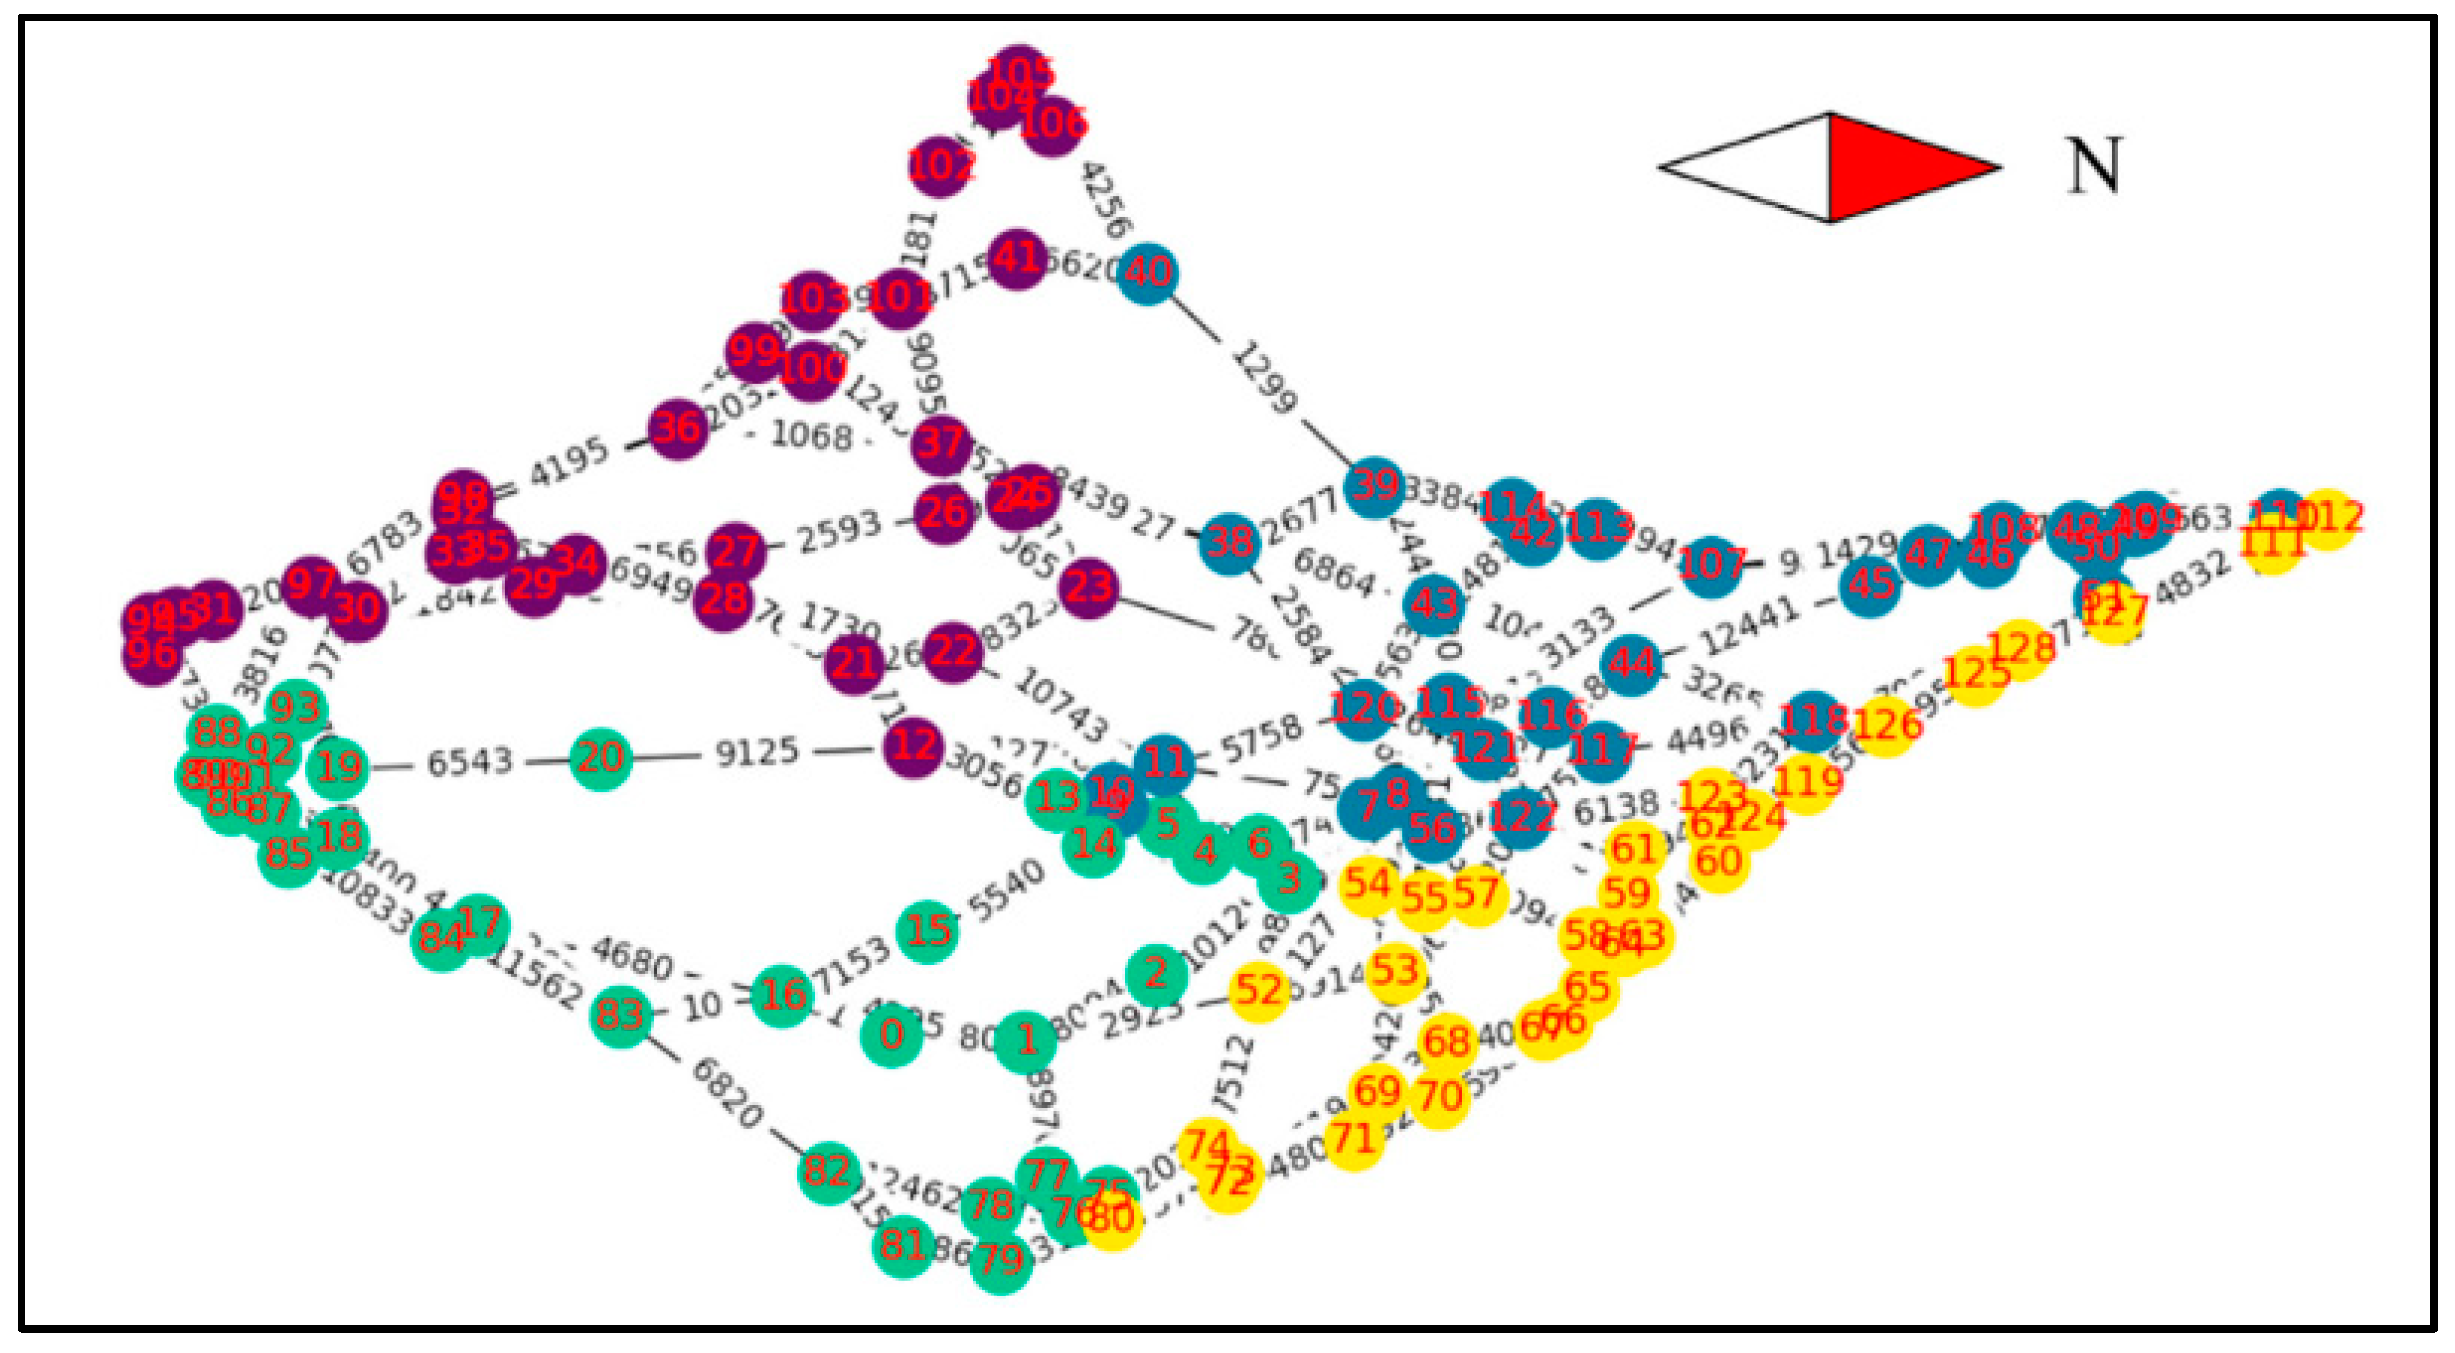
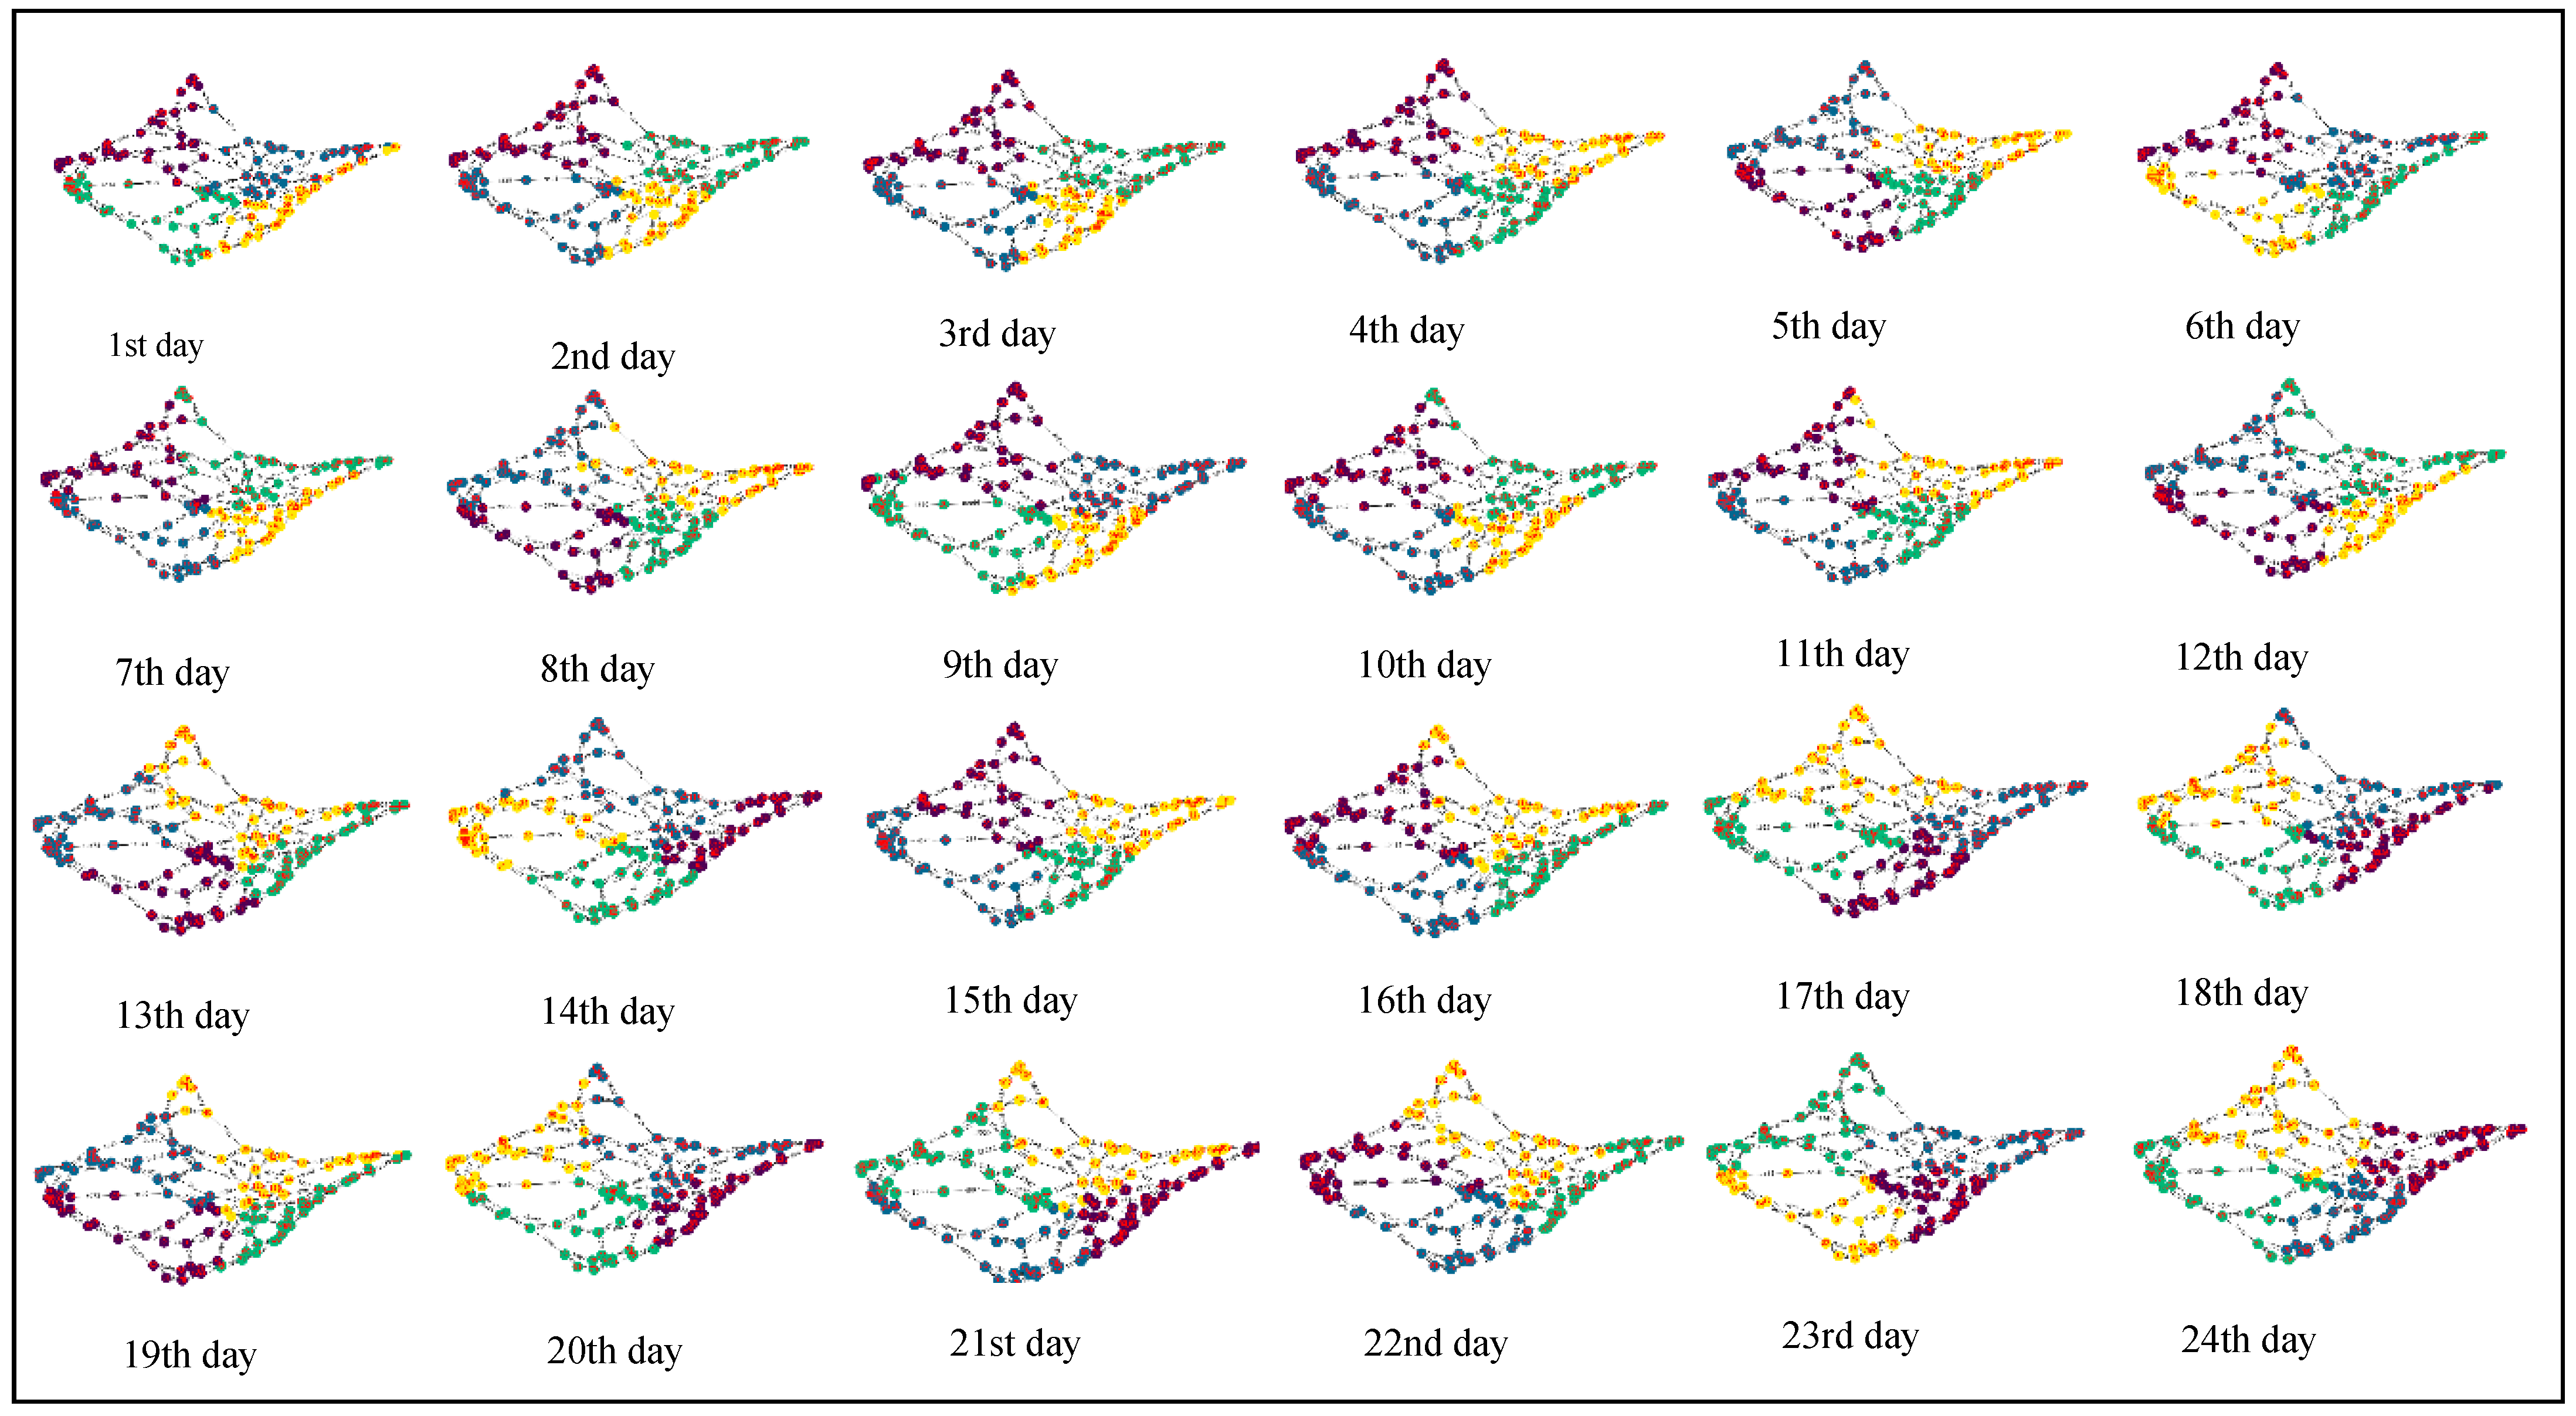
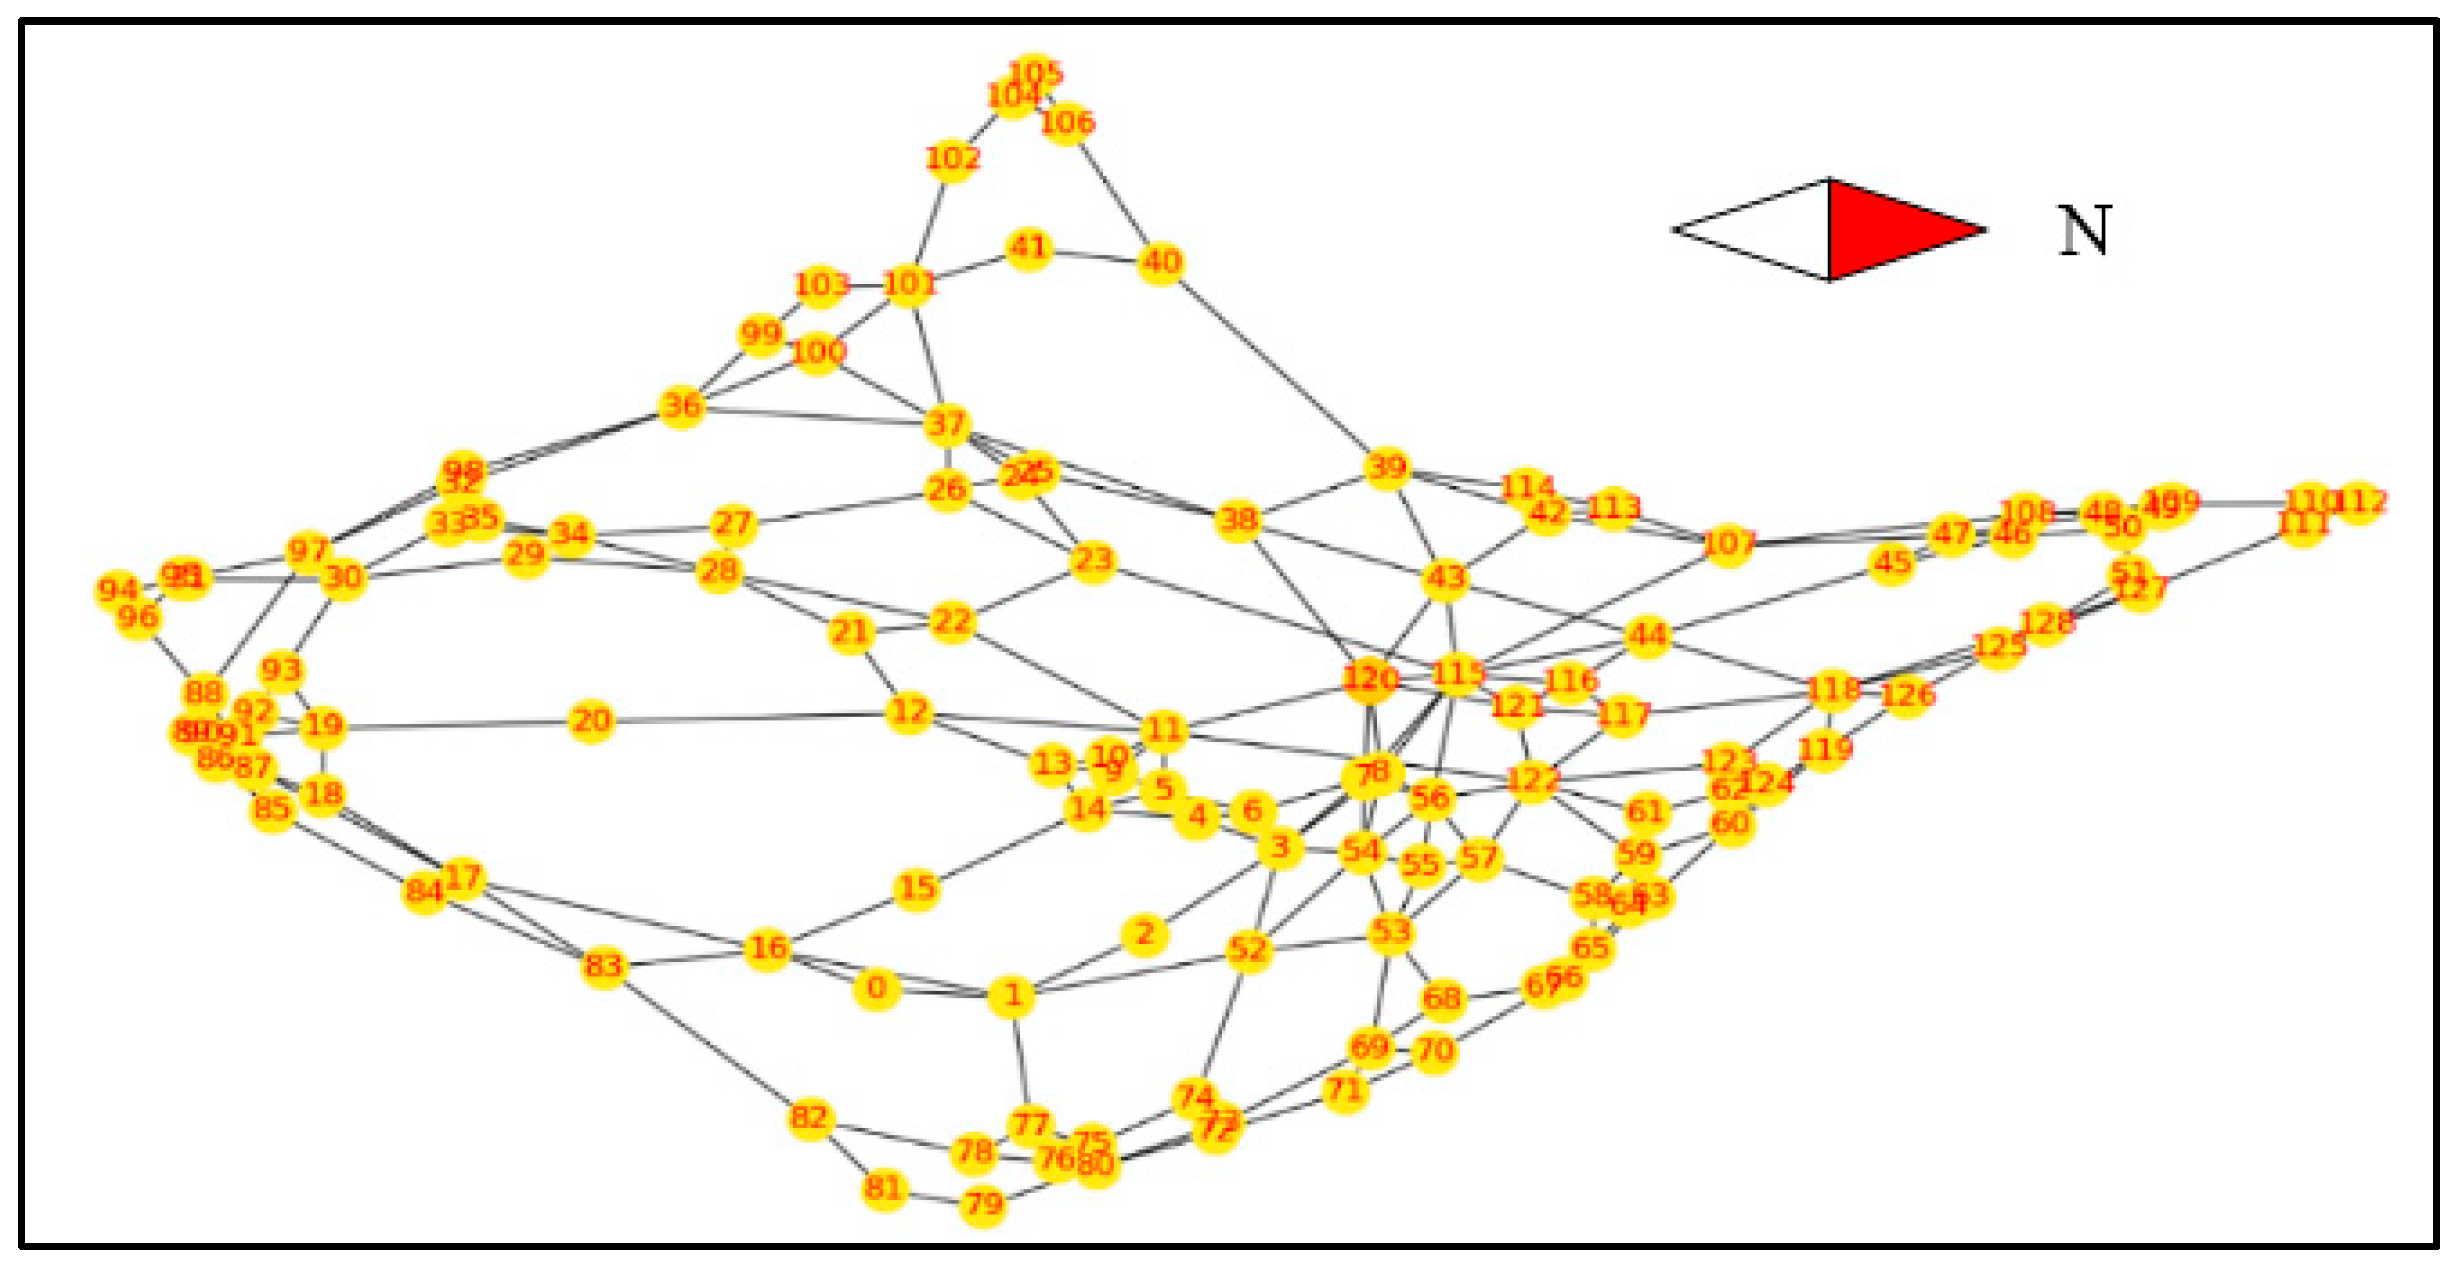
3.3. Network Clustering
3.4. Optimization
- One unit of vehicle delivers items to several locations (nodes), but each node is visited only once;
- The vehicle must return to the depot;
- The goal is to find the path with the shortest delivery time.
3.5. Item Delivery Strategy
4. Result and Discussion
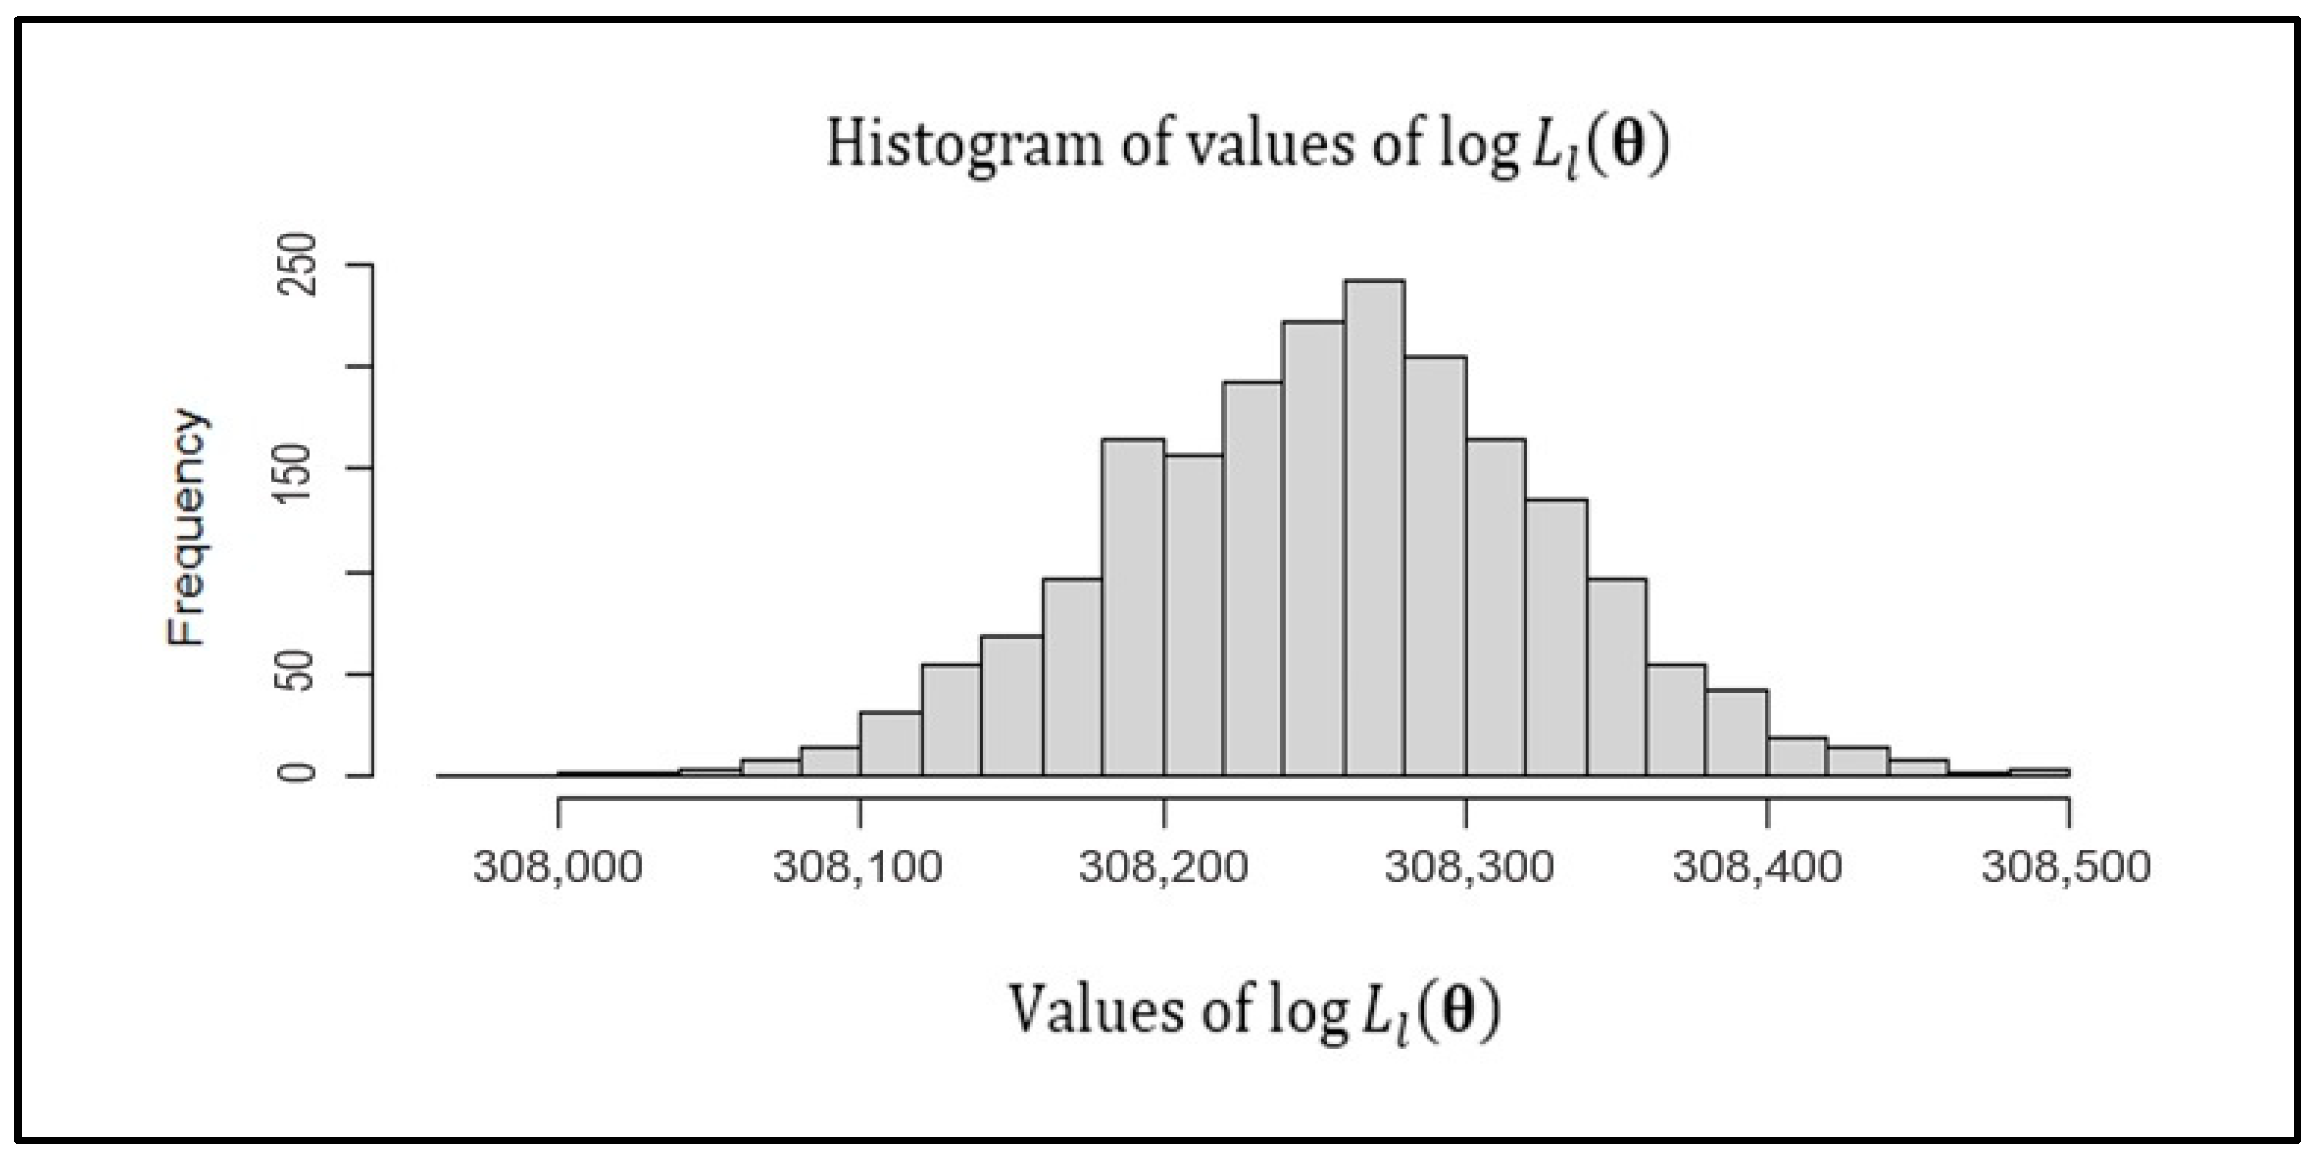
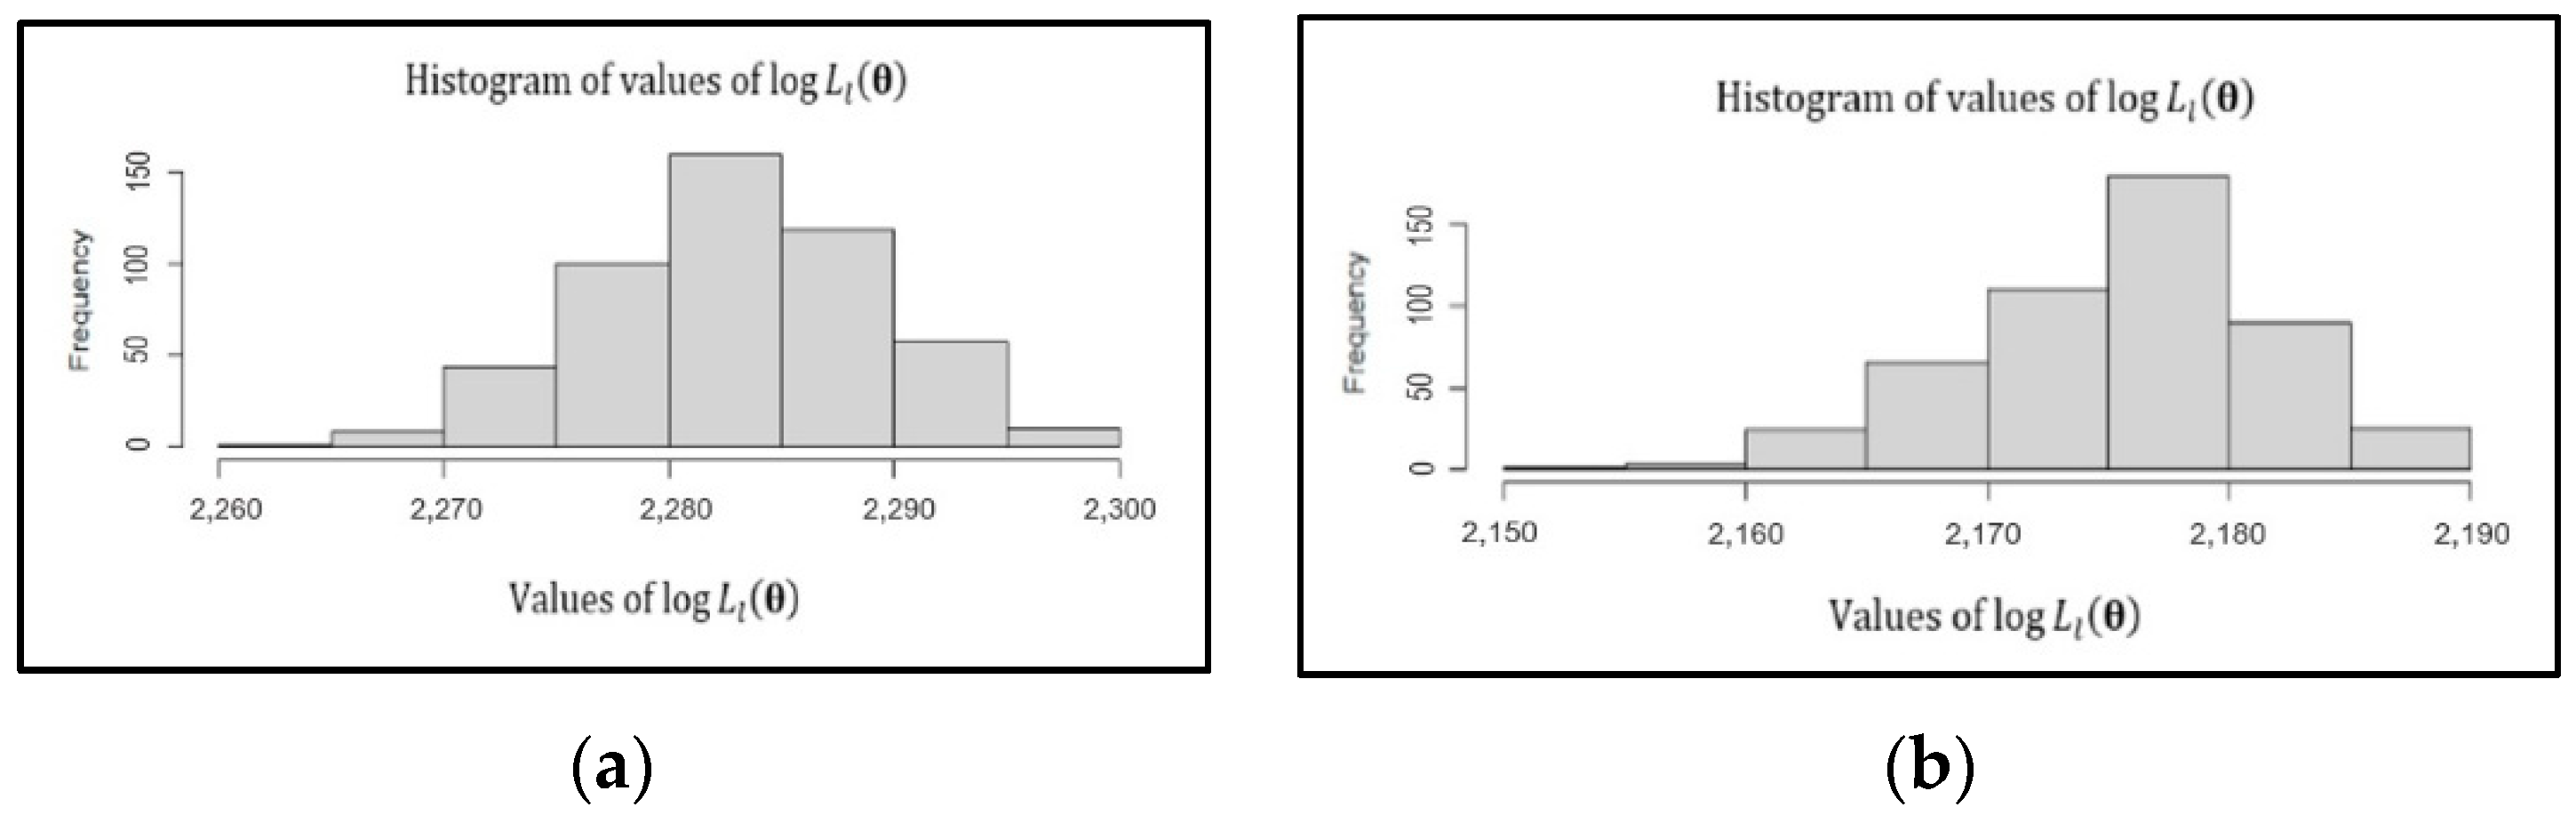
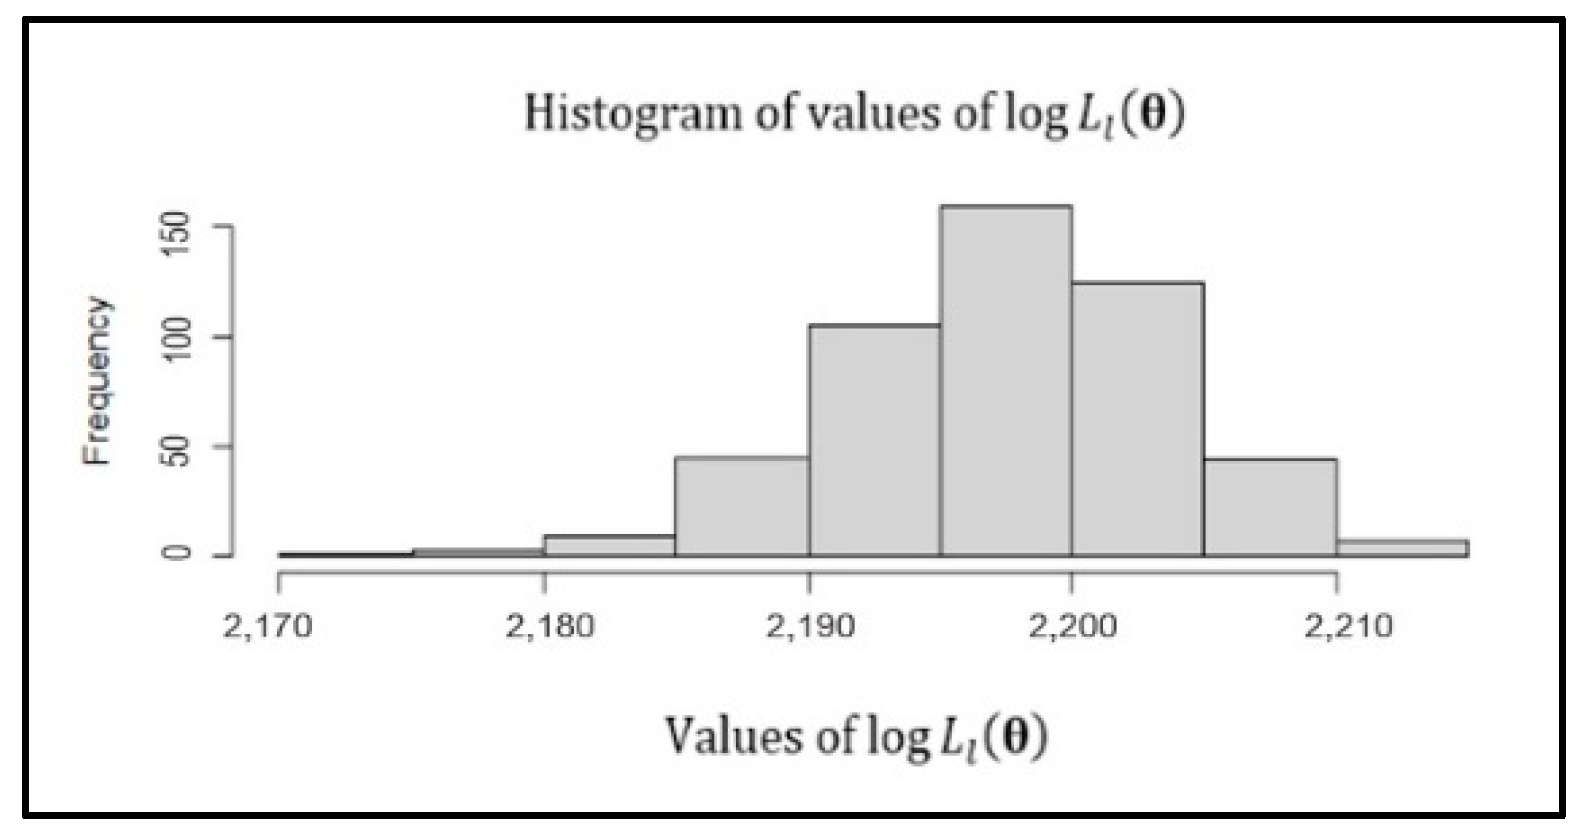
4.1. New Method
| Algorithm 1. Data testing. |
|
4.2. Limitations
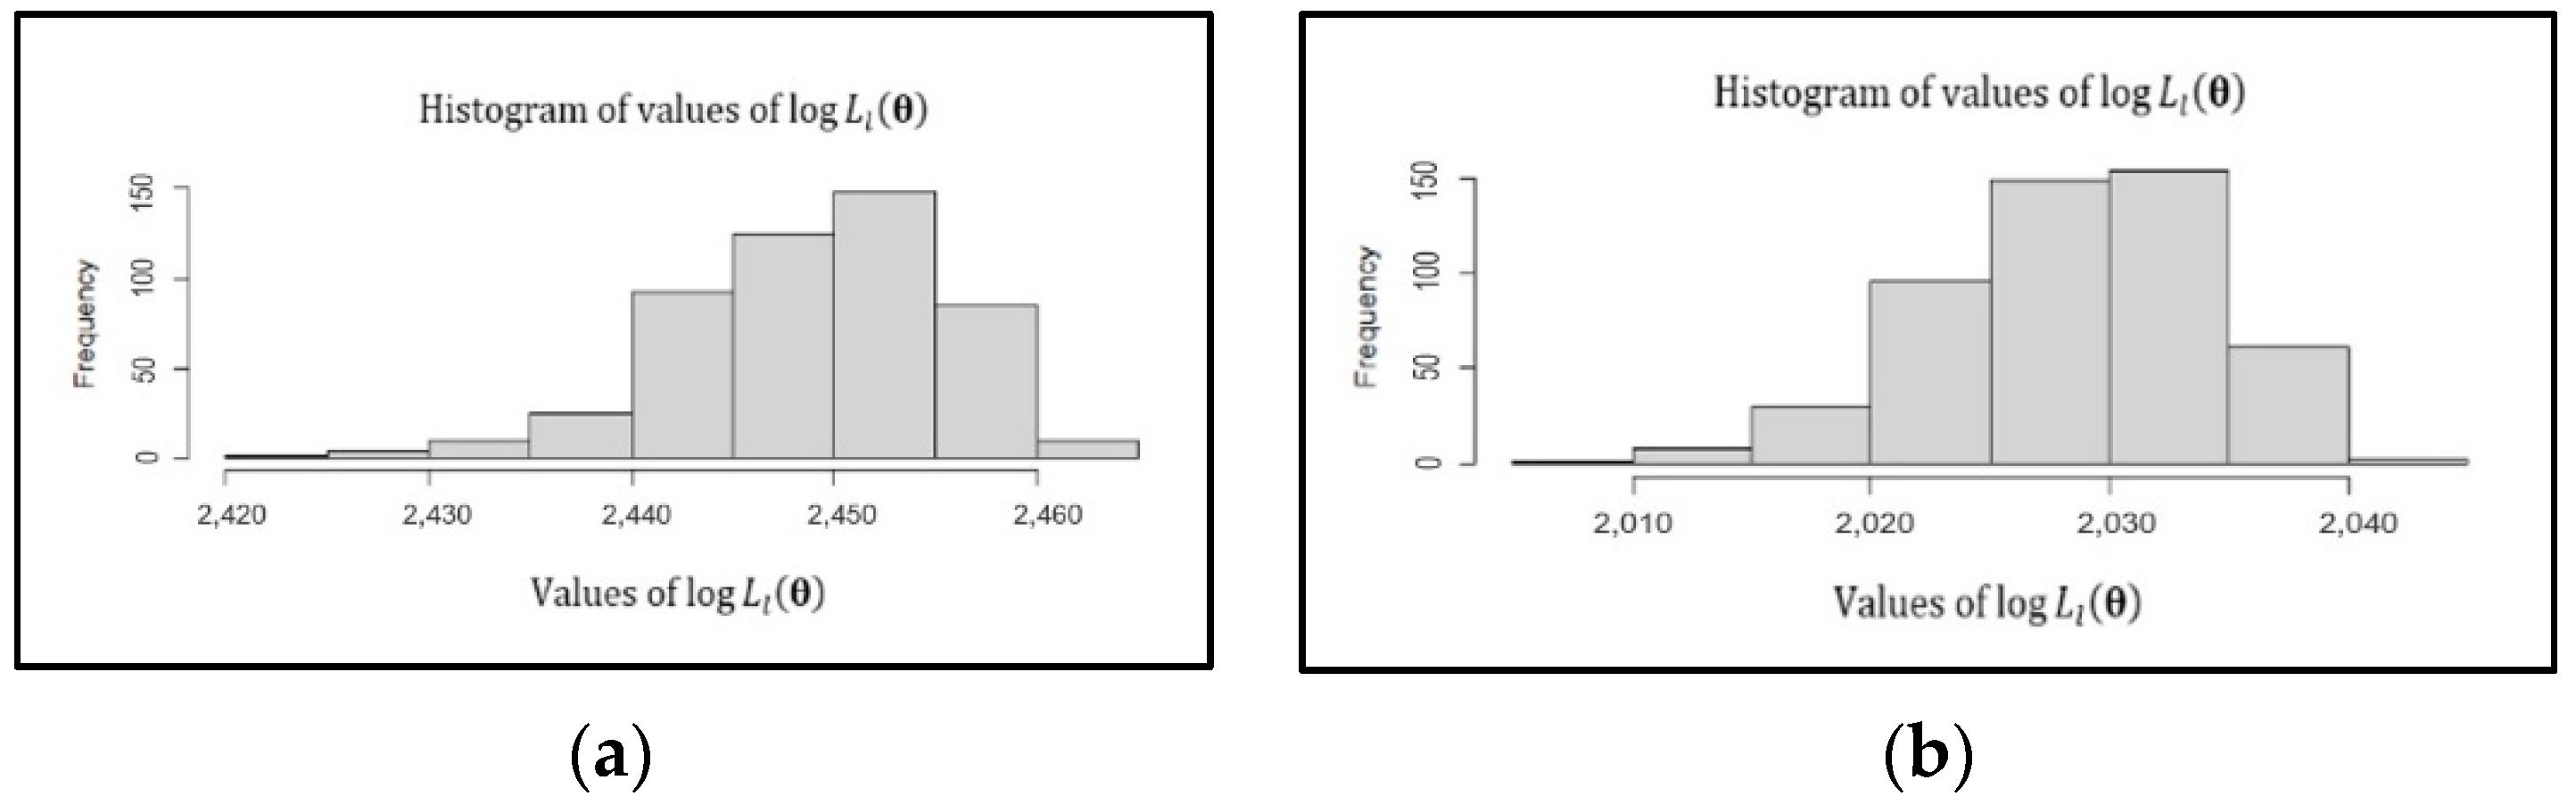
4.3. Simulation
4.4. Optimization as Risk Management
5. Conclusions
Author Contributions
Funding
Institutional Review Board Statement
Informed Consent Statement
Data Availability Statement
Acknowledgments
Conflicts of Interest
References
- Aranburu, Larraitz, Laureano F. Escudero, M. Araceli Garín, María Merino, and Gloria Pérez. 2016. Risk Management for Mathematical Optimization under Uncertainty. Documento de Trabajo BILTOKI 1: 1–18. [Google Scholar]
- Athreya, Krishna B., and Soumendra N. Lahiri. 2006. Measure Theory and Probability Theory. New York: Springer. [Google Scholar]
- Avetisyan, Marianna, and Jean-Paul Fox. 2012. The Dirichlet-multinomial model for multivariate randomized response data and small samples. Psicologica 33: 362–90. [Google Scholar]
- Azen, Razia, and Cindy M. Walker. 2010. Categorical Data Analysis for the Behavioral and Social Sciences. New York: Routledge Taylor & Francis Group. [Google Scholar]
- Bernardino, Raquel, and Ana Paias. 2018. Solving the family traveling salesman problem. European Journal of Operational Research 267: 453–66. [Google Scholar] [CrossRef]
- Better, Marco, Fred Glover, Gary Kochenberger, and Haibo Wang. 2008. Simulation optimization: Aplications in risk management. International Journal of Information Technology & Decision Making 7: 571–87. [Google Scholar] [CrossRef]
- Brock, Willian A., and Steven N. Durlauf. 2003. Multinomial Choice with Social Interactions. Technical Working Paper: National Bureau of Economic Research 288: 1–44. [Google Scholar]
- Casteigts, Arnaud, Paola Flocchini, Walter Quattrociocchi, and Nicola Santoro. 2011. Time-varying graphs and dynamic networks. International Conference on Ad-Hoc Networks and Wireless 27: 346–59. [Google Scholar]
- Cooke, Roger, and Janos Pinter. 1989. Optimization in risk management. Civil Engineering Systems 6: 122–28. [Google Scholar] [CrossRef]
- Degtereva, Viktoria, Maria Liubarskaia, Viktoria Merkusheva, and Alexey Artemiev. 2022. Increasing Importance of Risk Management in the Context of Solid Waste Sphere Reforming in Russian Regions. Risks 10: 79. [Google Scholar] [CrossRef]
- Dror, Moshe, and Pierre Trudeau. 1990. Split delivery routing. Naval Research Logistic 37: 383–402. [Google Scholar] [CrossRef]
- Elsner, Ulrich. 1997. Graph Partitioning. Chemnits: Technishe Universitat Chemnits. [Google Scholar]
- Hogg, Robert V., Joseph W. McKean, and Allen T. Craig. 2005. Introduction to Mathematical Statistics, 6th ed. Hoboken: Pearson. [Google Scholar]
- Johnson, Norman L., Samuel Kotz, and Narayanaswamy Balakrishnan. 1996. Discrete Multivariate Distributions. New York: John Wiley & Sons Inc. [Google Scholar]
- Klugman, Stuart A., Harry H. Panjer, and Gordon E. Willmot. 2012. Loss Models: From Data to Decisions, 4th ed. Hoboken: John Wiley & Sons Inc. [Google Scholar]
- Krokhmal, Pavlo, Michael Zabarankin, and Stan Uryasev. 2011. Modeling and optimization of risk. Surveys in Operations Research and Management Science 16: 49–66. [Google Scholar] [CrossRef]
- Lam, James. 2016. Strategic Risk Management: Optimizing the Risk Return Profile. New York: The Association of Accounts and Financial Professionals in Bussiness (IMA). [Google Scholar]
- Lewis, Colin D. 1982. Industrial and Business Forecasting Methods. London: Butterworths. [Google Scholar]
- Nelissen, Heleen E., Daniella Brals, Hafsat A. Ameen, Marijn van Der List, Berber Krammer, Tanimola M. Akande, Wendy Janssens, and Anja H. Van’t Hoog. 2020. The prominent roel of informal medicine vendors despite health insurance: A weekly diaries study in rural Nigeria. Health Policy and Planning 35: 54–363. [Google Scholar] [CrossRef] [PubMed]
- Newman, Mark E. J., and Michelle Girvan. 2004. Finding and evaluating community structure in networks. Physical Review E 69: 026113. [Google Scholar] [CrossRef] [PubMed]
- Nownes, Anthony J. 1992. Primaries, general elections, and voter turnout: A multinomial logit model of the decision to vote. American Politics Quarterly 20: 205–26. [Google Scholar] [CrossRef]
- Oosterhoff, John, and Willem R. Van Zwet. 1972. The likelihood ratio test for the multinomial distribution. Proceedings of the Sixth Berkeley Symposium on Mathematical Statistics and Probability 1: 31–49. [Google Scholar] [CrossRef]
- Owen, Art B. 2018. Introduction to Statistical Inference: Generalized Likelihood Ratios Test. Stanford: Stanford University, Available online: https://web.stanford.edu/class/archive/stats/stats200/stats200.1172/Lecture22.pdf (accessed on 23 March 2020).
- Reddy, Byreddy R., Ch. Deepika, G. Navya, and Gopal Raja. 2015. Factors effecting the usage of public transport multinomial logit model. International Journal of Computer Science and Information Technologies 6: 4672–675. [Google Scholar]
- Reinelt, Gerhard. 2012. TSPLIB: A traveling salesman problem library. ORSA Journal on Computing 3: 376–84. [Google Scholar] [CrossRef]
- Rith, Monorom, Fengqi Liu, Pai-Hsien Hung, Kento Yoh, Alexis M. Fillone, and Jose B. M. Biona. 2019. R programming language written for estimation of the integrated multinomial logit-linear regression model based on a copula approach: A technical article. Proceedings of the Eastern Asia Society for Transportation Studies 12: 1–11. [Google Scholar]
- Swamidas, Paul M. 2000. Encyclopedias of Production and Manufacturing Management. Boston: Kluwer Academic Publishing. [Google Scholar]
- Walpole, Ronald E., Raymon H. Myers, Sharon L. Myers, and Keying Ye. 2012. Probability and Statistics for Engineer and Scientists, 6th ed. Hoboken: Pearson. [Google Scholar]
- Yudhanegara, Mokhammad R., and Karunia E. Lestari. 2019. Clustering for multi-dimensional data set: A case study on educational. Journal of Physics: Conference Series 1280: 042025. [Google Scholar] [CrossRef]
- Yudhanegara, Mokhammad R., Sapto W. Indratno, and R. R. Kurnia N. Sari. 2020. Clustering for items distribution network. Journal of Physics: Conference Series 1496: 012019. [Google Scholar] [CrossRef]
- Yudhanegara, Mokhammad R., Sapto W. Indratno, and R. R. Kurnia N. Sari. 2021a. Dynamic items deivery network: Prediction and clustering. Heliyon 7: e06934. [Google Scholar] [CrossRef]
- Yudhanegara, Mokhammad R., Sapto W. Indratno, and R. R. Kurnia N. Sari. 2021b. Role of clustering method in items delivery optimization. Journal of Physics: Conference Series 2084: 012011. [Google Scholar] [CrossRef]
- Yudhanegara, Mokhammad R., Sapto W. Indratno, and R. R. Kurnia N. Sari. 2022. Prediction of traffic density and item delivery strategy through clustering. Sesiomadika 5: 27–46. [Google Scholar]


| Percentage | Criteria |
|---|---|
| Very accurate | |
| Good | |
| Fair | |
| Not accurate |
| Parameter and | Data | Decision | Item Delivery Strategy Changes | Parameter | Error | |
|---|---|---|---|---|---|---|
| D1–24 | D1–24 vs. D25 | is not rejected | No | D1–24 | 0.23912 | |
| D1–24 | D1–24 vs. D26 | is not rejected | No | D1–25 | 0.22540 | |
| D1–24 | D1–24 vs. D27 | is not rejected | No | D1–26 | 0.21168 | |
| D1–24 | D1–24 vs. D28 | is not rejected | No | D1–27 | 0.23324 | |
| D1–24 | D1–24 vs. D29 | is not rejected | No | D1–28 | 0.21168 | |
| D1–24 | D1–24 vs. D30 | is not rejected | No | D1–29 | 0.24108 | |
| D1–24 | D1–24 vs. D31 | is not rejected | No | D1–30 | 0.25872 | |
| D1–24 | D1–24 vs. D32 | is not rejected | No | D1–31 | 0.24892 | |
| D1–24 | D1–24 vs. D33 | is not rejected | No | D1–32 | 0.23912 | |
| D1–24 | D1–24 vs. D34 | is not rejected | No | D1–33 | 0.23324 | |
| D1–24 | D1–24 vs. D35 | is not rejected | No | D1–34 | 0.22932 | |
| D1–24 | D1–24 vs. D36 | is rejected | Yes | D1–35 | 0.31752 | |
| D1–36 | D1–36 vs. D37 | is not rejected, by updating and | No | D1–36 | 0.19404 | |
| D1–36 | D1–36 vs. D38 | is not rejected | No | D1–37 | 0.2156 | |
| D1–36 | D1–36 vs. D39 | is not rejected | No | D1–38 | 0.2410 | |
| D1–36 | D1–36 vs. D40 | is not rejected | No | D1–39 | 0.2001 |
| Data | Interpretation | Data | Interpretation | ||
|---|---|---|---|---|---|
| E1–24 vs. D25 | 0.9% | very accurate | E1–24 vs. D33 | 9.8% | very accurate |
| E1–24 vs. D26 | 1.4% | very accurate | E1–24 vs. D34 | 8.8% | very accurate |
| E1–24 vs. D27 | 1.0% | very accurate | E1–24 vs. D35 | 7.8% | very accurate |
| E1–24 vs. D28 | 1.0% | very accurate | E1–36 vs. D37 | 4.3% | very accurate |
| E1–24 vs. D29 | 1.9% | very accurate | E1–36 vs. D38 | 3.2% | very accurate |
| E1–24 vs. D30 | 2.8% | very accurate | E1–36 vs. D39 | 2.2% | very accurate |
| E1–24 vs. D31 | 4.3% | very accurate | E1–36 vs. D40 | 2.8% | very accurate |
| E1–24 vs. D32 | 5.7% | very accurate |
| Yellow Zone | Gray Zone | ||||||||||
|---|---|---|---|---|---|---|---|---|---|---|---|
| Total time on initial strategy | Total time when ignoring is rejected | Total time on initial strategy | Total time when ignoring is rejected | ||||||||
| Vehicle 1 | Vehicle 2 | Vehicle 3 | Vehicle 1 | Vehicle 2 | Vehicle 3 | Vehicle 1 | Vehicle 2 | Vehicle 3 | Vehicle 1 | Vehicle 2 | Vehicle 3 |
| 86.42 min | 45.878 min | 58.751 min | 120.42 min | 170.3 min | 70.5 min | 73.448 min | 136.21 min | 152.18 min | 37.6 min | 50.9 min | 40.41 min |
| Green Zone | Purple Zone | ||||||||||
|---|---|---|---|---|---|---|---|---|---|---|---|
| Total time on initial strategy | Total time when ignoring is rejected | Total time on initial strategy | Total time when ignoring is rejected | ||||||||
| Vehicle 1 | Vehicle 2 | Vehicle 3 | Vehicle 1 | Vehicle 2 | Vehicle 3 | Vehicle 1 | Vehicle 2 | Vehicle 3 | Vehicle 1 | Vehicle 2 | Vehicle 3 |
| 56.518 min | 53.063 min | 58.6235 min | 154.6 min | 40.9 min | 40.87 min | 70.03 min | 46.302 min | 50.13 min | 98.1 min | 140.3 min | 145.7 min |
Publisher’s Note: MDPI stays neutral with regard to jurisdictional claims in published maps and institutional affiliations. |
© 2022 by the authors. Licensee MDPI, Basel, Switzerland. This article is an open access article distributed under the terms and conditions of the Creative Commons Attribution (CC BY) license (https://creativecommons.org/licenses/by/4.0/).
Share and Cite
Indratno, S.W.; Sari, K.N.; Yudhanegara, M.R. Optimization in Item Delivery as Risk Management: Multinomial Case Using the New Method of Statistical Inference for Online Decision. Risks 2022, 10, 122. https://doi.org/10.3390/risks10060122
Indratno SW, Sari KN, Yudhanegara MR. Optimization in Item Delivery as Risk Management: Multinomial Case Using the New Method of Statistical Inference for Online Decision. Risks. 2022; 10(6):122. https://doi.org/10.3390/risks10060122
Chicago/Turabian StyleIndratno, Sapto Wahyu, Kurnia Novita Sari, and Mokhammad Ridwan Yudhanegara. 2022. "Optimization in Item Delivery as Risk Management: Multinomial Case Using the New Method of Statistical Inference for Online Decision" Risks 10, no. 6: 122. https://doi.org/10.3390/risks10060122
APA StyleIndratno, S. W., Sari, K. N., & Yudhanegara, M. R. (2022). Optimization in Item Delivery as Risk Management: Multinomial Case Using the New Method of Statistical Inference for Online Decision. Risks, 10(6), 122. https://doi.org/10.3390/risks10060122