
Stock Indices Breakdown during the Pandemic as the Most Dynamic Bear Market in History: Consequences for Individual Investors


Abstract
:1. Introduction
- The panic of 1907—the Bankers Panic/Knickerbocker Crisis (Tucker 2008),
- The 1929 crash followed by the Great Depression (Encyclopedia Britannica n.d.),
- The Flash Crash of 1962 (Zweig 2010) also called Kennedy Slide,
- The 1973 bear market (Duggan 2017),
- Black Monday 1987 (Semmens 1988),
- The early 1990s recession (Alcorn 2019),
- The 1998 Russian recession (Aris 2018),
- The 2000 dot-com bubble (International Banker 2021),
- The 2007/8 world financial crisis (Lazette 2017).
2. Methodology
- DJIA from 1896,
- S&P 500 from 1957,
- DAX from 1987,
- Nasdaq Composite from 1971,
- CAC40 from 1987,
- FTSE100 from 1984,
- NIKKEI from 1949.
- Maximum drawdown (maxDD)—the greatest price movement from the top to the subsequent bottom of the bear market; this is presented in index points as well as in the percentage decrease referenced to the value of the top; maxDD is a kind of worst-case scenario that could be experienced by investors;
- Recovery in days—the time from the last top before the bear market began to the point where the price achieved or even exceeded the initial top (i.e., achieving a new top); the longer the recovery period, the higher the probability of investors escaping from the market;
- Number of days from top to maxDD (“top-to-bottom”)—this represents the nominal speed of the bear market in days;
- Number of days from maxDD to the new top (“bottom-to-top”)—this represents the speed of recovery;
- Down vs. recovery ratio in days—this represents the relation between the speed of the bear market (top-to-bottom) and the whole recovery time; the smaller the ratio, the higher the dynamics of the bear market compared to the time of recovery;
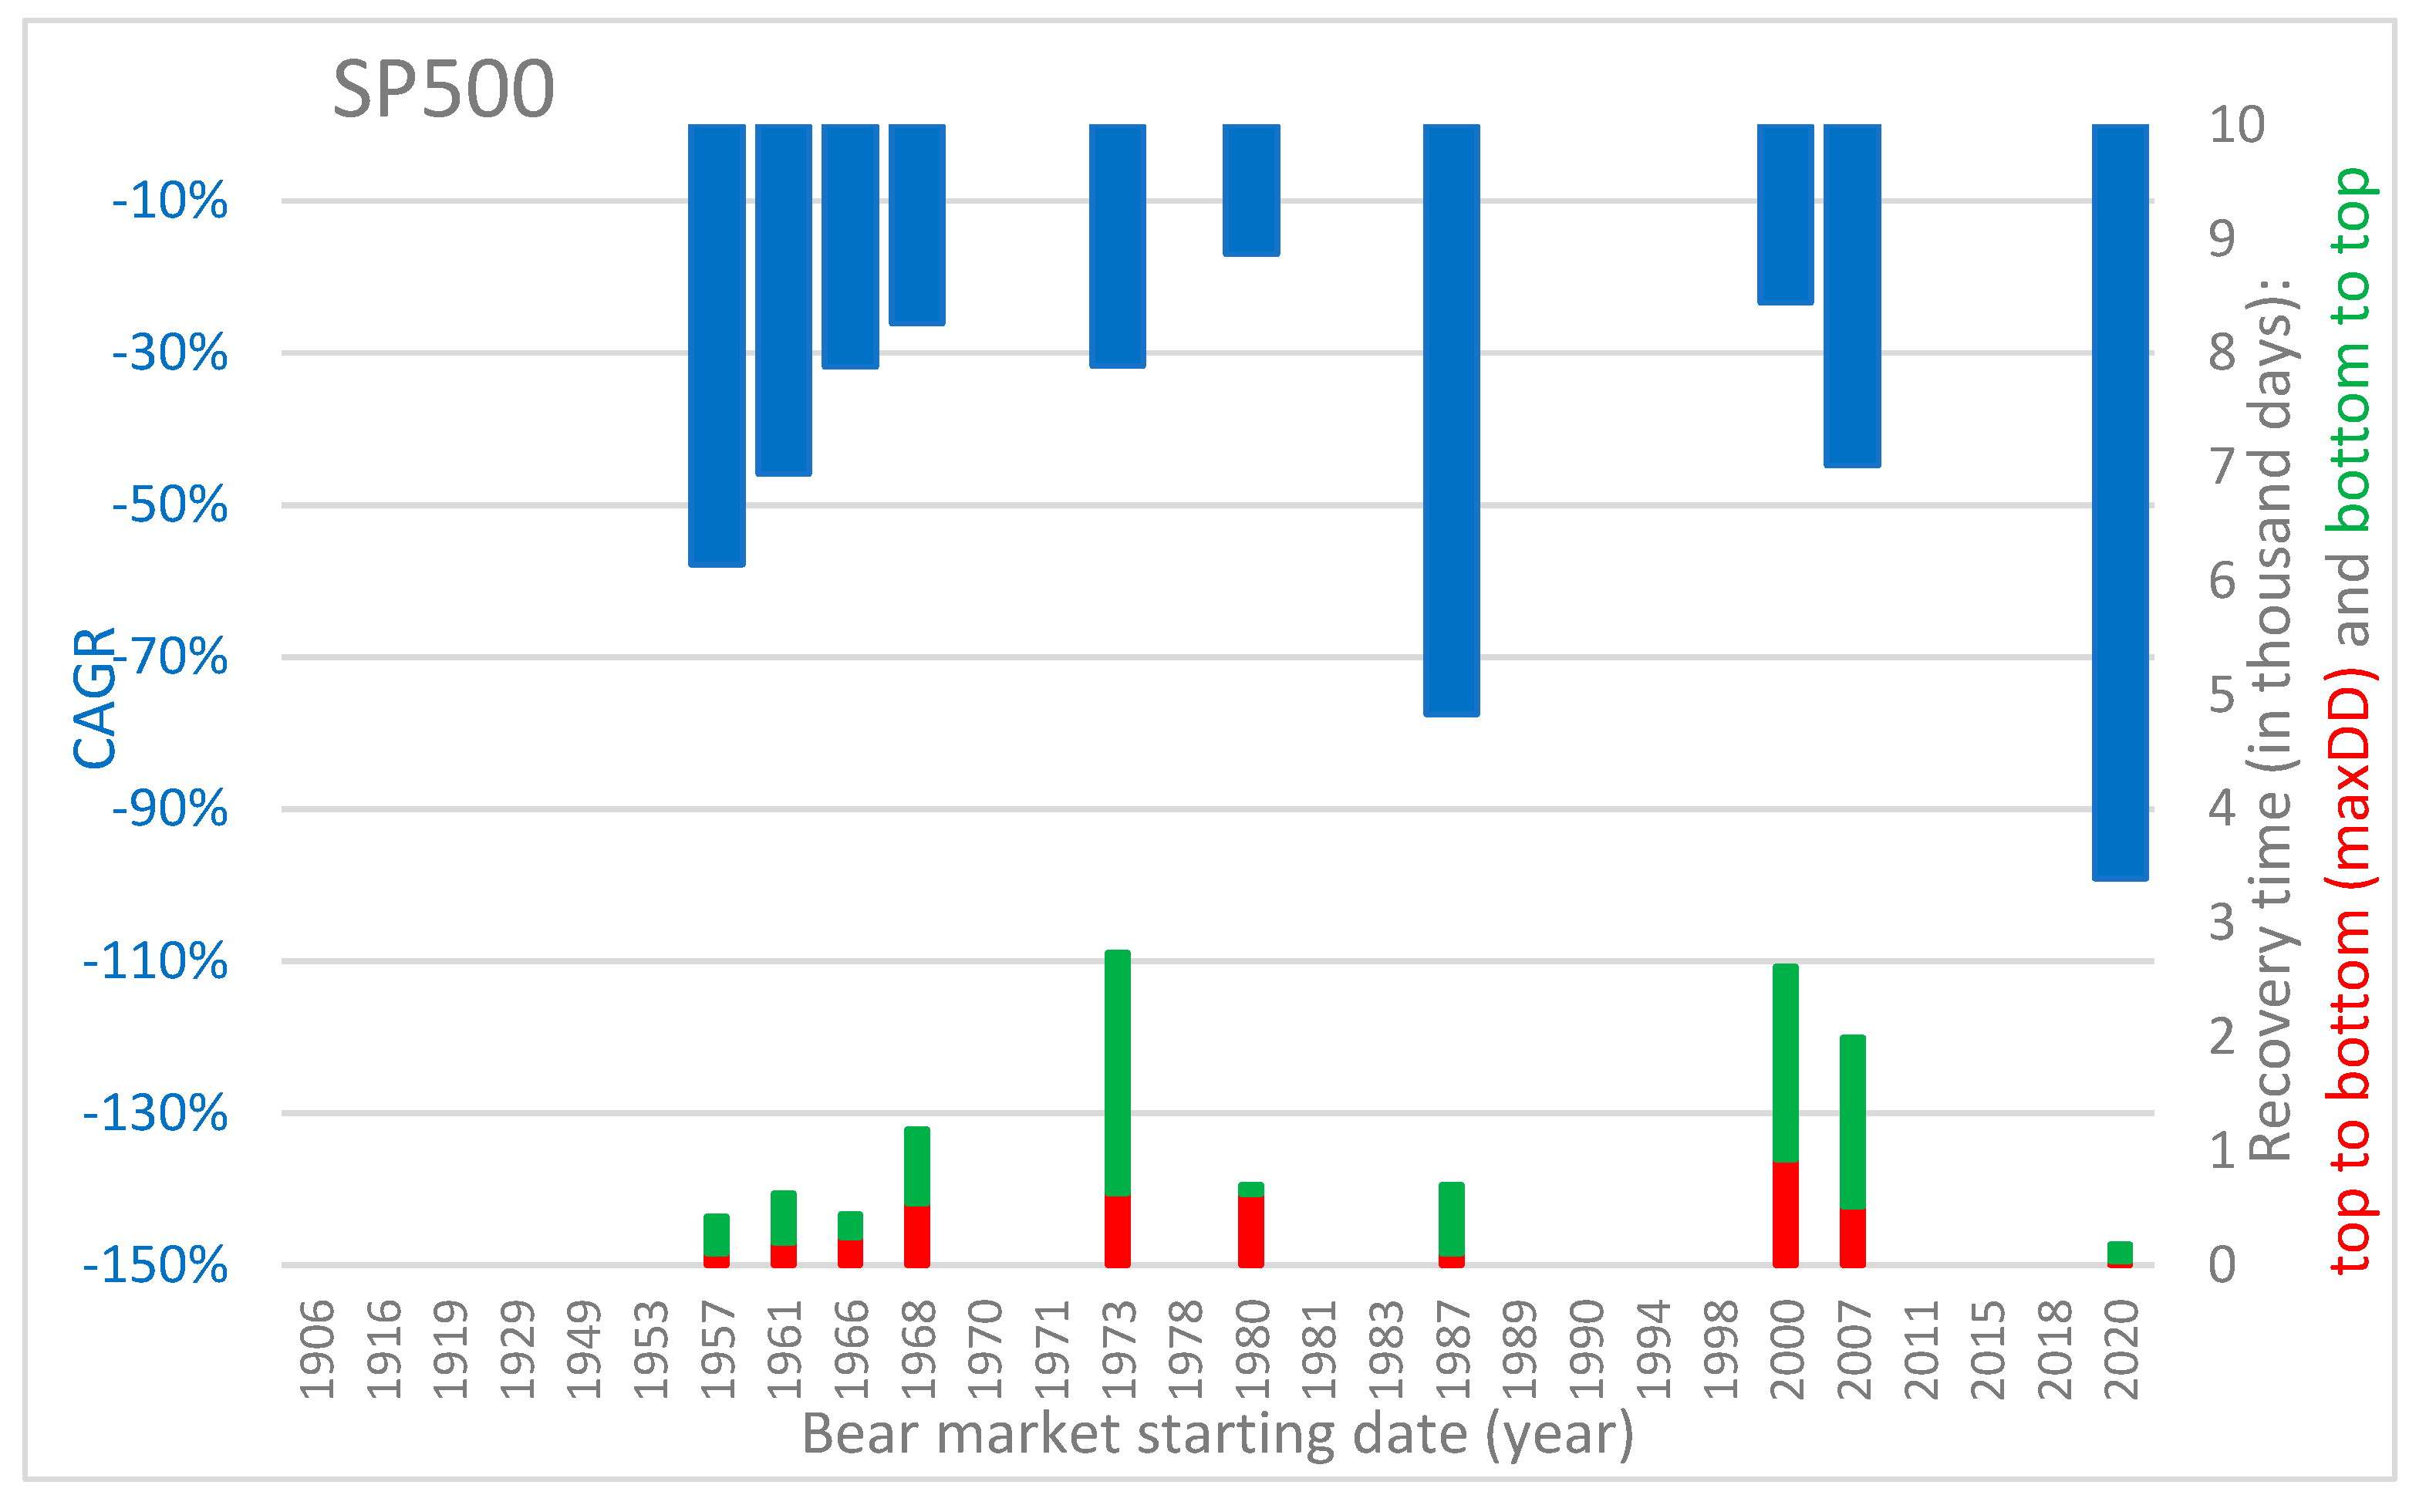
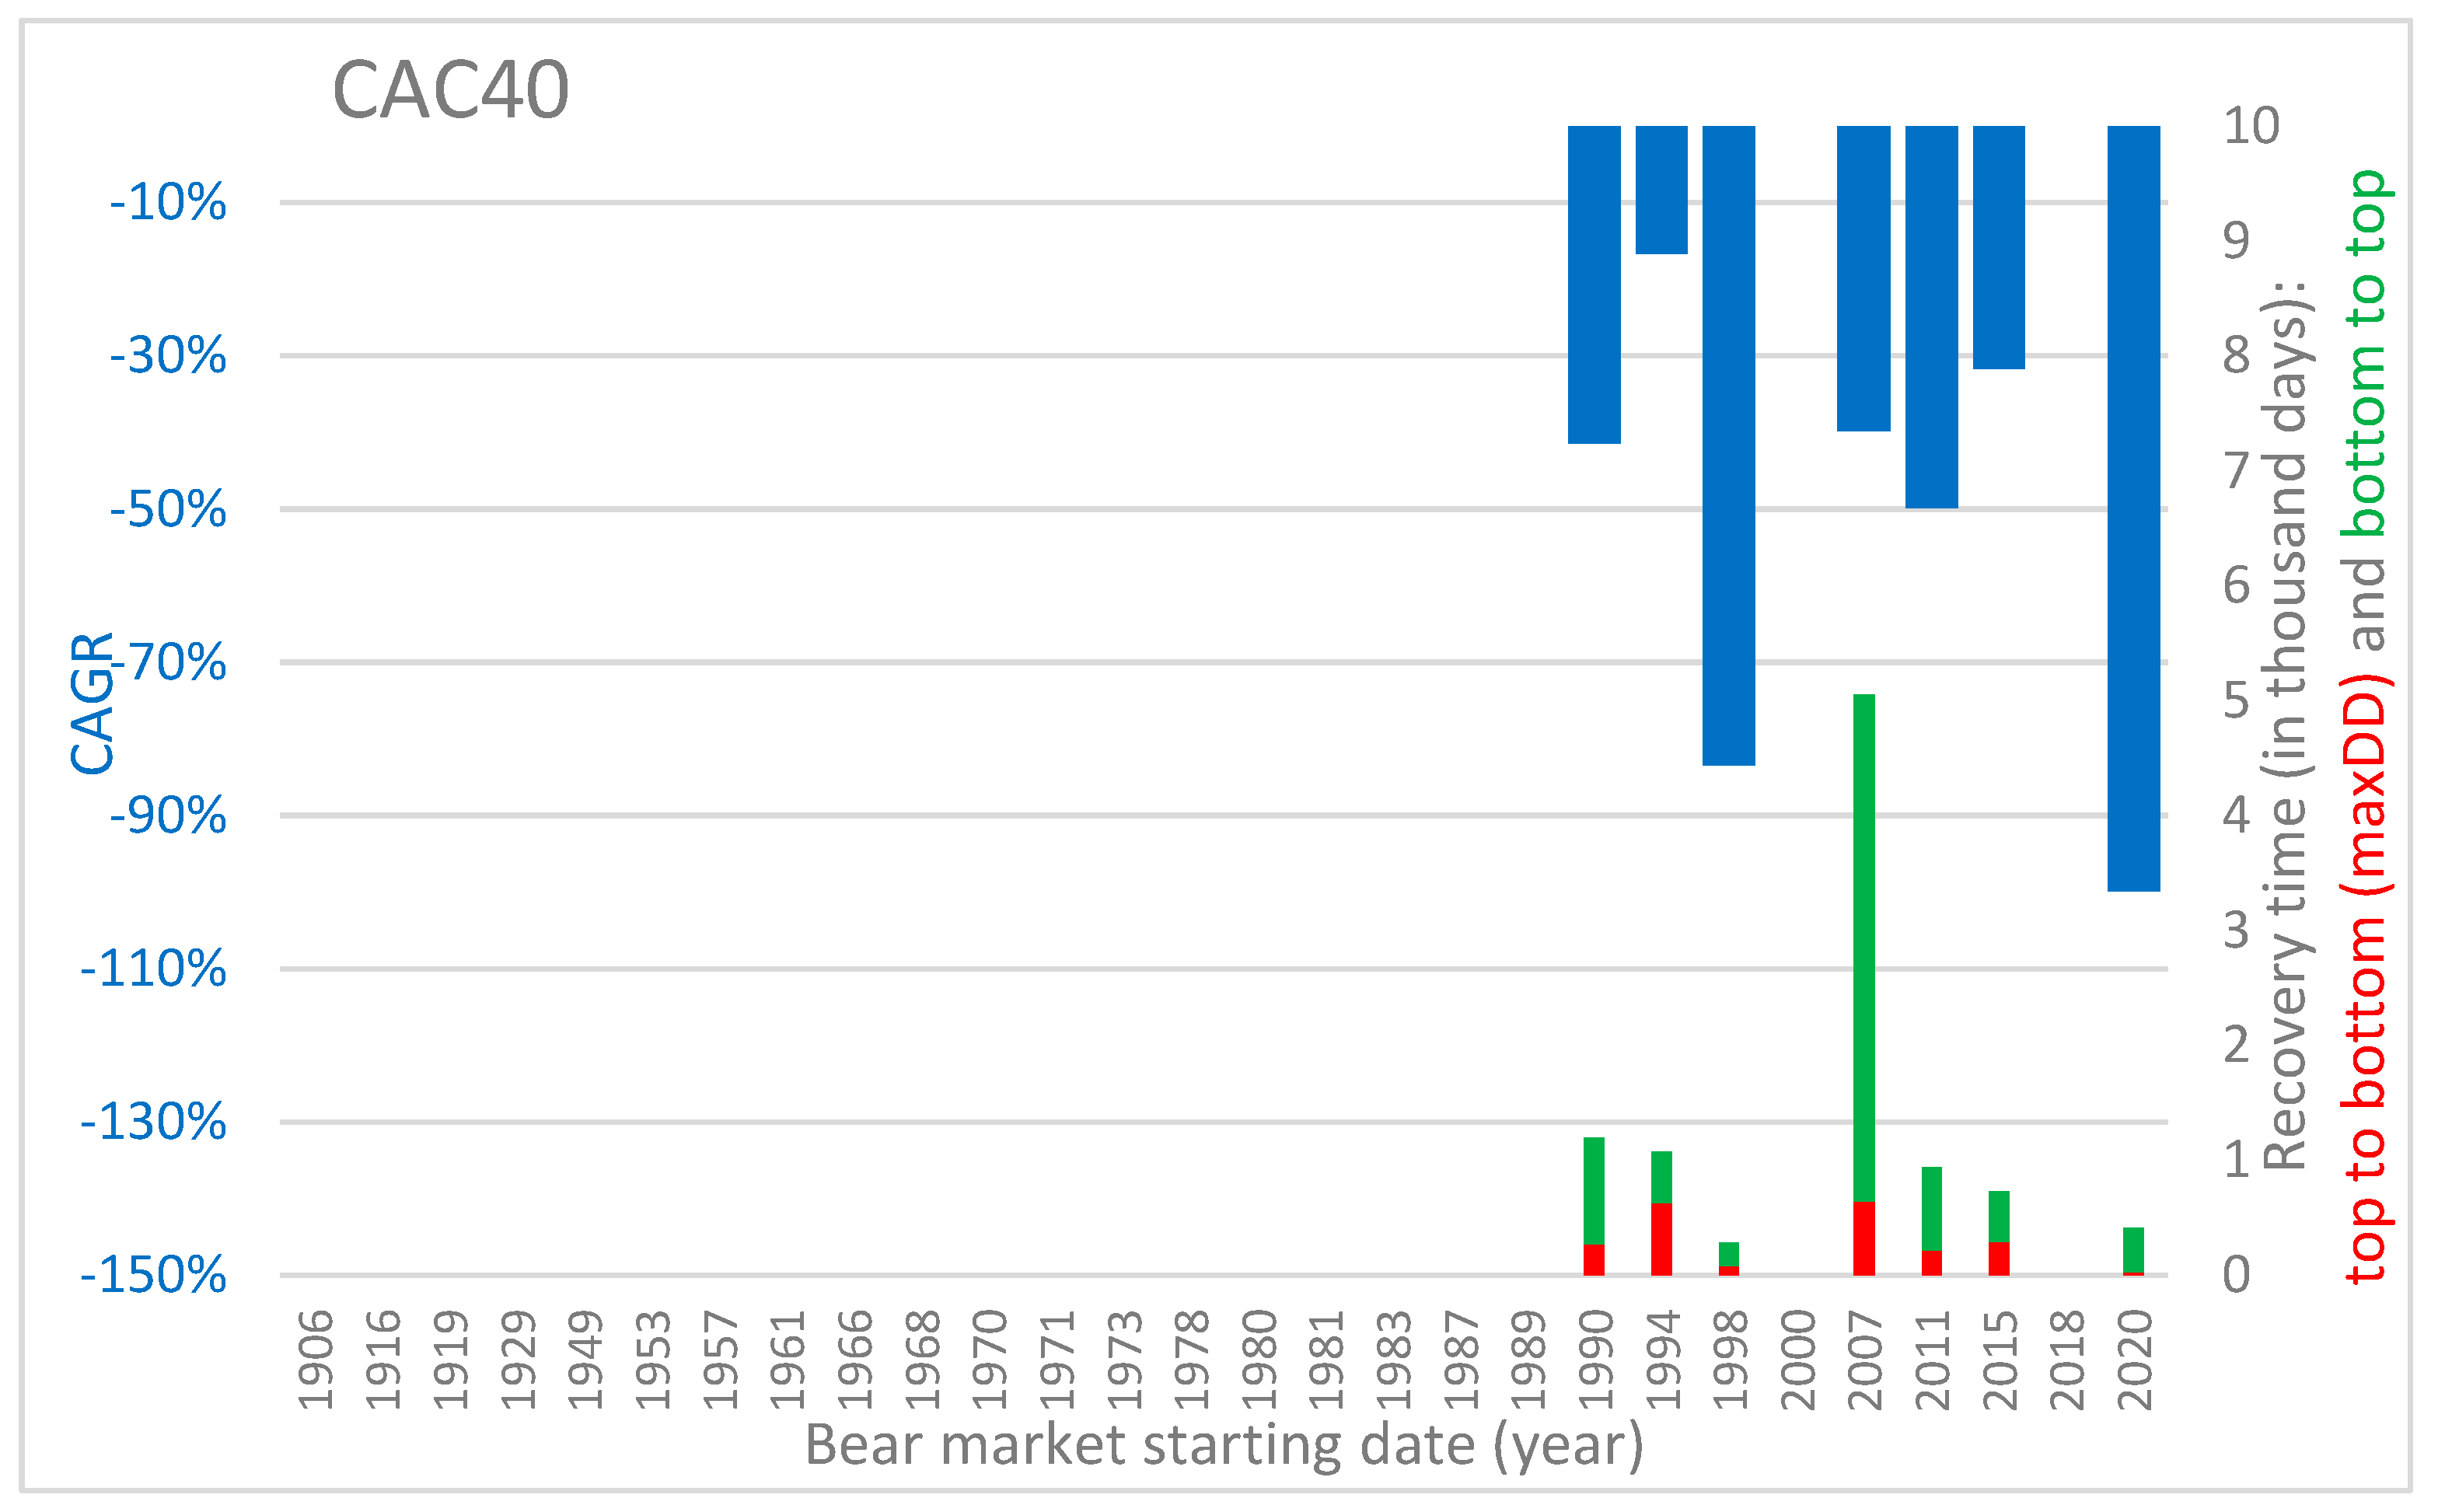
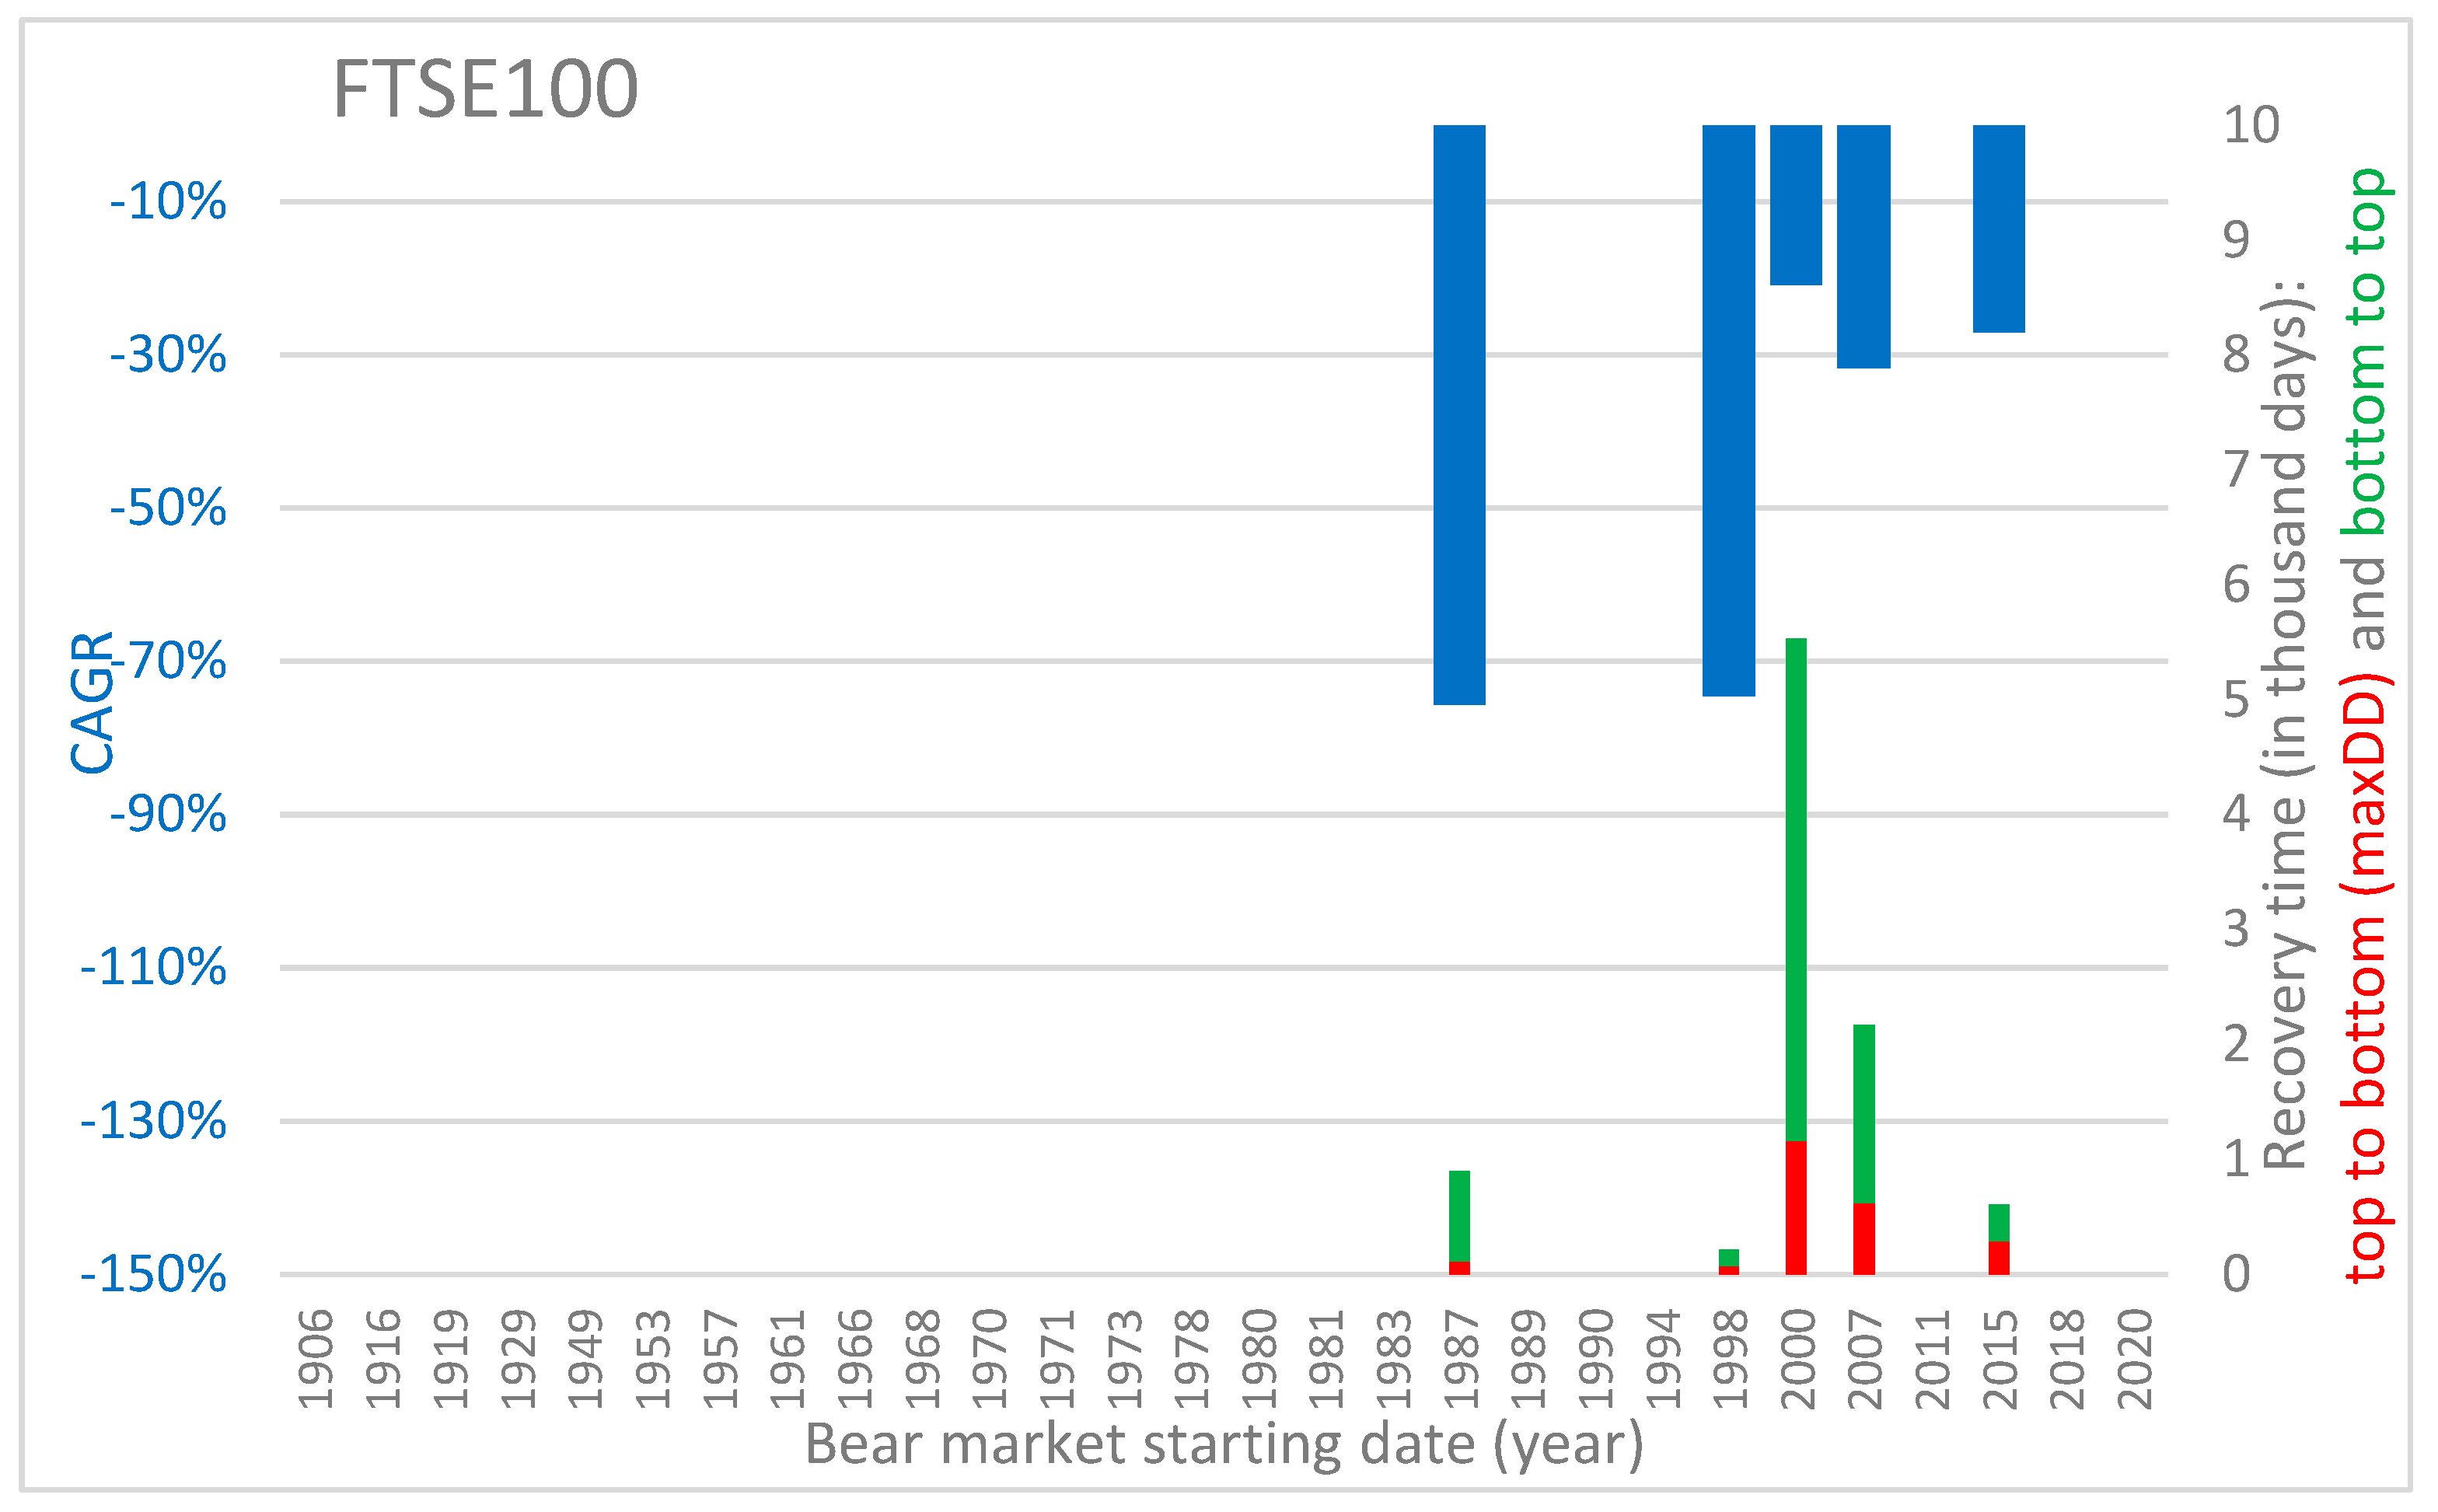
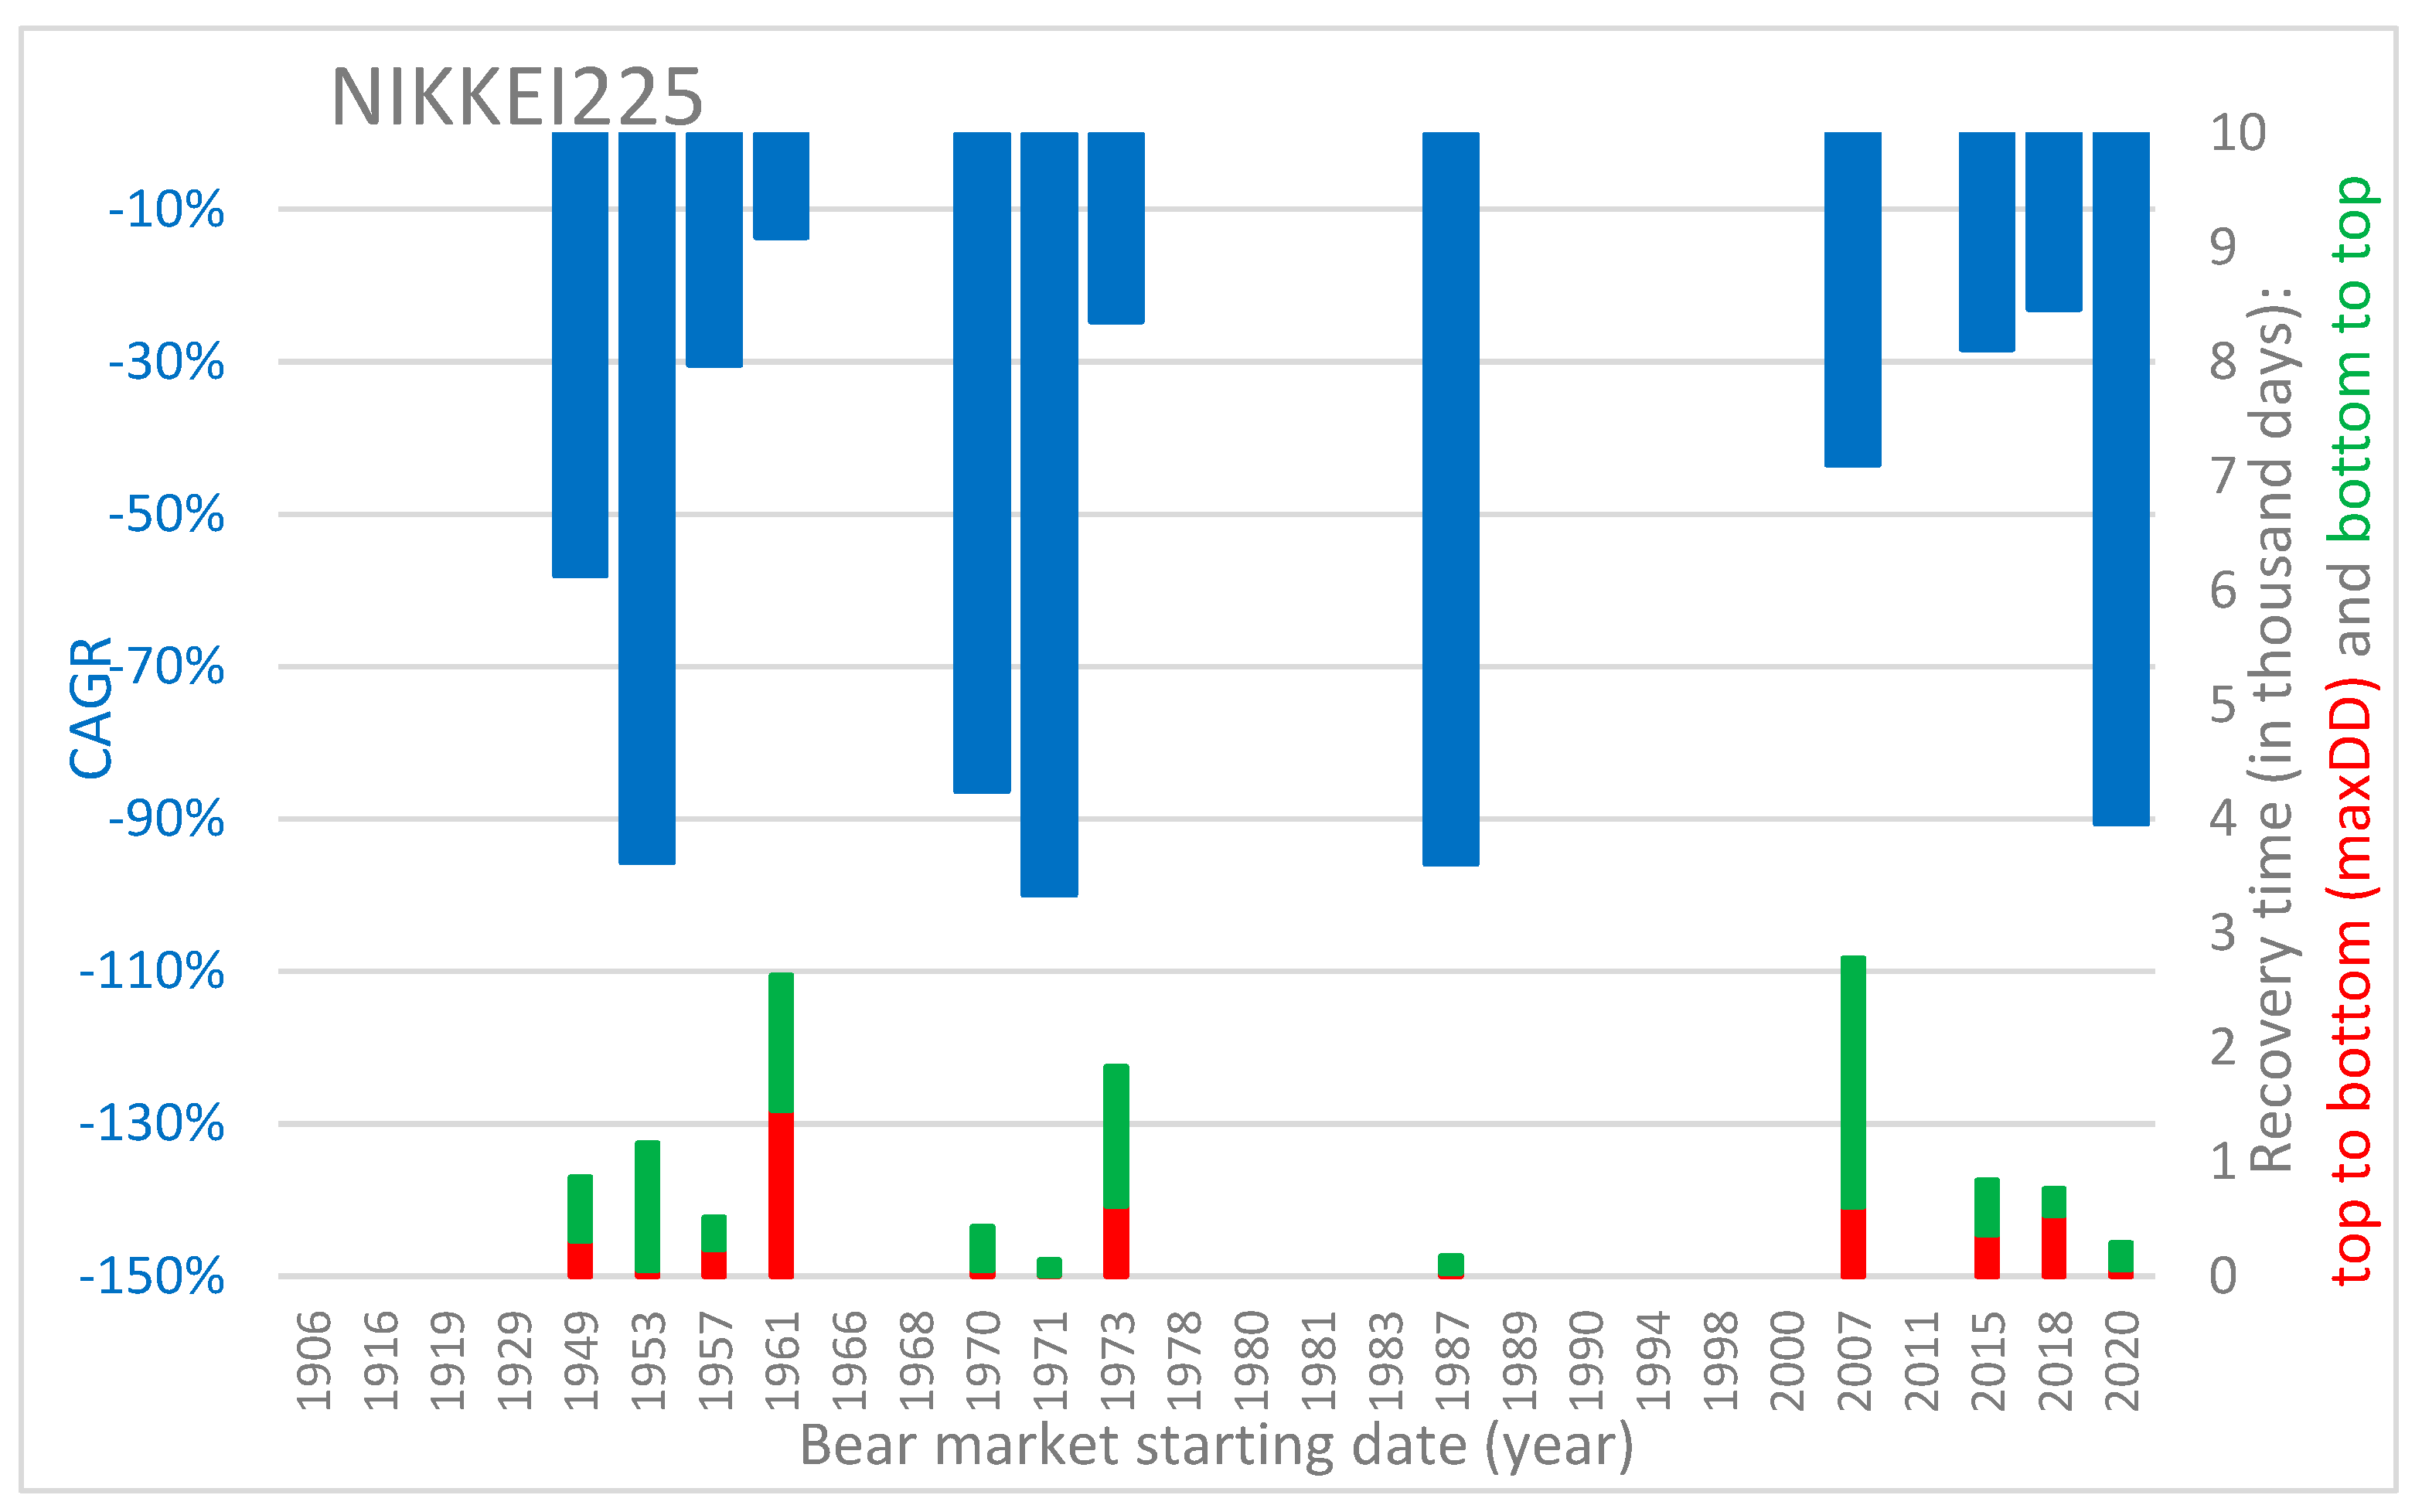
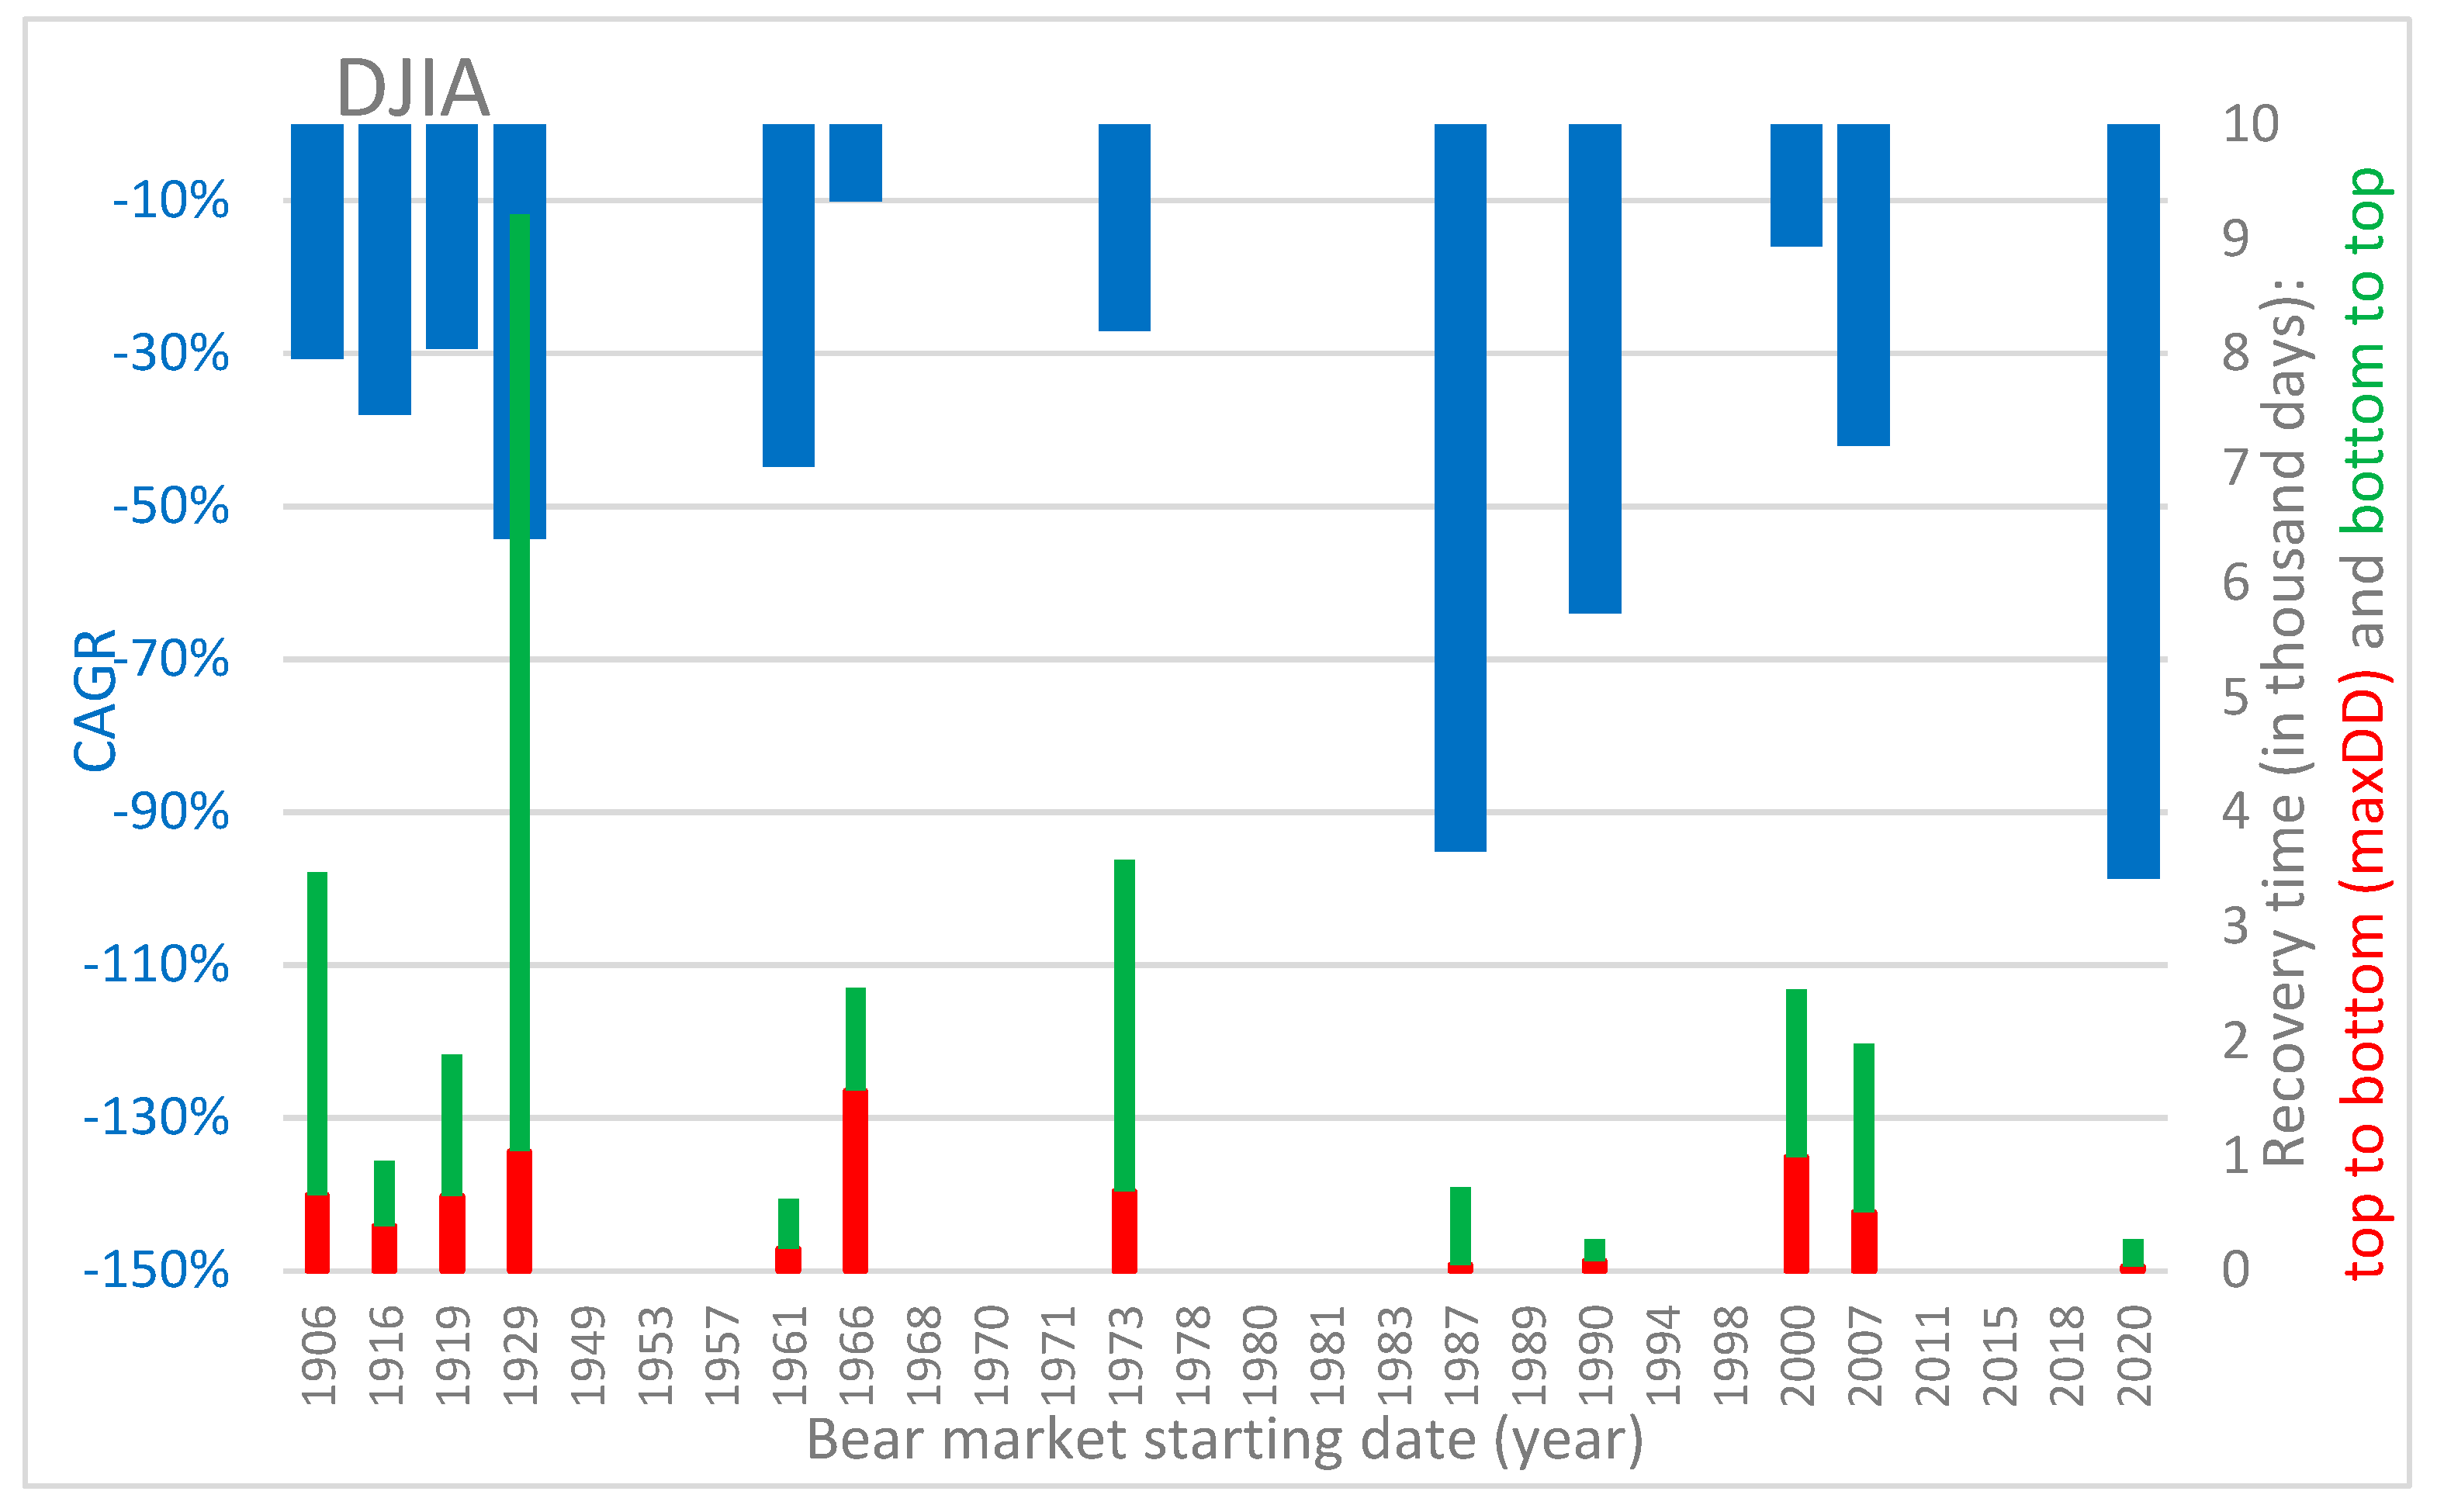
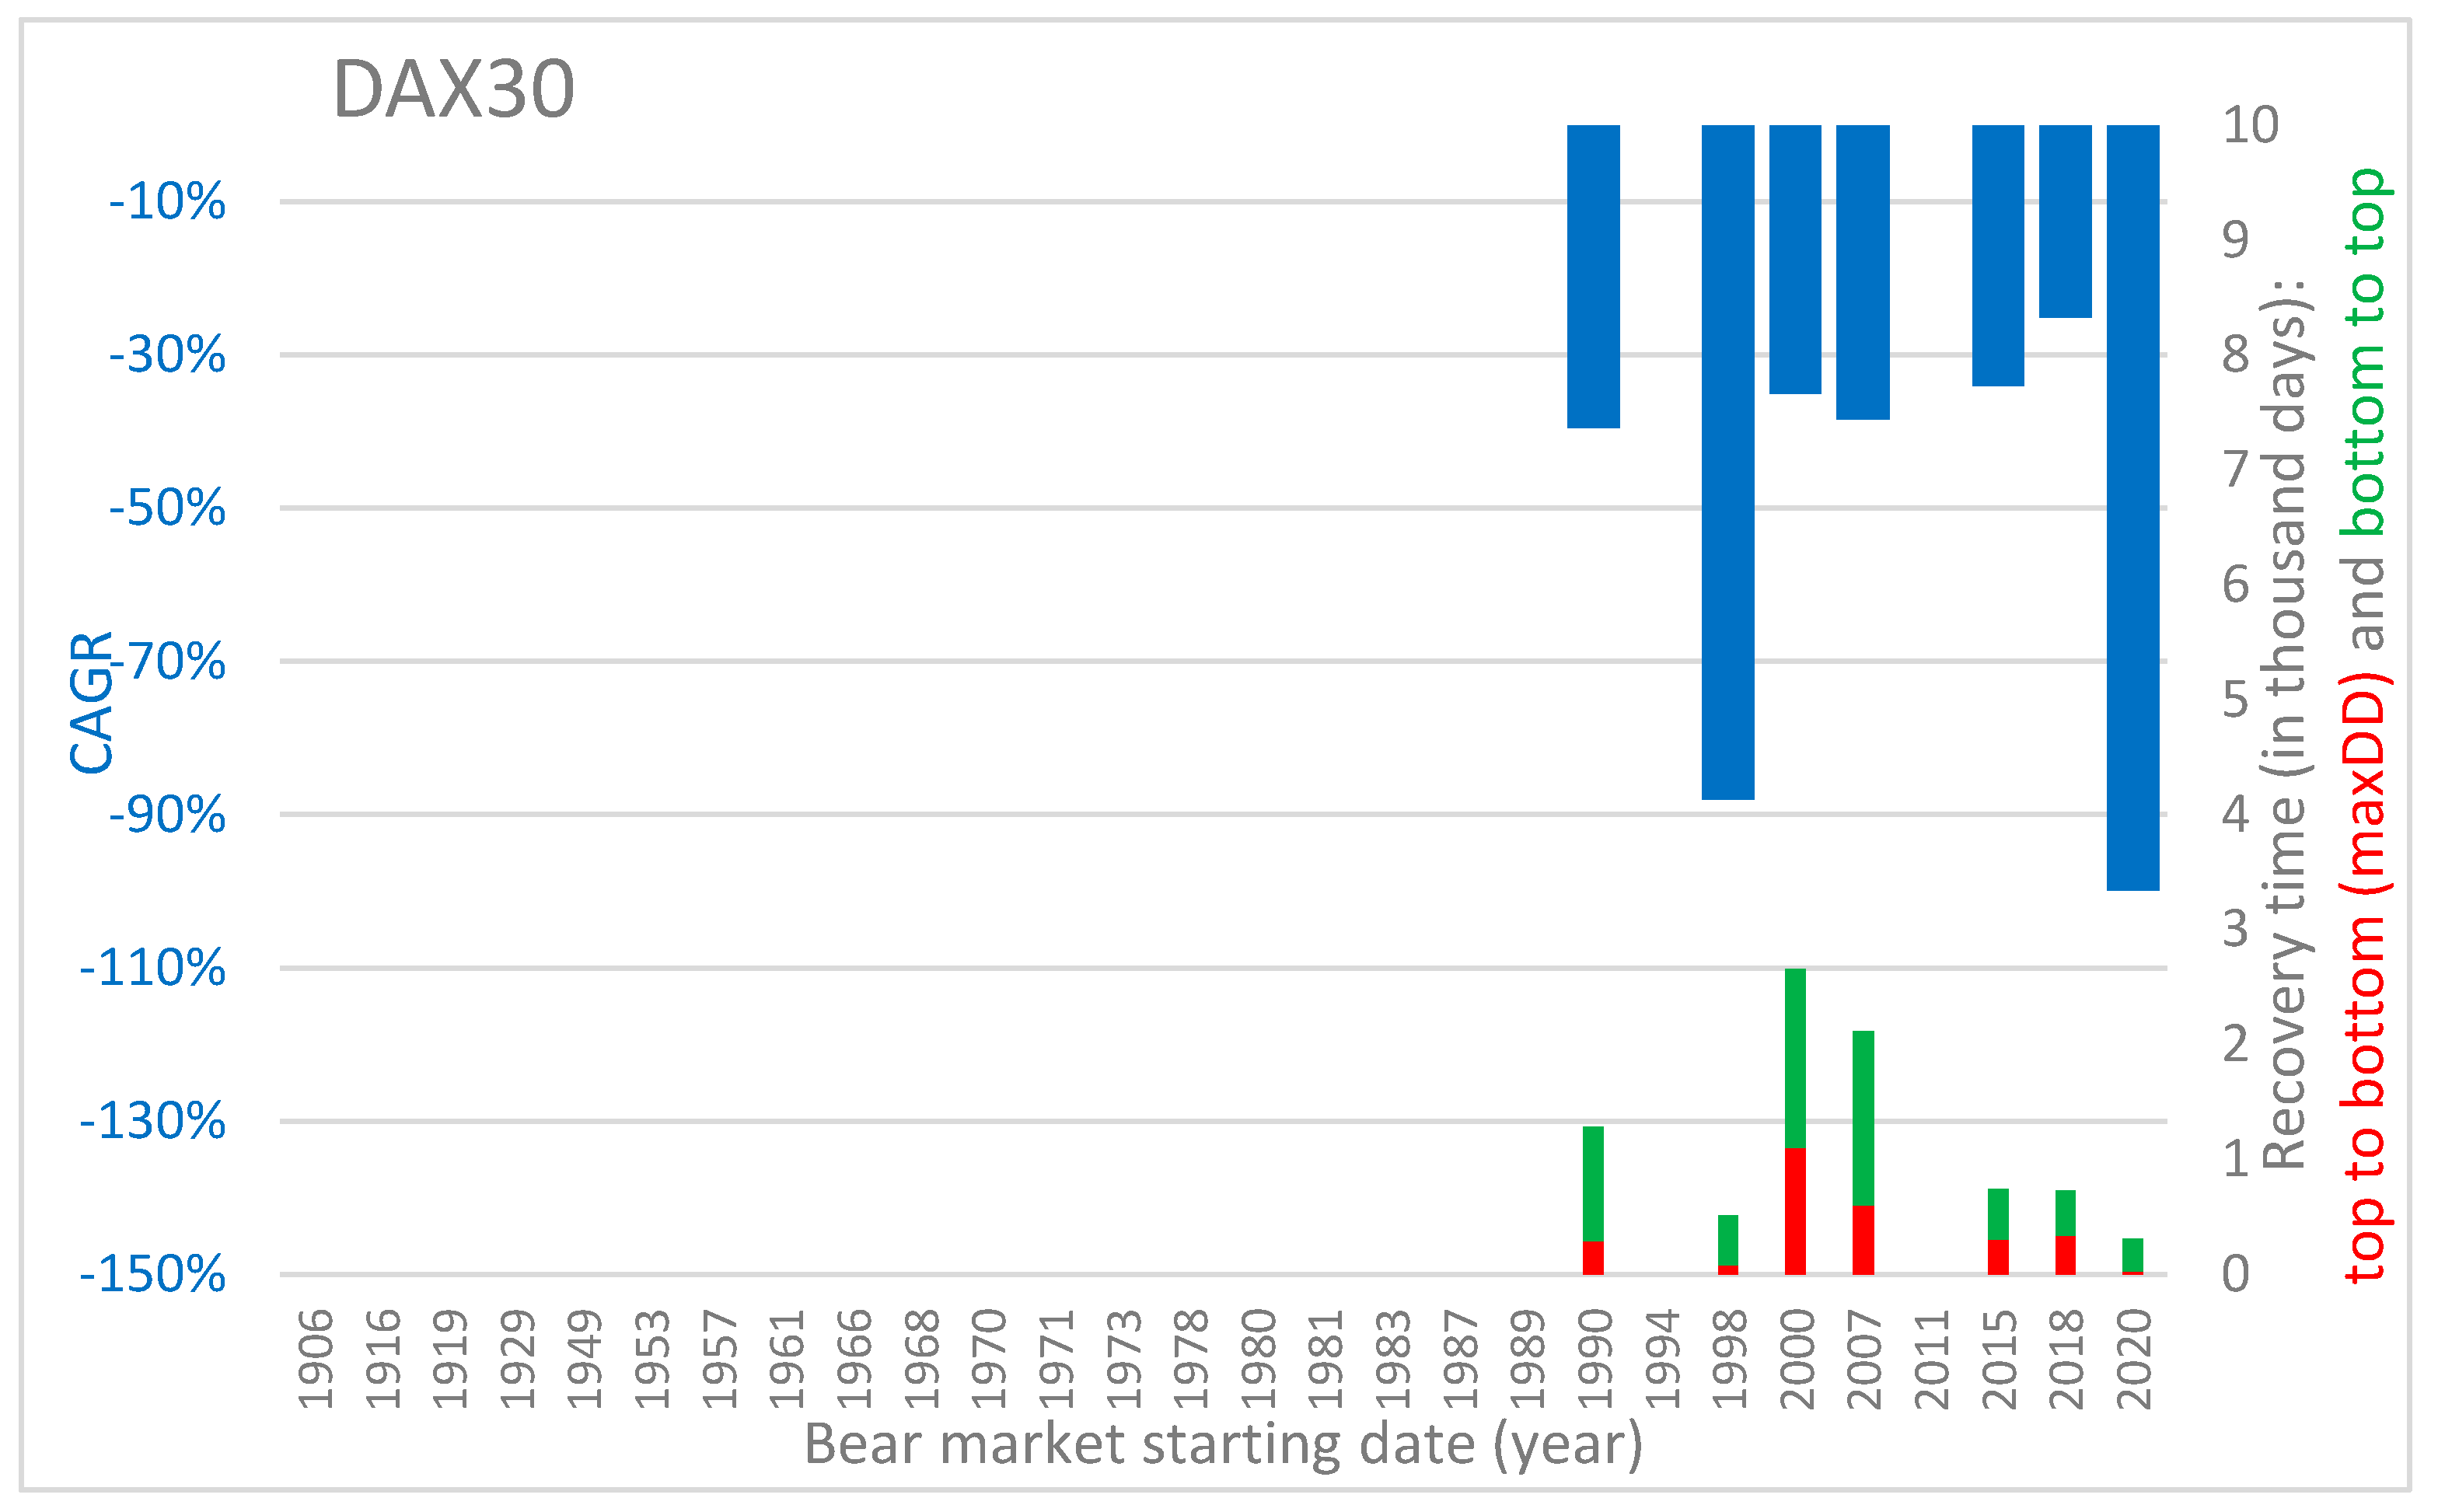
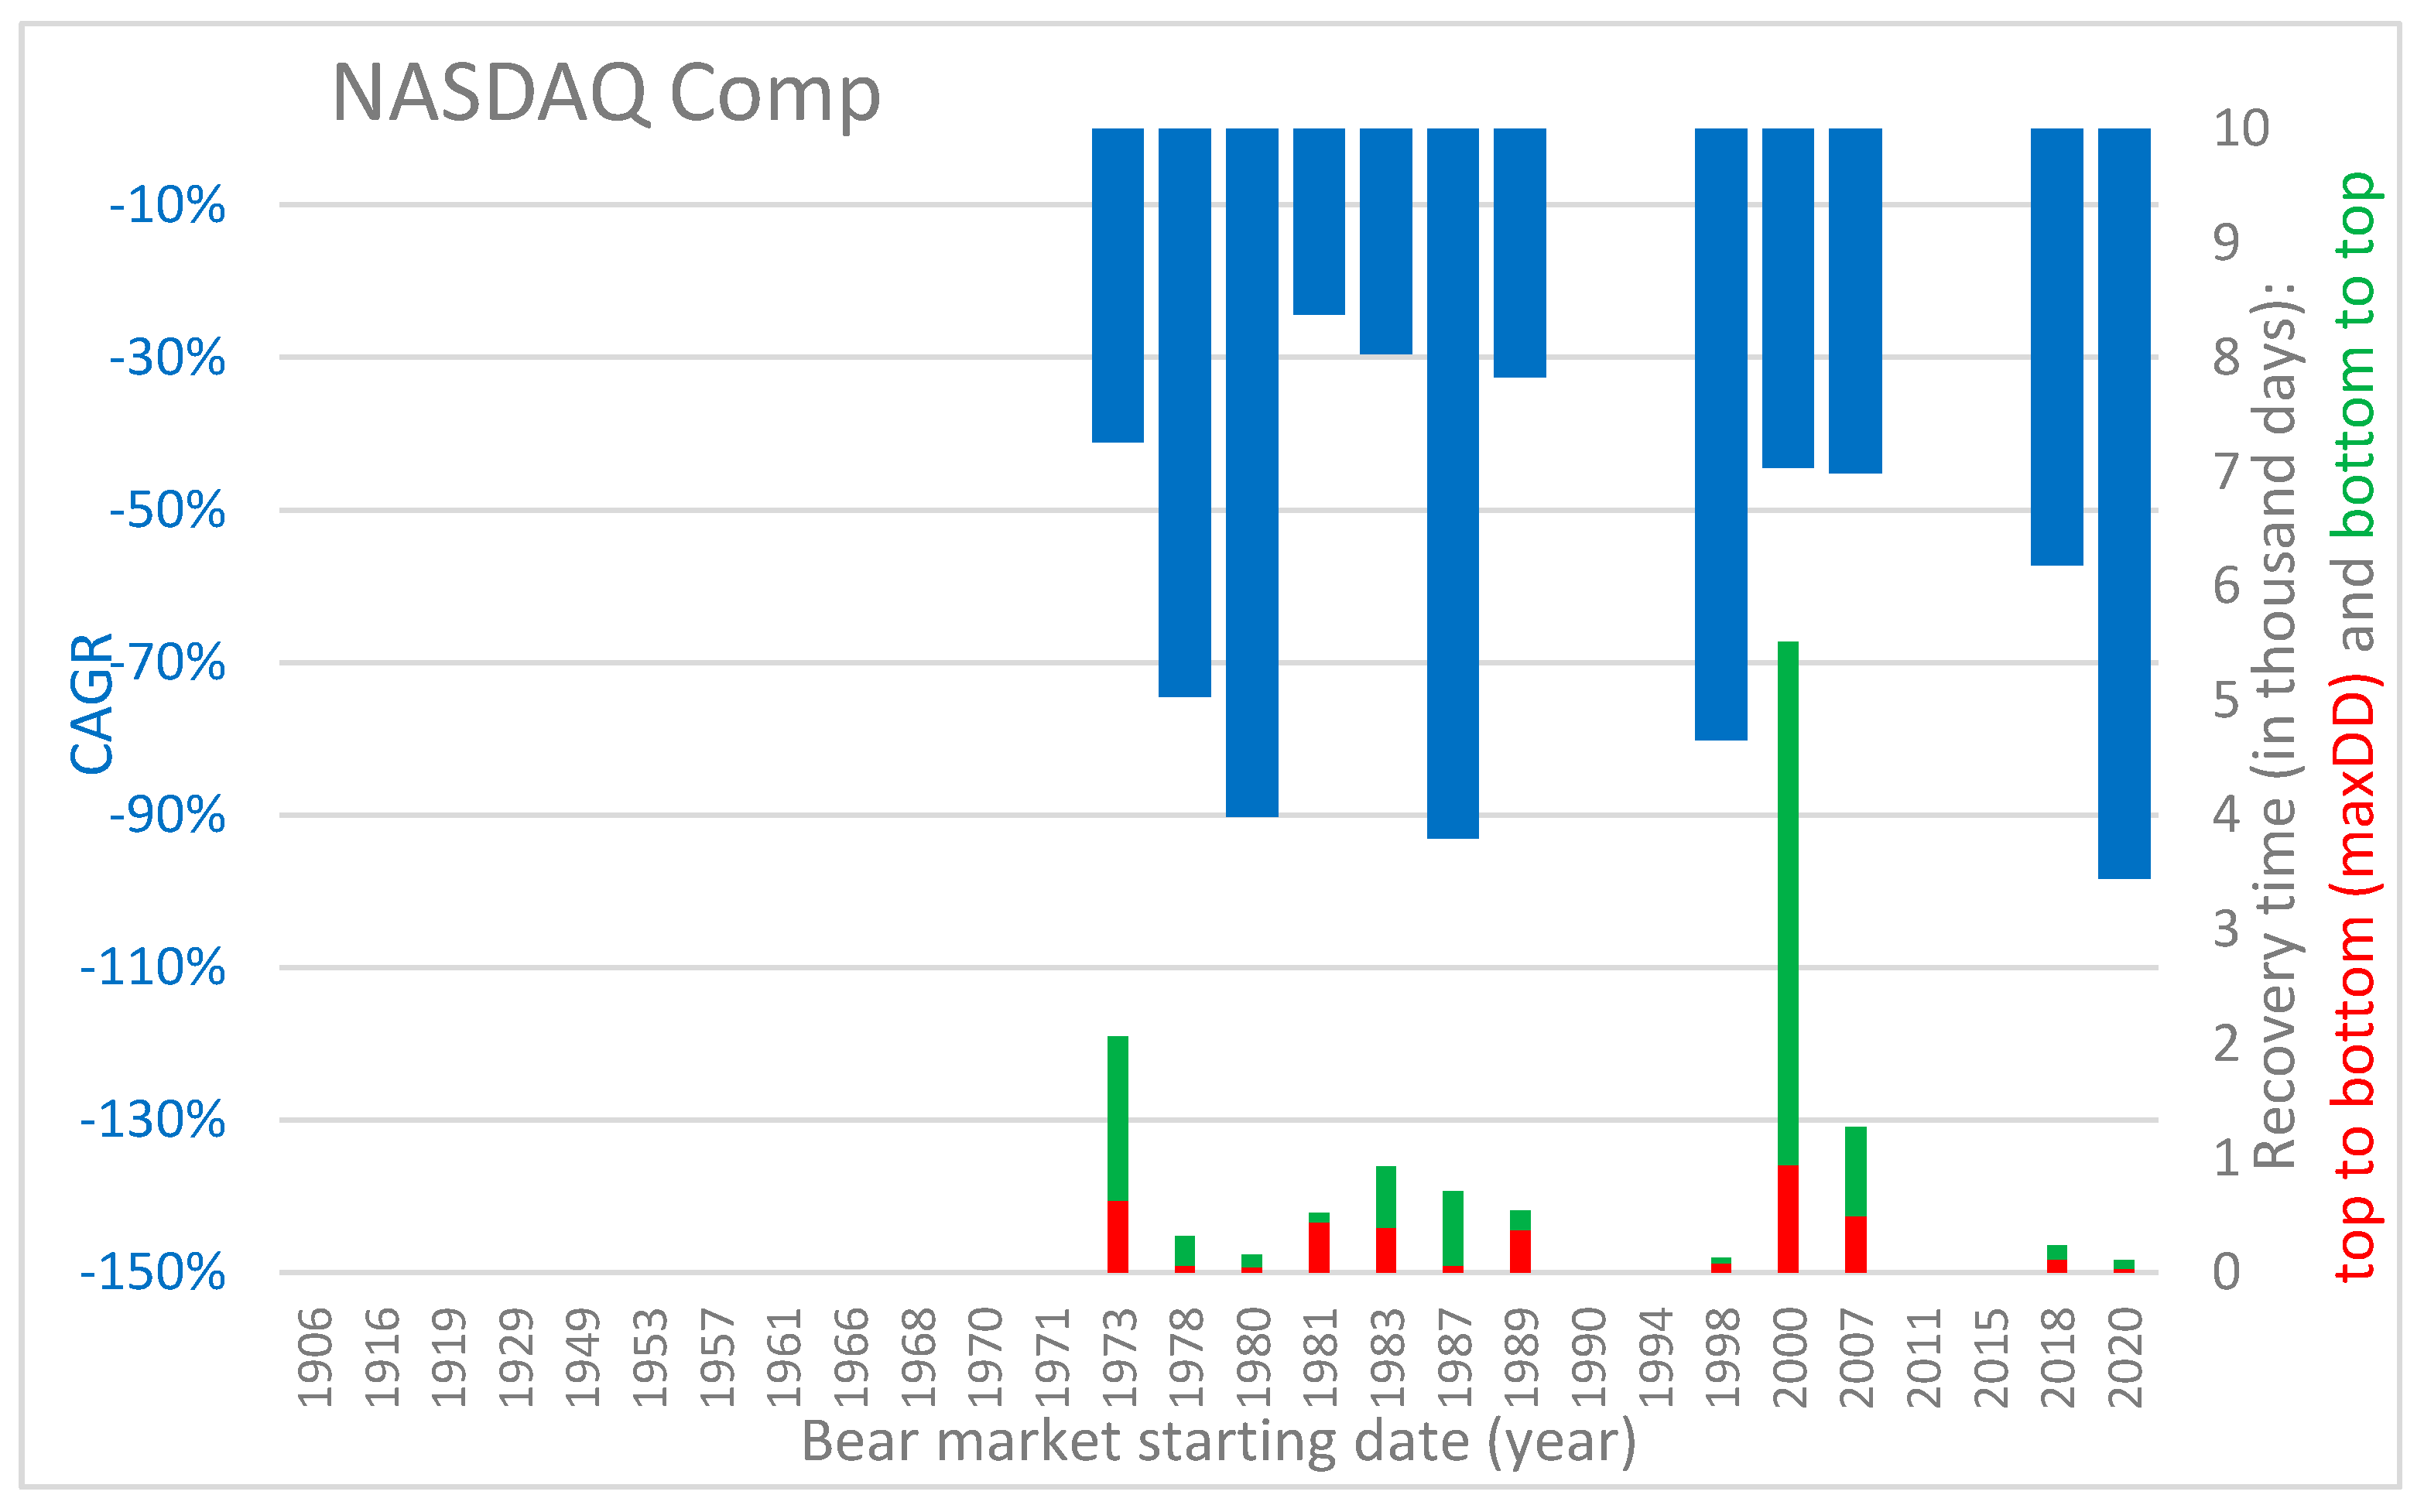
- MaxDD %/top-to-bottom ratio represented by CAGR (Compound Annual Growth Rate)—this represents the speed and the dynamics of the bear market, the higher the value, the faster and stronger the behavior of the downtrend; normalization through the use of CAGR allows for comparison with every other bear market period; the simplicity of CAGR interpretation makes it useful for individual investors and is easy to implement in their trading strategies; CAGR is presented in colors representing the ‘heat’ of the value—from green for low values, through yellow and orange for mid-range values, to red for the highest values;
- The charts visualizing the CAGR (%) and the time of recovery (in thousands of days) divided into top-to-bottom period and bottom-to-top (new-top) period (the same scale for x-axis and y-axis is used on every chart for better comparison purposes).
3. Results
4. Conclusions
5. Discussion
6. Implications
Funding
Data Availability Statement
Conflicts of Interest
References
- Abuzayed, Bana, Bouri Elie, Al-Fayoumi Nedal, and Jalkh Naji. 2021. Systemic risk spillover across global and country stock markets during the COVID-19 pandemic. Economic Analysis and Policy 71: 180–97. [Google Scholar] [CrossRef]
- Akhtaruzzaman, Md, Sabri Boubaker, and Ahmet Sensoy. 2021. Financial contagion during COVID-19 crisis. Finance Research Letters 38: 101604. [Google Scholar] [CrossRef] [PubMed]
- Alcorn, G. 2019. Remembering the Recession: ‘The 1990s Experience Changed My View of the World’. The Guardian. November 16. Available online: https://www.theguardian.com/business/2019/nov/17/remembering-the-recession-the-1990s-experience-changed-my-view-of-the-world (accessed on 1 November 2021).
- Alqaralleh, Huthaifa, and Alessandra Canepa. 2021. Evidence of Stock Market Contagion during the COVID-19 Pandemic: A Wavelet-Copula-GARCH Approach. Journal of Risk and Financial Management 14: 329. [Google Scholar] [CrossRef]
- Alshubiri, Faris, Syed Ahsan Jamil, and Mohamed Elheddad. 2019. The impact of ICT on financial development: Empirical evidence from the Gulf Cooperation Council countries. International Journal of Engineering Business Management 11: 1847979019870670. [Google Scholar] [CrossRef] [Green Version]
- Aris, Ben. 2018. Remembering Russia’s 1998 Financial Crisis (Op-ed). The Moscow Times. August 22. Available online: https://www.themoscowtimes.com/2018/08/22/remembering-russias-1998-financial-crash-op-ed-a62595 (accessed on 1 November 2021).
- Bates, A. 2020. Investor Behavior in the Midst of a Global Pandemic. In Honors Projects. Allendale: Grand Valley State University, Available online: https://scholarworks.gvsu.edu/honorsprojects/800 (accessed on 1 November 2021).
- Duggan, Wayne. 2017. On This Day In Market History: The 1974 Bear Market Bottom. December 6. Available online: https://finance.yahoo.com/news/day-market-history-1974-bear-145444464.html (accessed on 1 November 2021).
- Encyclopedia Britannica, ed. n.d. Stock Market Crash of 1929|Summary, Causes, & Facts. Chicago: Encyclopedia Britannica, Available online: https://www.britannica.com/event/stock-market-crash-of-1929 (accessed on 28 October 2021).
- Frazer, Steven. 2020. What is a reasonable return to expect from investing? Shares Magazine. March 26. Available online: https://www.sharesmagazine.co.uk/article/what-is-a-reasonable-return-to-expect-from-investing (accessed on 1 November 2021).
- Greenwood, Robin, and Andrei Shleifer. 2014. Expectations of Returns and Expected Returns. The Review of Financial Studies 27: 714–46. [Google Scholar] [CrossRef] [Green Version]
- Hollifield, Burton, Patrik Sandås, and Andrew Todd. 2017. Latency Arbitrage When Markets Become Faster. SSRN Scholarly Paper ID 2996990. Rochester: Social Science Research Network. [Google Scholar] [CrossRef] [Green Version]
- International Banker. 2021. The Dotcom Bubble Burst (2000). International Banker. September 29. Available online: https://internationalbanker.com/history-of-financial-crises/the-dotcom-bubble-burst-2000/ (accessed on 1 November 2021).
- Lazette, Michelle Park. 2017. The Crisis, the Fallout, the Change: A Great Recession Retrospective from the Cleveland Fed. Cleveland: Federal Reserve Bank of Cleveland, Available online: https://www.clevelandfed.org/newsroom-and-events/multimedia-storytelling/recession-retrospective.aspx (accessed on 1 November 2021).
- Liivamägi, Kristjan. 2016. Investor education and trading activity on the stock market. Baltic Journal of Economics 16: 114–31. [Google Scholar] [CrossRef] [Green Version]
- O’Hara, Maureen. 2014. High-Frequency Trading and Its Impact on Markets. Financial Analysts Journal 70: 18–27. [Google Scholar] [CrossRef]
- Ortmann, Regina, Matthias Pelster, and Sascha Tobias Wengerek. 2020. COVID-19 and investor behavior. Finance Research Letters 37: 101717. [Google Scholar] [CrossRef] [PubMed]
- Qamruzzaman, Md, and Jianguo Wei. 2019. Do financial inclusion, stock market development attract foreign capital flows in developing economy: A panel data investigation. Quantitative Finance and Economics 3: 88–108. [Google Scholar] [CrossRef]
- Schramm, Michael. 2020. Investing Terms for Turbulent Times. Chicago: Morningstar, Inc., March 24, Available online: https://www.morningstar.com/articles/973381/investing-terms-for-turbulent-times (accessed on 1 November 2021).
- Semmens, John. 1988. The Crash of 1987: An Excuse for Government Intervention? June 1. Available online: https://fee.org/articles/the-crash-of-1987-an-excuse-for-government-intervention/ (accessed on 1 November 2021).
- Singh, Tamara. 2021. Retail Participation in Capital Markets Soars. OMFIF. April 1. Available online: https://www.omfif.org/2021/04/retail-participation-in-capital-markets-soars/ (accessed on 1 November 2021).
- Tucker, Abigail. 2008. The Financial Panic of 1907: Running from History. Smithsonian Magazine. October 9. Available online: https://www.smithsonianmag.com/history/the-financial-panic-of-1907-running-from-history-82176328/ (accessed on 1 November 2021).
- Zweig, Jason. 2010. Back to the Future: Lessons from the Forgotten ‘Flash Crash’ of 1962. The Wall Street Journal. Available online: https://www.wsj.com/articles/SB10001424052748703957604575272791511469272 (accessed on 1 November 2021).


| Index | Bear Market | MaxDD | #Days Down/Up | Recovery | CAGR | |
|---|---|---|---|---|---|---|
| From (Date) | (Points) | Day of MaxDD (Date) | Top-to-Bottom (#Days) | (#Days) | (maxDD. Top-to-Bottom) | |
| To (Date) | (%) | Lowest Index Value (Points) | Bottom-to-Top (#Days) | Down vs. Recovery Ratio (%) | ||
| SP500 | 1957-07-16 | 10.2p. | 1957-10-22 | 98 | 427 | −57.79% |
| 1958-09-16 | 20.7% | 39 | 329 | 23.0% | ||
| 1961-12-13 | 20.3p. | 1962-06-26 | 195 | 629 | −45.92% | |
| 1963-09-03 | 28.0% | 52.3 | 434 | 31.0% | ||
| 1966-02-10 | 20.9p. | 1966-10-07 | 239 | 448 | −31.83% | |
| 1967-05-04 | 22.2% | 73.2 | 209 | 53.3% | ||
| 1968-12-02 | 39.1p. | 1970-05-26 | 540 | 1190 | −26.10% | |
| 1972-03-06 | 36.1% | 69.3 | 650 | 45.4% | ||
| 1973-01-12 | 58.0p. | 1974-10-03 | 629 | 2743 | −31.75% | |
| 1980-07-17 | 48.2% | 62.3 | 2114 | 22.9% | ||
| 1980-12-01 | 38.1p. | 1982-08-12 | 619 | 702 | −17.02% | |
| 1982-11-03 | 27.1% | 102.4 | 83 | 88.2% | ||
| 1987-08-26 | 112.9p. | 1987-12-04 | 100 | 700 | −77.48% | |
| 1989-07-26 | 33.5% | 223.9 | 600 | 14.3% | ||
| 2000-03-27 | 750.7p. | 2002-10-09 | 926 | 2620 | −23.41% | |
| 2007-05-30 | 49.1% | 776.8 | 1694 | 35.3% | ||
| 2007-10-10 | 888.6p. | 2009-03-09 | 516 | 1996 | −44.77% | |
| 2013-03-28 | 56.8% | 676.5 | 1480 | 25.9% | ||
| 2020-02-20 | 1148.8p. | 2020-03-23 | 32 | 180 | −99.12% | |
| 2020-08-18 | 33.9% | 2237.4 | 148 | 17.8% |
| Index | Bear Market | MaxDD | #Days Down/Up | Recovery | CAGR | |
|---|---|---|---|---|---|---|
| From (Date) | (Points) | Day of MaxDD (Date) | Top-to-Bottom (#days) | (#days) | (MaxDD. Top-to-Bottom) | |
| To (Date) | (%) | Lowest Index Value (Points) | Bottom-to-Top (#Days) | Down vs. Recovery Ratio (%) | ||
| DJIA | 1906-01-22 | 36.2p. | 1907-11-15 | 662 | 3472 | −30.69% |
| 1915-07-26 | 48.50% | 38.4 | 2810 | 19.10% | ||
| 1916-11-22 | 44.2p. | 1917-12-19 | 392 | 959 | −37.99% | |
| 1919-07-09 | 40.10% | 66 | 567 | 40.90% | ||
| 1919-11-05 | 55.7p. | 1921-08-24 | 658 | 1883 | −29.39% | |
| 1924-12-31 | 46.60% | 63.9 | 1225 | 34.90% | ||
| 1929-09-04 | 340.0p. | 1932-07-08 | 1038 | 9211 | −54.29% | |
| 1954-11-23 | 89.20% | 41.2 | 8173 | 11.30% | ||
| 1961-12-14 | 199.1p. | 1962-06-26 | 194 | 630 | −44.84% | |
| 1963-09-05 | 27.10% | 535.8 | 436 | 30.80% | ||
| 1966-02-10 | 364.0p. | 1970-05-26 | 1566 | 2465 | −10.08% | |
| 1972-11-10 | 36.60% | 631.2 | 899 | 63.50% | ||
| 1973-01-12 | 474.1p. | 1974-12-06 | 693 | 3582 | −27.08% | |
| 1982-11-03 | 45.10% | 577.6 | 2889 | 19.30% | ||
| 1987-08-26 | 983.7p. | 1987-10-19 | 54 | 729 | −95.18% | |
| 1989-08-24 | 36.10% | 1738.7 | 675 | 7.40% | ||
| 1990-07-18 | 634.7p. | 1990-10-11 | 85 | 273 | −64.00% | |
| 1991-04-17 | 21.20% | 2365.1 | 188 | 31.10% | ||
| 2000-01-18 | 4436.7p. | 2002-10-09 | 995 | 2450 | −16.02% | |
| 2006-10-03 | 37.80% | 7286.3 | 1455 | 40.60% | ||
| 2007-10-10 | 7617.5p. | 2009-03-09 | 516 | 1973 | −42.09% | |
| 2013-03-05 | 53.80% | 6547.1 | 1457 | 26.20% | ||
| 2020-02-13 | 10959.5p. | 2020-03-23 | 39 | 277 | −98.70% | |
| 2020-11-16 | 37.10% | 18591.9 | 238 | 14.10% |
| Index | Bear Market | MaxDD | #Days Down/Up | Recovery | CAGR | |
|---|---|---|---|---|---|---|
| From (Date) | (Points) | Day of MaxDD (Date) | Top-to-Bottom (#Days) | (#Days) | (maxDD. Top-to-Bottom) | |
| To (Date) | (%) | Lowest Index Value (Points) | Bottom-to-Top (#Days) | Down vs. Recovery Ratio (%) | ||
| DAX30 | 1990-04-02 | 645.9p. | 1991-01-16 | 289 | 1282 | −39.50% |
| 1993-10-05 | 32.8% | 1322.7 | 993 | 22.5% | ||
| 1998-07-21 | 2275.4p. | 1998-10-08 | 79 | 511 | −88.08% | |
| 1999-12-14 | 36.9% | 3896.1 | 432 | 15.5% | ||
| 2000-03-08 | 5862.0p. | 2003-03-12 | 1099 | 2660 | −35.03% | |
| 2007-06-20 | 72.7% | 2203 | 1561 | 41.3% | ||
| 2007-07-17 | 4439.3p. | 2009-03-06 | 598 | 2117 | −38.40% | |
| 2013-05-03 | 54.8% | 3666.4 | 1519 | 28.2% | ||
| 2015-04-13 | 3621.9p. | 2016-02-11 | 304 | 742 | −34.03% | |
| 2017-04-24 | 29.3% | 8752.9 | 438 | 41.0% | ||
| 2018-01-24 | 3178.1p. | 2018-12-27 | 337 | 730 | −25.13% | |
| 2020-01-24 | 23.4% | 10381.5 | 393 | 46.2% | ||
| 2020-02-20 | 5347.3p. | 2020-03-18 | 27 | 312 | −99.87% | |
| 2020-12-28 | 38.8% | 8441.7 | 285 | 8.7% |
| Index | Bear Market | MaxDD | #Days Down/Up | Recovery | CAGR | |
|---|---|---|---|---|---|---|
| From (Date) | (points) | Day of MaxDD (Date) | Top-to-Bottom (#Days) | (#Days) | (maxDD. Top-to-Bottom) | |
| To (Date) | (%) | Lowest Index Value (Points) | Bottom-to-Top (#Days) | Down vs. Recovery Ratio (%) | ||
| NASDAQ Composite | 1973-01-12 | 81.9p. | 1974-10-03 | 629 | 2064 | −41.15% |
| 1978-09-07 | 59.9% | 54.9 | 1435 | 30.5% | ||
| 1978-09-14 | 28.4p. | 1978-11-14 | 61 | 315 | −74.47% | |
| 1979-07-26 | 20.4% | 110.9 | 254 | 19.4% | ||
| 1980-02-11 | 41.2p. | 1980-03-27 | 45 | 154 | −90.24% | |
| 1980-07-14 | 24.9% | 124.1 | 109 | 29.2% | ||
| 1981-06-01 | 63.8p. | 1982-08-13 | 438 | 521 | −24.44% | |
| 1982-11-04 | 28.5% | 159.7 | 83 | 84.1% | ||
| 1983-06-27 | 103.6p. | 1984-07-25 | 394 | 925 | −29.58% | |
| 1986-01-07 | 31.5% | 225.3 | 531 | 42.6% | ||
| 1987-08-28 | 163.9p. | 1987-10-28 | 61 | 706 | −93.06% | |
| 1989-08-03 | 36.0% | 291.9 | 645 | 8.6% | ||
| 1989-10-10 | 160.3p. | 1990-10-16 | 371 | 539 | −32.59% | |
| 1991-04-02 | 33.0% | 325.4 | 168 | 68.8% | ||
| 1998-07-21 | 595.1p. | 1998-10-08 | 79 | 129 | −80.19% | |
| 1998-11-27 | 29.5% | 1419.1 | 50 | 61.2% | ||
| 2000-03-13 | 3934.5p. | 2002-10-09 | 940 | 5519 | −44.41% | |
| 2015-04-23 | 77.9% | 1114.1 | 4579 | 17.0% | ||
| “inner-trend” | 2007-11-01 | 1590.5p. | 2009-03-09 | 494 | 1273 | −45.16% |
| 2011-04-27 | 55.6% | 1268.6 | 779 | 38.8% | ||
| NASDAQ Composite | 2018-08-30 | 1916.8p. | 2018-12-24 | 116 | 236 | −57.22% |
| 2019-04-23 | 23.6% | 6192.9 | 120 | 49.2% | ||
| 2020-02-20 | 2956.5p. | 2020-03-23 | 32 | 109 | −98.33% | |
| 2020-06-08 | 30.1% | 6860.7 | 77 | 29.4% |
| Index | Bear Market | MaxDD | #Days Down/Up | Recovery | CAGR | |
|---|---|---|---|---|---|---|
| From (Date) | (Points) | Day of MaxDD (Date) | Top-to-Bottom (#Days) | (#days) | (maxDD. Top-to-Bottom) | |
| To (Date) | (%) | Lowest Index Value (Points) | Bottom-to-Top (#Days) | Down vs. Recovery Ratio (%) | ||
| CAC40 | 1990-04-23 | 688.0p. | 1991-01-14 | 266 | 1197 | −41.49% |
| 1993-08-02 | 32.3% | 1441 | 931 | 22.2% | ||
| 1994-02-03 | 634.8p. | 1995-10-23 | 627 | 1075 | −16.71% | |
| 1997-01-13 | 26.9% | 1721.1 | 448 | 58.3% | ||
| 1998-07-20 | 1428.5p. | 1998-10-08 | 80 | 281 | −83.44% | |
| 1999-04-27 | 32.6% | 2960 | 201 | 28.5% | ||
| CAC40 dot-com bubble | not recovered | |||||
| CAC40 “inner-trend” | 2007-06-04 | 3648.9p. | 2009-03-09 | 644 | 5058 | −39.82% |
| 2021-04-09 | 59.2% | 2519.3 | 4414 | 12.7% | ||
| CAC40 “inner-trend after 2009” | 2011-02-21 | 1375.5p. | 2011-09-22 | 213 | 940 | −49.79% |
| 2013-09-18 | 33.1% | 2781.7 | 727 | 22.7% | ||
| 2015-04-28 | 1372.2p. | 2016-02-11 | 289 | 728 | −31.70% | |
| 2017-04-25 | 26.0% | 3896.7 | 439 | 39.7% | ||
| 2020-02-20 | 2356.4p. | 2020-03-18 | 27 | 411 | −99.86% | |
| 2021-04-06 | 38.6% | 3754.8 | 384 | 6.6% | ||
| Index | Bear Market | MaxDD | #Days Down/Up | Recovery | CAGR | |
|---|---|---|---|---|---|---|
| From (Date) | (Points) | Day of MaxDD (Date) | Top-to-Bottom (#Days) | (#days) | (maxDD. Top-to-Bottom) | |
| To (Date) | (%) | Lowest Index Value (Points) | Bottom-to-Top (#Days) | Down vs. Recovery Ratio (%) | ||
| FTSE100 | 1987-07-17 | 878.2p. | 1987-11-09 | 115 | 901 | −75.70% |
| 1990-01-03 | 35.9% | 1565.2 | 786 | 12.8% | ||
| 1998-07-21 | 1530.3p. | 1998-10-05 | 76 | 218 | −74.53% | |
| 1999-02-24 | 24.8% | 4648.7 | 142 | 34.9% | ||
| 2000-01-04 | 3643.2p. | 2003-03-12 | 1163 | 5530 | −20.88% | |
| 2015-02-24 | 52.6% | 3287 | 4367 | 21.0% | ||
| FTSE100 “inner-trend” | 2007-06-18 | 3220.3p. | 2009-03-03 | 624 | 2163 | −31.67% |
| 2013-05-20 | 47.8% | 3512.1 | 1539 | 28.8% | ||
| FTSE100 | 2015-04-28 | 1567.0p. | 2016-02-11 | 289 | 610 | −27.02% |
| 2016-12-28 | 22.1% | 5537 | 321 | 47.4% | ||
| FTSE100 COVID | not recovered | |||||
| Index | Bear Market | MaxDD | #Days Down/Up | Recovery | CAGR | |
|---|---|---|---|---|---|---|
| From (Date) | (Points) | Day of MaxDD (Date) | Top-to-Bottom (#Days) | (#Days) | (maxDD. Top-to-Bottom) | |
| To (Date) | (%) | Lowest Index Value (Points) | Bottom-to-Top (#Days) | Down vs. Recovery Ratio (%) | ||
| NIKKEI 225 | 1949-09-02 | 91.6p. | 1950-07-06 | 307 | 864 | −58.04% |
| 1952-01-14 | 51.8% | 85.3 | 557 | 35.5% | ||
| 1953-02-05 | 179.3p. | 1953-04-01 | 55 | 1163 | −95.72% | |
| 1956-04-13 | 37.8% | 295.2 | 1108 | 4.7% | ||
| 1957-05-06 | 123.9p. | 1957-12-27 | 235 | 516 | −30.42% | |
| 1958-10-04 | 20.8% | 471.5 | 281 | 45.5% | ||
| 1961-07-19 | 809.3p. | 1965-07-12 | 1454 | 2630 | −13.64% | |
| 1968-09-30 | 44.2% | 1020.5 | 1176 | 55.3% | ||
| 1970-04-07 | 604.8p. | 1970-05-27 | 50 | 434 | −86.35% | |
| 1971-06-15 | 23.9% | 1929.6 | 384 | 11.5% | ||
| 1971-08-16 | 565.0p. | 1971-08-24 | 8 | 142 | −100.00% | |
| 1972-01-05 | 20.7% | 2162.8 | 134 | 5.6% | ||
| 1973-02-01 | 2060.1p. | 1974-10-09 | 615 | 1832 | −24.75% | |
| 1978-02-07 | 38.0% | 3355.1 | 1217 | 33.6% | ||
| 1987-10-15 | 5609.0p. | 1987-11-11 | 27 | 175 | −95.91% | |
| 1988-04-07 | 21.1% | 21037 | 148 | 15.4% | ||
| 1989-12-29 top 38916p. | not recovered | |||||
| “inner- trend” | 2007-07-10 | 11207.0p. | 2009-03-10 | 609 | 2781 | −43.47% |
| 2015-02-19 | 61.4% | 7055 | 2172 | 21.9% | ||
| 2015-06-25 | 5916.0p. | 2016-06-24 | 365 | 839 | −28.37% | |
| 2017-10-11 | 28.3% | 14952 | 474 | 43.5% | ||
| 2018-10-03 | 7717.8p. | 2020-03-19 | 533 | 765 | −23.07% | |
| 2020-11-06 | 31.8% | 16552.8 | 232 | 69.7% | ||
| “inner- -trendCOVID” | 2020-01-21 | 7530.7p. | 2020-03-19 | 58 | 289 | −90.57% |
| 2020-11-05 | 31.3% | 16552.8 | 231 | 20.1% | ||
Publisher’s Note: MDPI stays neutral with regard to jurisdictional claims in published maps and institutional affiliations. |
© 2021 by the author. Licensee MDPI, Basel, Switzerland. This article is an open access article distributed under the terms and conditions of the Creative Commons Attribution (CC BY) license (https://creativecommons.org/licenses/by/4.0/).
Share and Cite
Dąbrowski, P. Stock Indices Breakdown during the Pandemic as the Most Dynamic Bear Market in History: Consequences for Individual Investors. Risks 2022, 10, 1. https://doi.org/10.3390/risks10010001
Dąbrowski P. Stock Indices Breakdown during the Pandemic as the Most Dynamic Bear Market in History: Consequences for Individual Investors. Risks. 2022; 10(1):1. https://doi.org/10.3390/risks10010001
Chicago/Turabian StyleDąbrowski, Piotr. 2022. "Stock Indices Breakdown during the Pandemic as the Most Dynamic Bear Market in History: Consequences for Individual Investors" Risks 10, no. 1: 1. https://doi.org/10.3390/risks10010001
APA StyleDąbrowski, P. (2022). Stock Indices Breakdown during the Pandemic as the Most Dynamic Bear Market in History: Consequences for Individual Investors. Risks, 10(1), 1. https://doi.org/10.3390/risks10010001