Analyses of Phytohormones in Coconut (Cocos Nucifera L.) Water Using Capillary Electrophoresis-Tandem Mass Spectrometry

Abstract
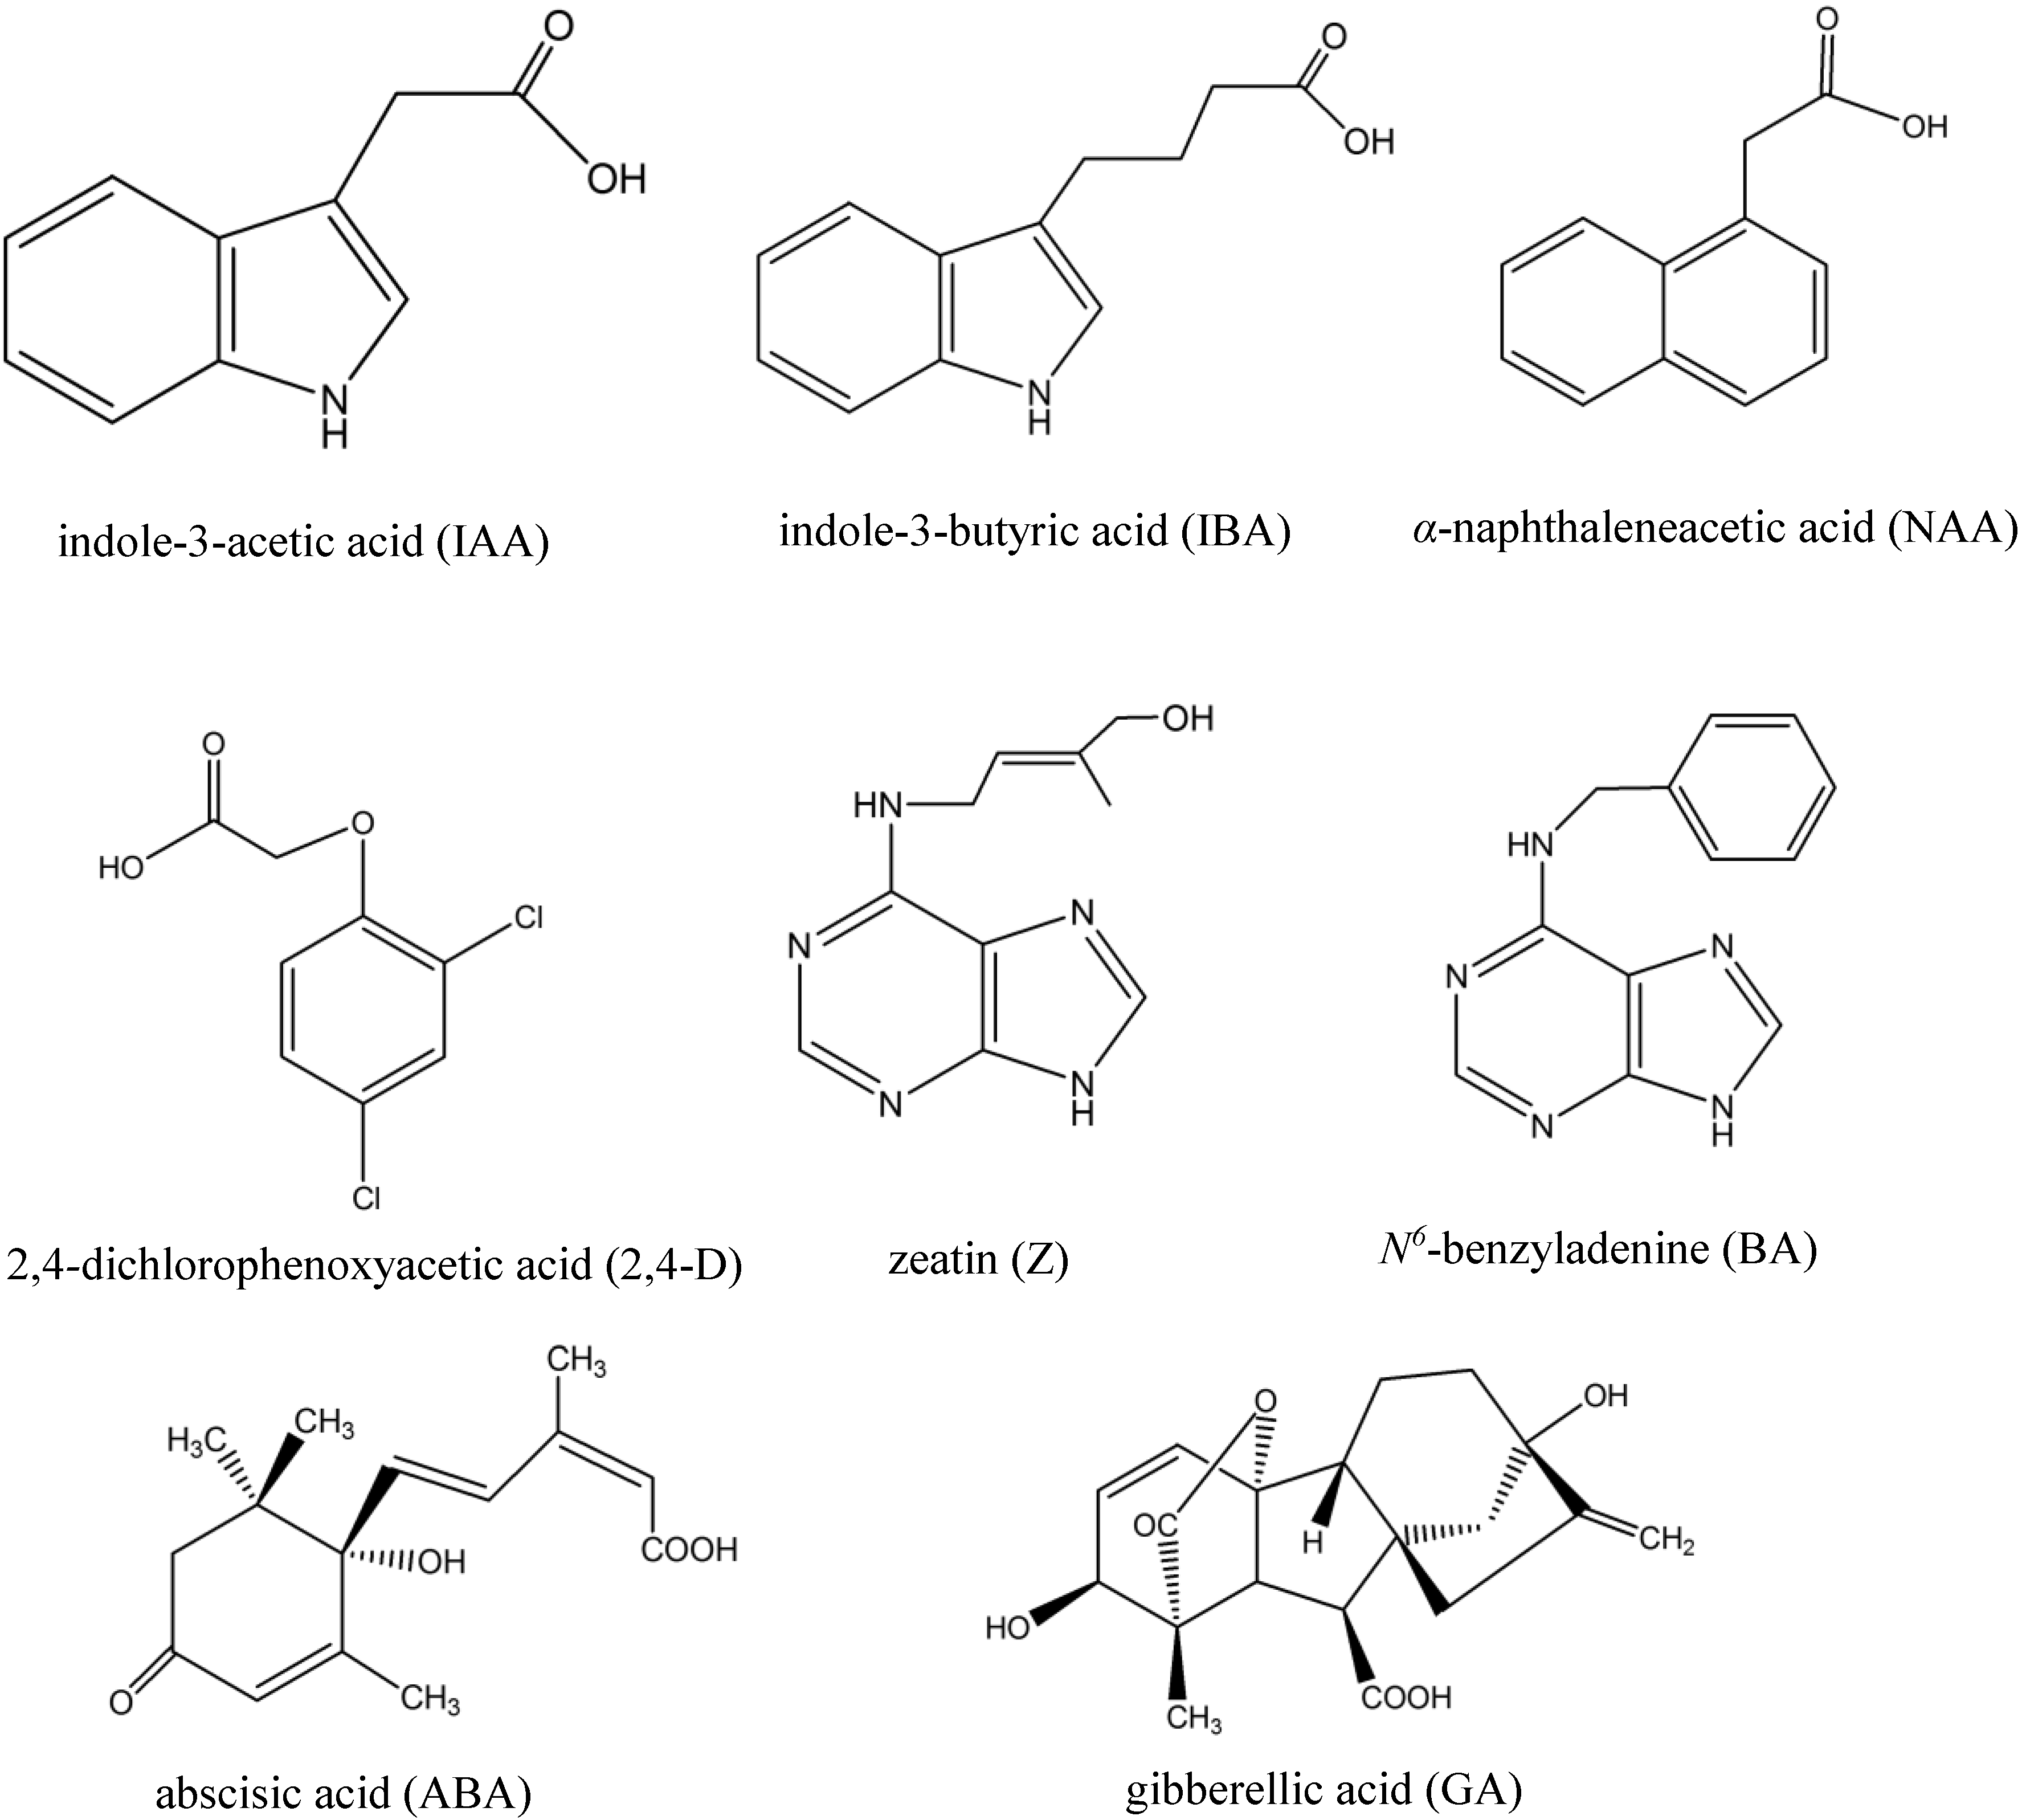
:1. Introduction
2. Experimental Section
2.1. Reagents and Materials
2.2. Instrumentation
2.3. CE-ESI-MS Conditions

2.4. Sample Preparation
3. Results and Discussion
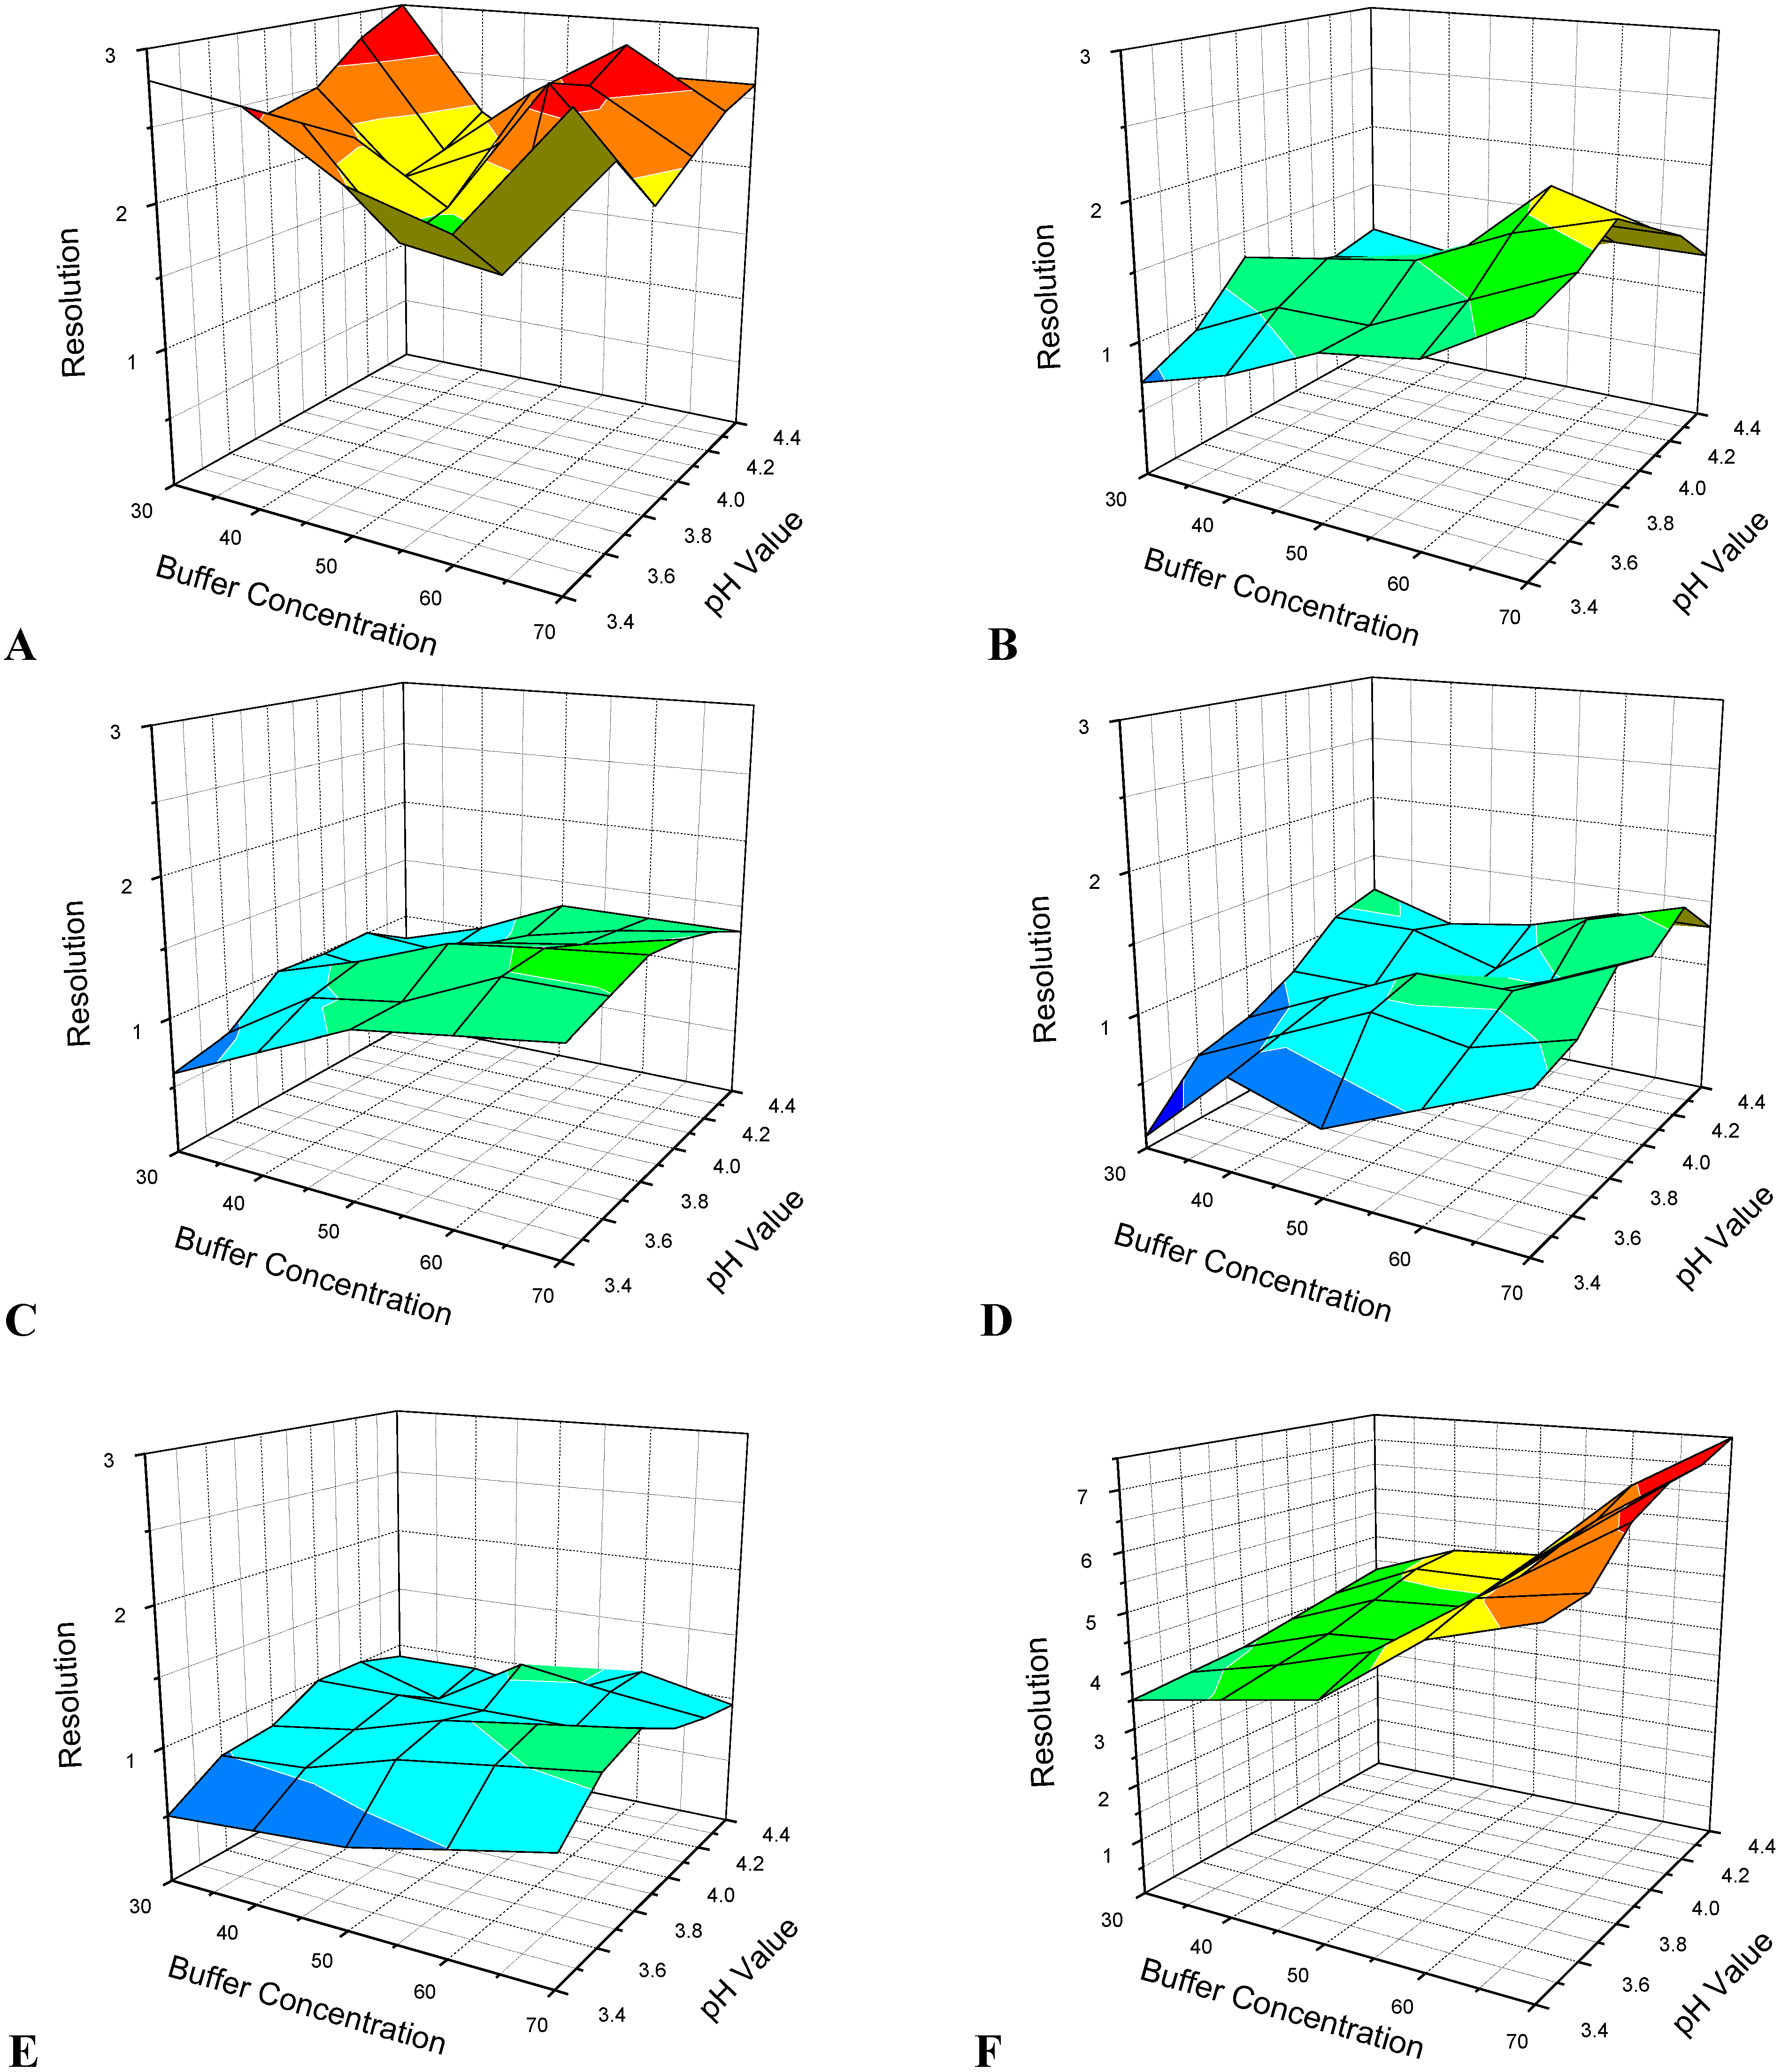
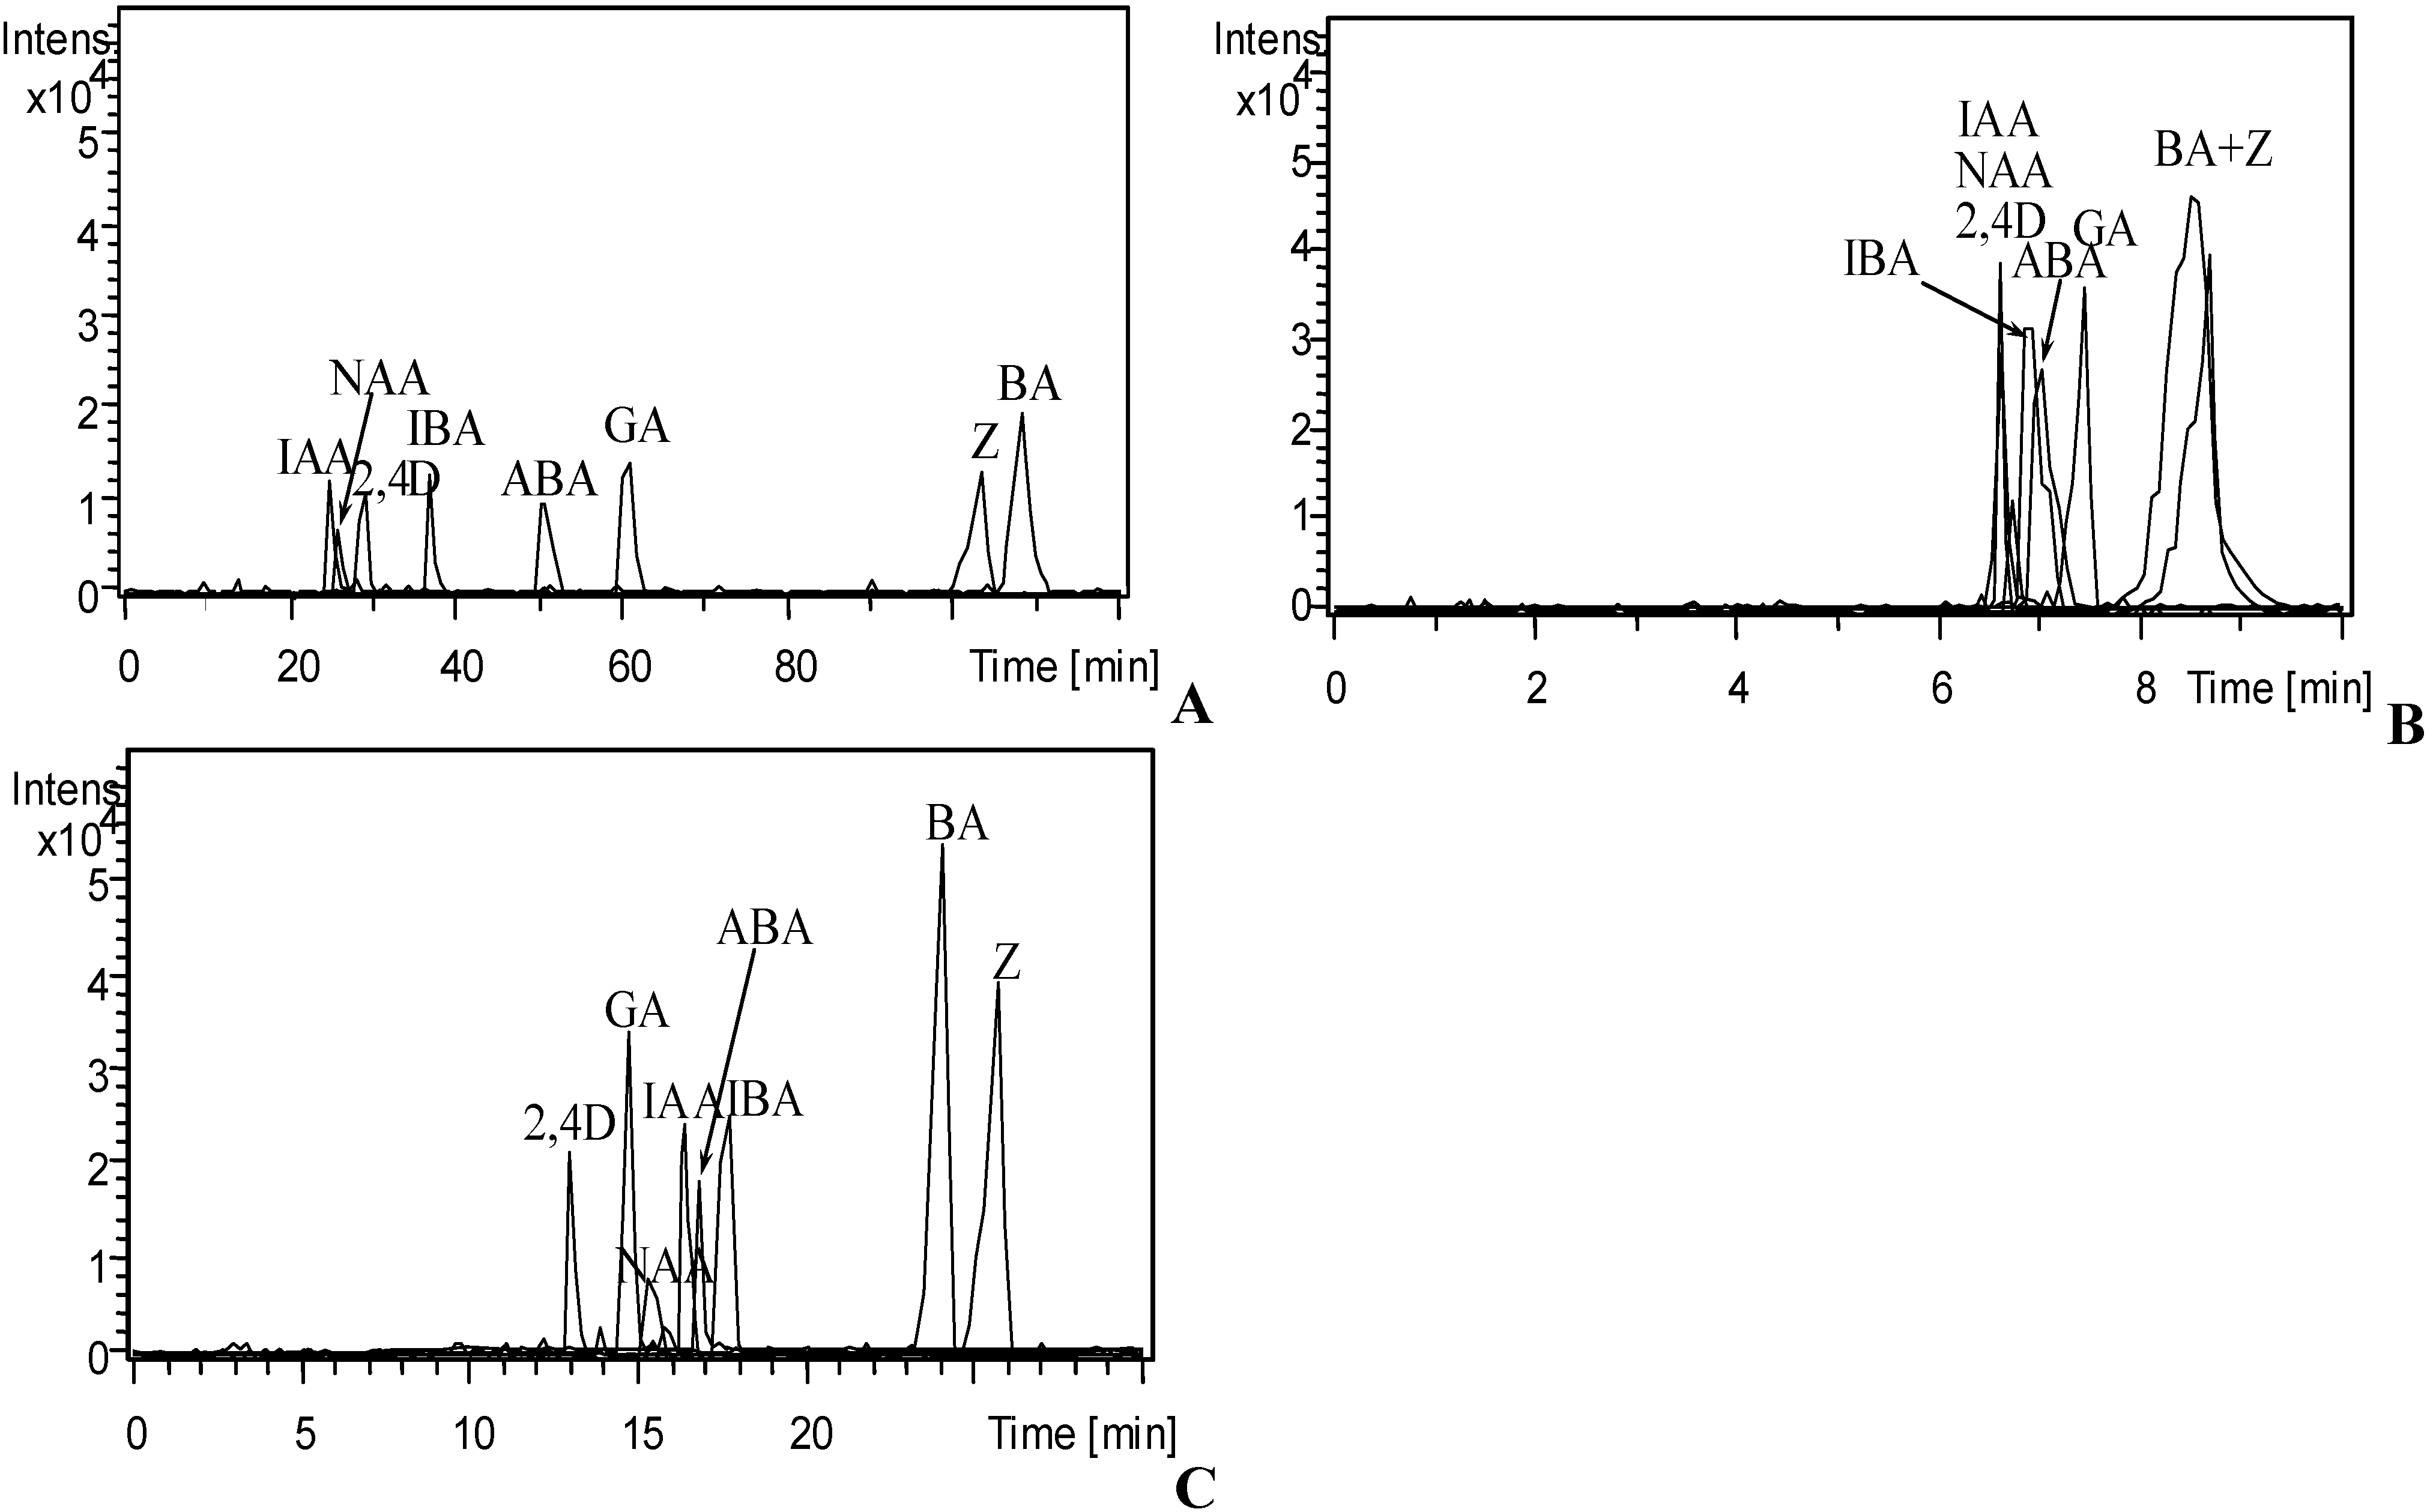
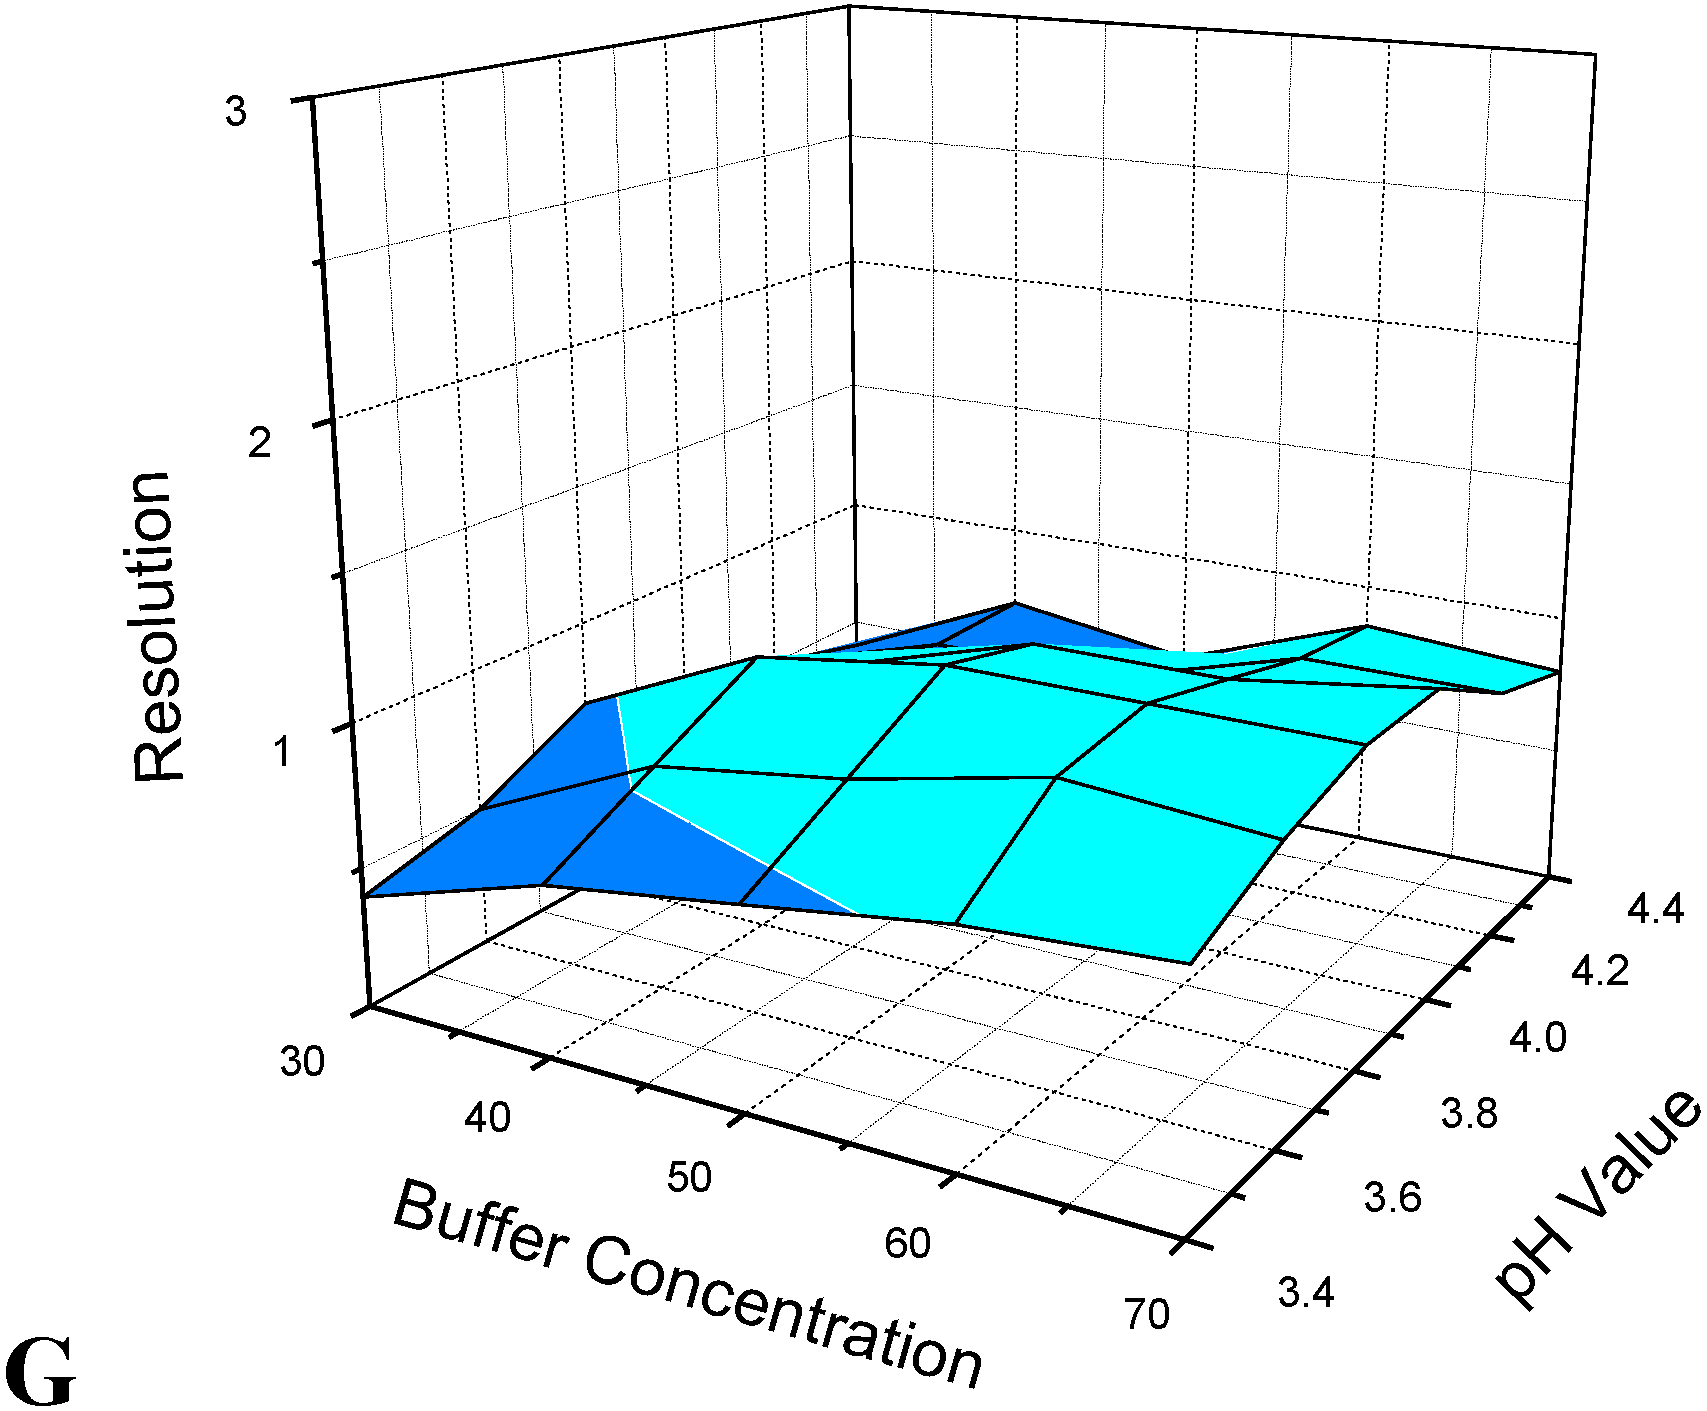
3.1. Optimization of CE Separation Conditions


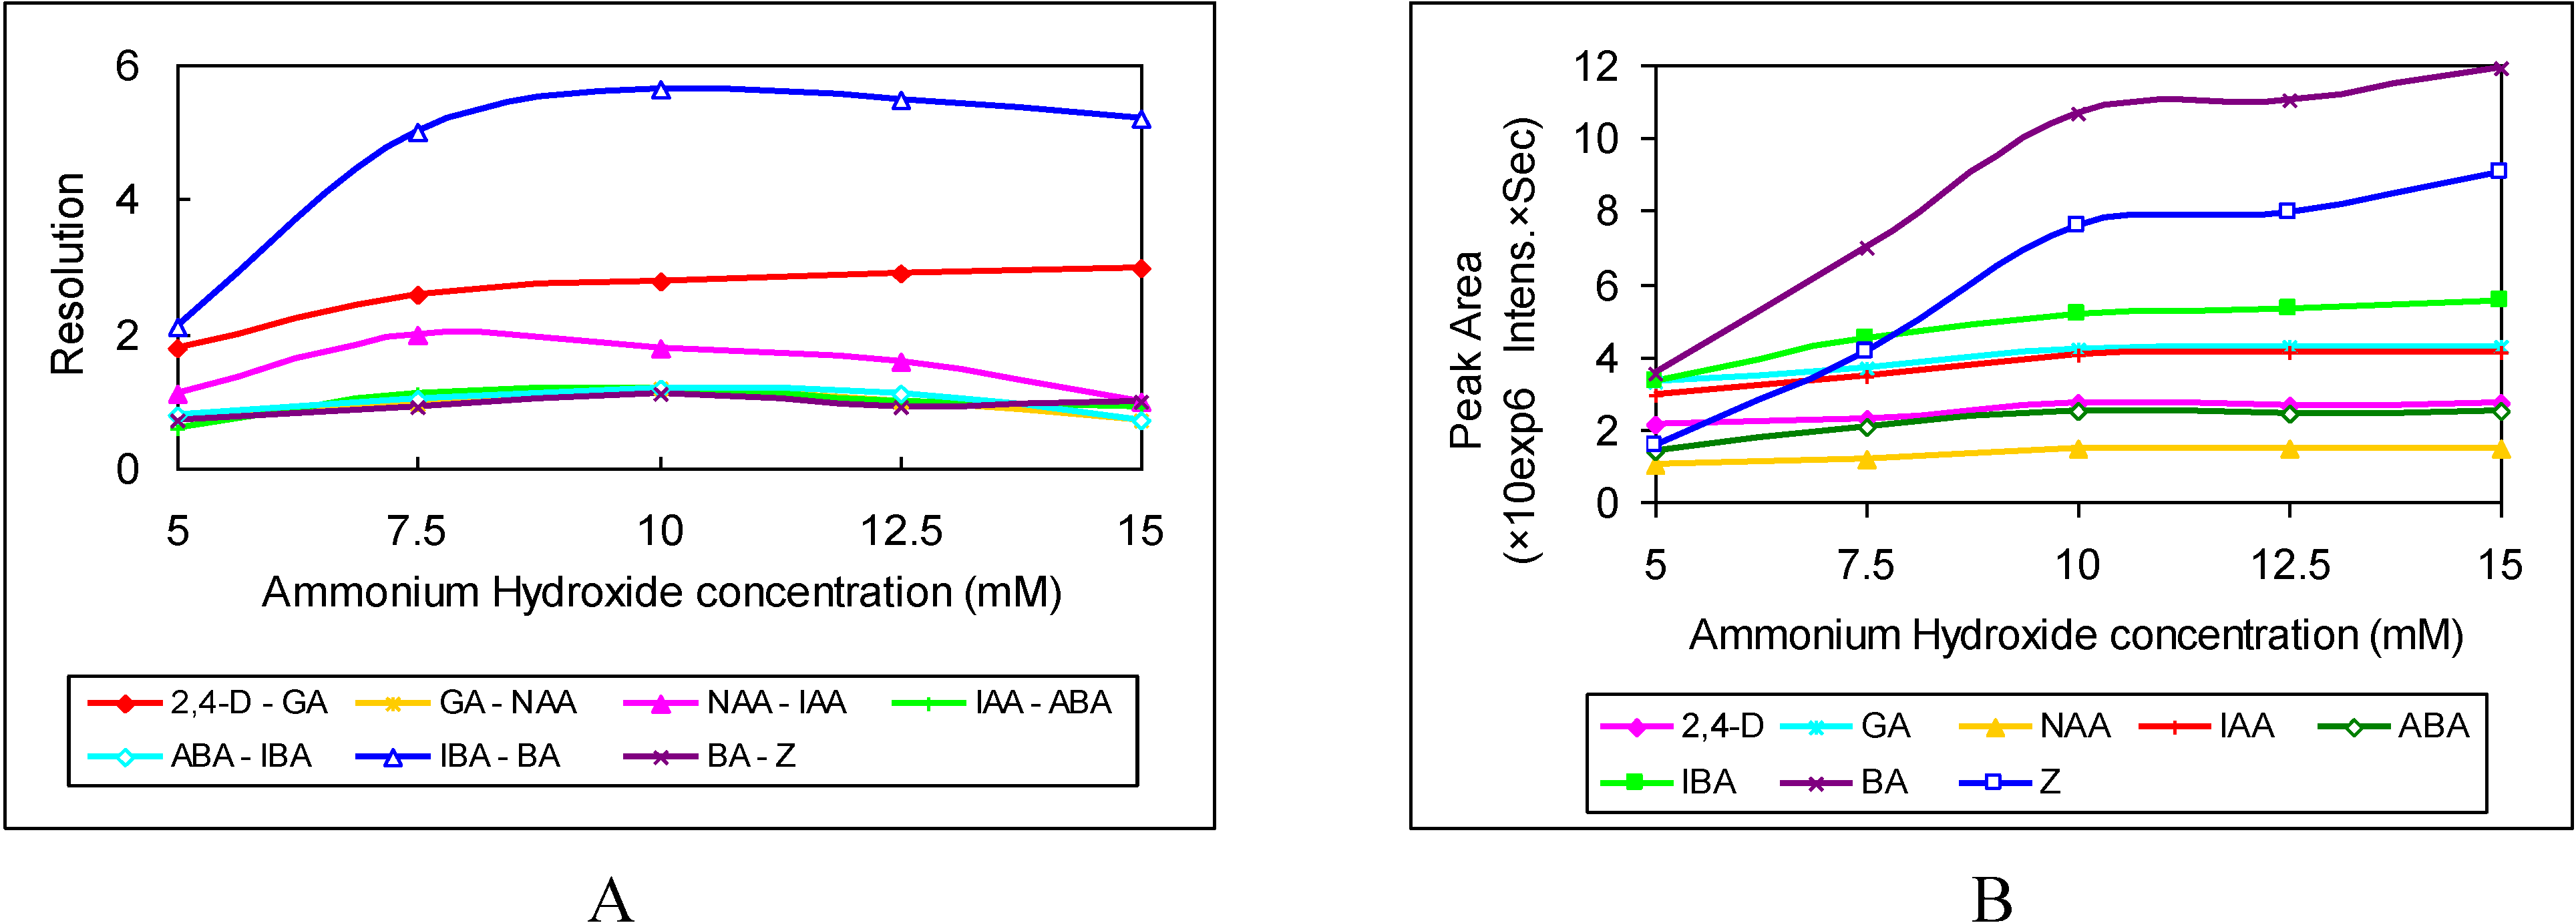
3.2. Selection of Sheath Liquid
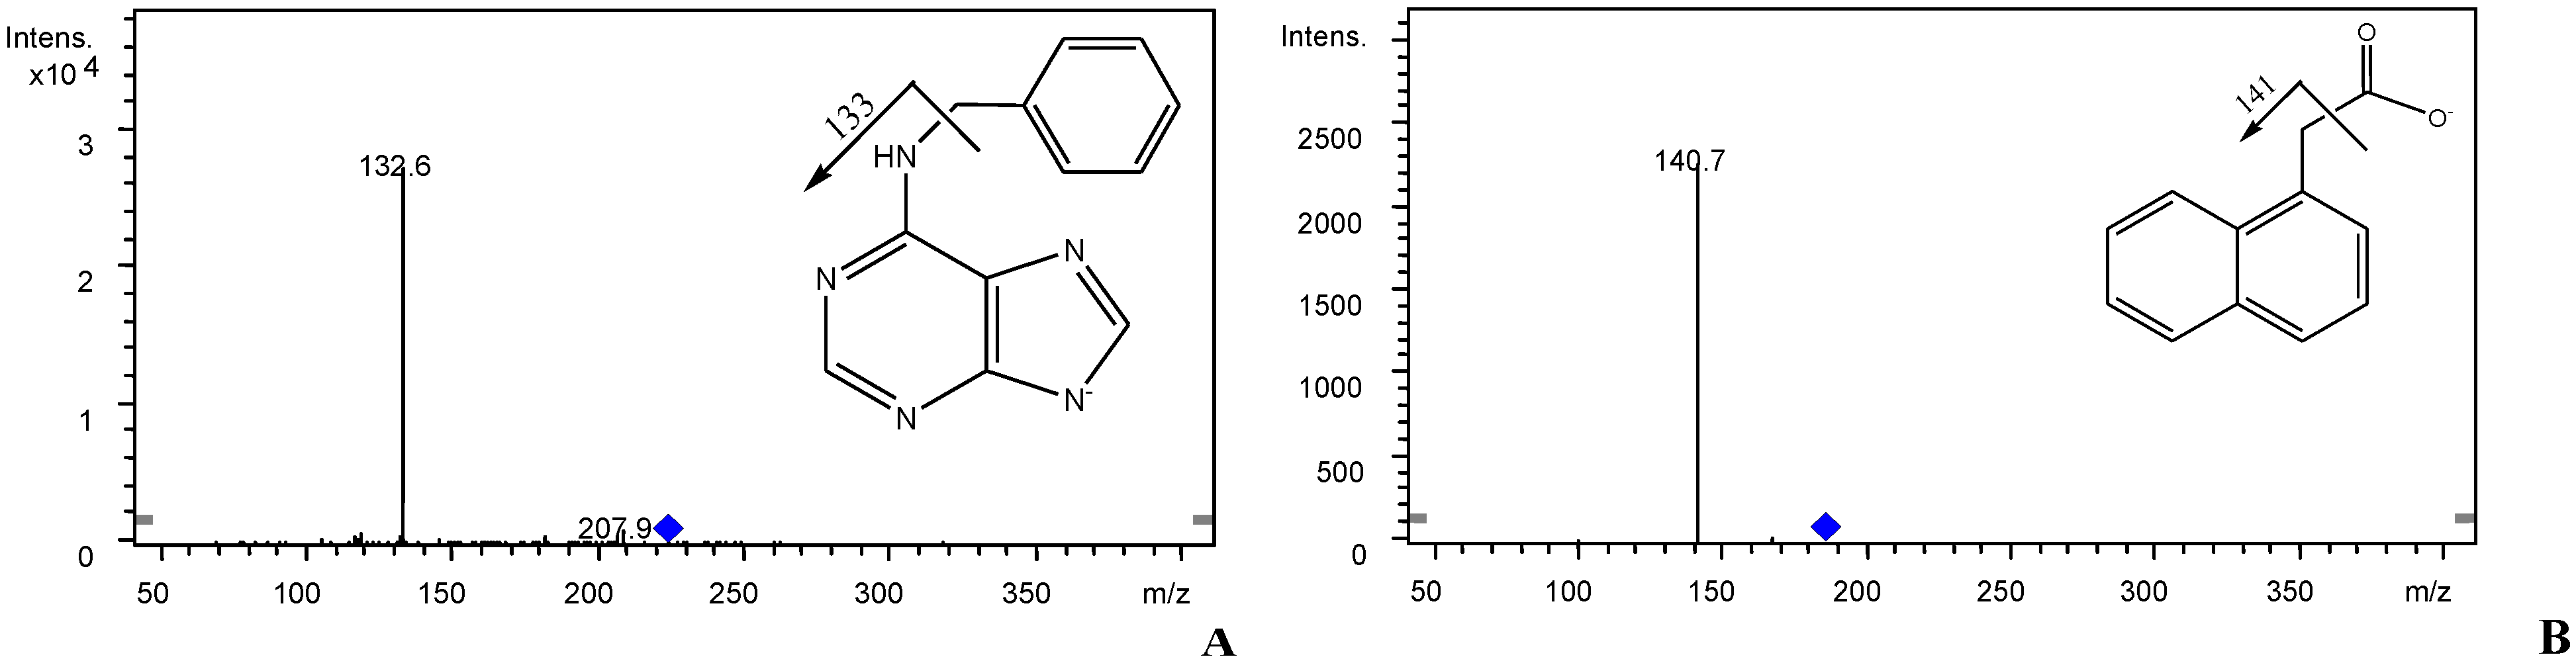
3.3. Validation of CE-MS/MS Method


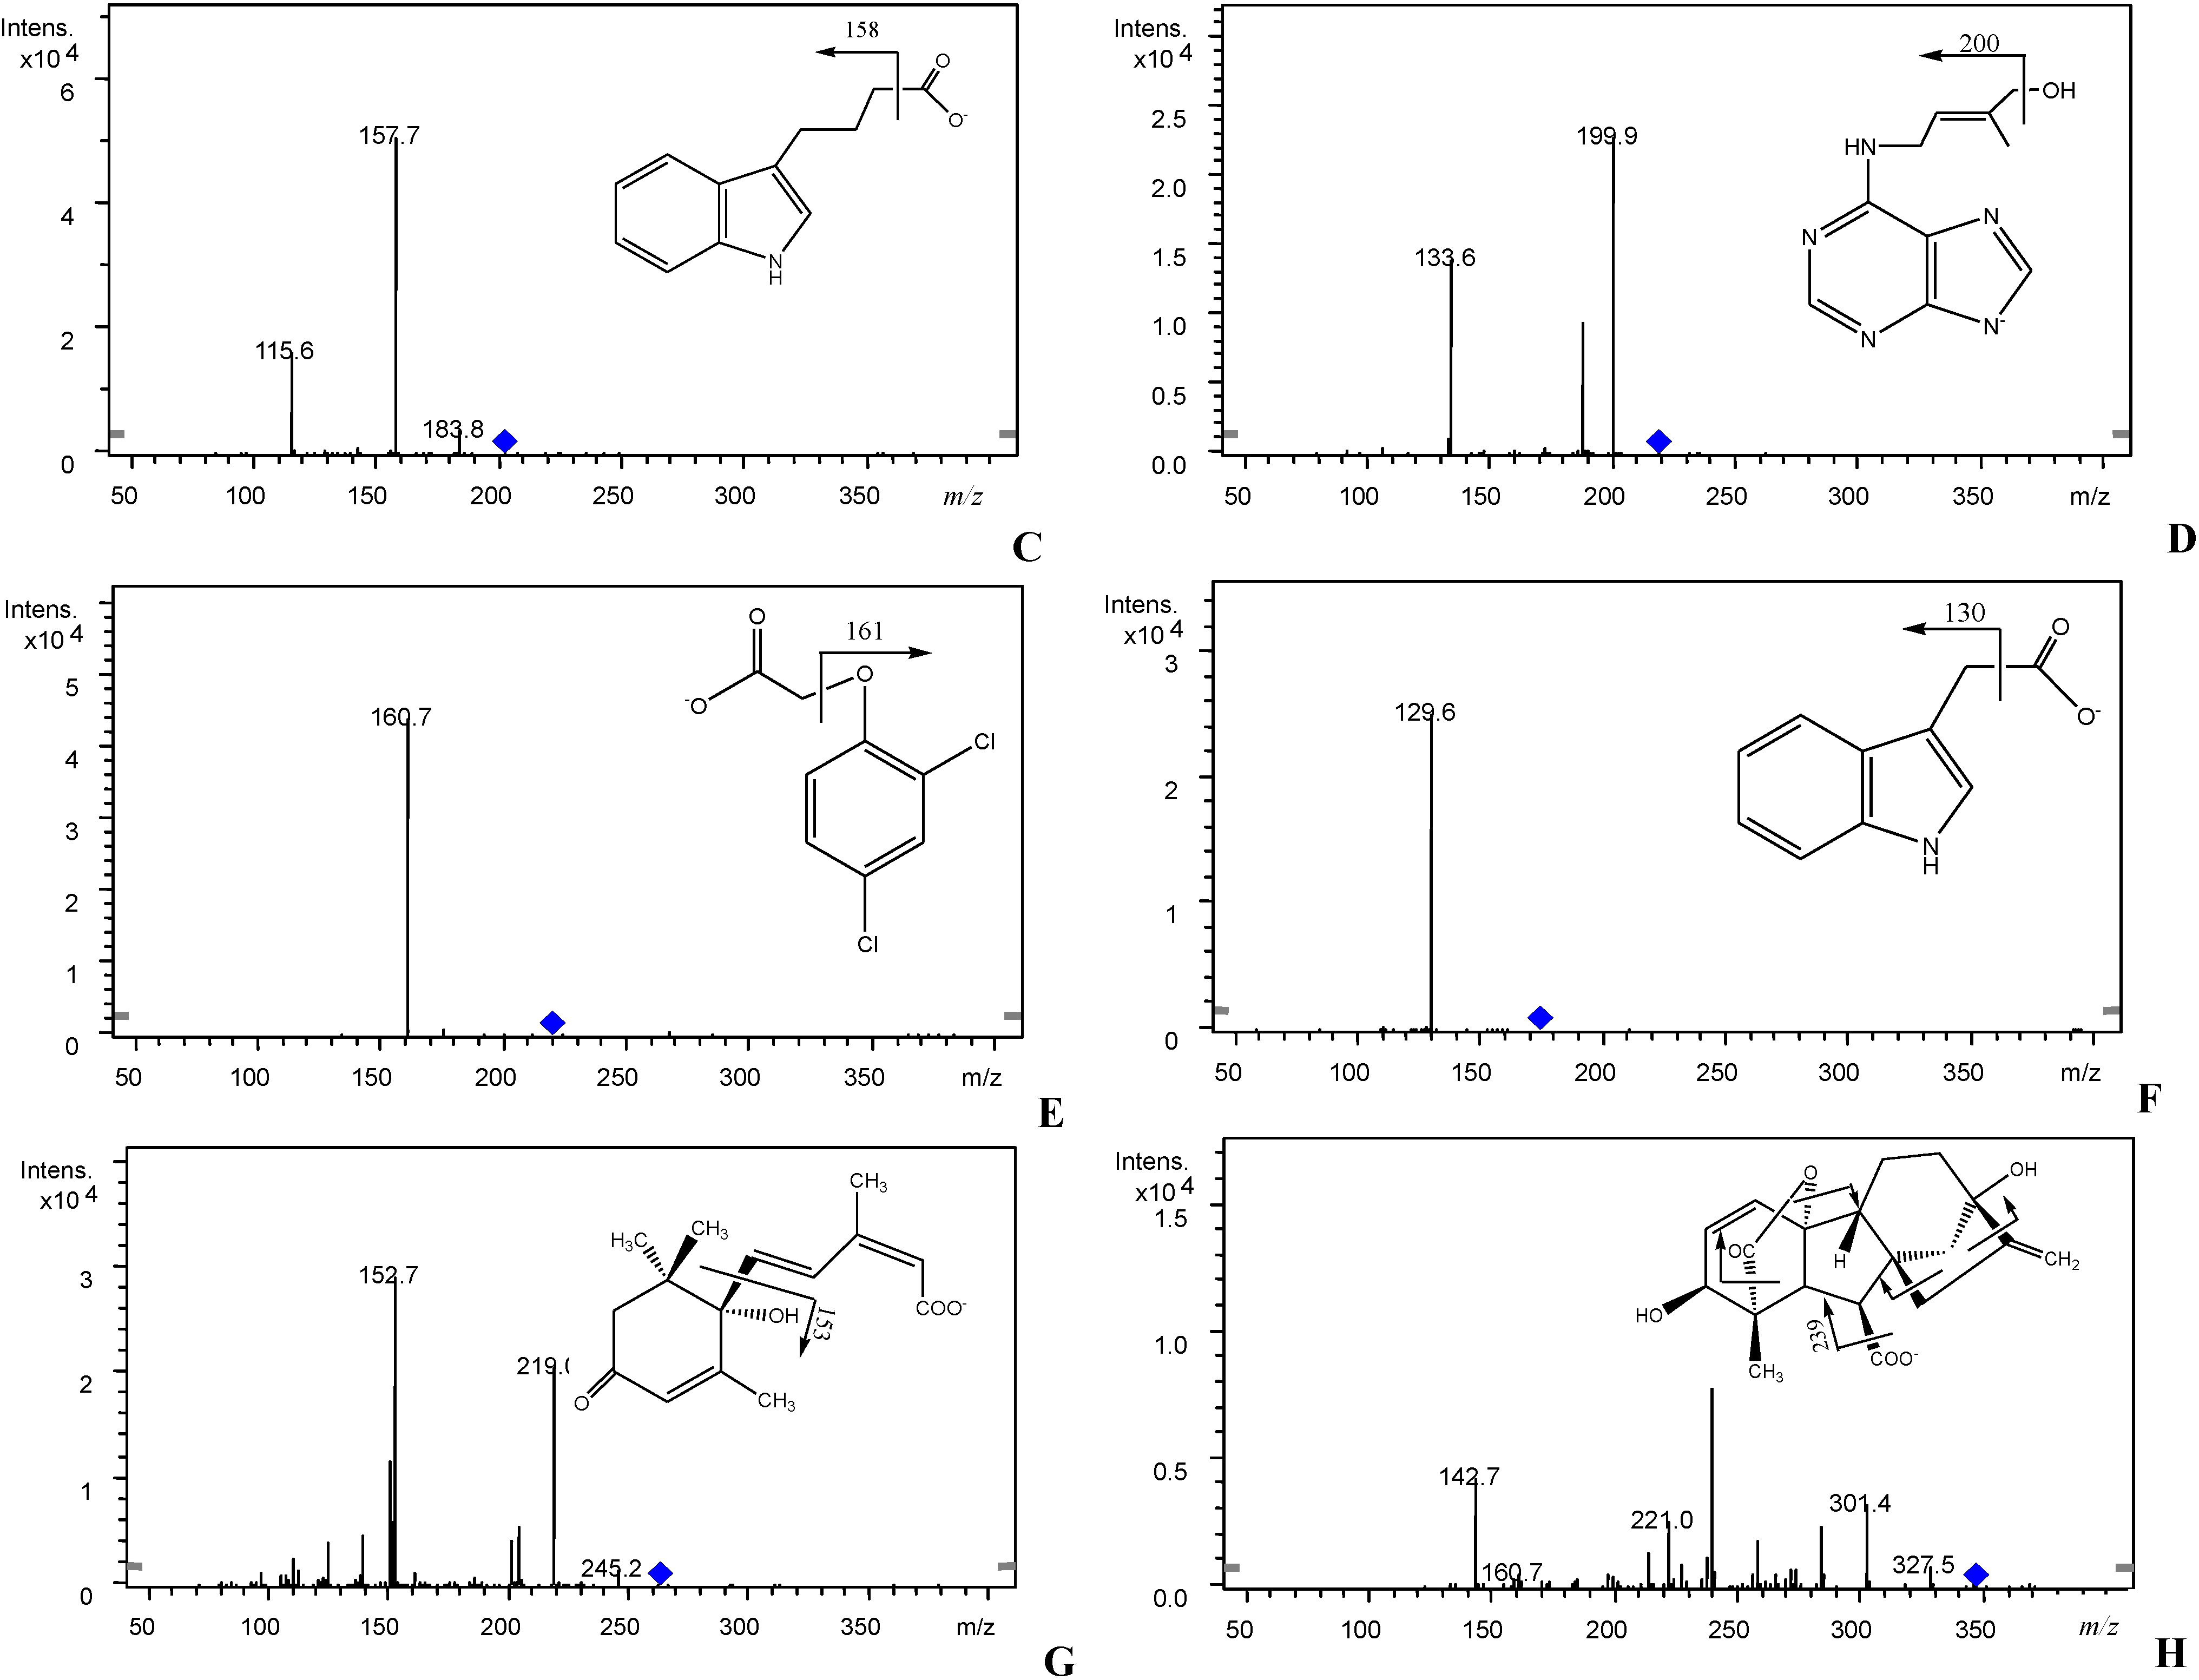
| Phytohormones | Migration Time (min) a | MRM Transition (m/z) | Peak Area (Cps × s) a | Calibration Equation b | R2 | LOQ (µM) | LOD (µM) | ||
|---|---|---|---|---|---|---|---|---|---|
| Mean | RSD (%) | Mean | RSD (%) | ||||||
| 2,4-D | 14.2 | 0.8 | 219→161 | 396,042 | 3.4 | y = 13148x + 1573 | 0.993 | 2.1 | 0.6 |
| GA | 15.4 | 0.7 | 345→239 | 466,253 | 4.2 | y = 15410x + 3961 | 0.994 | 1.6 | 0.5 |
| NAA | 16.2 | 0.8 | 185→141 | 308,019 | 3.8 | y = 10097x + 5109 | 0.991 | 5.2 | 1.6 |
| IAA | 17.8 | 0.9 | 174→130 | 432,170 | 4.1 | y = 14192x + 6395 | 0.992 | 2.3 | 0.7 |
| ABA | 18.4 | 0.7 | 263→153 | 389,975 | 4.7 | y = 24176x + 7372 | 0.993 | 3.9 | 1.2 |
| IBA | 19.5 | 0.6 | 202→158 | 494,861 | 3.9 | y = 15929x + 16923 | 0.994 | 2.0 | 0.6 |
| BA | 25.6 | 0.9 | 224→133 | 1,584,351 | 6.5 | y = 53396x − 17542 | 0.99 | 0.7 | 0.2 |
| Z | 27.1 | 1.1 | 218→200 | 1,273,235 | 5.9 | y = 42769x − 9838 | 0.988 | 0.9 | 0.3 |
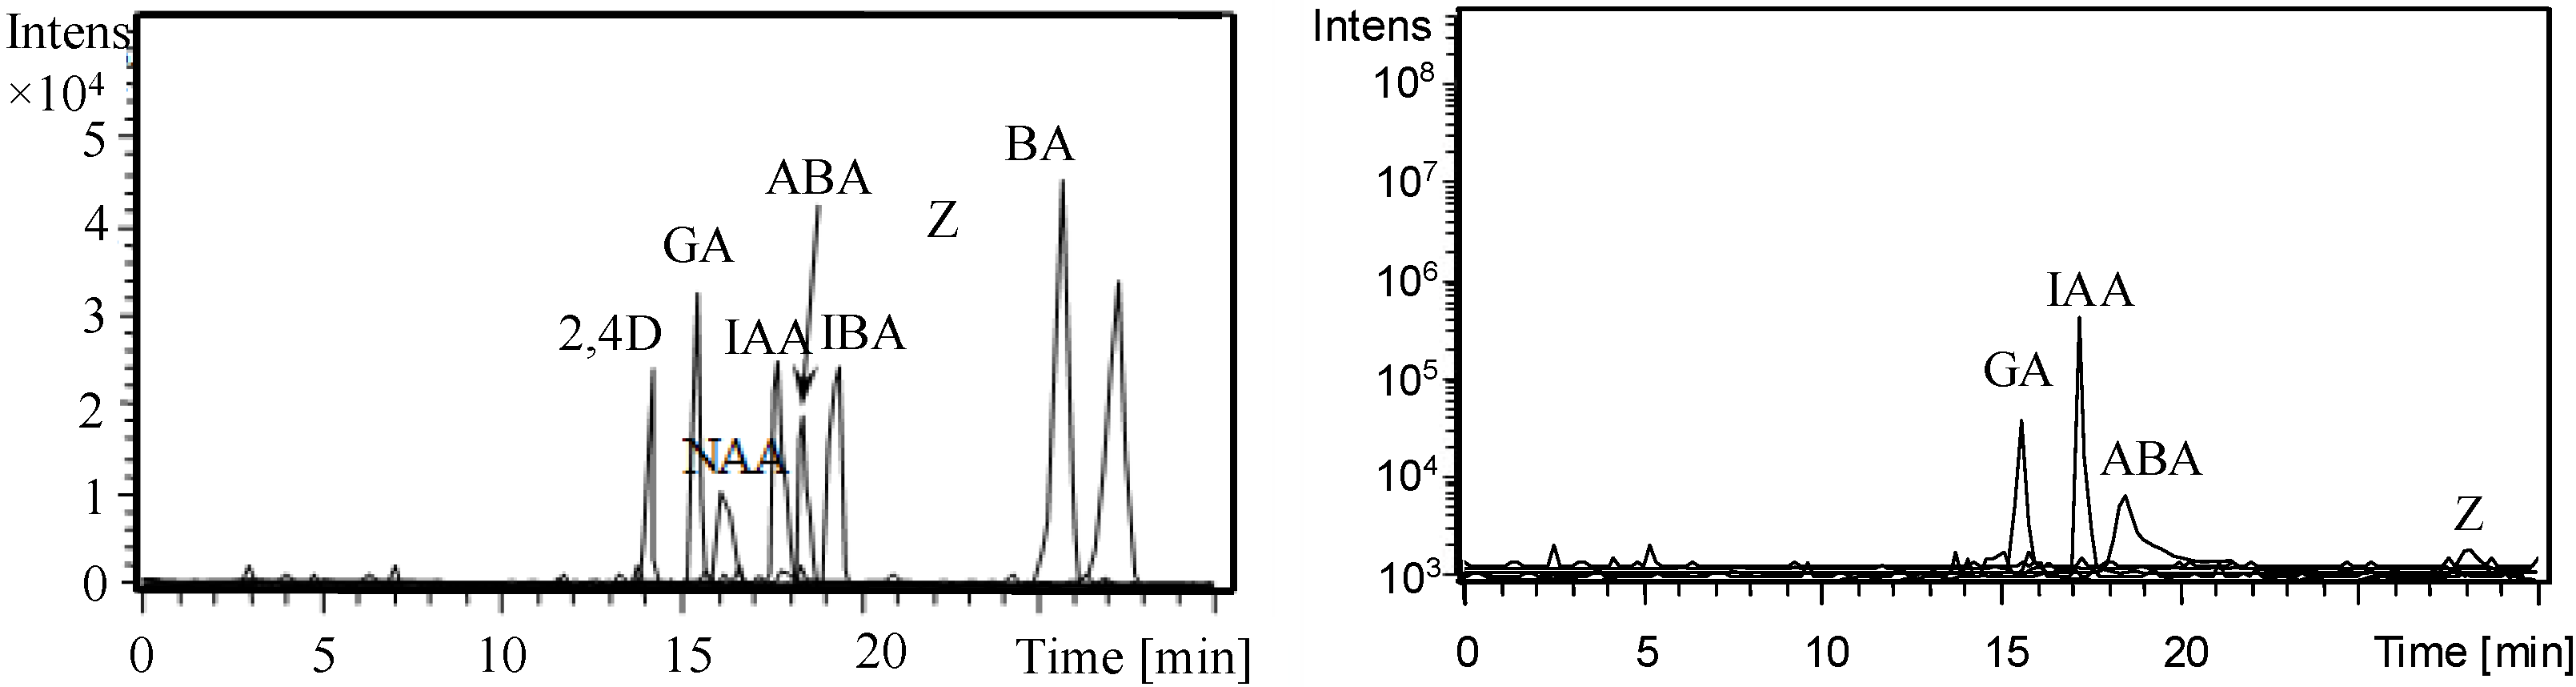
3.4. Analysis of Phytohormones in Coconut Water
| Phytohormones | IAA | ABA | GA | Z |
|---|---|---|---|---|
| Estimated Concentration (×10−3 μM) | 198.2 | 15.3 | 49.6 | 0.12 |
4. Conclusions
Acknowledgments
Author Contributions
Conflicts of Interest
References
- Davies, P.J. Plant Hormones: Biosynthesis, Signal Transduction, Action! 3rd ed.; Kluwer Academic Publishers: Dordrecht, The Netherlands, 2010. [Google Scholar]
- Tucker, G.A.; Roberts, J.A. Plant Hormone Protocols; Humana Press Inc.: Totowa, NJ, USA, 2000. [Google Scholar]
- Chiwocha, S.D.S.; Abrams, S.R.; Ambrose, S.J.; Cutler, A.J.; Loewen, M.; Ross, A.R.S.; Kermode, A.R. A method for profiling classes of plant hormones and their metabolites using liquid chromatography-electrospray ionization tandem mass spectrometry: An analysis of hormone regulation of thermodormancy of lettuce (Lactuca sativa L.) seeds. Plant J. 2003, 35, 405–417. [Google Scholar] [PubMed]
- Slaugenhaupt, S.A.; Mull, J.; Leyne, M.; Cuajungco, M.P.; Gill, S.P.; Hims, M.M.; Quintero, F.; Axelrod, F.B.; Gusella, J.F. Rescue of a human mRNA splicing defect by the plant cytokinin kinetin. Hum. Mol. Genet. 2004, 13, 429–436. [Google Scholar] [CrossRef] [PubMed]
- Rattan, S.I.S.; Sodagam, L. Gerontomodulatory and youth-preserving effects of zeatin on fibroblasts of human skin. Rejuv. Res. 2005, 8, 46–57. [Google Scholar] [CrossRef]
- Casati, S.; Ottria, R.; Baldoli, E.; Lopez, E.; Maier, J.A.; Ciuffreda, P. Effects of cytokinins, cytokinin ribosides and their analogs on the viability of normal and neoplastic human cells. Anticancer Res. 2011, 31, 3401–3406. [Google Scholar] [PubMed]
- Birkemeyer, C.; Kolasa, A.; Kopka, J. Comprehensive chemical derivatization for gas chromatography–mass spectrometry-based multi-targeted profiling of the major phytohormones. J. Chromatogr. A 2003, 993, 89–102. [Google Scholar] [CrossRef] [PubMed]
- Ma, Z.; Ge, L.; Lee, A.S.Y.; Yong, J.W.H.; Tan, S.N.; Ong, E.S. Simultaneous analysis of different classes of phytohormones in coconut (Cocos nucifera L.) water using high-performance liquid chromatography and liquid chromatography–tandem mass spectrometry after solid-phase extraction. Anal. Chim. Acta 2008, 610, 274–281. [Google Scholar] [CrossRef] [PubMed]
- Hou, S.J.; Zhu, J.; Ding, M.Y.; Lv, G.H. Simultaneous determination of gibberellic acid, indole-3-acetic acid and abscisic acid in wheat extracts by solid-phase extraction and liquid chromatography-electrospray tandem mass spectrometry. Talanta 2008, 76, 798–802. [Google Scholar] [CrossRef] [PubMed]
- Pan, X.Q.; Welti, R.; Wang, X.M. Quantitative analysis of major plant hormones in crude plant extracts by high-performance liquid chromatography–mass spectrometry. Nat. Protoc. 2010, 5, 986–992. [Google Scholar] [CrossRef] [PubMed]
- Watanabe, E.; Tsuda, Y.; Watanabe, S.; Ito, S.; Hayashi, M.; Watanabe, T.; Yuasa, Y.; Nakazana, H. Development of an enzyme immunoassay for the detection of plant growth regulator inabenfide in rice. Anal. Chim. Acta 2000, 424, 149–160. [Google Scholar] [CrossRef]
- Linskens, H.F.; Jackson, J.F. Immunology in Plant Sciences. In Modern Methods of Plant Analysis; Springer: Heidelberg, Berlin, Germany, 1986; Volume 4. [Google Scholar]
- Liu, B.-F.; Zhong, X.-H.; Lu, Y.-T. Analysis of plant hormones in tobacco flowers by micelar electrokinetic capillary chromatography coupled with on line large volume sample stacking. J. Chromatogr. A 2002, 945, 257–265. [Google Scholar] [CrossRef] [PubMed]
- Jiang, T.-F.; Lv, Z.-H.; Wang, Y.-H.; Yue, M.-E. Separation of plant hormones from biofertilizer by capillary electrophoresis using a capillary coated dynamically with polycationic polymers. Anal. Sci. 2006, 22, 811–814. [Google Scholar] [CrossRef]
- Huang, L.; He, M.; Chen, B.; Hu, B. Membrane-supported liquid–liquid–liquid microextraction combined with anion-selective exhaustive injection capillary electrophoresis-ultraviolet detection for sensitive analysis of phytohormones. J. Chromatogr. A 2014, 1343, 10–17. [Google Scholar] [CrossRef] [PubMed]
- De Hoffmann, E.; Charette, J.; Stroobant, V. Mass Spectrometry: Principles and Applications; Wiley: Paris, France, 1996; pp. 1–8. [Google Scholar]
- Ge, L.; Yong, J.W.H.; Tan, S.N.; Ong, E.S. Determination of cytokinins in coconut water (Cocos nucifera L.) using capillary electrophoresis-tandem mass spectrometry. Electrophoresis 2006, 27, 2171–2181. [Google Scholar] [CrossRef] [PubMed]
- Ge, L.; Yong, J.W.H.; Tan, S.N.; Hua, H.; Ong, E.S. Analyses of gibberellins in coconut (Cocos nucifera L.) water by partial filling-micellar electrokinetic chromatography-mass spectrometry with reversal of electroosmotic flow. Electrophoresis 2008, 29, 2024–2032. [Google Scholar] [CrossRef]
- Ge, L.; Peh, C.Y.C.; Yong, J.W.H.; Tan, S.N.; Hua, H.; Ong, E.S. Analyses of gibberellins by capillary electrophoresis-mass spectrometry combined with solid-phase extraction. J. Chromatogr. A 2007, 1159, 242–249. [Google Scholar] [CrossRef] [PubMed]
- Ge, L.; Yong, J.W.H.; Tan, S.N.; Hua, H.; Ong, E.S. Separation of cytokinin isomers with a partial filling-micellar electrokinetic chromatography-mass spectrometry approach. Electrophoresis 2008, 29, 2126–2134. [Google Scholar] [CrossRef] [PubMed]
- Chen, M.L.; Huang, Y.Q.; Liu, J.Q.; Yuan, B.F.; Feng, Y.Q. Highly sensitive profiling assay of acidic plant hormones using a novel mass probe by capillary electrophoresis-time of flight-mass spectrometry. J. Chromatogr. B 2011, 879, 938–944. [Google Scholar] [CrossRef]
- Schmitt-Kopplin, P.; Frommberger, M. Capillary electrophoresis-mass spectrometry: 15 years of developments and applications. Electrophoresis 2003, 24, 3837–3867. [Google Scholar] [CrossRef] [PubMed]
- Crozier, A.; Moritz, T. Physico-chemical methods of plant hormone analysis. In Biochemistry and Molecular Biology of Plant Hormones; Hooykaas, P.J.J., Hall, M.A., Libbenga, K.R., Eds.; Elsevier: Amsterdam, The Netherlands, 1999; Volume 33, pp. 23–60. [Google Scholar]
- Dobrev, P.I.; Havlíček, L.; Vágner, M.; Malbeck, J.; Kamínek, M. Purification and determination of plant hormones auxin and abscisic acid using solid phase extraction and two-dimensional high performance liquid chromatography. J. Chromatogr. A 2005, 1075, 159–166. [Google Scholar] [CrossRef] [PubMed]
- Katayama, H.; Ishihama, Y.; Asakawa, N. Stable cationic capillary coating with successive multiple ionic polymer layers for capillary electrophoresis. Anal. Chem. 1998, 70, 5272–5277. [Google Scholar] [CrossRef] [PubMed]
- Rivier, L.; Crozier, A. Principles and Practice of Plant Hormone Analysis; Academic Press: London, UK, 1987; pp. 306–307. [Google Scholar]
- The United States Pharmacopoeia, 25th Asian ed.; United States Pharmacopoeial Convention: Rockville, MD, USA, 2002; pp. 1990–1991.
- Myers, R.H.; Montgomery, D.C. Response Surface Methodology: Process and Product Optimization using Designed Experiments; Wiley: New York, NY, USA, 2002. [Google Scholar]
- Wang, J.; Mannino, S.; Camera, C.; Chatrathi, M.P.; Scampicchio, M.; Zima, J. Microchip capillary electrophoresis with amperometric detection for rapid separation and detection of seleno amino acids. J. Chromatogr. A 2005, 1091, 177–182. [Google Scholar] [CrossRef]
- Sawada, H.; Nogami, C. Capillary electrophoresis-electrospray ionization mass spectrometry using uncoated fused-silica capillaries and alkaline buffer solution for the analysis of small carboxylic acids. Anal. Chim. Acta 2004, 507, 195–202. [Google Scholar] [CrossRef]
- Foret, F.; Thompson, T.J.; Vouros, P.; Karger, B.L.; Gebauer, P.; Bocek, P. Liquid sheath effects on the separation of proteins in capillary electrophoresis/electrospray mass spectrometry. Anal. Chem. 1994, 66, 4450–4458. [Google Scholar] [CrossRef]
© 2014 by the authors; licensee MDPI, Basel, Switzerland. This article is an open access article distributed under the terms and conditions of the Creative Commons Attribution license (http://creativecommons.org/licenses/by/4.0/).
Share and Cite
Tan, S.N.; Yong, J.W.H.; Ge, L. Analyses of Phytohormones in Coconut (Cocos Nucifera L.) Water Using Capillary Electrophoresis-Tandem Mass Spectrometry. Chromatography 2014, 1, 211-226. https://doi.org/10.3390/chromatography1040211
Tan SN, Yong JWH, Ge L. Analyses of Phytohormones in Coconut (Cocos Nucifera L.) Water Using Capillary Electrophoresis-Tandem Mass Spectrometry. Chromatography. 2014; 1(4):211-226. https://doi.org/10.3390/chromatography1040211
Chicago/Turabian StyleTan, Swee Ngin, Jean Wan Hong Yong, and Liya Ge. 2014. "Analyses of Phytohormones in Coconut (Cocos Nucifera L.) Water Using Capillary Electrophoresis-Tandem Mass Spectrometry" Chromatography 1, no. 4: 211-226. https://doi.org/10.3390/chromatography1040211
APA StyleTan, S. N., Yong, J. W. H., & Ge, L. (2014). Analyses of Phytohormones in Coconut (Cocos Nucifera L.) Water Using Capillary Electrophoresis-Tandem Mass Spectrometry. Chromatography, 1(4), 211-226. https://doi.org/10.3390/chromatography1040211