Next Article in Journal
Analyses of Phytohormones in Coconut (Cocos Nucifera L.) Water Using Capillary Electrophoresis-Tandem Mass Spectrometry
Next Article in Special Issue
Development of Monolithic Column Materials for the Separation and Analysis of Glycans
Previous Article in Journal
Electrophoretic Extraction and Proteomic Characterization of Proteins Buried in Marine Sediments
 
 
Please note that, as of 1 January 2016, Chromatography has been renamed to Separations and is now published here.
Article

Description of the Retention and Peak Profile for Chromolith Columns in Isocratic and Gradient Elution Using Mobile Phase Composition and Flow Rate as Factors

Departament de Química Analítica, Universitat de València, c/Dr. Moliner 50, 46100 Burjassot, Spain
*
Author to whom correspondence should be addressed.
Chromatography 2014, 1(4), 194-210; https://doi.org/10.3390/chromatography1040194
Submission received: 22 October 2014 / Revised: 13 November 2014 / Accepted: 14 November 2014 / Published: 19 November 2014
(This article belongs to the Special Issue Monolithic Columns in Separation Sciences)

Abstract

:
The effect of the modifier concentration and flow rate on the chromatographic performance of a second generation Chromolith® RP-18e column, under isocratic and gradient elution with acetonitrile-water mixtures, was examined using four sulphonamides as probe compounds. The acetonitrile concentration was varied between 5 and 55% (v/v), and the flow rate between 0.1 and 5.0 mL/min, keeping the other factors constant. The changes in both retention and peak profile were modelled, and used to build simple plots, where the logarithm of the retention factor was represented against the modifier concentration (in gradient elution, against the initial modifier concentration), and the half-widths or widths against the retention time (in gradient elution, against the time at the column outlet). A particular plot was needed for describing the retention of each sulphonamide, but due to the similar interaction kinetics, a unique plot described the changes in the half-widths for all four sulphonamides. The changes in retention with the flow showed that allegedly in the second generation Chromolith, the column deformation observed for the first generation Chromolith, with the applied pressure at increasing flow, is decreased.

1. Introduction

Reversed phase liquid chromatography (RPLC) is the appropriate chromatographic mode for the separation of complex mixtures of compounds in a wide range of polarities [1,2,3]. For practical purposes, the separations are considered acceptable within the 2 < k < 10 range (or at least, 1 < k < 20), where k is the retention factor defined as:
k = t R t 0 t 0
tR being the retention time and t0 the dead time. In the isocratic mode, the elution strength is usually changed by varying the concentration of the organic modifier in the mobile phase. However, a proper separation is not always achieved within an acceptable time interval. In order to get both maximal resolution and minimal analysis time, a modifier gradient may be required to accelerate the elution of the most retained compounds [4,5,6].
An alternative to increasing the modifier concentration is increasing the flow rate in isocratic elution, or flow programming, so that this is increased during the elution. A change in the mobile phase flow rate accelerates or slows down peak elution, causing the chromatogram to be compressed or expanded, but without effects on the selectivity. However, the flow rate is rarely implemented as an experimental variable in RPLC, due to the narrow range of this factor that can be applied using conventional microparticulate columns, although some interesting reports on this topic have been published [7,8,9,10,11,12,13,14,15]. With conventional columns, the use of high flow rates is limited by the rapid increase in column back-pressure. This situation may change due to the emergence of highly permeable monolithic columns [16,17], which allow the application of relatively high flow rates at sufficiently low back-pressure.
The cooperation of a Japanese research group and the German company Merck led to the release in 2000 of the first monolithic silica-based column in the market, with the trade name Chromolith [18,19,20,21,22] (Phenomenex commercialises the same column as Onyx). Chromolith columns are synthesized in molds. Once demoulded, the material is encapsulated in PEEK (poly (ether ether ketone)) material, which is melted on the surface of the monolith. The monolith structure is bimodal and consists of macropores of size close to 2 μm, interconnected by channels through which the mobile phase flows, and mesopores of about 13 nm, similar to those found in the silica microparticles. In the monolith environment, solutes reach the mesopores by convection and not by diffusion, allowing the control of the mass transfer kinetics, and therefore, of the column efficiency. With low flow rates, Chromolith columns offer similar efficiencies to the classical RPLC columns with microparticles of 3‒5 µm in diameter, but in contrast to these columns, when working at high flow rates, the efficiency is maintained. In 2011, the second generation Chromolith columns were commercialised [23], with efficiency improvements, although the upper limit of the flow rate at which the column can be operated is smaller with respect to the first generation Chromolith columns.
In this work, the effect of the modifier concentration and flow rate on the chromatographic peak parameters (retention and width) is studied in the isocratic and gradient modes, using a second generation Chromolith column. The ultimate goal is to develop tools to obtain information to improve the separation performance, enabling faster optimised analysis.

2. Experimental Section

2.1. Reagents and Column

The isocratic and gradient elution of a set of probe compounds, the sulphonamides sulphamerazine, sulphachloropyridazine, sulphisoxazole, and sulphaquinoxaline, purchased from Sigma (St. Louis, MO, USA), was studied. The compounds were dissolved with water to reach the concentrations of the stock and injected solutions (100 and 10 µg/mL, respectively), and stored in the darkness at 4 °C. The separations were carried out with a 50 mm × 4.6 mm ID Chromolith® SpeedROD C18 column from Merck (Darmstadt, Germany).
In all cases, the mobile phases were prepared with HPLC-grade acetonitrile from Scharlau (Barcelona, Spain), in the concentration range between 5 and 55% (v/v). The acetonitrile-water mixtures were buffered at pH 3.0 using 0.01 M disodium hydrogen phosphate from Panreac (Barcelona, Spain) and HCl from Scharlau. The mobile phase flow rate was varied in the 0.1‒5.0 mL/min range.
Nanopure water obtained with a Barnstead purification system from Sybron (Boston, MA, USA) was used throughout. Mobile phases and the solutions of the probe compounds were filtered through 0.45 μm Nylon membranes with a diameter of 47 mm (Magna) and 17 mm (Cameo), respectively, from Osmonics (Herentals, Belgium).
Maximal pressure was 120 bar, reached at 5.0 mL/min. The dead time was measured from the first perturbation in the chromatogram, with a mean value of 0.80 ± 0.02 min at 1 mL/min. The dwell time in modifier gradient elution was 0.89 min at 1 mL/min. Both dead and dwell times changed proportionally to the applied flow rate.

2.2. Apparatus

The HPLC system was equipped with the following modules from Agilent (Waldbronn, Germany): quaternary pump, autosampler, thermostated column compartment and UV-visible detector (Series 1100, 1200 and 1260). The signals were monitored at 254 nm and the temperature was 25 °C. Duplicate injections (20 µL) were carried out for all compounds.
The pH was measured with a precision of ±0.002 pH units, using a potentiometer from Crison (Model MicropH 2002, Barcelona, Spain) and a combined glass electrode containing Ag/AgCl reference electrodes with 3.0 M KCl aqueous solution as salt bridge from Orion (Model 8102, Barcelona, Spain). The electrode was calibrated with aqueous buffers, and the pH of the mobile phases was measured after the addition of the organic solvent.
The chromatographic system was controlled through an OpenLAB CDS LC ChemStation from Agilent (B.04.03). Data treatment was implemented in an Excel spreadsheet from Microsoft (Seattle, WA, USA).

3. Results and Discussion

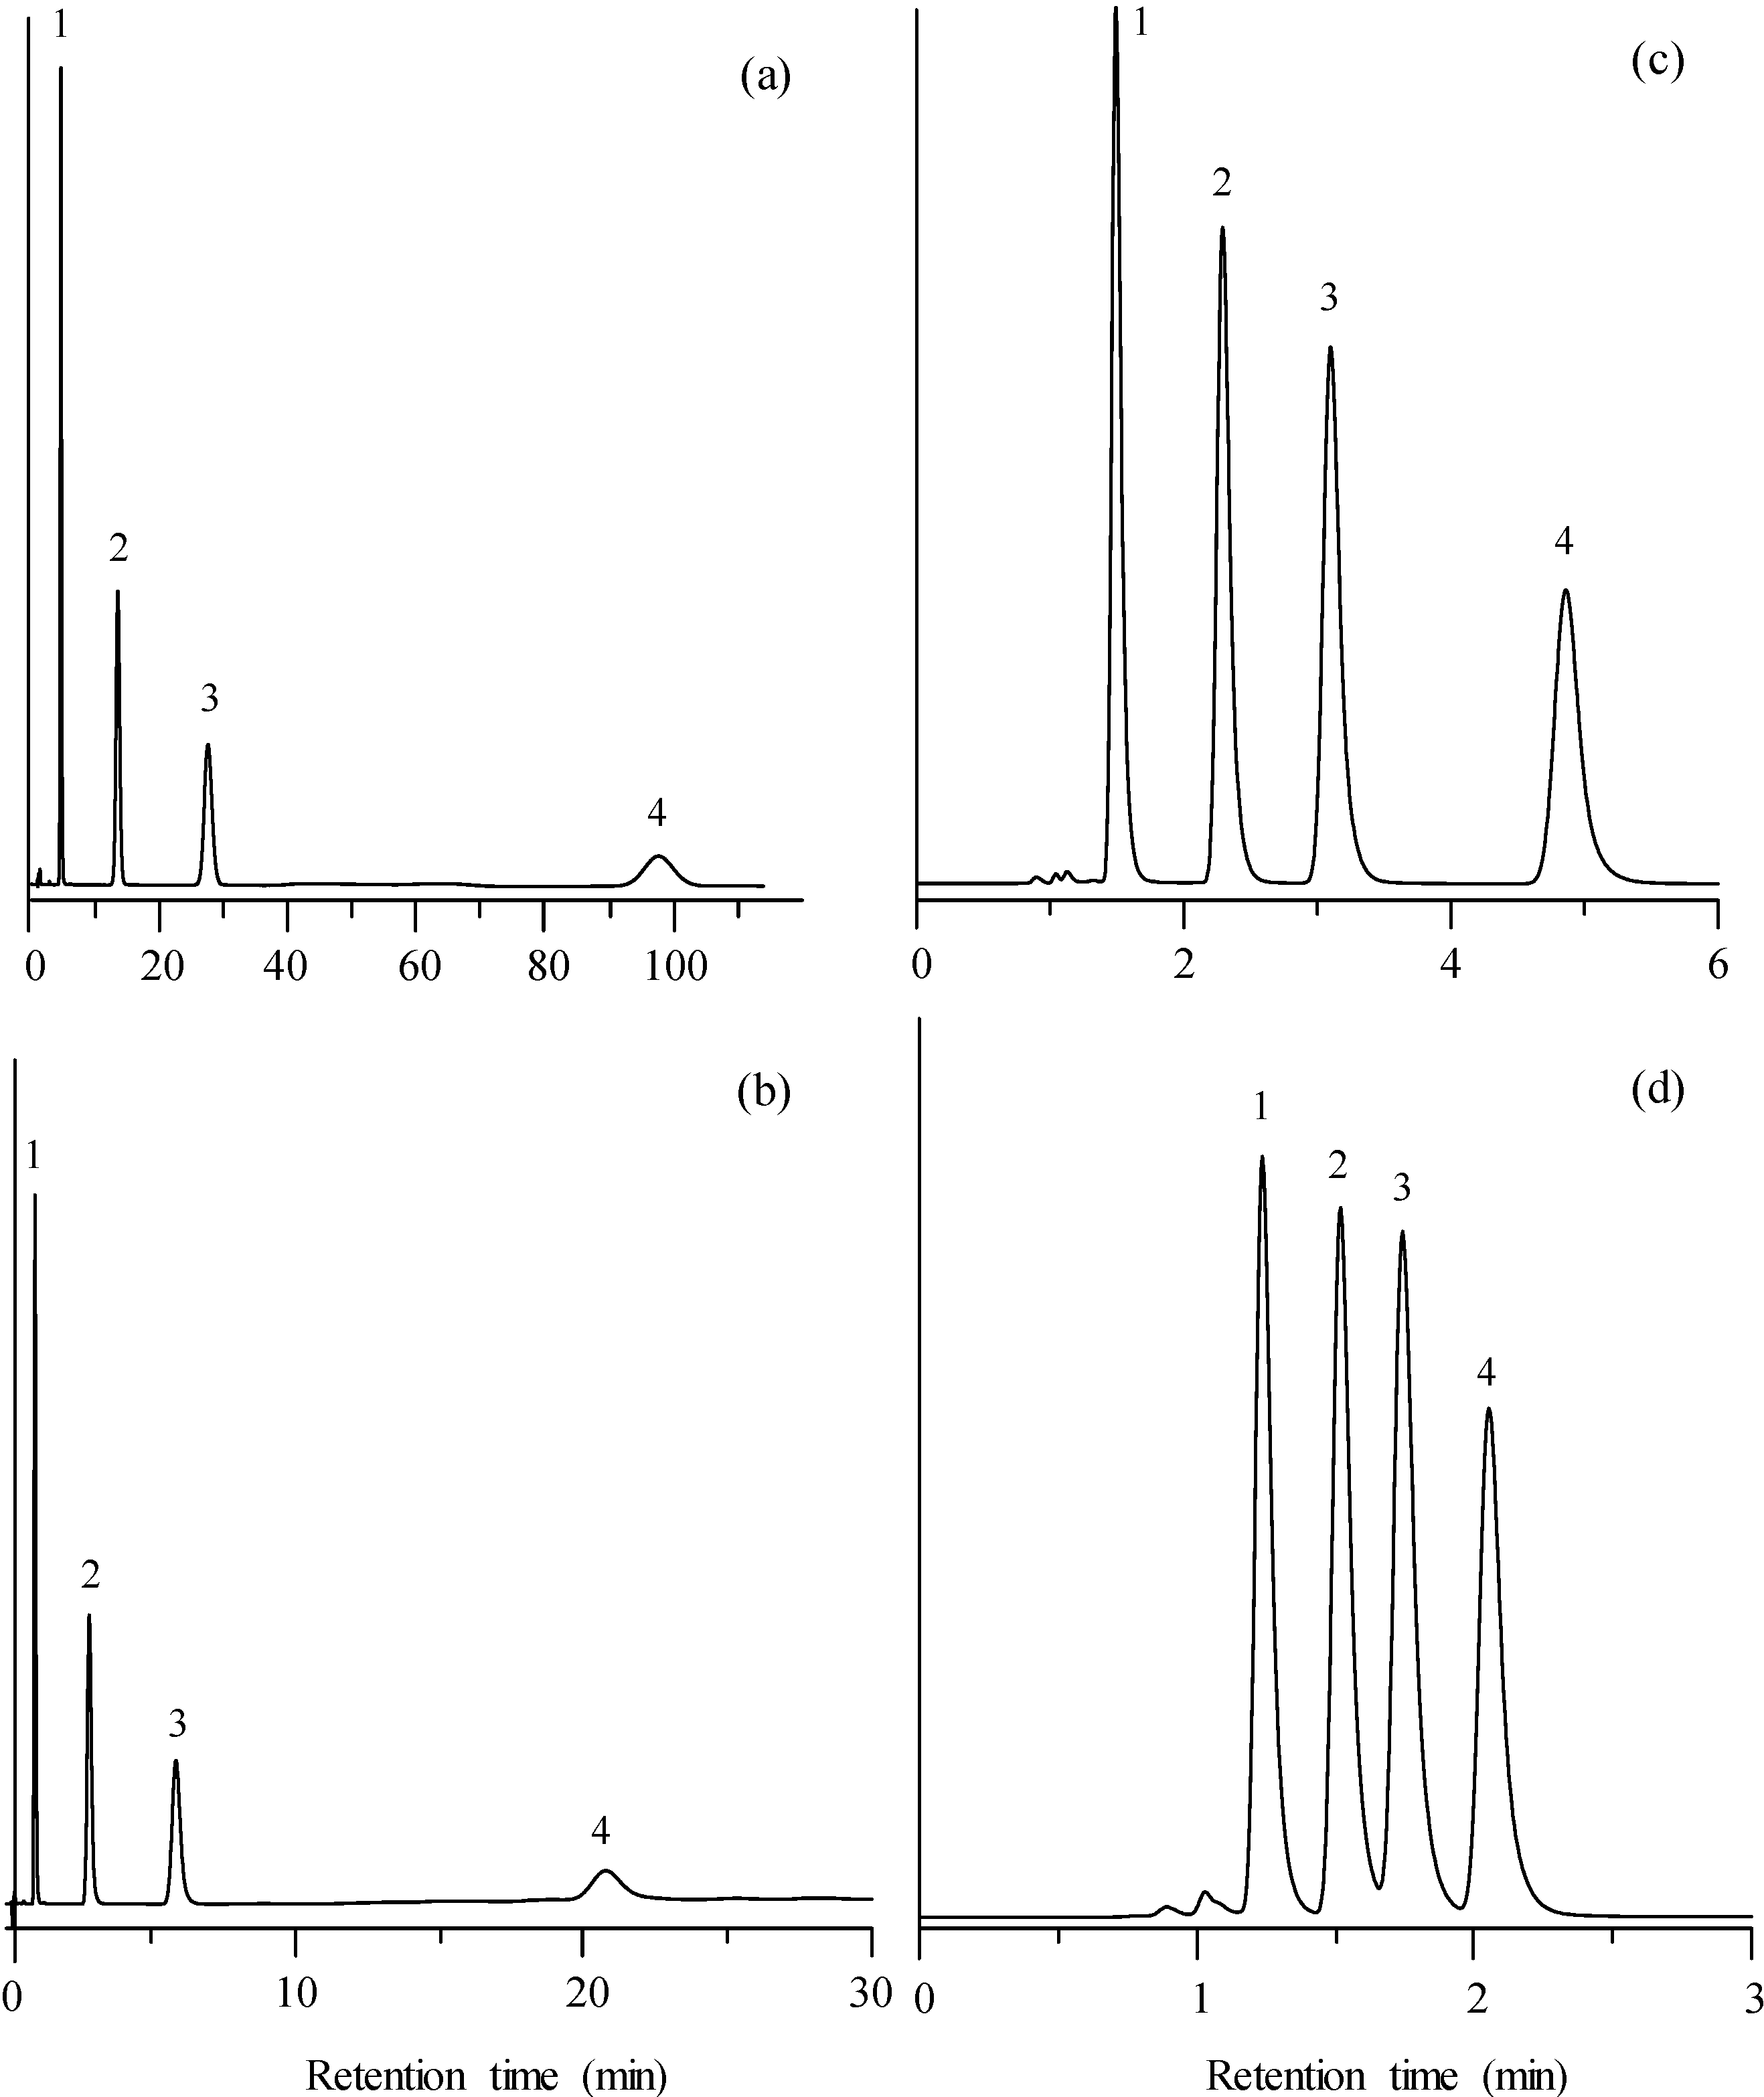
3.1. Chromatograms Obtained at Diverse Experimental Conditions

3.1.1. Isocratic Elution

The two most direct strategies to reduce the retention times in isocratic elution are the increase of modifier percentage in the mobile phase and the increase of flow rate. In Figure 1a,c,d, the effect of an increasing concentration of acetonitrile (in the 5%‒30% range) on the chromatographic peaks of a mixture of four sulphonamides, using fixed flow rate of 1 mL/min, is shown. By increasing the acetonitrile percentage in the mobile phase, the analysis time was reduced from ca. 100 min (for 5% acetonitrile) to 2.2 min (for 30% acetonitrile). Despite the decrease in the peak width at smaller retention times, a slight overlapping is observed at 30% acetonitrile. The overlapping was increased for 40% and 55% acetonitrile.
Figure 1. Chromatograms obtained for the mixture of sulphonamides in the isocratic mode, at diverse concentrations of acetonitrile and flow rates: (a) 5% and 1 mL/min, (b) 5% and 5 mL/min, (c) 20% and 1 mL/min, and (d) 30% and 1 mL/min. Compounds: (1) sulphamerazine, (2) sulphachloropyridazine, (3) sulphisoxazol, and (4) sulphaquinoxaline.
Chromatography 01 00194 g001
Figure 1a,b shows the proportional effect of the flow rate on retention. Thus, for 5% acetonitrile, a five-fold reduction in the analysis time was obtained, from ca. 100 min at 1 mL/min to ca. 20 min at 5 mL/min, which was the maximal flow rate reached by the instrument. The proportional effect affected equally all peaks, resulting in similar chromatograms.

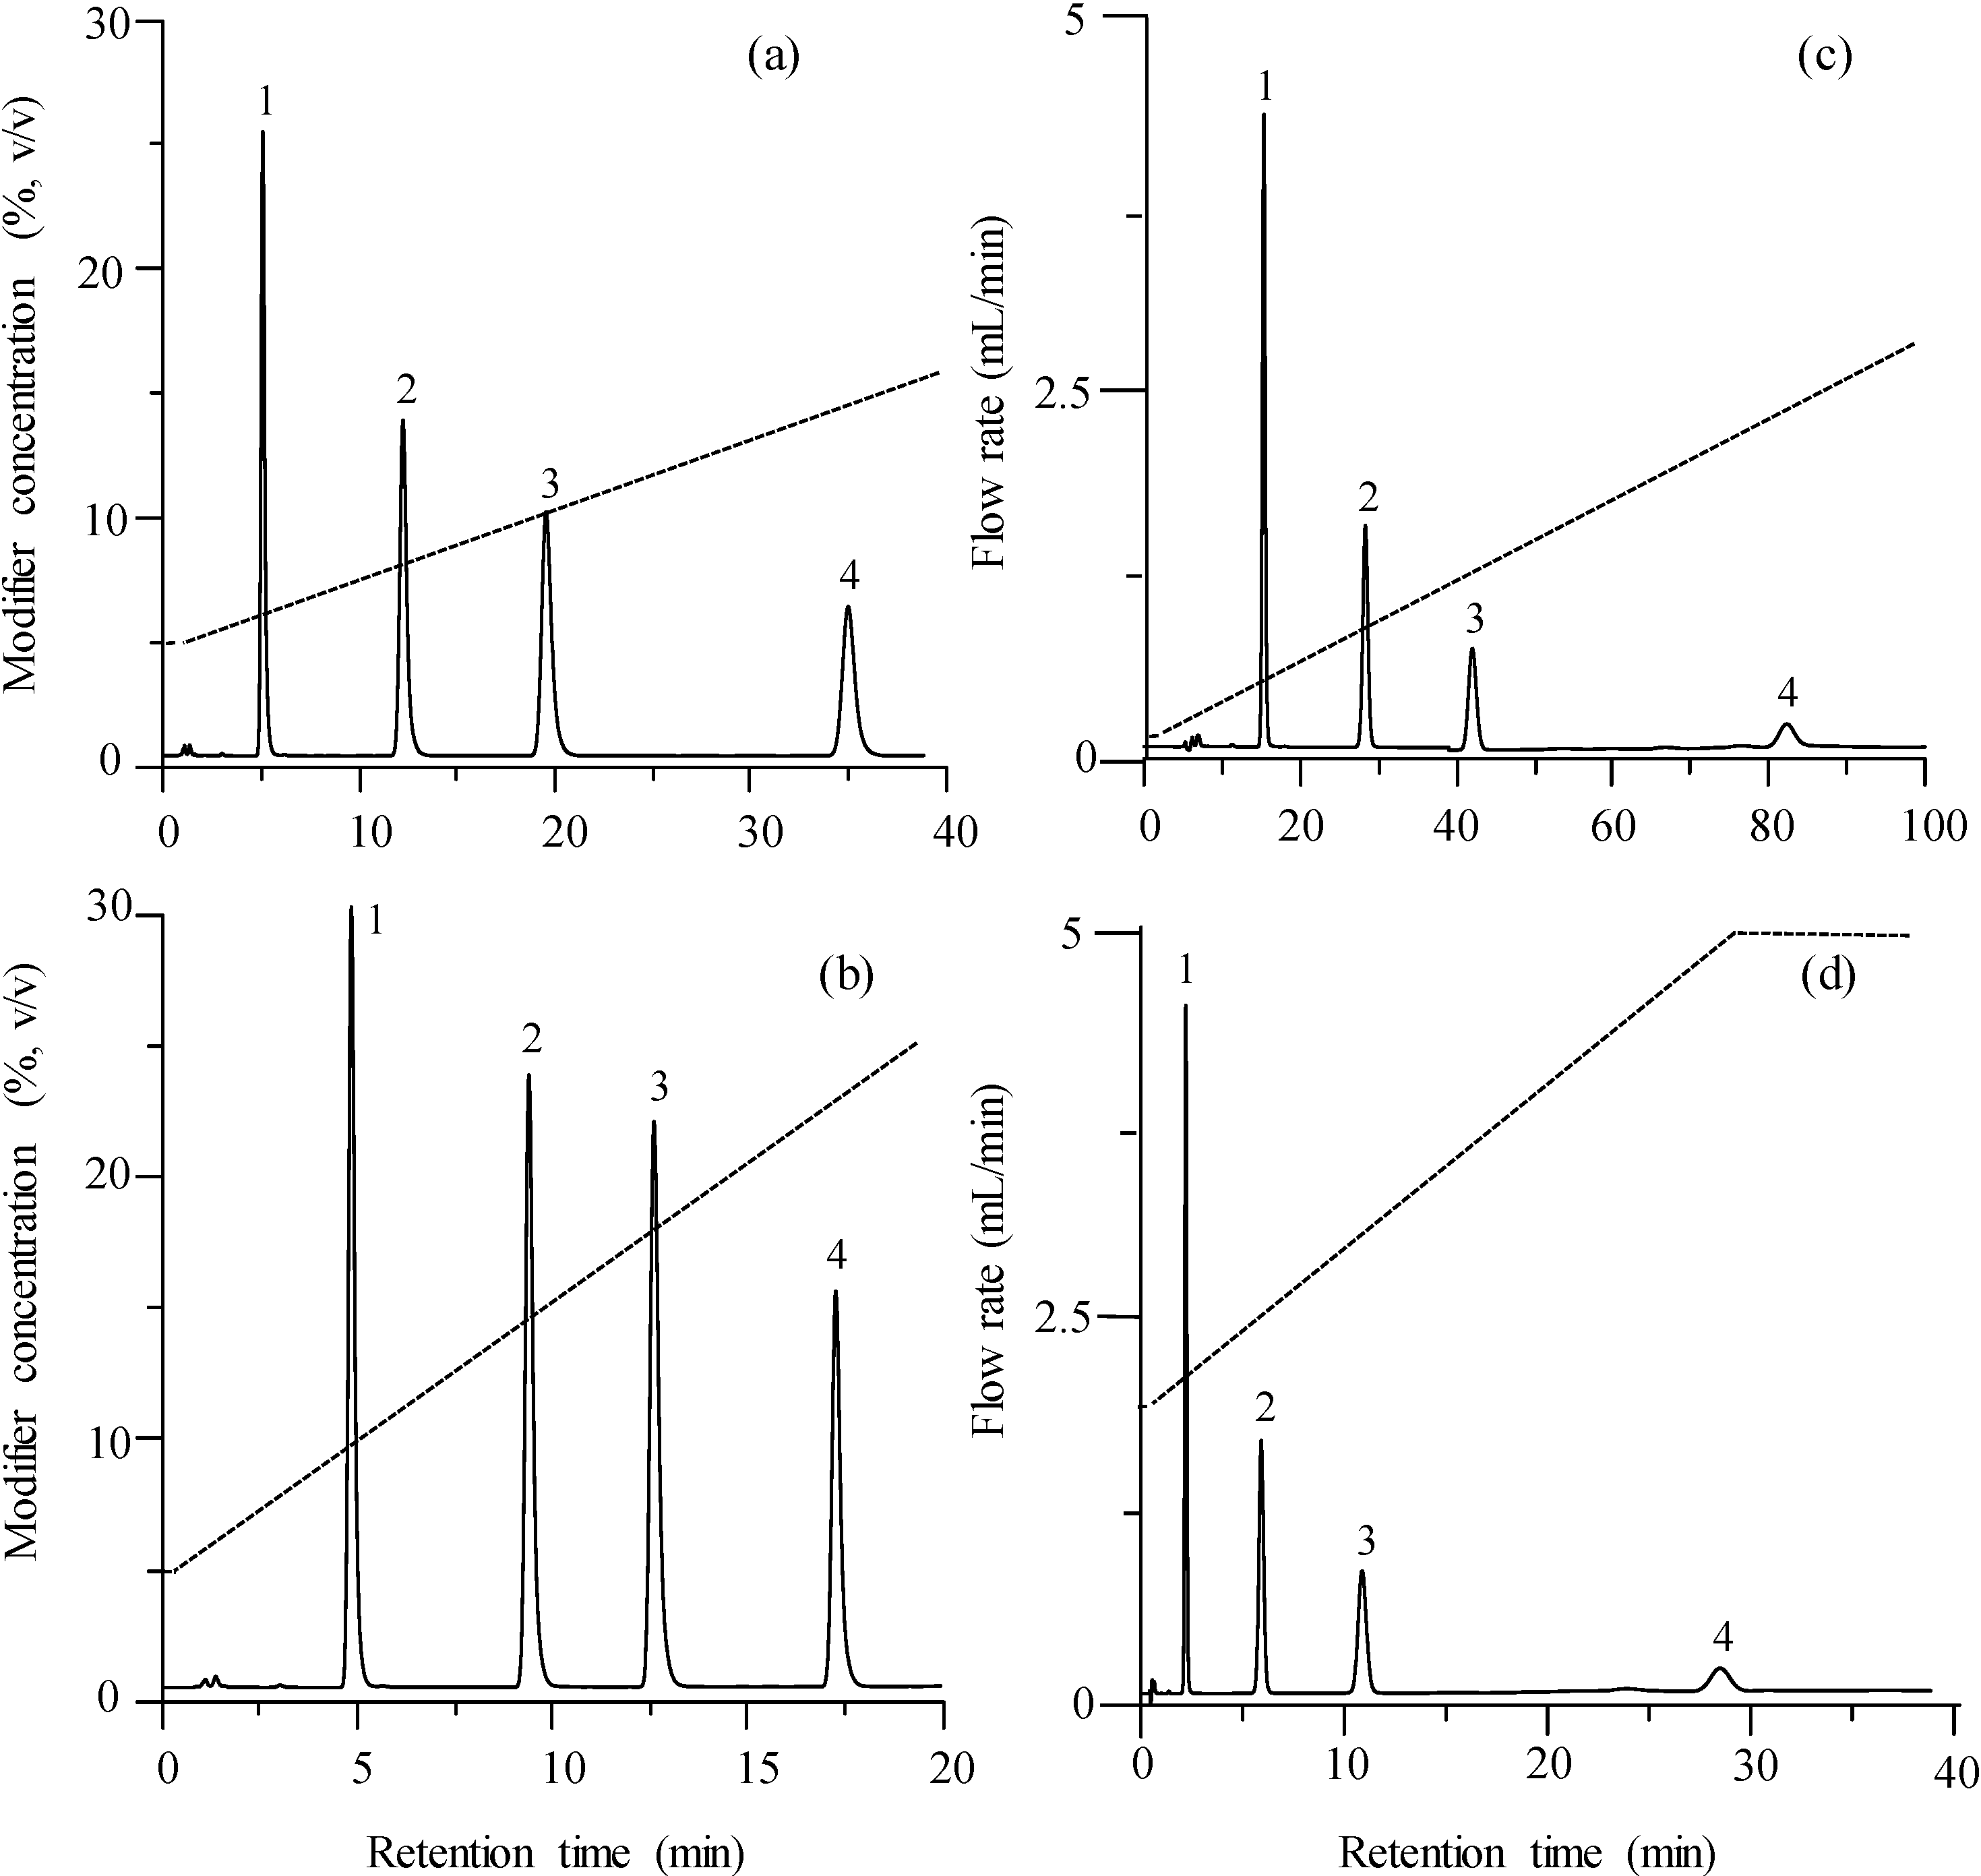
3.1.2. Gradient Elution

The application of gradient elution reduces the analysis time and the distance between the peaks in the chromatogram—with regard to the isocratic elution—due to the gradual increase in the elution strength. Figure 2a,b shows the effect of the application of two different modifier gradients (at fixed flow rate), and Figure 2c,d the effect of two different flow gradients (at fixed modifier concentration). Modifier gradient elution gives rise to a better peak distribution and a marked decrease in peak width. Flow programming yields chromatograms similar to those shown in Figure 1a,b. If instead of time units, volume units were used to represent the chromatograms, little change would be expected with the flow.
Figure 2. Chromatograms obtained for the mixture of sulphonamides using gradient elution: (a) modifier gradient in the 5%–15% range at 1 mL/min, (b) modifier gradient in the 5%–25% range at 1 mL/min, (c) flow programming in the 0.1–2.7 mL/min range at fixed 5% acetonitrile, (d) flow programming in the 2.0–5.0 mL/min range at fixed 5% acetonitrile. For peak identity, see Figure 1.
Chromatography 01 00194 g002

3.2. Description of the Retention Using the Modifier Concentration and Flow Rate as Factors

Instead of the direct observation of chromatograms, it is more useful to extract the relevant information (i.e., retention times and peak half-widths) and structure it to get a clear overview of the trend of the chromatographic behaviour for the eluted compounds. This is true even with a simple problem like the elution of a mixture of four compounds using the Chromolith column, as discussed below. With problems that show more complex behaviour, such studies may be essential. Next, the retention behaviour using the modifier concentration and flow rate as factors, in isocratic and gradient elution, is examined.

3.2.1. Isocratic Elution

3.2.1.1 Effect of the Modifier Content on the Retention

In Figure 3, the retention of the four probe compounds in isocratic elution, expressed as k (Figure 3a) or as natural logarithm of k (Figure 3b), is depicted as a function of the modifier concentration, φ. The runs were made using a flow rate of 1 mL/min, but similar plots were obtained for flow rates in the 0.125‒5.0 mL/min range. It can be seen that in the 5%‒30% acetonitrile range, the plot for ln k is slightly parabolic, which is usual for wide modifier ranges, so that the retention can be described by:
ln k = ln kw + 2
where kw is the retention factor using water as mobile phase, and a and b are fitting parameters [24,25].
After fitting the experimental data to Equation (2), the retention can be predicted as a function of the modifier concentration in a wide range. For sufficiently short ranges, Equation (2) can be assimilated to a straight-line (the quadratic term is eliminated).
Figure 3. Chromatographic behaviour of the sulphonamides in the isocratic mode: (a,b) Effect of the concentration of modifier on the retention at 1 mL/min, and (c,d) effect of the flow rate F on the retention at 10% acetonitrile. Compounds: sulphamerazine (○), sulphachloropyridazine (●), sulphisoxazol (◊), and sulphaquinoxaline (♦).
Chromatography 01 00194 g003aChromatography 01 00194 g003b

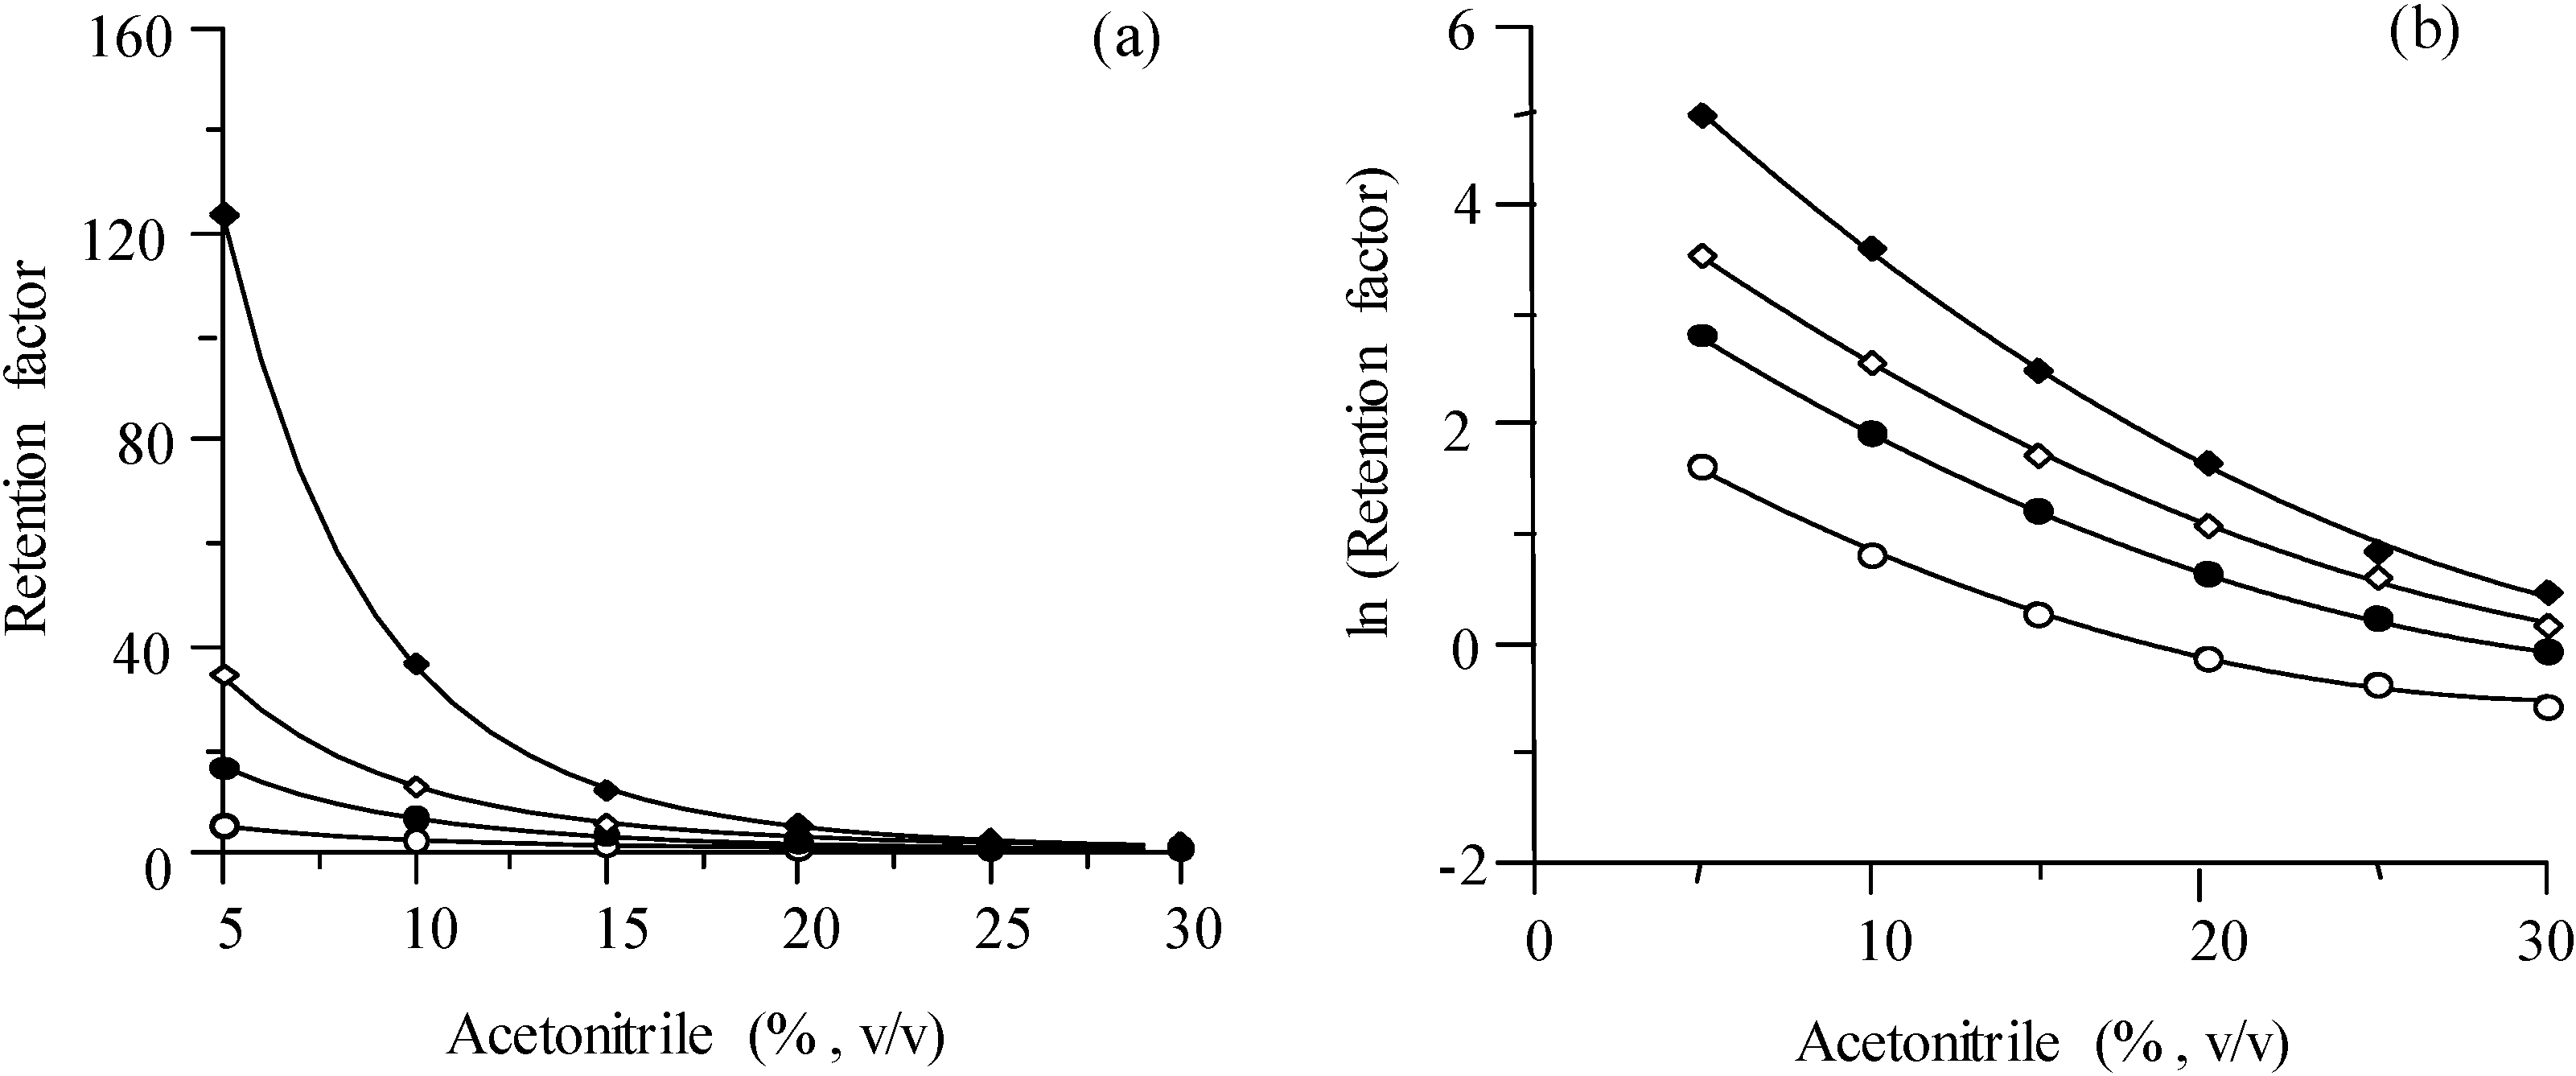
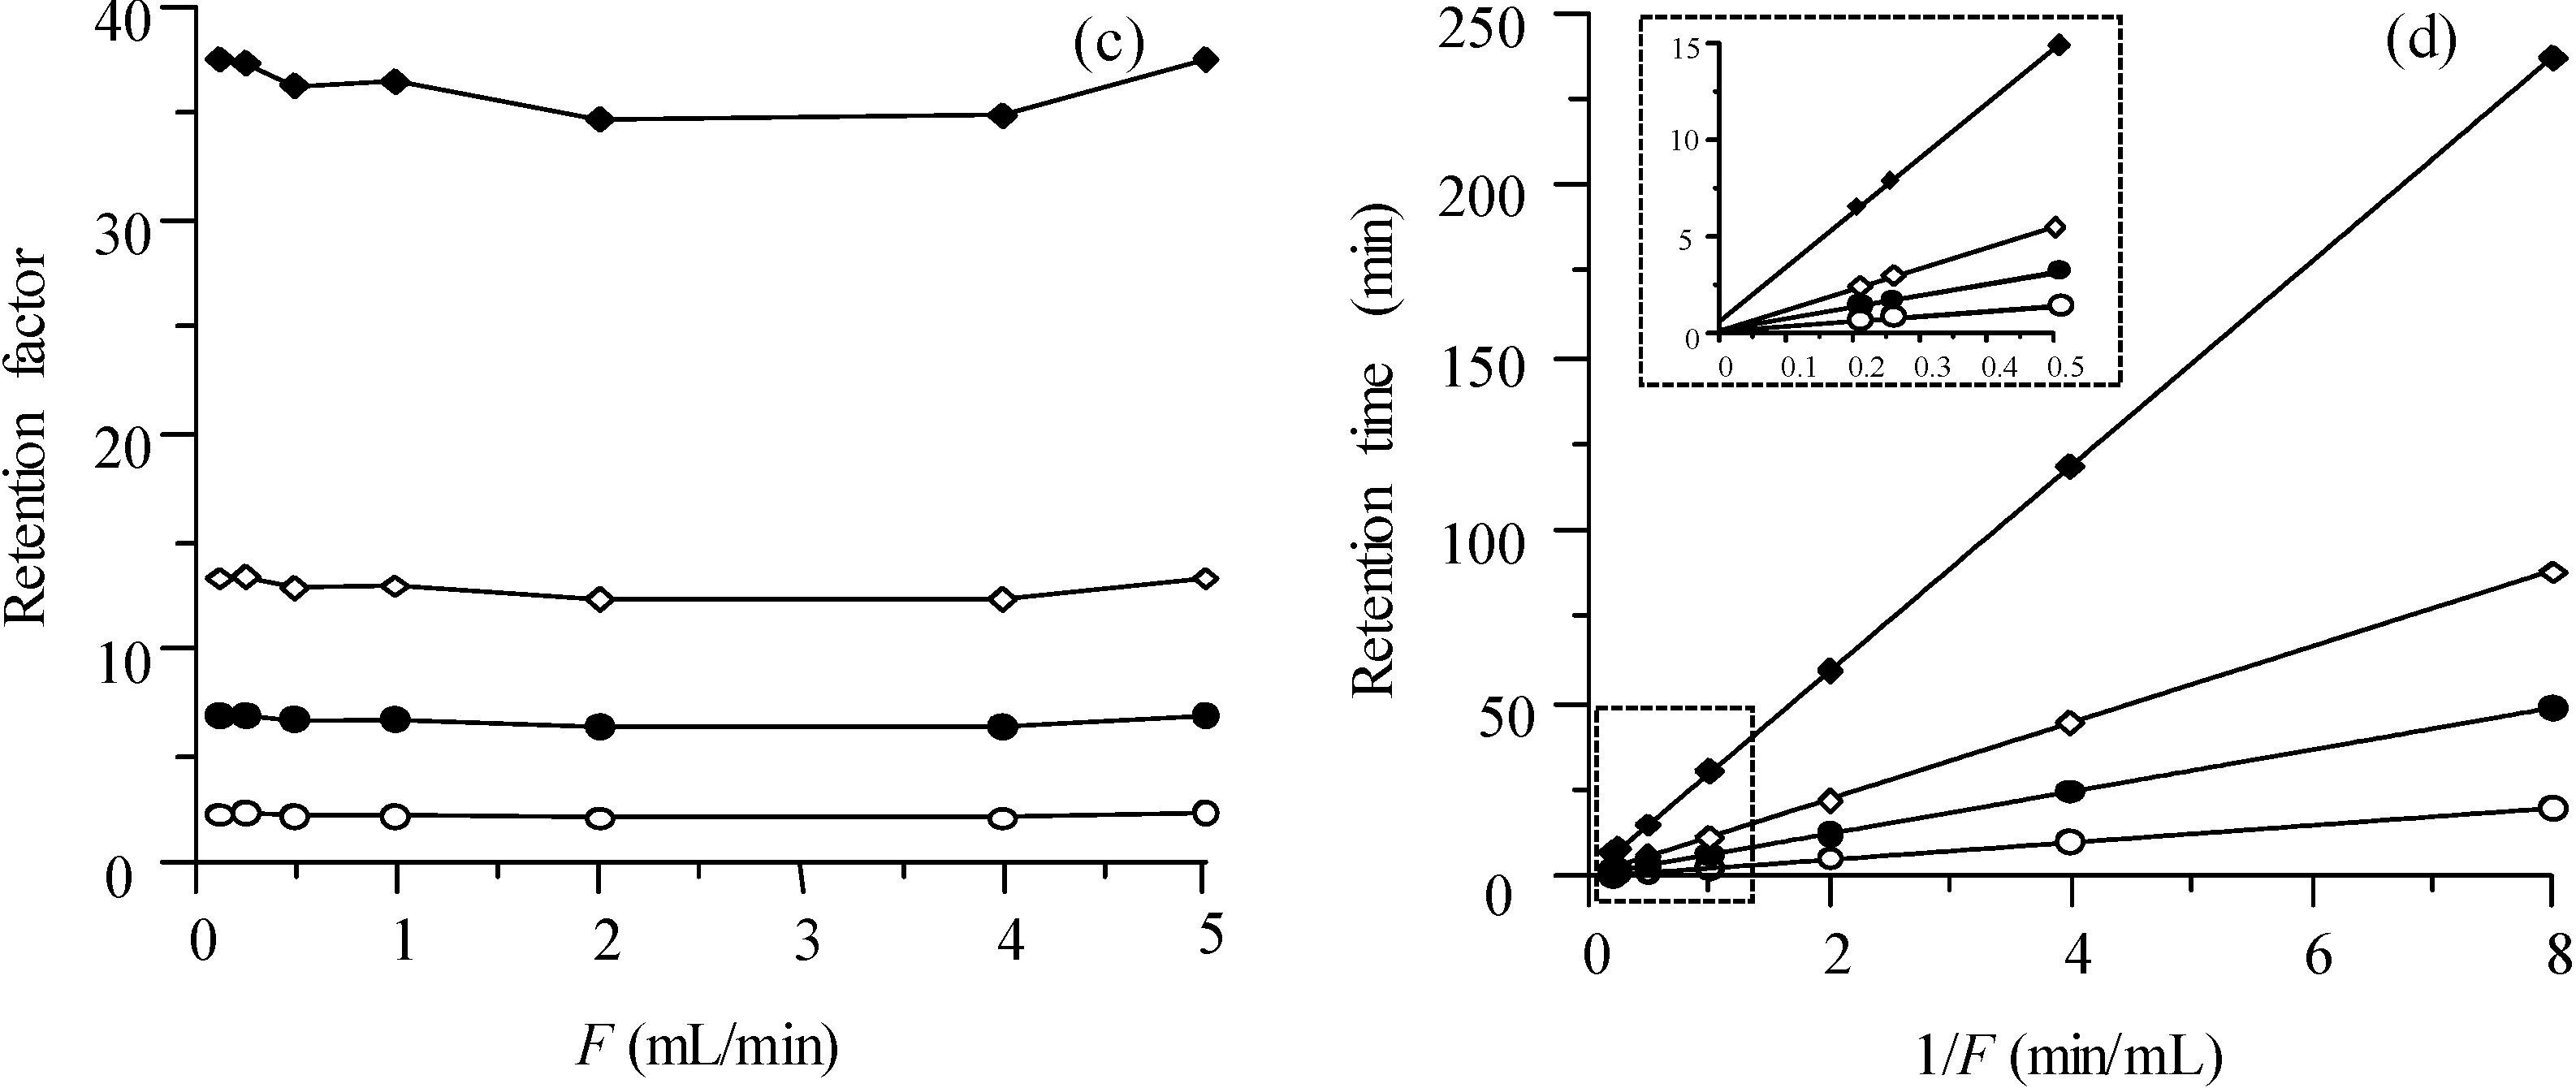
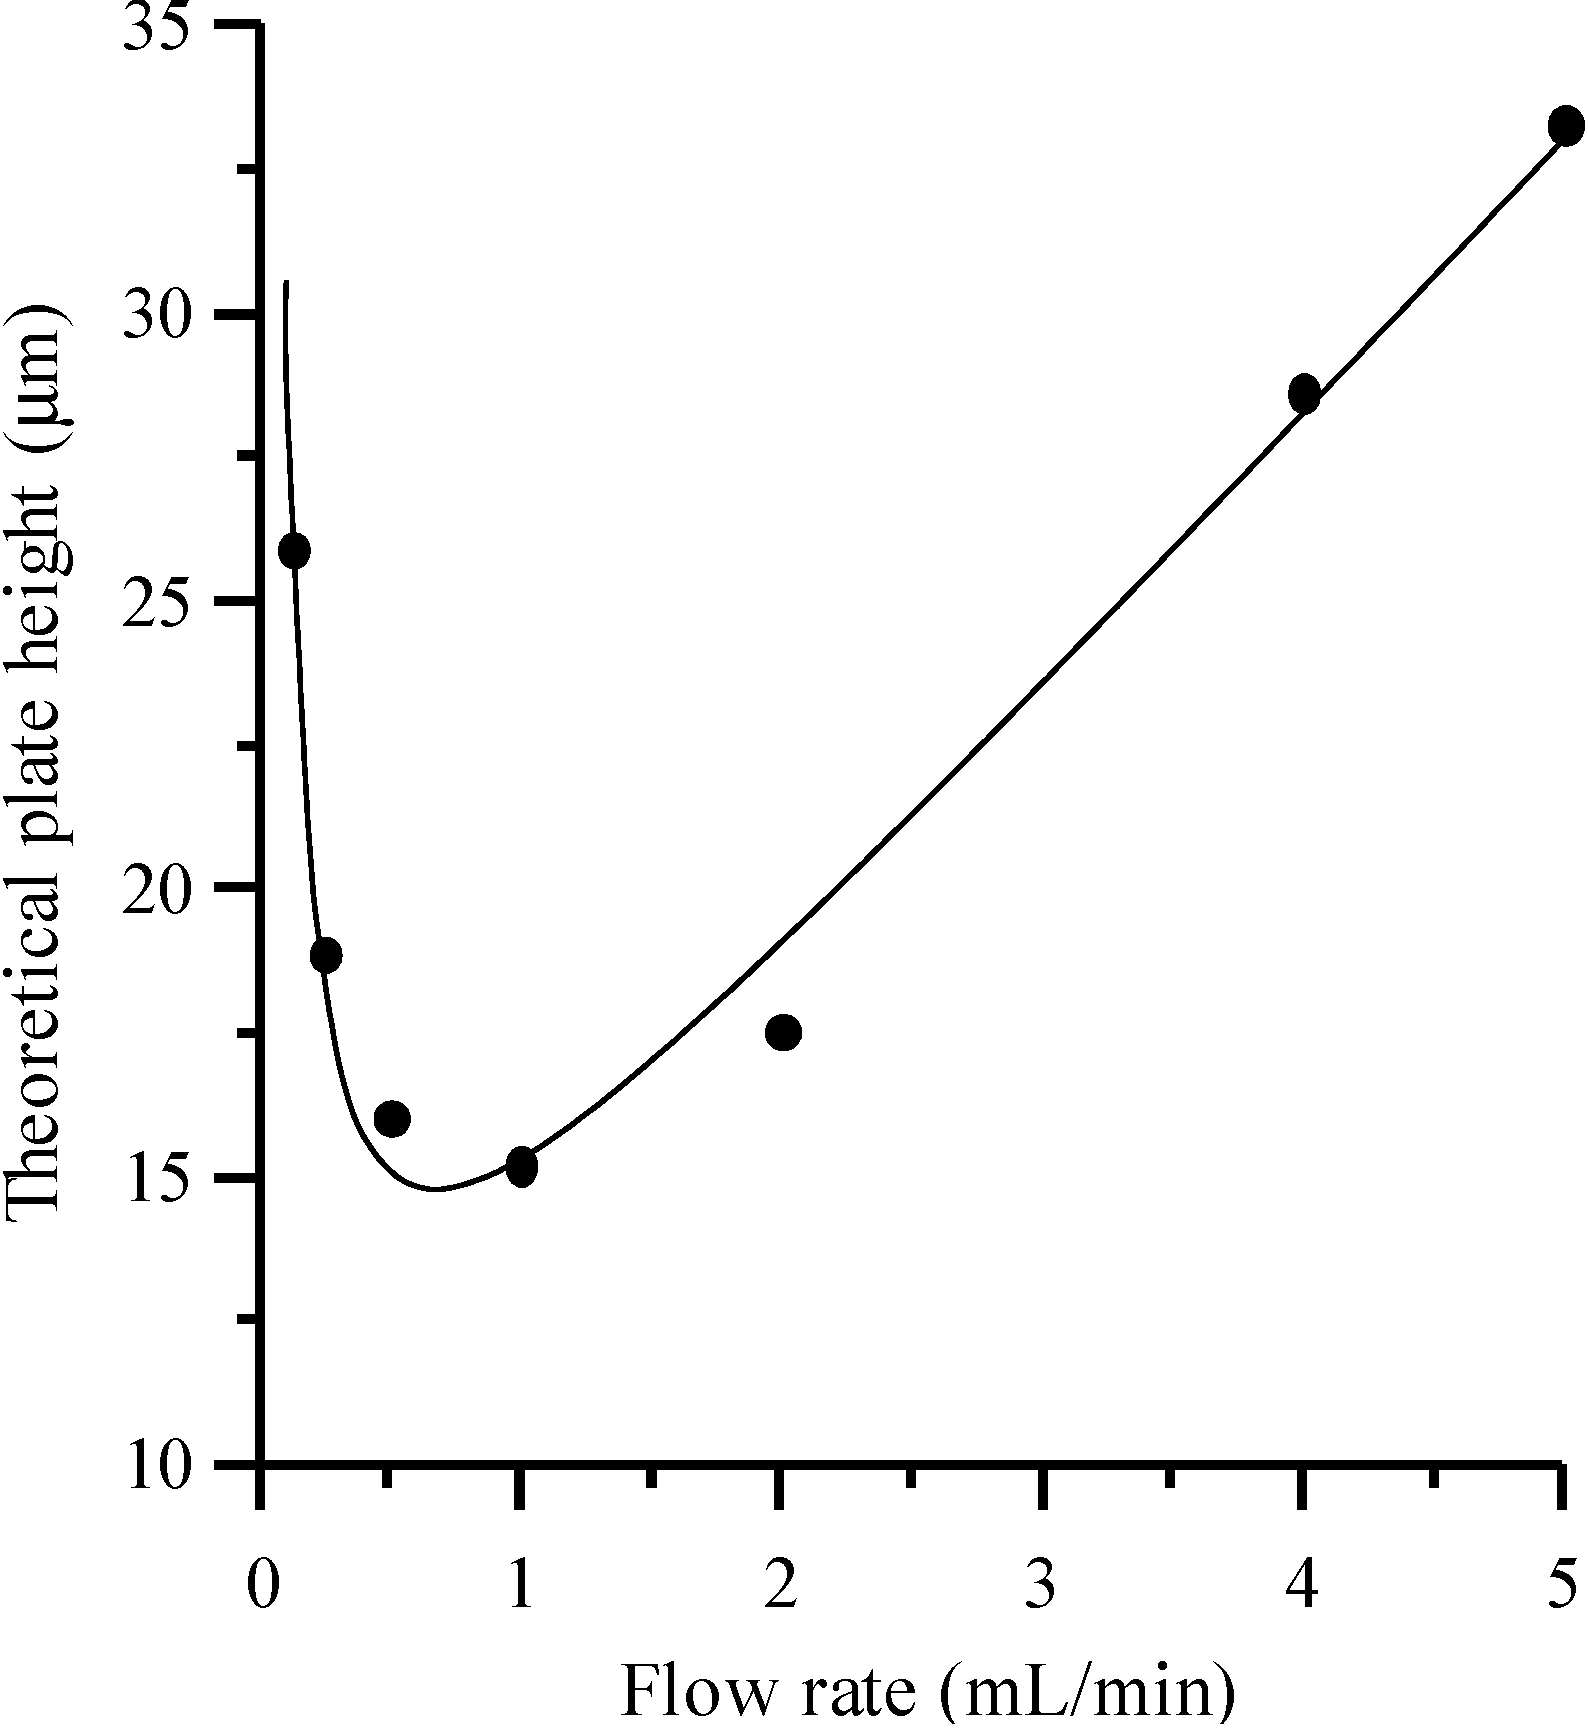
3.2.1.2. Effect of the Flow Rate on the Retention

The retention factor is plotted in Figure 3c at different mobile phase flow rates for the Chromolith column, using 10% acetonitrile. Similar plots were obtained with other acetonitrile concentrations in the mobile phase. Theoretically, the retention factor should not depend on the flow (only on the distribution equilibrium), since it is a relative parameter (Equation (1)): the flow should affect equally analyte and dead time marker. Figure 3d depicts the retention expressed as retention time tR for different values of the reversed flow rate, in the range between 0.125 and 5.0 mL/min. The lines in the plot can be fitted to:
t R = c 0 + c 1 F
where F is the flow rate [26,27]. The determination coefficients for the fitted straight-lines were above 0.9999 for the four sulphonamides. If k did not depend on the flow rate, the intercept c0 would be null.
In similar experiences carried out with a first generation Chromolith column [28] (the column used in this study belongs to the second generation), the intercept (c0) of the tR vs. 1/F plot was found significant, with values that increased at increasing retention (for more apolar compounds). Since c0 for the dead time marker was significantly smaller, k depended on the flow rate. Although we have observed that in the second generation Chromolith column c0 is still positive, it is reduced to less than half the value obtained for the first generation Chromolith. This behaviour was interpreted to be produced by the deformation of the PEEK tube used to encapsulate the silica monolith, due to the increased pressure associated to higher flow rates [28]. In the second generation column, a more compact packing has been apparently achieved, which prevents, at least partially, the deformation of the column with the applied pressure.

3.2.2. Gradient Elution

3.2.2.1. Linear Modifier Gradients

The effect of a modifier gradient on the retention is far more complex than the effect of a fixed concentration of modifier in isocratic elution. In gradient elution, the retention is usually described by an integral equation, which has been called “fundamental equation for gradient elution” [4].
t 0 = 0 t R t 0   d t k ( φ ( t ) )
where φ is the modifier concentration at the solute location along its migration inside the column, and tg the time the solute requires to go through the whole column. The k(φ(t)) function describes the change in the instantaneous retention factor as the gradient progresses, t being the time measured at the column inlet. This function involves two nested equations: the retention factor dependency with the organic modifier (i.e., the retention model, such as Equation (2)), and the change in the modifier concentration with time (i.e., the gradient program). In this work, only linear gradients were considered:
φ = φ0 + m t
where φ0 is the modifier concentration at the beginning of the gradient, and m the slope of the gradient program. In principle, it is not possible to perform the analytical integration of Equation (4) using the quadratic model (Equation (2)) to describe the instantaneous retention. The integral should be solved numerically. However, recently, we have proposed the following equation to predict the retention time using a linear modifier gradient and Equation (2) [25,29]:
Chromatography 01 00194 i001
where td is the dwell time and
k 0 = e ln k w a φ 0 + b φ 0 2
which is similar to the solution of the fundamental equation for a linear retention model (Equation (2) without the quadratic term). Equation (6) has been demonstrated to be useful for solutes that present a slight parabolic variation of ln k, as is the case of the sulphonamides used as probe compounds in this work (see Figure 3b), and indeed a frequent case.
Figure 4a,c shows the change of ln k as a function of the initial modifier concentration in the gradient, for the four sulphonamides. The line representing the isocratic elution (top line, for which the gradient slope is m = 0) is also included. As observed, the difference in retention between isocratic and gradient elution is larger at smaller initial modifier concentrations in the gradient; hence, the triangular shape of the diagram [25]. Furthermore, the effect of the gradient is larger for more retained compounds and negligible for those weakly retained.
Figure 4. Chromatographic behaviour of the sulphonamides in the gradient mode: (a,c) Effect of modifier gradients with different initial acetonitrile concentration and gradient slopes (from top to bottom: m = 0, 0.5, 1.0 and 2.0, see Equation (5)), and (b,d) effect of flow programming with different initial flow rates and gradient slopes (from top to bottom: b = 0, 0.05, 0.10, 0.20, see Equation (10)). The parameters used in Equations (6) and (13) were: sulphamerazine (ln kw = 2.56, a = 0.21, b = 0.0037, c1 = 2.54), sulphachloropyridazine (ln kw = 3.86, a = 0.23, b = 0.0033, c1 = 6.10), sulphisoxazol (ln kw = 4.70, a = 0.25, b = 0.0033, c1 = 11) and sulphaquinoxaline (ln kw = 6.19, a = 0.29, b = 0.0030, c1 = 30). Compounds: sulphamerazine (○), sulphachloropyridazine (●), sulphisoxazol (◊), and sulphaquinoxaline (♦).
Chromatography 01 00194 g004

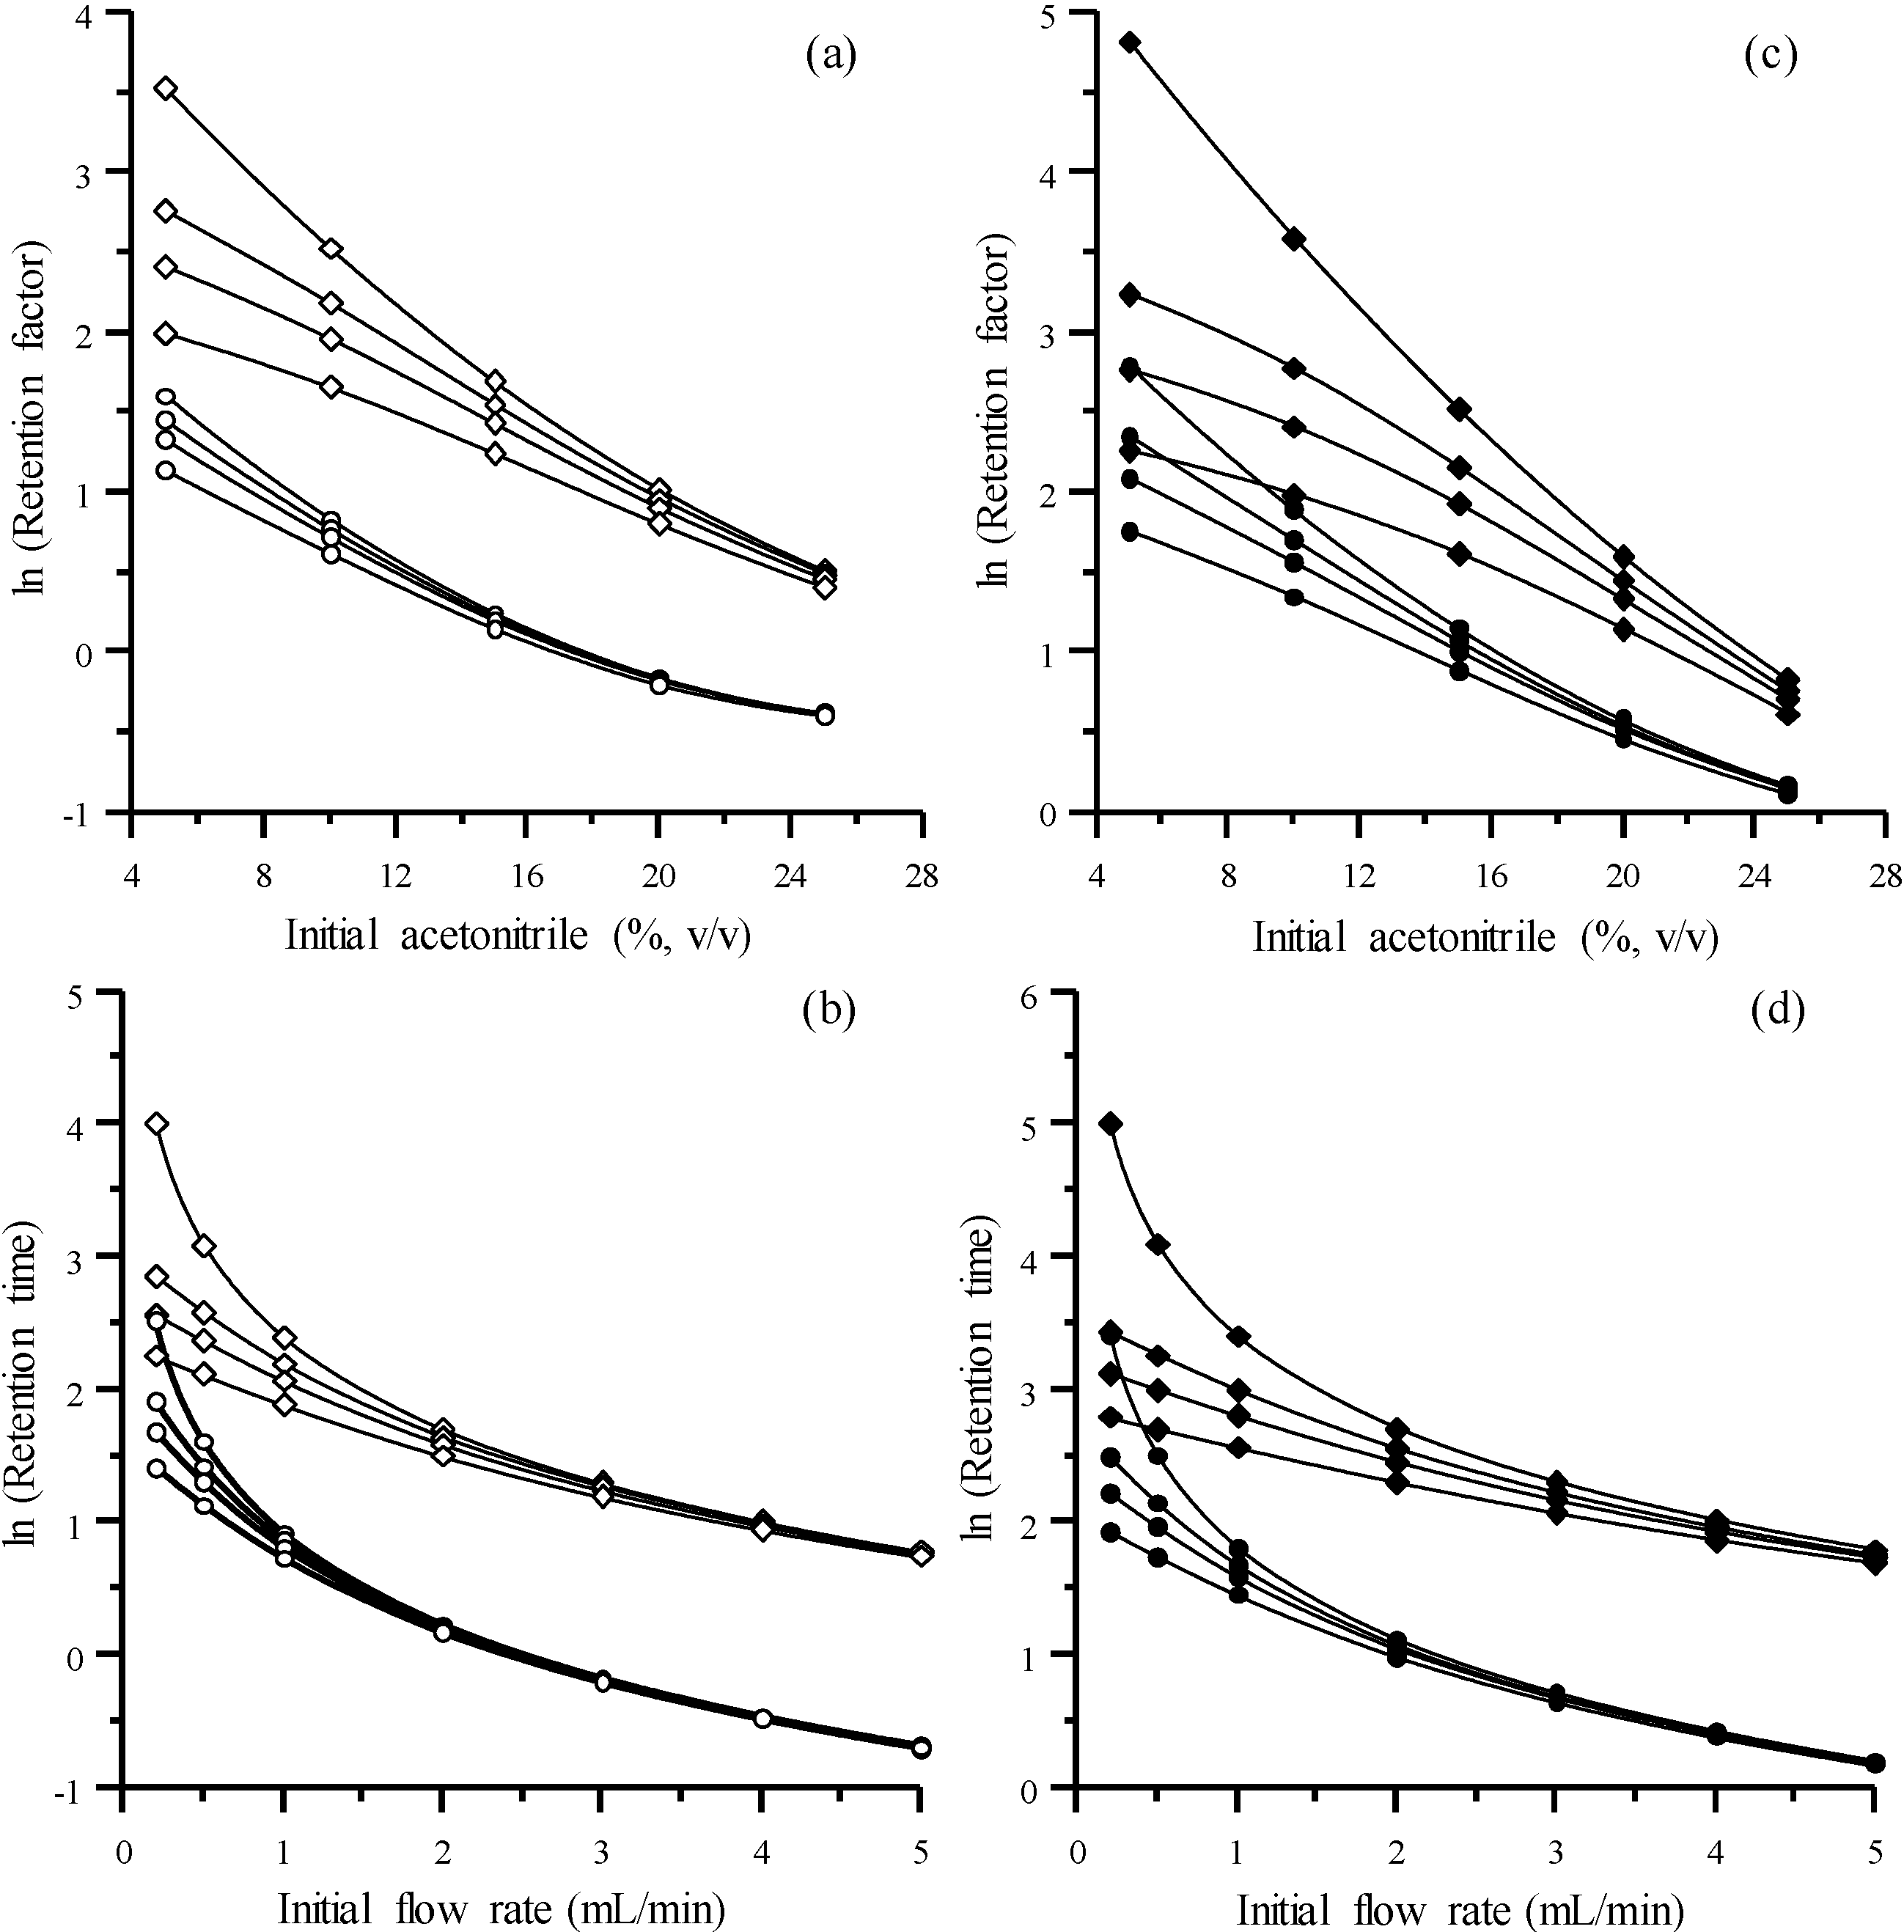
3.2.2.2. Linear Flow Gradients

The description of the retention when flow programming is applied, keeping the modifier concentration constant, cannot be performed using the “fundamental equation of gradient elution” (Equation (4)). In this case, the so-called “general gradient equation” should be used [13,29]:
d l d t = L t R ( F )
where L is the total column length, tR is the instantaneous retention at a given time t measured from the beginning of the gradient, and F the mobile phase flow rate. Taking into account Equation (3), and assuming c0 = 0:
d l = L F c 1 d t
where c1 equals the mobile phase volume needed to elute the analyte or the isocratic retention time for F = 1 mL/min. Considering a linear flow gradient with an initial flow rate F0 and a constant increasing rate b:
F = F0 + b t
the following integral equation is obtained:
Chromatography 01 00194 i002
which is solved as:
c 1 = F 0 t g + b 2 t g 2
Finally, the following equation is obtained to describe the retention for a solute with a behaviour defined by c1, and a linear flow gradient defined by F0 and b:
Chromatography 01 00194 i003
The parameter c1 can be obtained from isocratic data (from the linear fitting to Equation (3) with c0 = 0), or from gradient data (from Equation (13)). In this work, the prediction errors were below 3% using the isocratic data, and below 1% using the gradient data, which gives an indication of the accuracy of both approaches.
Figure 4b,d shows the effect of F0 and b (Equation (10)) on the retention using flow programming. It may be observed that the flow gradient is more effective for smaller initial flows. On the other hand, the most retained compounds show higher acceleration than those weakly retained (as it is also the case with modifier gradients), since most retained compounds experience the gradient during a longer time with respect to weakly retained compounds.

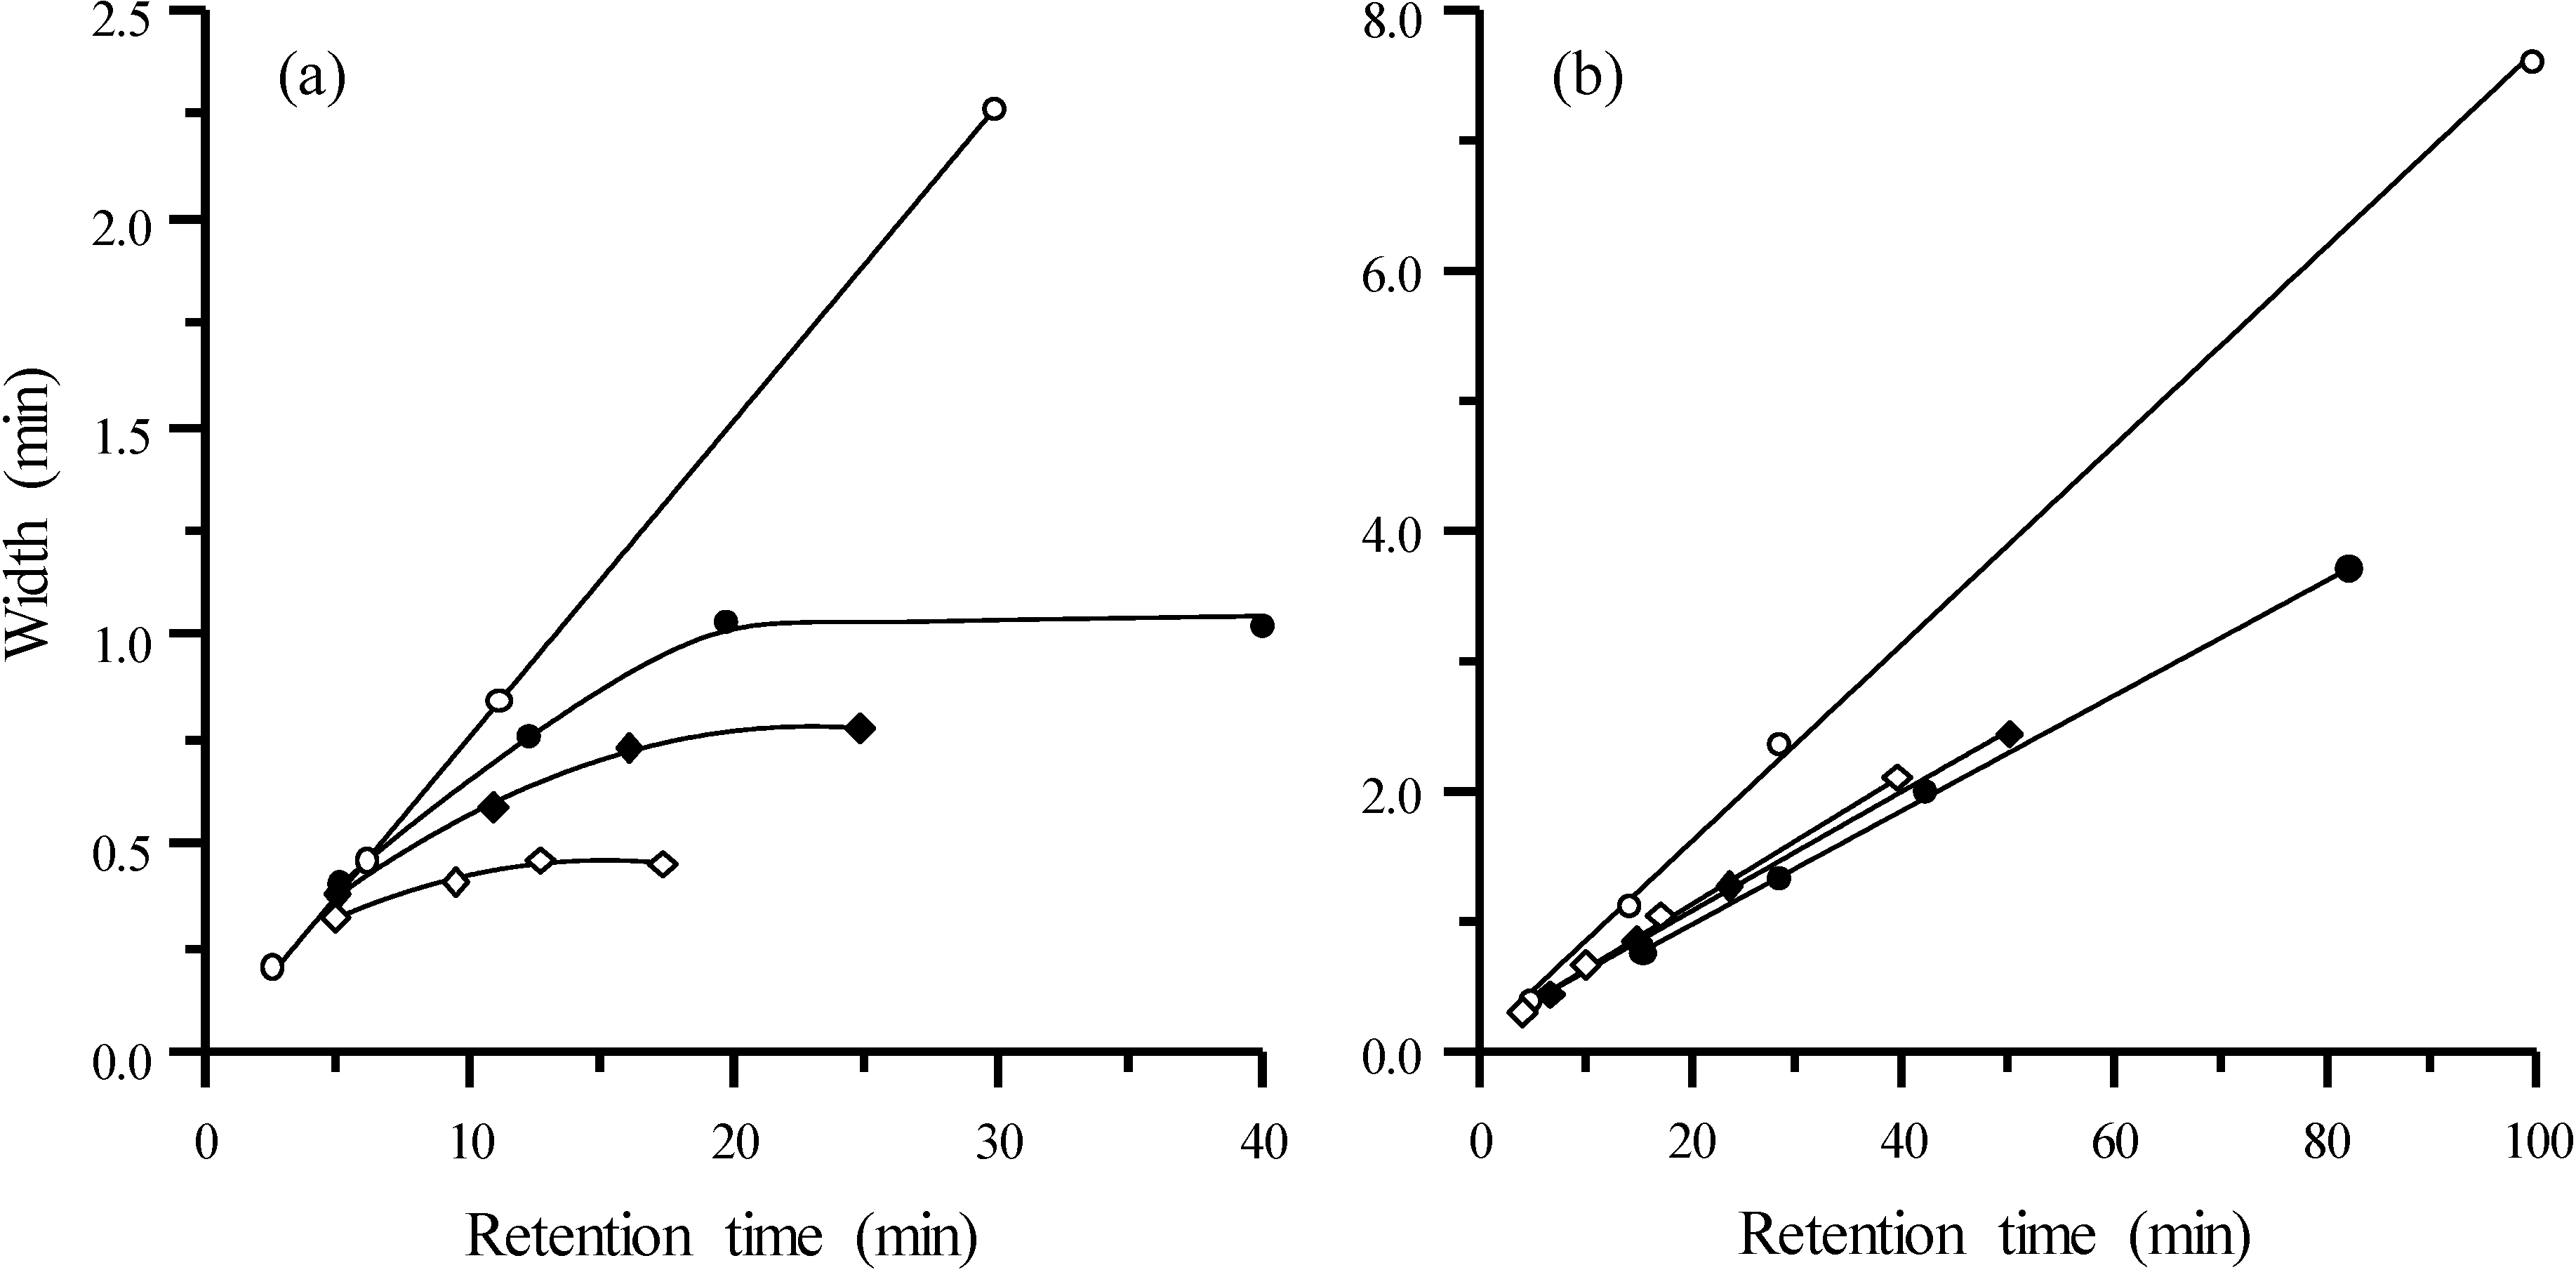
3.3. Description of the Peak Profile Using the Modifier Concentration and Flow Rate as Factors

3.3.1. Isocratic Elution

Broadening of chromatographic peaks at varying mobile phase flow rate is often described through the Van Deemter equation:
H = A + B u + Cu
where H is the height equivalent to a theoretical plate (μm), u is the isocratic mobile phase linear velocity (cm/s), A is the turbulent diffusion or Eddy-diffusion coefficient, B is the diffusion coefficient in the longitudinal direction resulting in dispersion, and C is the coefficient indicating resistance to mass transfer of the analyte between the mobile and stationary phases. The Van Deemter plot shows a minimum value at a particular flow rate, where the column efficiency is maximized. At smaller or larger flows, an additional broadening is obtained, due to diffusion at low flow rates and slow mass transfer at high flow rates.
Each eluted compound and mobile phase composition gives rise to a different Van Deemter plot. That shown in Figure 5 was obtained with the peak data for sulphachloropyridazine, eluted with a mobile phase containing 10% acetonitrile. The plot may change for another compound or mobile phase composition. In order to use the plots for comparative purposes, the flow rate expressed in mL/min was indicated in the X-axis rather than the linear velocity of the mobile phase. It can be observed that the minimum of the Van Deemter plot was found close to 1 mL/min.
The chromatographic peak profile changes can be also described by simple models predicting the left (A) and right (B) half-widths, or the width (w) of the peaks as a function of the retention time, which have been called half-widths or width plots [30,31]. The half-widths plots have the advantage of providing information, for a given chromatographic column, on the changes occurring in both the width and peak asymmetry for a group of compounds and mobile phase compositions. Compounds with similar interaction kinetics, eluted at constant flow rate, within a non excessively large time range, often result in a linear behaviour:
A = a0 + a1 tR
B = b0 + b1tR
Figure 5. Van Deemter plot for sulphachloropyridazine eluted with 10% acetonitrile.
Chromatography 01 00194 g005
For wide ranges of retention time, the behaviour is only slightly parabolic. In all cases, the prediction of the half-widths is simple, once the retention time is known. Figure 6a,b shows the linear behaviour of the half-widths for two of the probe compounds (sulphamerazine and sulphachloropyridazine), eluted at different modifier concentrations, using a fixed flow rate of 1 mL/min. Figure 6d,e corresponds to runs carried out at various flow rates and fixed modifier concentration (10%). Note that unlike the experiences carried out at constant flow rate, flow variations give rise to a parabolic behaviour, since the applied flow rates correspond to different regions in the Van Deemter plot (below and above the minimum of the plot).
Figure 7 depicts the half-width plots for all four sulphonamides eluted under different experimental conditions. The behaviour for different combinations of constant modifier concentration and flow rate is shown. In all cases, the plots are linear. Finally, all data (this time the peak widths) for the four sulphonamides are represented in Figure 6c,f at varying modifier concentrations and flow rates, respectively. The same trends observed in Figure 6a,b,d,e are obtained: a linear trend for the runs carried out at constant flow rate and varying modifier concentration (Figure 6c), and a parabolic trend for the runs at constant modifier concentration and variable flow (Figure 6f). The most interesting feature of these plots is that they show that the four compounds, eluted under different conditions, show the same trend, indicating similar interaction kinetics with the column.
Figure 6. Half-width plots for sulphamerazine (a,d) and sulphachloropyridazine (b,e), and width plots including the data for the four sulphonamides (c,f), obtained at diverse isocratic experimental conditions: (a,b,c) at increasing acetonitrile concentrations in the 5%–30% range at 1 mL/min, and (d,e,f) at increasing flow rates in the 0.125–5.0 mL/min range at fixed 10% acetonitrile. For (a,b,d,e): left (A, ○) and right (B,●) half-widths.
Chromatography 01 00194 g006
Figure 7. Half-width plots for the set of sulphonamides (each point in the plot belongs to a different sulphonamide), corresponding to isocratic chromatograms obtained at 1 mL/min and diverse acetonitrile concentrations: (a) 10%, (b) 15%, and (c) 20%, and at 10% acetonitrile and diverse flow rates (mL/min): (d) 0.125, (e) 0.5 and (f) 4.0. Left (A, ○) and right (B, ●) half-widths.
Chromatography 01 00194 g007

3.3.2. Gradient Elution

According to Jandera and Churácek [32], the width of chromatographic peaks under gradient elution is the same as that obtained under isocratic elution at the instantaneous solute composition when the solute peak maximum reaches the column outlet. Therefore, Equations (15) and (16) are also valid to describe the peak profile in gradient elution if the instantaneous retention time at the column outlet is known. The plots in Figure 8a were obtained for a mixture of the four sulphonamides eluted under modifier gradients, at a flow rate of 1 mL/min, and those in Figure 8b, under flow gradients at fixed 5% acetonitrile. The plots also include the behaviour for the isocratic elution at 10% (top line in Figure 8a) and 5% acetonitrile (top line in Figure 8b), and constant flow rate of 1 mL/min. Applying modifier gradients, curved lines approaching a constant value at high retention are obtained, which means that the peak width for the most retained peaks is similar. In contrast, with flow gradients, linear trends are obtained, which are nearly coincident (at least for the assayed gradients).
Figure 8. Half-width plots for the set of sulphonamides obtained at diverse experimental conditions in gradient elution: (a) Modifier gradient at 1 mL/min with 5% initial acetonitrile and different slopes in the gradient program, and isocratic run at 10% acetonitrile (from top to bottom: m = 0 (○), 0.25 (●), 0.50 (♦) and 1.00 (◊)), and (b) flow gradients at fixed 5% acetonitrile and different slopes in the flow program (from top to bottom: b = 0 (○), 0.075 (◊), 0.058 (♦), 0.026 (●)). In (b), the initial flow from top to bottom was: 1.0, 1.0, 0.5 and 0.1 mL/min.
Chromatography 01 00194 g008

4. Conclusions

This work shows that plots representing the peak retention and half-widths for Chromolith columns, in isocratic and gradient elution—with both modifier concentration and flow rate as factors—provide a clear and informative overview of the behaviour observed in the separation of analytes, in a wide range of experimental conditions. These plots are also useful to predict the retention and profile of chromatographic peaks for a wide variety of conditions, and also to find the best separation conditions applying optimisation strategies. In both isocratic and gradient elution modes, it is necessary to obtain a particular model to predict the retention for each analyte, whereas for the sulphonamides included in this work, only one model allowed the prediction of the chromatographic peak profile.
The flow rate, in both isocratic and gradient elution, appears as a useful factor for Chromolith columns, allowing satisfactory separations in sufficiently short analysis times. Under the assayed conditions in this work, it was possible to get complete resolution for a small set of compounds (the four sulphonamides), even with analysis times of less than 3 min. Flow programming may be a useful tool to reduce the analysis time, within the limitations of the instrumentation and chromatographic column. In future work, the ability of Chromolith columns to resolve a more complex mixture under gradient elution will be investigated, using the proposed models to predict the retention and peak profile with optimisation purposes.

Acknowledgements

This work was supported by Project CTQ2013–42558-P (MINECO, Spain), and FEDER funds. C. Ortiz-Bolsico thanks a FPI grant from MINECO.

Author Contributions

ECC: Experimental work, peak data measurement and representation; COB: Student supervision, laboratory and instrument support, and peak data representation; JJBB: Project design, experimental design, data interpretation and manuscript revision; MCGAC: Project design and guidance, data interpretation, and manuscript writing and revision. All authors read and approved the final manuscript.

Conflicts of Interest

The authors declare no conflict of interest.

References

  1. Pesek, J.J.; Matyska, M.T. Reversed-phase chromatography: Description and applications. In Encyclopedia of Chromatography; Cazes, J., Ed.; Marcel Dekker: New York, NY, USA, 2001; pp. 719–722. [Google Scholar]
  2. Lough, W.J. Reversed phase liquid chromatography. In Encyclopedia of Analytical Chemistry; John Wiley and Sons: New York, NY, USA, 2006. [Google Scholar]
  3. Soliven, A.; Kayillo, S.; Shalliker, R.A. Reversed phase liquid chromatography. In Reference Module in Chemistry, Molecular Sciences and Chemical Engineering; Elsevier: Amsterdam, The Netherlands, 2013. [Google Scholar]
  4. Snyder, L.R.; Dolan, J.W. High-Performance Gradient Elution; John Wiley and Sons: Hoboken, NJ, USA, 2007. [Google Scholar]
  5. Nikitas, P.; Pappa-Louisi, A.; Papachristos, K. Optimisation technique for stepwise gradient elution in reversed-phase liquid chromatography. J. Chromatogr. A 2004, 1033, 283–289. [Google Scholar] [CrossRef]
  6. Concha-Herrera, V.; Vivó-Truyols, G.; Torres-Lapasió, J.R.; García-Alvarez-Coque, M.C. Limits of multi-linear gradient optimisation in reversed-phase liquid chromatography. J. Chromatogr. A 2005, 1063, 79–88. [Google Scholar] [CrossRef] [PubMed]
  7. Lesins, V.; Ruckenstein, E. Gradient flow programming: A coupling of gradient elution and flow programming. J. Chromatogr. A 1989, 467, 1–14. [Google Scholar] [CrossRef]
  8. Guillaume, Y.C.; Peyrin, E. Optimising mobile phase composition, its flow-rate and column temperature in HPLC using taboo search. Talanta 2000, 51, 579–586. [Google Scholar] [CrossRef] [PubMed]
  9. Hermann, M.; Christensen, H.; Reubsaet, J.L.E. Evaluation of essential parameters in the chromatographic determination of cyclosporin A and metabolites using a d-optimal design. J. Pharmaceut. Biomed. 2002, 30, 1263–1276. [Google Scholar] [CrossRef]
  10. Ping-Zhang, Y.; Jun-Zhang, Y.; Jun-Gong, W.; Iyengar-Gopalan, A.; Pill-Lee, K. Rapid separation of sudan dyes by reverse-phase high performance liquid chromatography through statistically designed experiments. J. Chromatogr. A 2005, 1098, 183–187. [Google Scholar] [CrossRef]
  11. Nikitas, P.; Pappa-Louisi, A.; Balkatzopoulou, P. Theory of stepwise gradient elution in reversed-phase liquid chromatography coupled with flow rate variations: Application to retention prediction and separation optimization of a set of amino acids. Anal. Chem. 2006, 78, 5774–5782. [Google Scholar] [CrossRef] [PubMed]
  12. Sivakumar, T.; Manavalan, R.; Muralidharan, C.; Valliappan, K. Multi-criteria decision making approach and experimental design as chemometric tools to optimize HPLC separation of domperidone and pantoprazole. J. Pharmaceut. Biomed. 2007, 43, 1842–1848. [Google Scholar] [CrossRef]
  13. Nikitas, P.; Pappa-Louisi, A. New approaches to linear gradient elution used for optimization in reversed-phase liquid chromatography. J. Liq. Chromatogr. Rel. Technol. 2009, 32, 1527–1576. [Google Scholar] [CrossRef]
  14. Nikitas, P.; Pappa-Louisi, A.; Balkatzopoulou, P. Fundamental equation of dual-mode gradient elution in liquid chromatography involving simultaneous changes in flow rate and mobile-phase composition. Anal. Chem. 2007, 79, 3888–3893. [Google Scholar] [CrossRef] [PubMed]
  15. Kaminski, L.; El Deeb, S.; Watzing, H. Repeatability of monolithic HPLC columns while using a flow program. J. Sep. Sci. 2008, 31, 1745–1749. [Google Scholar] [CrossRef] [PubMed]
  16. Unger, K.K.; Skudas, R.; Schulte, M.M. Particle packed columns and monolithic columns in high-performance liquid chromatography: Comparison and critical appraisal. J. Chromatogr. A 2008, 1184, 393–415. [Google Scholar] [CrossRef] [PubMed]
  17. Svec, F.; Huber, C.G. Monolithic materials: Promises, challenges, achievements. Anal. Chem. 2006, 78, 2100–2107. [Google Scholar] [CrossRef]
  18. Cabrera, K.; Lubda, D.; Eggenweiler, H.M.; Minakuchi, H.; Nakanishi, K. A new monolithic-type HPLC column for fast separations. J. High Res. Chrom. 2000, 23, 93–99. [Google Scholar] [CrossRef]
  19. Lubda, D.; Cabrera, K.; Kraas, W.; Shaefer, C.; Cunningham, D. New developments in the application of monolithic HPLC columns. LC GC Eur. 2001, 19, 1186–1191. [Google Scholar]
  20. Tanaka, N.; Kobayashi, H.; Ishizuka, N.; Minakuchi, H.; Nakanishi, K.; Hosoya, K.; Ikegami, T. Monolithic silica columns for high-efficiency chromatographic separations. J. Chromatogr. A 2002, 965, 35–49. [Google Scholar] [CrossRef] [PubMed]
  21. Cabrera, K. Applications of silica-based monolithic HPLC columns. J. Sep. Sci. 2004, 27, 843–852. [Google Scholar] [CrossRef] [PubMed]
  22. Gerber, F.; Krummen, M.; Potgeter, H.; Roth, A.; Siffrin, C.; Spoendlin, C. Practical aspects of fast reversed-phase high-performance liquid chromatography using 3 μm particle packed columns and monolithic columns in pharmaceutical development and production working under current good manufacturing practice. J. Chromatogr. A 2004, 1036, 127–133. [Google Scholar] [CrossRef]
  23. Cabrera, K.; Machtejevas, E. New generation monolithic silica columns for fast, high resolution drug separations without high pressures. LC GC NORTH AMERICA 2012, 37. [Google Scholar]
  24. Nikitas, P.; Pappa-Louisi, A. Retention models for isocratic and gradient elution in reversed-phase liquid chromatography. J. Chromatogr. A 2009, 1216, 1737–1755. [Google Scholar] [CrossRef] [PubMed]
  25. Baeza-Baeza, J.J.; Ortiz-Bolsico, C.; Torres-Lapasió, J.R.; García-Alvarez-Coque, M.C. Approaches to model the retention and peak profile in linear gradient reversed-phase liquid chromatography. J. Chromatogr. A 2013, 1284, 28–35. [Google Scholar] [CrossRef] [PubMed]
  26. Pous-Torres, S.; Ruiz-Angel, M.J.; Torres-Lapasió, J.R.; García-Alvarez-Coque, M.C. Performance of a Chromolith RP-18e column for the screening of β-blockers. J. Sep. Sci. 2009, 32, 2841–2853. [Google Scholar] [CrossRef] [PubMed]
  27. Pous-Torres, S.; Ruiz-Angel, M.J.; Torres-Lapasió, J.R.; García-Alvarez-Coque, M.C. Interpretive optimisation of organic solvent content and flow-rate in the separation of β-blockers with a Chromolith RP-18e column. J. Sep. Sci. 2009, 32, 2793–2803. [Google Scholar] [CrossRef] [PubMed]
  28. Pous-Torres, S.; Ruiz-Angel, M.J.; Torres-Lapasió, J.R.; García-Alvarez-Coque, M.C. Origin and correction of the deviations in retention times at increasing flow rate with Chromolith columns. J. Chromatogr. A 2010, 1217, 5440–5443. [Google Scholar] [CrossRef] [PubMed]
  29. Baeza-Baeza, J.J.; García-Alvarez-Coque, M.C. Some insights on the description of gradient elution in reversed phase-liquid chromatography. J. Sep. Sci. 2014, 37, 2269–2277. [Google Scholar] [CrossRef] [PubMed]
  30. Ruiz-Angel, M.J.; Carda-Broch, S.; García-Alvarez-Coque, M.C. Peak half-width plots to study the effect of organic solvents on the peak performance of basic drugs in micellar liquid chromatography. J. Chromatogr. A 2010, 1217, 1786–1798. [Google Scholar] [CrossRef] [PubMed]
  31. Baeza-Baeza, J.J.; Ruiz-Angel, M.J.; Carda-Broch, S.; García-Alvarez-Coque, M.C. Half‑width plots, a simple tool to predict peak shape, reveal column kinetics and characterise chromatographic columns in liquid chromatography: State of the art and new results. J. Chromatogr. A 2013, 1314, 142–153. [Google Scholar] [CrossRef] [PubMed]
  32. Jandera, P.; Churácek, J. Gradient elution in liquid chromatography: II. Retention characteristics (retention volume, band width, resolution, plate number) in solvent-programmed chromatography-theoretical considerations. J. Chromatogr. A 1974, 91, 223–235. [Google Scholar] [CrossRef]

