
Automated Movement Analysis to Predict Cerebral Palsy in Very Preterm Infants: An Ambispective Cohort Study
 , ,
, , Highlights
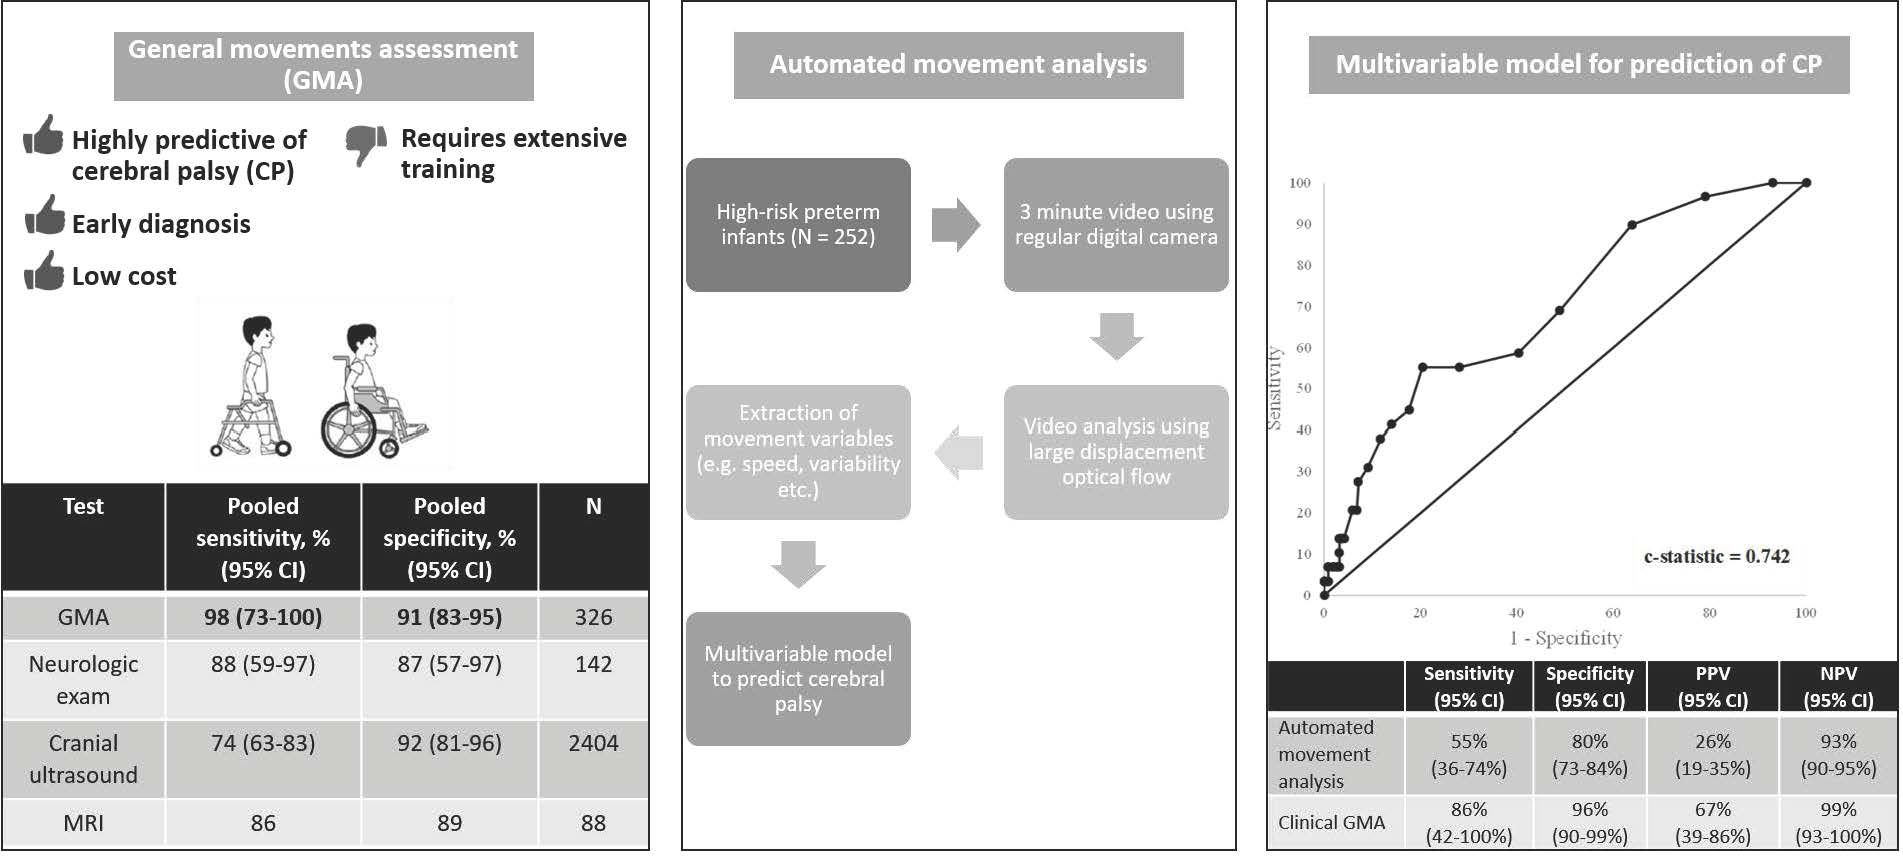
- Automated movement analysis was developed and validated as an alternative to the General Movements Assessment for predicting cerebral palsy in very preterm infants.
- A predictive model using mean velocity in the vertical direction, median, standard deviation, and minimum quantity of motion was used to predict cerebral palsy.
- The technology showed a sensitivity of 55%, specificity of 80%, positive predictive value of 26%, and negative predictive value of 93% in predicting cerebral palsy.
- The technology may be useful for screening purposes in very preterm infants, but further validation is needed in preterm and high-risk term populations.
Abstract
:
1. Introduction
2. Materials and Methods
2.1. Study Design
2.2. Setting
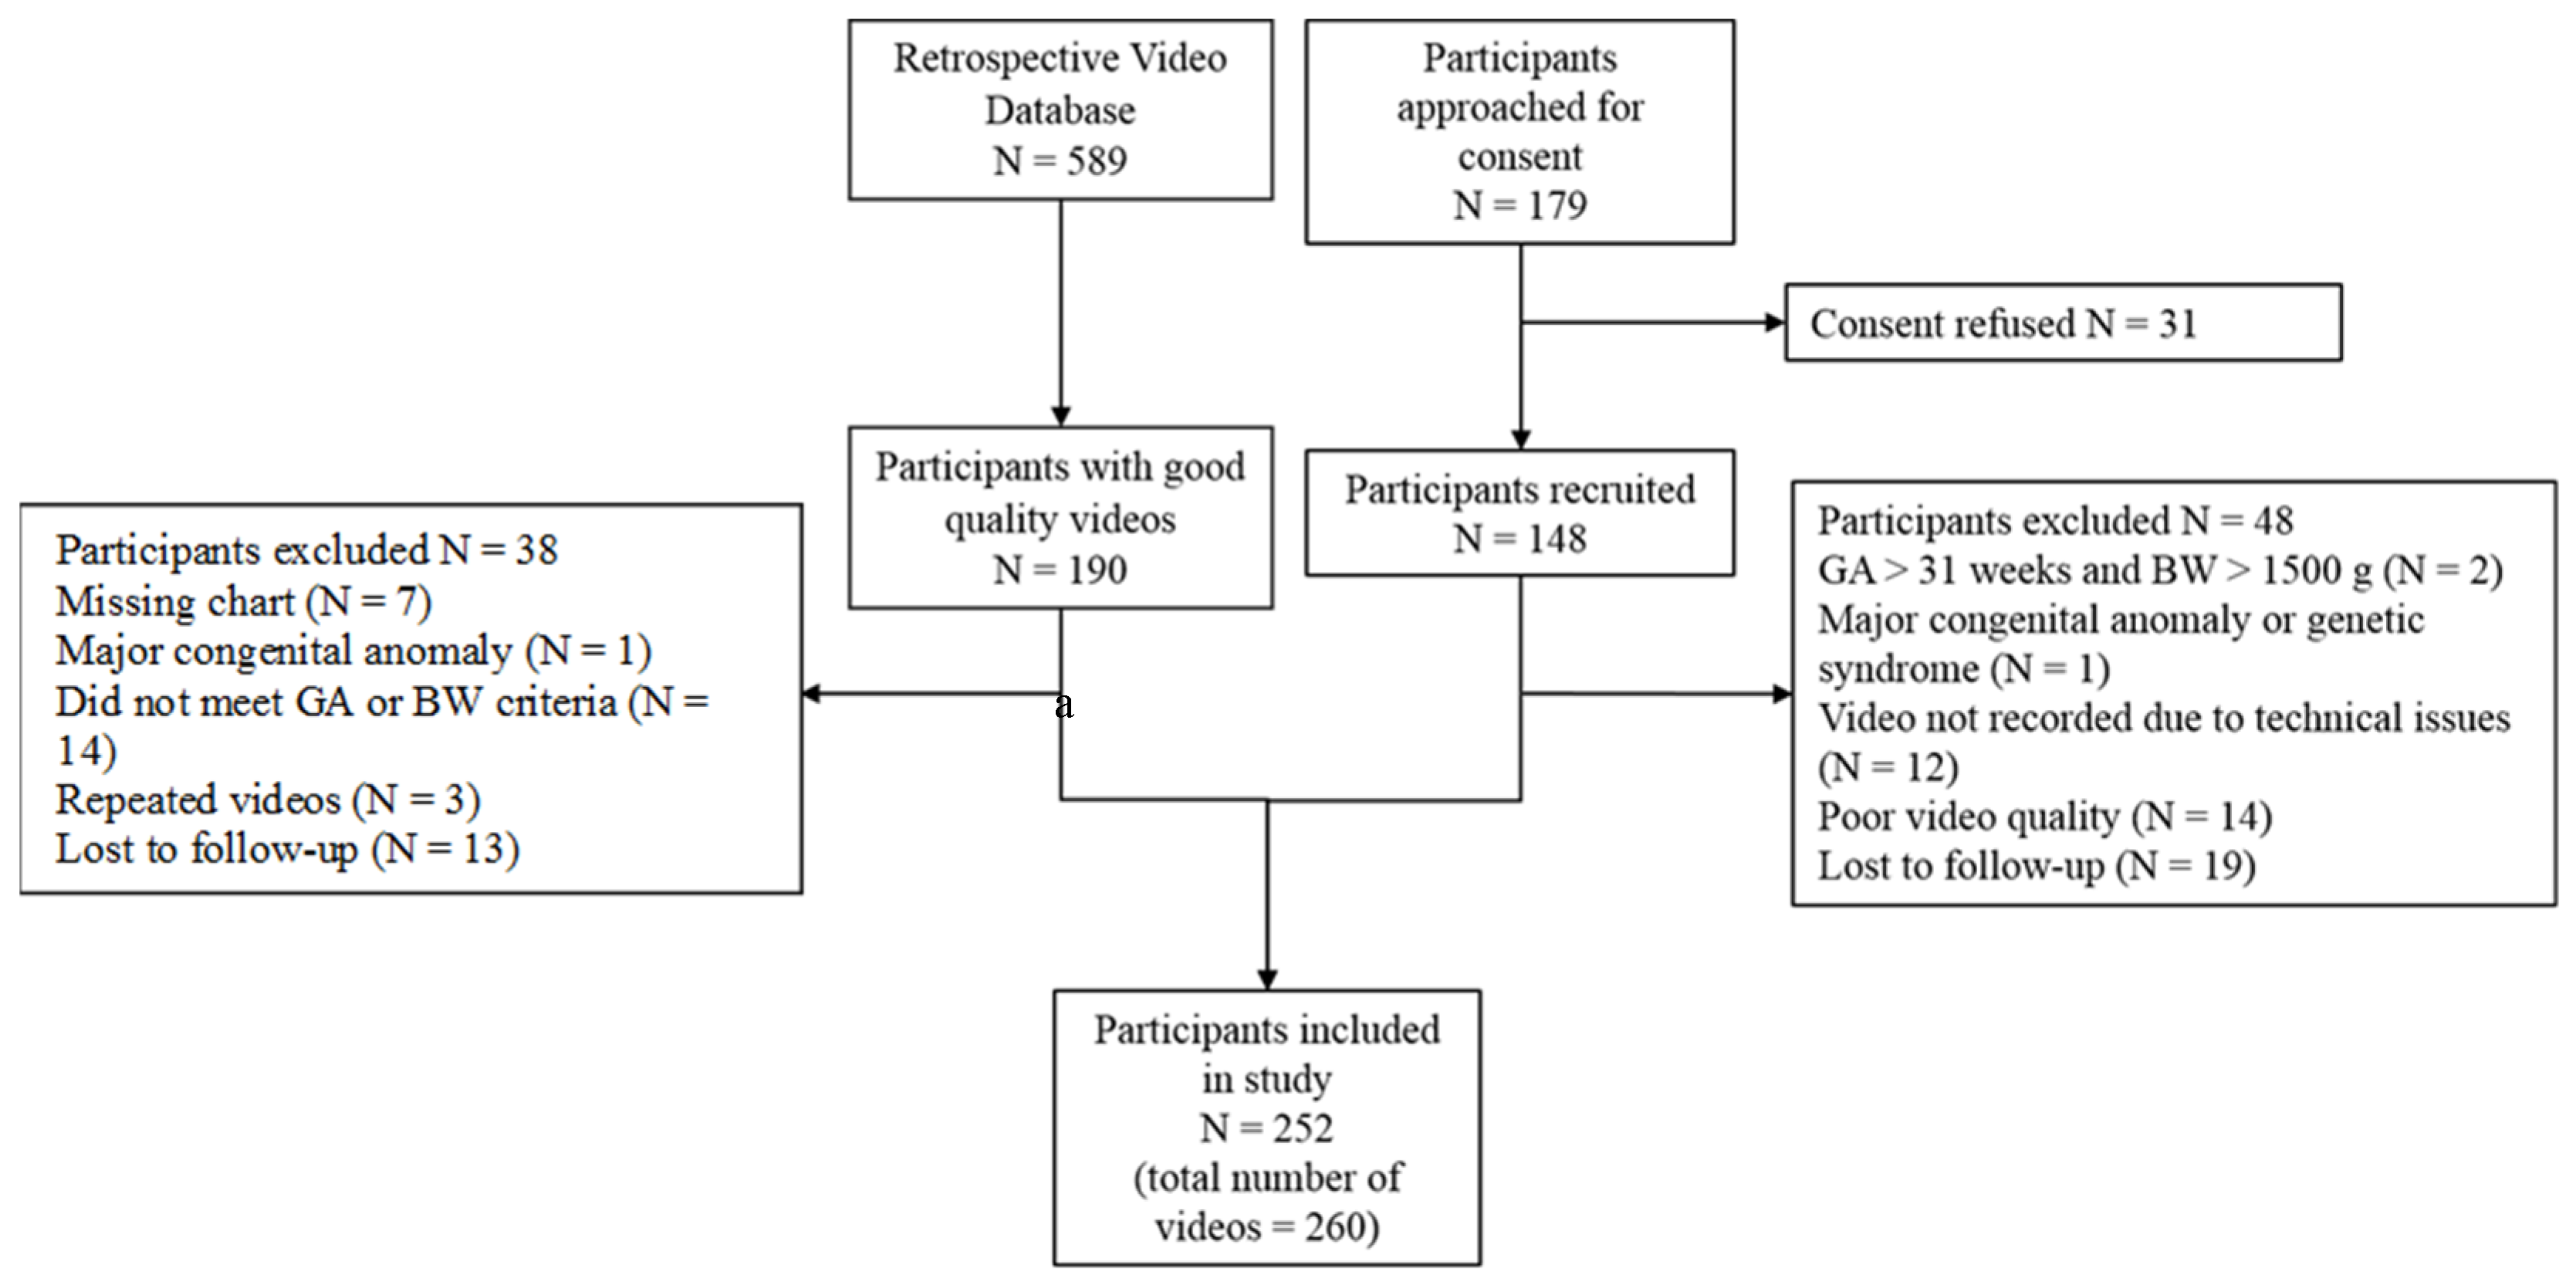
2.3. Participants
2.4. General Movements Assessment
2.5. Automated Movement Analysis
2.6. Outcome
2.7. Statistical Analysis
2.7.1. Baseline and Follow-Up Characteristics
2.7.2. Model Development
2.8. Sample Size Estimation
3. Results
4. Discussion
Study Limitations
5. Conclusions
Author Contributions
Funding
Institutional Review Board Statement
Informed Consent Statement
Data Availability Statement
Conflicts of Interest
References
- Novak, I.; Morgan, C.; Adde, L.; Blackman, J.; Boyd, R.N.; Brunstrom-Hernandez, J.; Cioni, G.; Damiano, D.; Darrah, J.; Eliasson, A.C.; et al. Early, Accurate Diagnosis and Early Intervention in Cerebral Palsy: Advances in Diagnosis and Treatment. JAMA Pediatr. 2017, 171, 897–907. [Google Scholar] [CrossRef]
- Seesahai, J.; Luther, M.; Church, P.T.; Maddalena, P.; Asztalos, E.; Rotter, T.; Banihani, R. The assessment of general movements in term and late-preterm infants diagnosed with neonatal encephalopathy, as a predictive tool of cerebral palsy by 2 years of age-a scoping review. Syst. Rev. 2021, 10, 226. [Google Scholar] [CrossRef] [PubMed]
- Brogna, C.; Romeo, D.M.; Cervesi, C.; Scrofani, L.; Romeo, M.G.; Mercuri, E.; Guzzetta, A. Prognostic value of the qualitative assessments of general movements in late-preterm infants. Early Hum. Dev. 2013, 89, 1063–1066. [Google Scholar] [CrossRef]
- Bosanquet, M.; Copeland, L.; Ware, R.; Boyd, R. A systematic review of tests to predict cerebral palsy in young children. Dev. Med. Child Neurol. 2013, 55, 418–426. [Google Scholar] [CrossRef]
- Spittle, A.; Orton, J.; Anderson, P.J.; Boyd, R.; Doyle, L.W. Early developmental intervention programmes provided post hospital discharge to prevent motor and cognitive impairment in preterm infants. Cochrane Database Syst. Rev. 2015, 11, CD005495. [Google Scholar] [CrossRef]
- Morgan, C.; Novak, I.; Dale, R.C.; Guzzetta, A.; Badawi, N. Single blind randomised controlled trial of GAME (Goals-Activity-Motor Enrichment) in infants at high risk of cerebral palsy. Res. Dev. Disabil. 2016, 55, 256–267. [Google Scholar] [CrossRef]
- Einspieler, C.; Precht’l, H.F. Prechtls assessment of general movements: A diagnostic tool for the functional assessment of the young nervous system. Ment. Retard. Dev. Disabil. Res. Rev. 2005, 11, 61–67. [Google Scholar] [CrossRef]
- Raghuram, K.; Orlandi, S.; Shah, V.; Chau, T.; Luther, M.; Banihani, R.; Church, P. Automated movement analysis to predict motor impairment in preterm infants: A retrospective study. J. Perinatol. 2019, 39, 1362–1369. [Google Scholar] [CrossRef] [PubMed]
- Adde, L.; Helbostad, J.L.; Jensenius, A.R.; Taraldsen, G.; Støen, R. Using computer-based video analysis in the study of fidgety movements. Early Hum. Dev. 2009, 85, 541–547. [Google Scholar] [CrossRef]
- Kanemaru, N.; Watanabe, H.; Kihara, H.; Nakano, H.; Takaya, R.; Nakamura, T.; Nakano, J.; Taga, G.; Konishi, Y. Specific characteristics of spontaneous movements in preterm infants at term age are associated with developmental delays at age 3 years. Dev. Med. Child Neurol. 2013, 55, 713–721. [Google Scholar] [CrossRef]
- Karch, D.; Kim, K.S.; Wochner, K.; Pietz, J.; Dickhaus, H.; Philippi, H. Quantification of the segmental kinematics of spontaneous infant movements. J. Biomech. 2008, 41, 2860–2867. [Google Scholar] [CrossRef]
- Philippi, H.; Karch, D.; Kang, K.S.; Wochner, K.; Pietz, J.; Dickhaus, H.; Hadders-Algra, M. Computer-based analysis of general movements reveals stereotypies predicting cerebral palsy. Dev. Med. Child Neurol. 2014, 56, 960–967. [Google Scholar] [CrossRef] [Green Version]
- Marcroft, C.; Khan, A.; Embleton, N.D.; Trenell, M.; Plötz, T. Movement recognition technology as a method of assessing spontaneous general movements in high risk infants. Front. Neurol. 2014, 5, 284. [Google Scholar] [CrossRef] [PubMed]
- Raghuram, K.; Orlandi, S.; Church, P.; Chau, T.; Uleryk, E.; Pechlivanoglou, P.; Shah, V. Automated movement recognition to predict motor impairment in high-risk infants: A systematic review of diagnostic test accuracy and meta-analysis. Dev. Med. Child Neurol. 2021, 63, 637–648. [Google Scholar] [CrossRef]
- Ihlen, E.A.F.; Støen, R.; Boswell, L.; Regnier, R.A.; Fjørtoft, T.; Gaebler-Spira, D.; Labori, C.; Loennecken, M.C.; Msall, M.E.; Möinichen, U.I.; et al. Machine Learning of Infant Spontaneous Movements for the Early Prediction of Cerebral Palsy: A Multi-Site Cohort Study. J. Clin. Med. 2019, 9, 5. [Google Scholar] [CrossRef] [Green Version]
- Tacchino, C.; Impagliazzo, M.; Maggi, E.; Bertamino, M.; Blanchi, I.; Campone, F.; Durand, P.; Fato, M.; Giannoni, P.; Iandolo, R.; et al. Spontaneous movements in the newborns: A tool of quantitative video analysis of preterm babies. Comput. Methods Programs Biomed. 2021, 199, 105838. [Google Scholar] [CrossRef]
- Meinecke, L.; Breitbach-Faller, N.; Bartz, C.; Damen, R.; Rau, G.; Disselhorst-Klug, C. Movement analysis in the early detection of newborns at risk for developing spasticity due to infantile cerebral palsy. Hum. Mov. Sci. 2006, 25, 125–144. [Google Scholar] [CrossRef] [PubMed]
- Heinze, F.; Hesels, K.; Breitbach-Faller, N.; Schmitz-Rode, T.; Disselhorst-Klug, C. Movement analysis by accelerometry of newborns and infants for the early detection of movement disorders due to infantile cerebral palsy. Med. Biol. Eng. Comput. 2010, 48, 765–772. [Google Scholar] [CrossRef]
- Gravem, D.; Singh, M.; Chen, C.; Rich, J.; Vaughan, J.; Goldberg, K.; Waffarn, F.; Chou, P.; Cooper, D.; Reinkensmeyer, D.; et al. Assessment of Infant Movement with a Compact Wireless Accelerometer System. J. Med. Devices 2012, 6, 021013. [Google Scholar] [CrossRef]
- Karch, D.; Kang, K.S.; Wochner, K.; Philippi, H.; Hadders-Algra, M.; Pietz, J.; Dickhaus, H. Kinematic assessment of stereotypy in spontaneous movements in infants. Gait Posture 2012, 36, 307–311. [Google Scholar] [CrossRef] [PubMed] [Green Version]
- Rahmati, H.; Martens, H.; Aamo, O.M.; Stavdahl, O.; Stoen, R.; Adde, L. Frequency Analysis and Feature Reduction Method for Prediction of Cerebral Palsy in Young Infants. IEEE Trans. Neural Syst. Rehabil. Eng. 2016, 24, 1225–1234. [Google Scholar] [CrossRef] [PubMed]
- Adde, L.; Helbostad, J.; Jensenius, A.R.; Langaas, M.; Støen, R. Identification of fidgety movements and prediction of CP by the use of computer-based video analysis is more accurate when based on two video recordings. Physiother. Theory Pract. 2013, 29, 469–475. [Google Scholar] [CrossRef] [Green Version]
- Støen, R.; Songstad, N.T.; Silberg, I.E.; Fjørtoft, T.; Jensenius, A.R.; Adde, L. Computer-based video analysis identifies infants with absence of fidgety movements. Pediatr. Res. 2017, 82, 665–670. [Google Scholar] [CrossRef] [Green Version]
- Von Elm, E.; Altman, D.G.; Egger, M.; Pocock, S.J.; Gøtzsche, P.C.; Vandenbroucke, J.P.; Initiative, S. The Strengthening the Reporting of Observational Studies in Epidemiology (STROBE) statement: Guidelines for reporting observational studies. Lancet 2007, 370, 1453–1457. [Google Scholar] [CrossRef]
- The Canadian Neonatal Network. CNN Abstractor’s Manual; v.1.3.4; The Canadian Neonatal Network: Toronto, ON, Canada, 2011. [Google Scholar]
- Hadders-Algra, M. General movements: A window for early identification of children at high risk for developmental disorders. J. Pediatr. 2004, 145, S12–S18. [Google Scholar] [CrossRef] [PubMed]
- Van Dyk, J.; Church, P.; Dell, S.; To, T.; Luther, M.; Shah, V. Prediction of long-term neurodevelopmental outcome in preterm infants using trajectories of general movement assessments. J. Perinatol. 2018, 38, 1398–1406. [Google Scholar] [CrossRef] [PubMed]
- Brox, T.; Malik, J. Large displacement optical flow: Descriptor matching in variational motion estimation. IEEE Trans. Pattern Anal. Mach. Intell. 2011, 33, 500–513. [Google Scholar] [CrossRef]
- Orlandi, S.; Raghuram, K.; Smith, C.R.; Mansueto, D.; Church, P.; Shah, V.; Luther, M.; Chau, T. Detection of atypical and typical infant movements using computer-based video analysis. In Proceedings of the 2018 40th Annual International Conference of the IEEE Engineering in Medicine and Biology Society (EMBC), Honolulu, HI, USA, 17–21 July 2018; pp. 3598–3601. [Google Scholar] [CrossRef]
- Stahl, A.; Schellewald, C.; Stavdahl, Ø.; Aamo, O.M.; Adde, L.; Kirkerød, H. An optical flow-based method to predict infantile cerebral palsy. IEEE Trans. Neural Syst. Rehabil. Eng. 2012, 20, 605–614. [Google Scholar] [CrossRef] [PubMed]
- Kanemaru, N.; Watanabe, H.; Kihara, H.; Nakano, H.; Nakamura, T.; Nakano, J.; Taga, G.; Konishi, Y. Jerky spontaneous movements at term age in preterm infants who later developed cerebral palsy. Early Hum. Dev. 2014, 90, 387–392. [Google Scholar] [CrossRef]
- Rosenbaum, P.; Paneth, N.; Leviton, A.; Goldstein, M.; Bax, M.; Damiano, D.; Dan, B.; Jacobsson, B. A report: The definition and classification of cerebral palsy April 2006. Dev. Med. Child Neurol. Suppl. 2007, 109, 8–14. [Google Scholar]
- Austin, P.C.; Tu, J.V. Automated variable selection methods for logistic regression produced unstable models for predicting acute myocardial infarction mortality. J. Clin. Epidemiol. 2004, 57, 1138–1146. [Google Scholar] [CrossRef]
- Austin, P.; Tu, J. Bootstrap Methods for Developing Predictive Models. Am. Stat. 2004, 58, 131–137. [Google Scholar] [CrossRef]
- Harrell, F.E.; Lee, K.L.; Mark, D.B. Multivariable prognostic models: Issues in developing models, evaluating assumptions and adequacy, and measuring and reducing errors. Stat. Med. 1996, 15, 361–387. [Google Scholar] [CrossRef]
- Hosmer, D.W.; Lemeshow, S.; Sturdivant, R.X. Applied Logistic Regression, 3rd ed.; John Wiley & Sons: Hoboken, NJ, USA, 2013. [Google Scholar]
- Harrell, F. Regression Modeling Strategies with Applications to Linear Models, Logistic Regression, and Survival Analysis; Springer: New York, NY, USA, 2001. [Google Scholar]
- Einspieler, C.; Prechtl, H.; Bos, A.; Ferrari, F. Prechtl’s Method on the Qualitative Assessment of General Movements in Preterm, Term and Young Infants; Mac Keith Press: London, UK, 2004. [Google Scholar]
- Einspieler, C.; Prechtl, H.F.; Ferrari, F.; Cioni, G.; Bos, A.F. The qualitative assessment of general movements in preterm, term and young infants—Review of the methodology. Early Hum. Dev. 1997, 50, 47–60. [Google Scholar] [CrossRef]
- Rosenbaum, P.L.; Walter, S.D.; Hanna, S.E.; Palisano, R.J.; Russell, D.J.; Raina, P.; Wood, E.; Bartlett, D.J.; Galuppi, B.E. Prognosis for gross motor function in cerebral palsy: Creation of motor development curves. JAMA 2002, 288, 1357–1363. [Google Scholar] [CrossRef] [Green Version]
- Adde, L.; Helbostad, J.L.; Jensenius, A.R.; Taraldsen, G.; Grunewaldt, K.H.; Støen, R. Early prediction of cerebral palsy by computer-based video analysis of general movements: A feasibility study. Dev. Med. Child Neurol. 2010, 52, 773–778. [Google Scholar] [CrossRef]
- Einspieler, C.; Marschik, P.B.; Pansy, J.; Scheuchenegger, A.; Krieber, M.; Yang, H.; Kornacka, M.K.; Rowinska, E.; Soloveichick, M.; Bos, A.F. The general movement optimality score: A detailed assessment of general movements during preterm and term age. Dev. Med. Child Neurol. 2016, 58, 361–368. [Google Scholar] [CrossRef] [Green Version]
- Adde, L.; Yang, H.; Saether, R.; Jensenius, A.R.; Ihlen, E.; Cao, J.Y.; Stoen, R. Characteristics of general movements in preterm infants assessed by computer-based video analysis. Physiother. Theory Pract. 2018, 34, 286–292. [Google Scholar] [CrossRef]
- Khan, M.H.; Schneider, M.; Farid, M.S.; Grzegorzek, M. Detection of Infantile Movement Disorders in Video Data Using Deformable Part-Based Model. Sensors 2018, 18, 3202. [Google Scholar] [CrossRef] [Green Version]
- Marchi, V.; Hakala, A.; Knight, A.; D’Acunto, F.; Scattoni, M.L.; Guzzetta, A.; Vanhatalo, S. Automated pose estimation captures key aspects of General Movements at eight to 17 weeks from conventional videos. Acta Paediatr. 2019, 108, 1817–1824. [Google Scholar] [CrossRef] [Green Version]
- Shin, H.I.; Shin, H.I.; Bang, M.S.; Kim, D.K.; Shin, S.H.; Kim, E.K.; Kim, Y.J.; Lee, E.S.; Park, S.G.; Ji, H.M.; et al. Deep learning-based quantitative analyses of spontaneous movements and their association with early neurological development in preterm infants. Sci. Rep. 2022, 12, 3138. [Google Scholar] [CrossRef]
- Schroeder, A.S.; Hesse, N.; Weinberger, R.; Tacke, U.; Gerstl, L.; Hilgendorff, A.; Heinen, F.; Arens, M.; Dijkstra, L.J.; Pujades Rocamora, S.; et al. General Movement Assessment from videos of computed 3D infant body models is equally effective compared to conventional RGB video rating. Early Hum. Dev. 2020, 144, 104967. [Google Scholar] [CrossRef]
- Spittle, A.J.; Cameron, K.; Doyle, L.W.; Cheong, J.L.; Group, V.I.C.S. Motor Impairment Trends in Extremely Preterm Children: 1991–2005. Pediatrics 2018, 141, e20173410. [Google Scholar] [CrossRef] [Green Version]
- Nakanishi, H.; Suenaga, H.; Uchiyama, A.; Kono, Y.; Kusuda, S.; Neonatal Research Network, Japan. Trends in the neurodevelopmental outcomes among preterm infants from 2003–2012: A retrospective cohort study in Japan. J. Perinatol. 2018, 38, 917–928. [Google Scholar] [CrossRef] [PubMed]
- Vincer, M.J.; Allen, A.C.; Allen, V.M.; Baskett, T.F.; O’Connell, C.M. Trends in the prevalence of cerebral palsy among very preterm infants (<31 weeks’ gestational age). Paediatr. Child. Health 2014, 19, 185–189. [Google Scholar] [CrossRef]
- Stetson, B.T.; Buhimschi, C.S.; Kellert, B.A.; Hay, K.; Buhimschi, I.A.; Maitre, N.L. Comparison of Cerebral Palsy Severity Between 2 Eras of Antenatal Magnesium Use. JAMA Pediatr. 2019, 173, 188–190. [Google Scholar] [CrossRef]
- Kwong, A.K.; Eeles, A.L.; Olsen, J.E.; Cheong, J.L.; Doyle, L.W.; Spittle, A.J. The Baby Moves smartphone app for General Movements Assessment: Engagement amongst extremely preterm and term-born infants in a state-wide geographical study. J. Paediatr. Child. Health 2019, 55, 548–554. [Google Scholar] [CrossRef]
- Adde, L.; Brown, A.; van den Broeck, C.; DeCoen, K.; Eriksen, B.H.; Fjortoft, T.; Groos, D.; Ihlen, E.A.F.; Osland, S.; Pascal, A.; et al. In-Motion-App for remote General Movement Assessment: A multi-site observational study. BMJ Open 2021, 11, e042147. [Google Scholar] [CrossRef] [PubMed]
- Svensson, K.A.; Ortqvist, M.; Bos, A.F.; Eliasson, A.C.; Sundelin, H.E. Usability and inter-rater reliability of the NeuroMotion app: A tool in General Movements Assessments. Eur. J. Paediatr. Neurol. 2021, 33, 29–35. [Google Scholar] [CrossRef]
- Silva, N.; Zhang, D.; Kulvicius, T.; Gail, A.; Barreiros, C.; Lindstaedt, S.; Kraft, M.; Bolte, S.; Poustka, L.; Nielsen-Saines, K.; et al. The future of General Movement Assessment: The role of computer vision and machine learning—A scoping review. Res. Dev. Disabil. 2021, 110, 103854. [Google Scholar] [CrossRef]
- Ballantyne, M.; Benzies, K.; Rosenbaum, P.; Lodha, A. Mothers’ and health care providers’ perspectives of the barriers and facilitators to attendance at Canadian neonatal follow-up programs. Child. Care Health Dev. 2015, 41, 722–733. [Google Scholar] [CrossRef] [PubMed]
- Benavente-Fernández, I.; Synnes, A.; Grunau, R.E.; Chau, V.; Ramraj, C.; Glass, T.; Cayam-Rand, D.; Siddiqi, A.; Miller, S.P. Association of Socioeconomic Status and Brain Injury with Neurodevelopmental Outcomes of Very Preterm Children. JAMA Netw. Open 2019, 2, e192914. [Google Scholar] [CrossRef] [PubMed]
- Palisano, R.; Rosenbaum, P.; Walter, S.; Russell, D.; Wood, E.; Galuppi, B. Development and reliability of a system to classify gross motor function in children with cerebral palsy. Dev. Med. Child Neurol. 1997, 39, 214–223. [Google Scholar] [CrossRef]
- Hafström, M.; Källén, K.; Serenius, F.; Maršál, K.; Rehn, E.; Drake, H.; Ådén, U.; Farooqi, A.; Thorngren-Jerneck, K.; Strömberg, B. Cerebral Palsy in Extremely Preterm Infants. Pediatrics 2018, 141, e20171433. [Google Scholar] [CrossRef] [PubMed] [Green Version]


| Characteristic | Overall (N = 252) | Missing, N (%) | Retrospective Study (N = 152) | Prospective Study (N = 100) |
|---|---|---|---|---|
| GA (weeks), median (IQR) | 27.50 (25.86, 29.29) | 0 | 27.7 (26, 29) | 27.4 (25.2, 29.6) |
| BW (grams), median (IQR) | 960 (769, 1215) | 0 | 955 (764, 1235) | 997 (737, 1287) |
| SGA, N (%) | 20 (7.93) | 0 | 12 (7.89) | 8 (8) |
| Male sex, N (%) | 125 (49.60) | 0 | 79 (52) | 46 (46) |
| BPD at 36 days, N (%) | 35 (13.89) | 6 (2.38) | 25 (16) | 10 (10) |
| Postnatal systemic steroids, N (%) | 18 (7.14) | 2 (0.79) | 9 (5.9) | 9 (9) |
| Home oxygen, N (%) | 22 (8.73) | 6 (2.38) | 16 (10) | 6 (6) |
| IVH ≥ grade III, N (%) | 33 (13.10) | 0 | 25 (16) | 8 (8) |
| PVL, N (%) | 7 (2.78) | 0 | 5 (3.2) | 2 (2) |
| Hydrocephalus requiring drainage, N (%) | 17 (6.75) | 0 | 12 (7.9) | 5 (5) |
| ROP > stage III, N (%) | 10 (3.97) | 2 (0.79) | 7 (4.61) | 3 (3) |
| NEC ≥ stage II/III, N (%) | 12 (4.76) | 1 (0.4) | 6 (4) | 6 (6) |
| Meningitis, N (%) | 10 (3.97) | 1 (0.4) | 4 (2.63) | 6 (6) |
| PDA, N (%) | 56 (22.22) | 1 (0.4) | 37 (24.34) | 19 (19) |
| CA at GMA, median (IQR) | 3.73 (3.40, 4.03) | 0 | 3.81 (3.41, 4.21) | 3.58 (3.28, 3.97) |
| Abnormal GMA a, N (%) | 41 (16.27) | 8 (3.17) | 32 (21) | 9 (9) |
| CA at 18-month visit, median (IQR) | 18.63 (18.2, 19.67) | 13 (5.16) | 18.5 (18.2, 19.4) | 18.82 (18.27, 20.00) |
| BSID-III Motor composite score, median (IQR) | 94 (85, 100) | 13 (5.16) | 97 (88, 100) | 91 (82, 97) |
| BSID-III Motor composite score < 85, N (%) | 44 (17.46) | 12 (4.76) | 22 (14.47) | 22 (22) |
| BSID-III Motor composite score < 70, N (%) | 19 (7.54) | 12 (4.76) | 12 (7.89) | 7 (7) |
| Diagnosis of CP, N (%) | 29 (11.5) | 2 (0.79) | 22 (14) | 7 (7) |
| Type of CP, N (%) | 3 (10.34) | |||
| Spastic hemiplegia | 14 (48.27) | 10 (43) | 4 (57) | |
| Spastic diplegia | 5 (17.24) | 5 (22) | 0 (0) | |
| Spastic quadriplegia | 2 (6.90) | 2 (8.7) | 0 (0) | |
| Dystonic | 2 (6.90) | 2 (8.7) | 0 (0) | |
| Mixed | 2 (6.90) | 1 (4.3) | 1 (14.3) | |
| Other | 1 (3.45) | 2 (9) | 1 (14.3) | |
| GMFCS, N (%) | 8 (27.59) | |||
| I–II | 10 (34.48) | 10 (45) | 0 (0) b | |
| III–V | 11 (37.93) | 10 (45) | 1 (14.3) |
| Predictor Variable | β Coefficient | CP OR (95% CI) | Test Statistic | p-Value |
|---|---|---|---|---|
| Univariate Logistic Regression | ||||
| Vmy | 0.78 | 2.18 (1.19, 3.98) | 6.36 | 0.012 |
| Qmed | 0.07 | 1.07 (0.99, 1.16) | 3.13 | 0.08 |
| Qsd | 1.54 | 4.66 (1.84, 11.80) | 10.52 | 0.0012 |
| Qmin | −1.079 | 0.34 (0.14, 0.81) | 6.01 | 0.014 |
| Multivariable Logistic Regression | ||||
| Omnibus likelihood ratio (χ2) | 22.98 | 0.0001 | ||
| Vmy | 0.75 | 2.12 (1.15, 3.92) | 5.75 | 0.016 |
| Qmed | 0.08 | 1.08 (0.99, 1.17) | 3.32 | 0.068 |
| Qsd | 1.13 | 2.12 (1.15, 3.92) | 4.96 | 0.026 |
| Qmin | −0.89 | 0.41 (0.16, 1.03) | 3.63 | 0.057 |
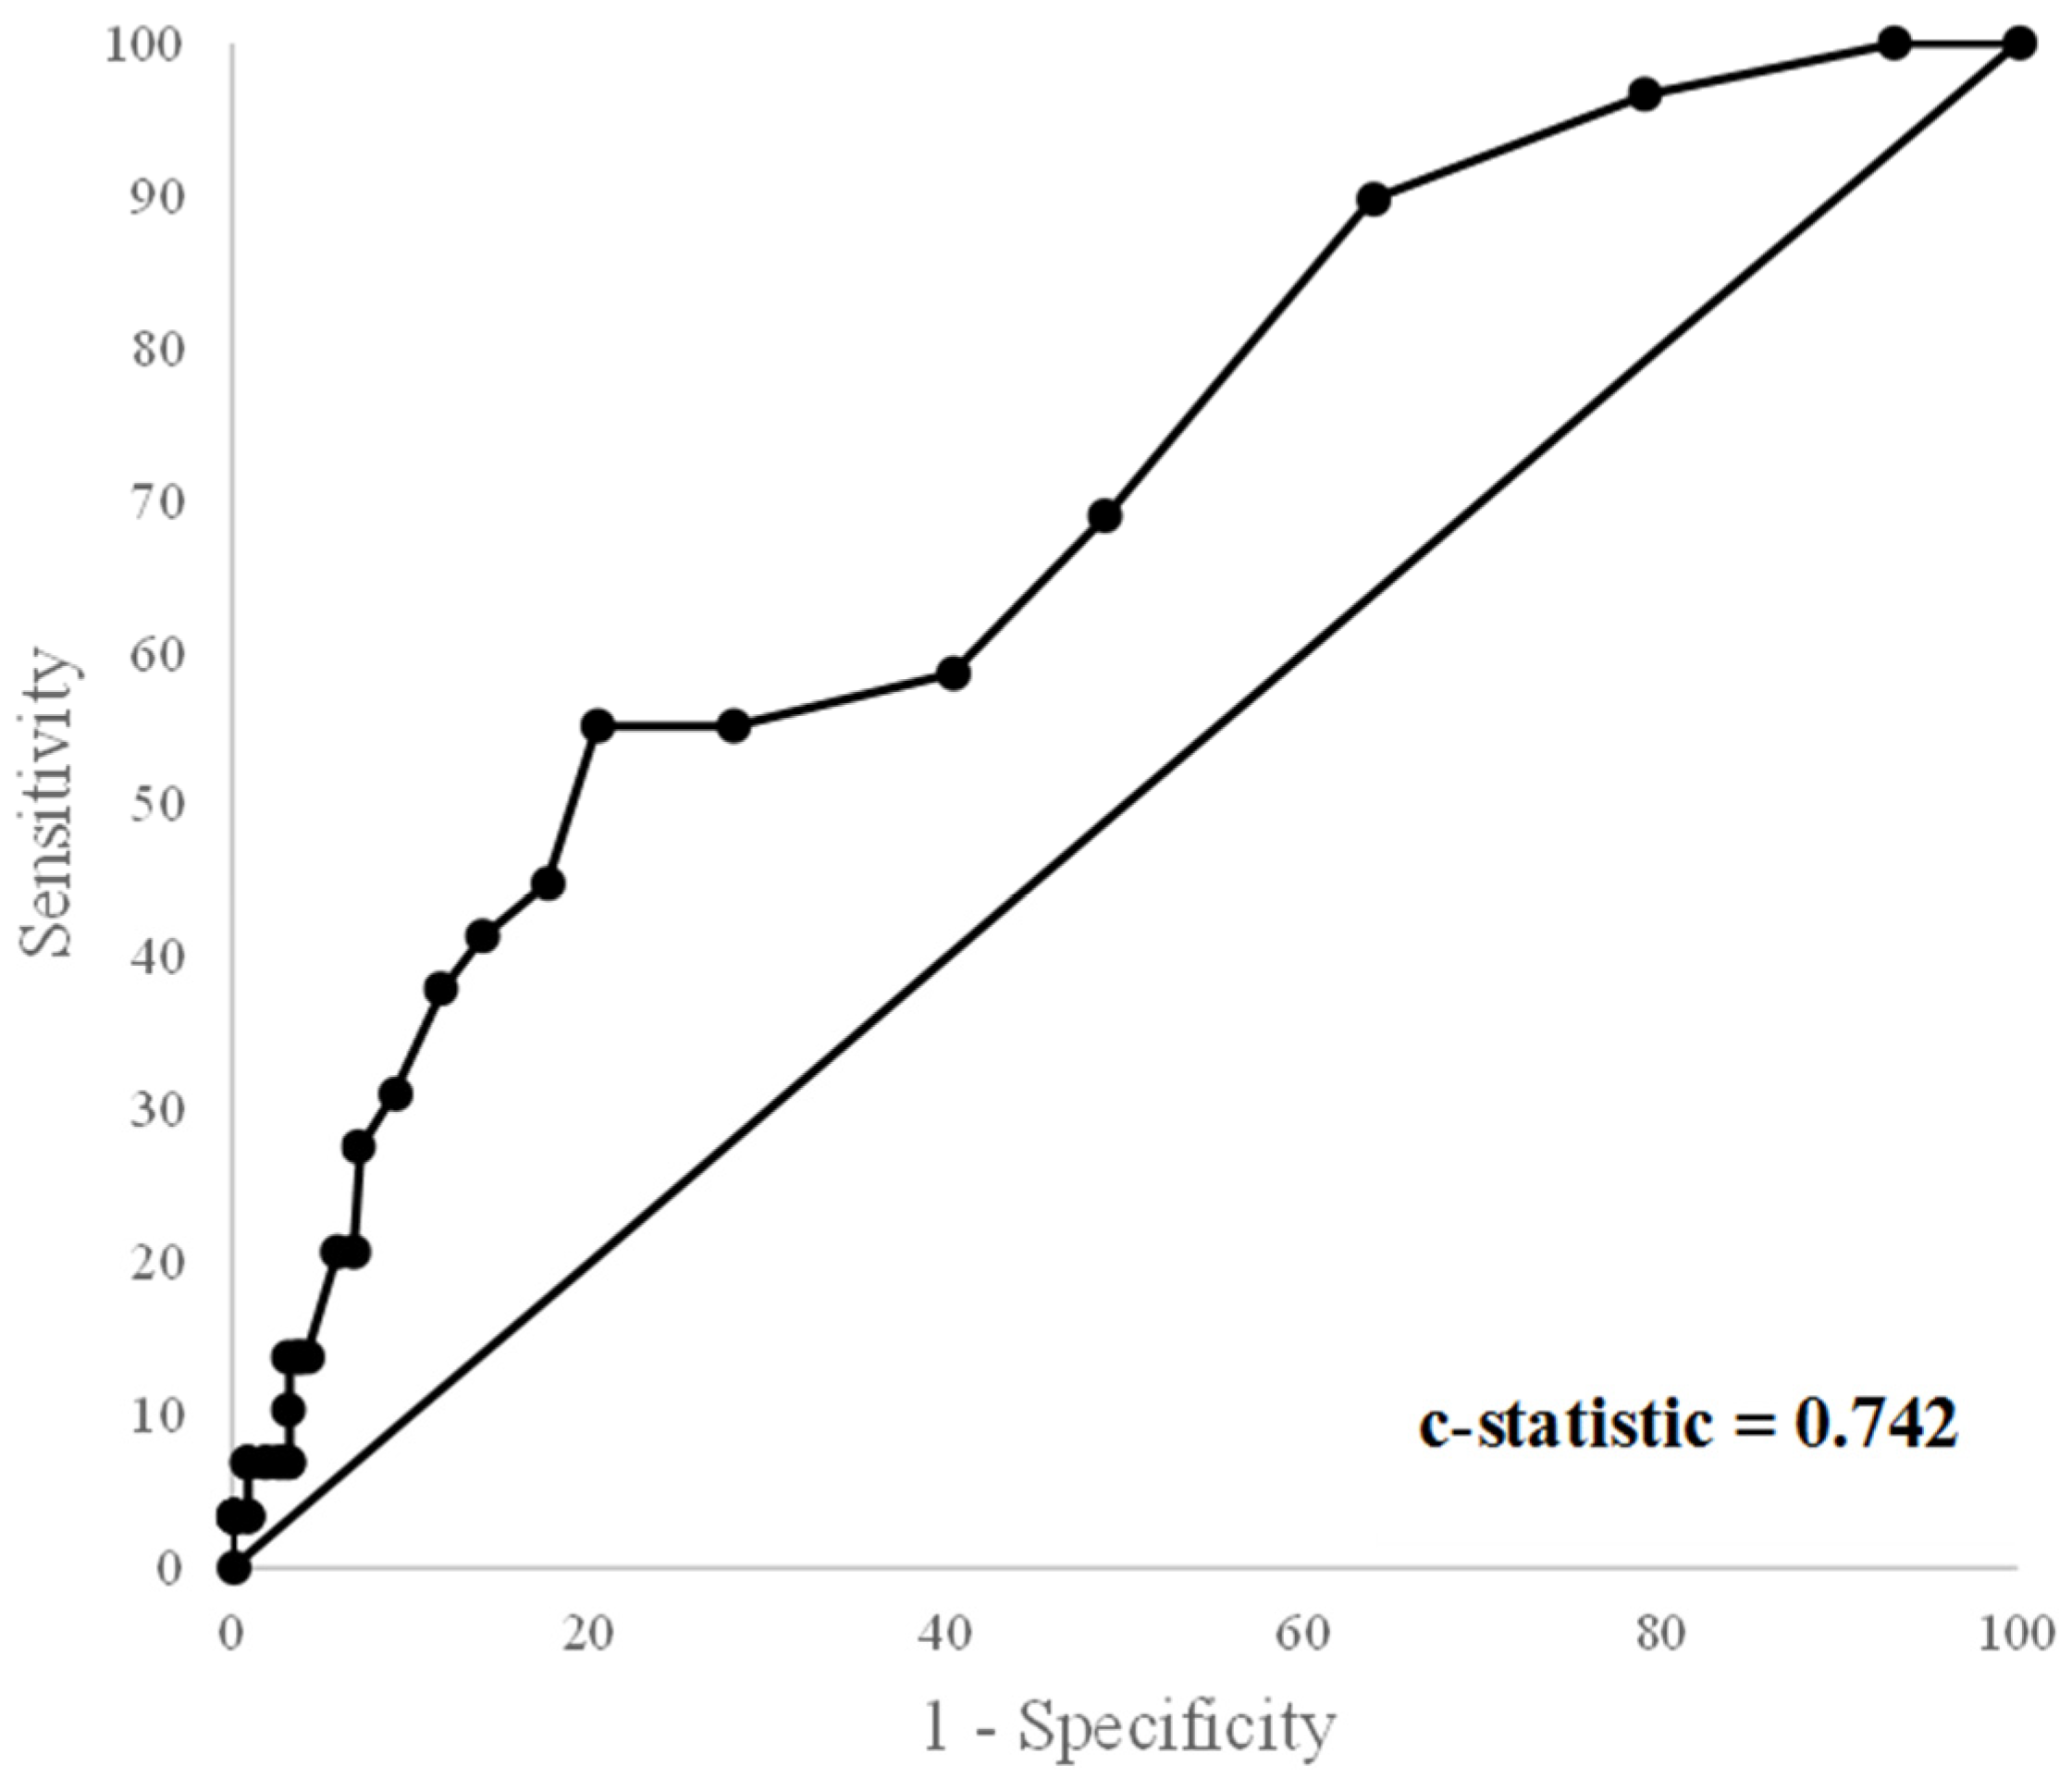
| Sensitivity, % (95% CI) | Specificity, % (95% CI) | PPV, % (95% CI) | NPV, % (95% CI) | |
|---|---|---|---|---|
| Automated movement analysis | 55.17 (35.69, 73.55) | 79.64 (73.72, 84.74) | 26.23 (18.95, 35.09) | 93.12 (89.99, 95.32) |
| Clinical GMA a | 85.71 (42.13, 99.64) | 96.43 (89.92, 99.26) | 66.67 (38.73, 86.35) | 98.78 (92.95, 99.80) |
Publisher’s Note: MDPI stays neutral with regard to jurisdictional claims in published maps and institutional affiliations. |
© 2022 by the authors. Licensee MDPI, Basel, Switzerland. This article is an open access article distributed under the terms and conditions of the Creative Commons Attribution (CC BY) license (https://creativecommons.org/licenses/by/4.0/).
Share and Cite
Raghuram, K.; Orlandi, S.; Church, P.; Luther, M.; Kiss, A.; Shah, V. Automated Movement Analysis to Predict Cerebral Palsy in Very Preterm Infants: An Ambispective Cohort Study. Children 2022, 9, 843. https://doi.org/10.3390/children9060843
Raghuram K, Orlandi S, Church P, Luther M, Kiss A, Shah V. Automated Movement Analysis to Predict Cerebral Palsy in Very Preterm Infants: An Ambispective Cohort Study. Children. 2022; 9(6):843. https://doi.org/10.3390/children9060843
Chicago/Turabian StyleRaghuram, Kamini, Silvia Orlandi, Paige Church, Maureen Luther, Alex Kiss, and Vibhuti Shah. 2022. "Automated Movement Analysis to Predict Cerebral Palsy in Very Preterm Infants: An Ambispective Cohort Study" Children 9, no. 6: 843. https://doi.org/10.3390/children9060843
APA StyleRaghuram, K., Orlandi, S., Church, P., Luther, M., Kiss, A., & Shah, V. (2022). Automated Movement Analysis to Predict Cerebral Palsy in Very Preterm Infants: An Ambispective Cohort Study. Children, 9(6), 843. https://doi.org/10.3390/children9060843