
Dietary Sugar Intake and Its Association with Obesity in Children and Adolescents †

 , ,
, ,  ,
,  and
and 
Abstract
:1. Introduction
2. Methods
2.1. Study Design and Population Sampling
2.2. Final Study Population and Factors Evaluated
2.3. Data Collection and Dietary Assessment
2.3.1. Sugar Intake Assessment and Major Food Contributors
2.3.2. Other Nutritional Intakes
2.4. Anthropometric and Lifestyle Data
2.4.1. Weight Status Assessment
2.4.2. Lifestyle and Other Variables
2.4.3. Sensitivity Analysis
2.5. Statistical Analysis
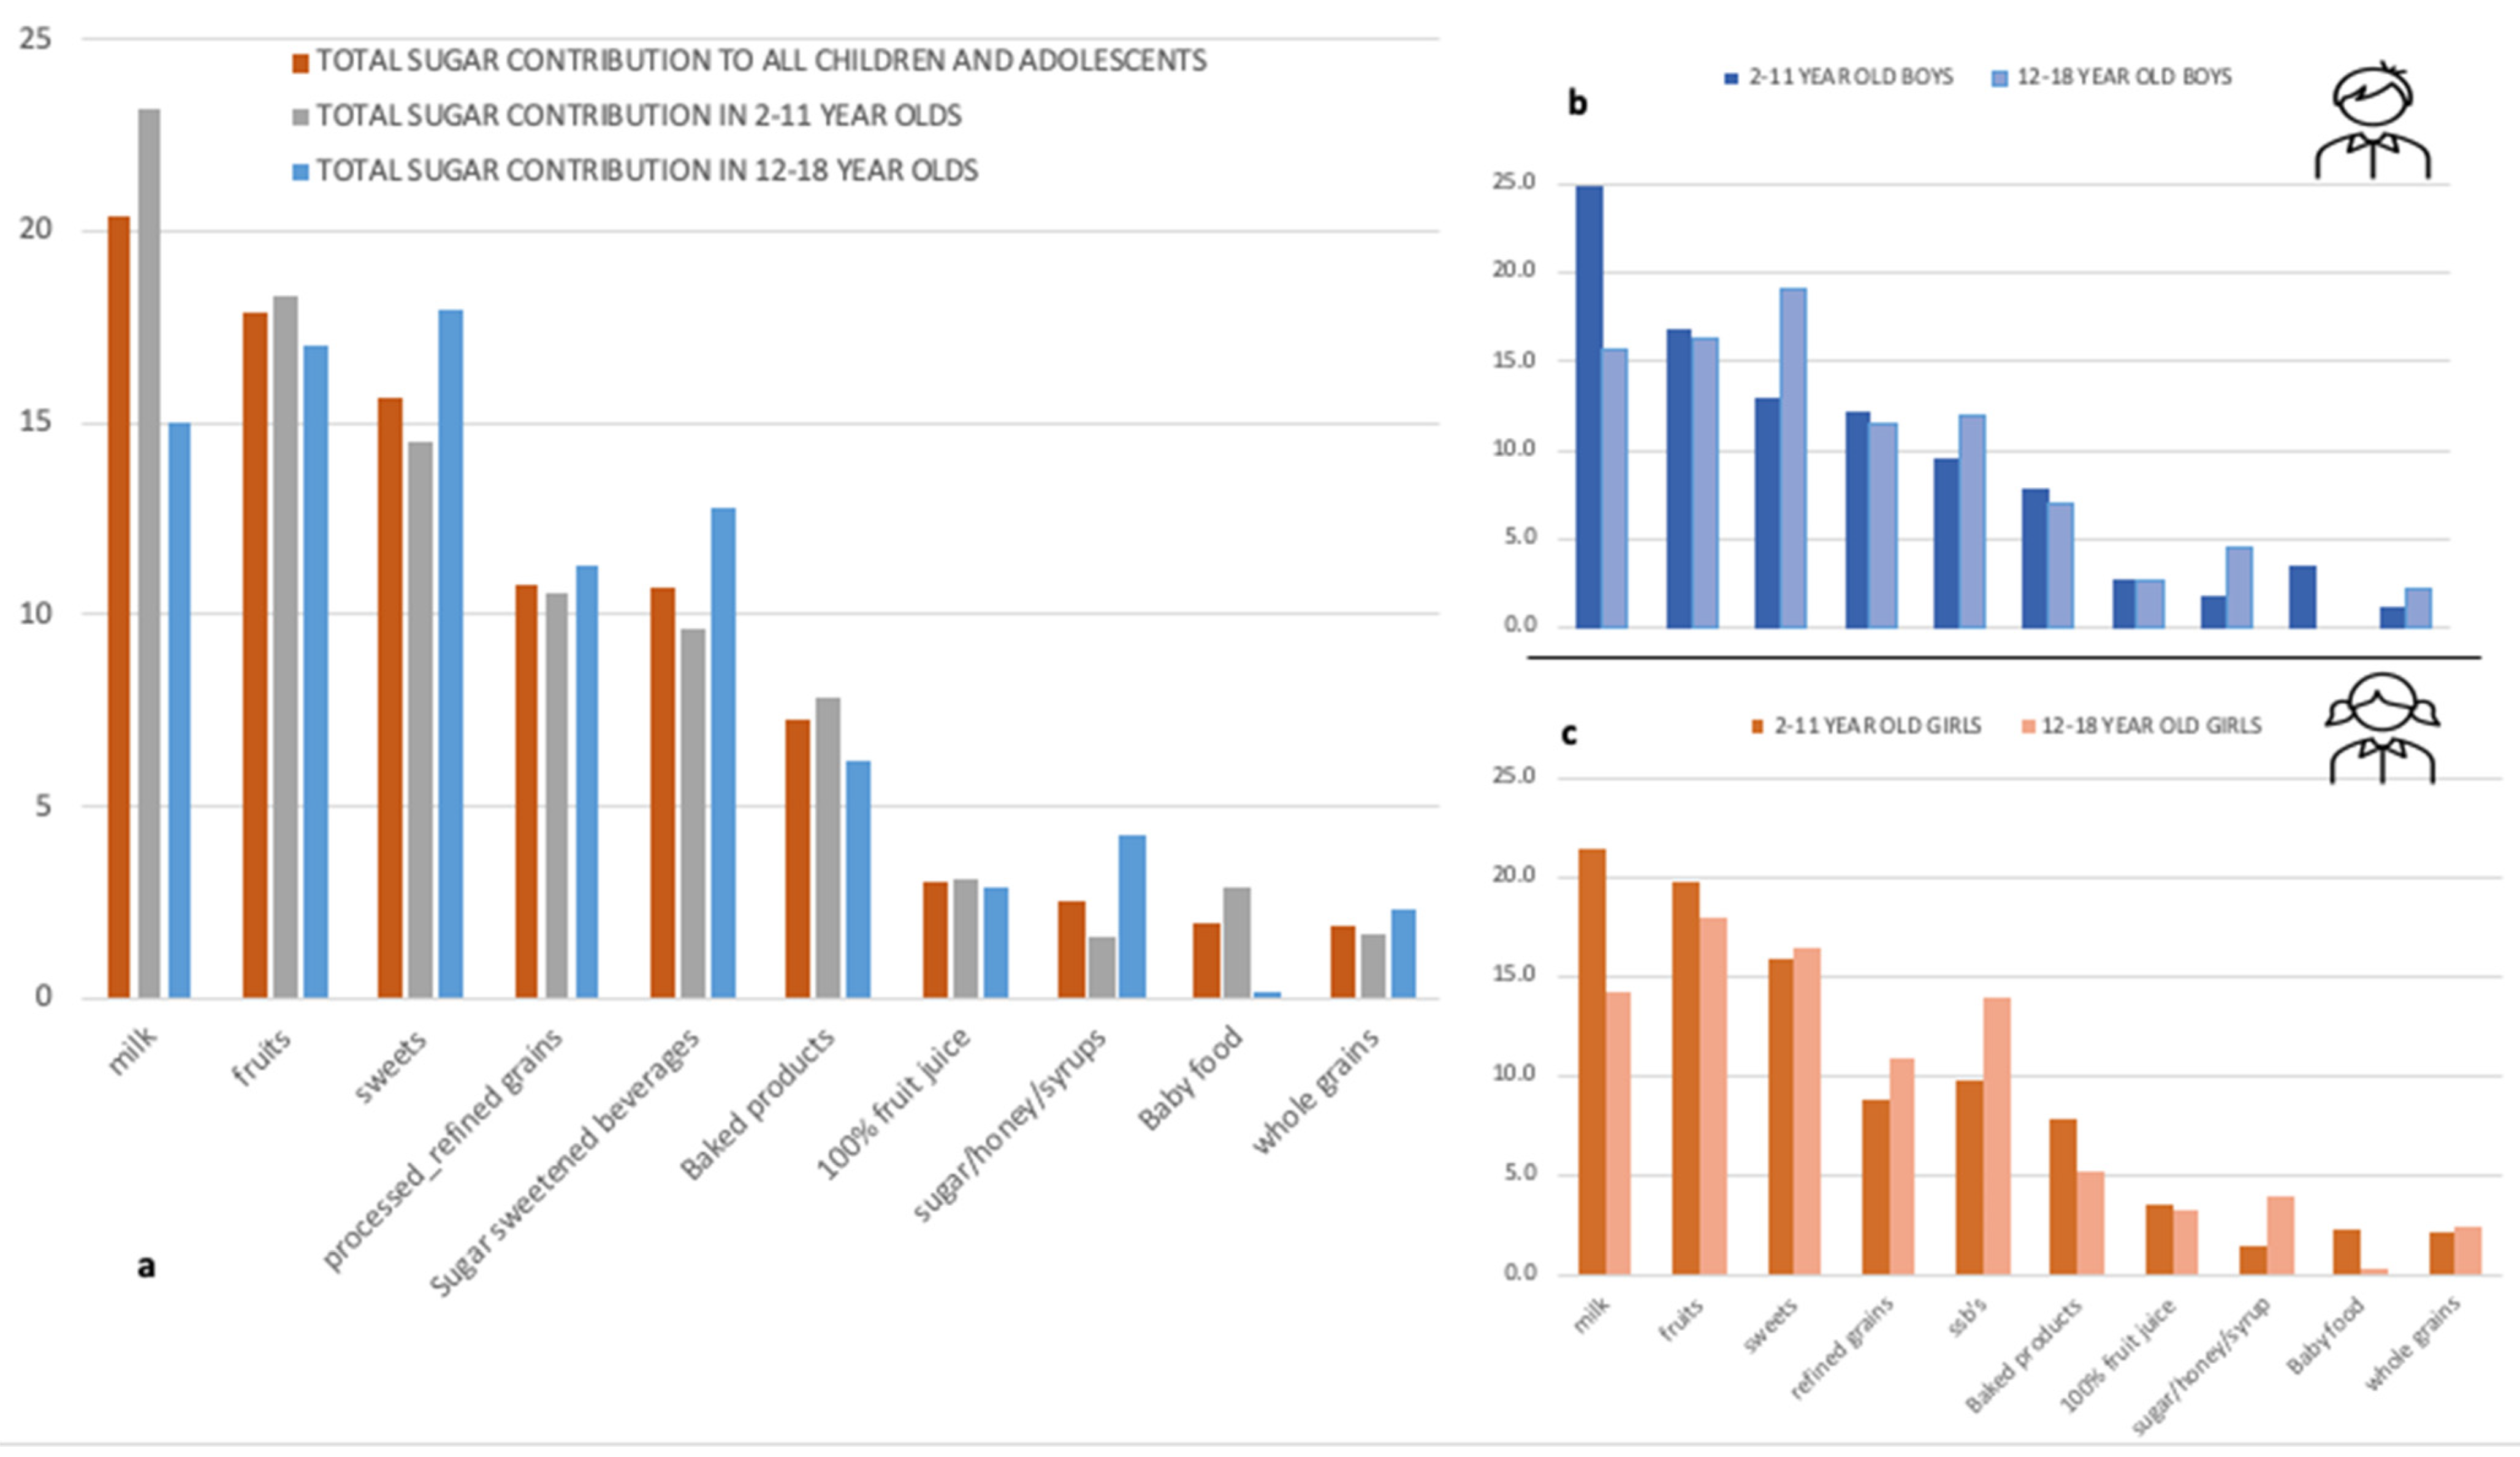
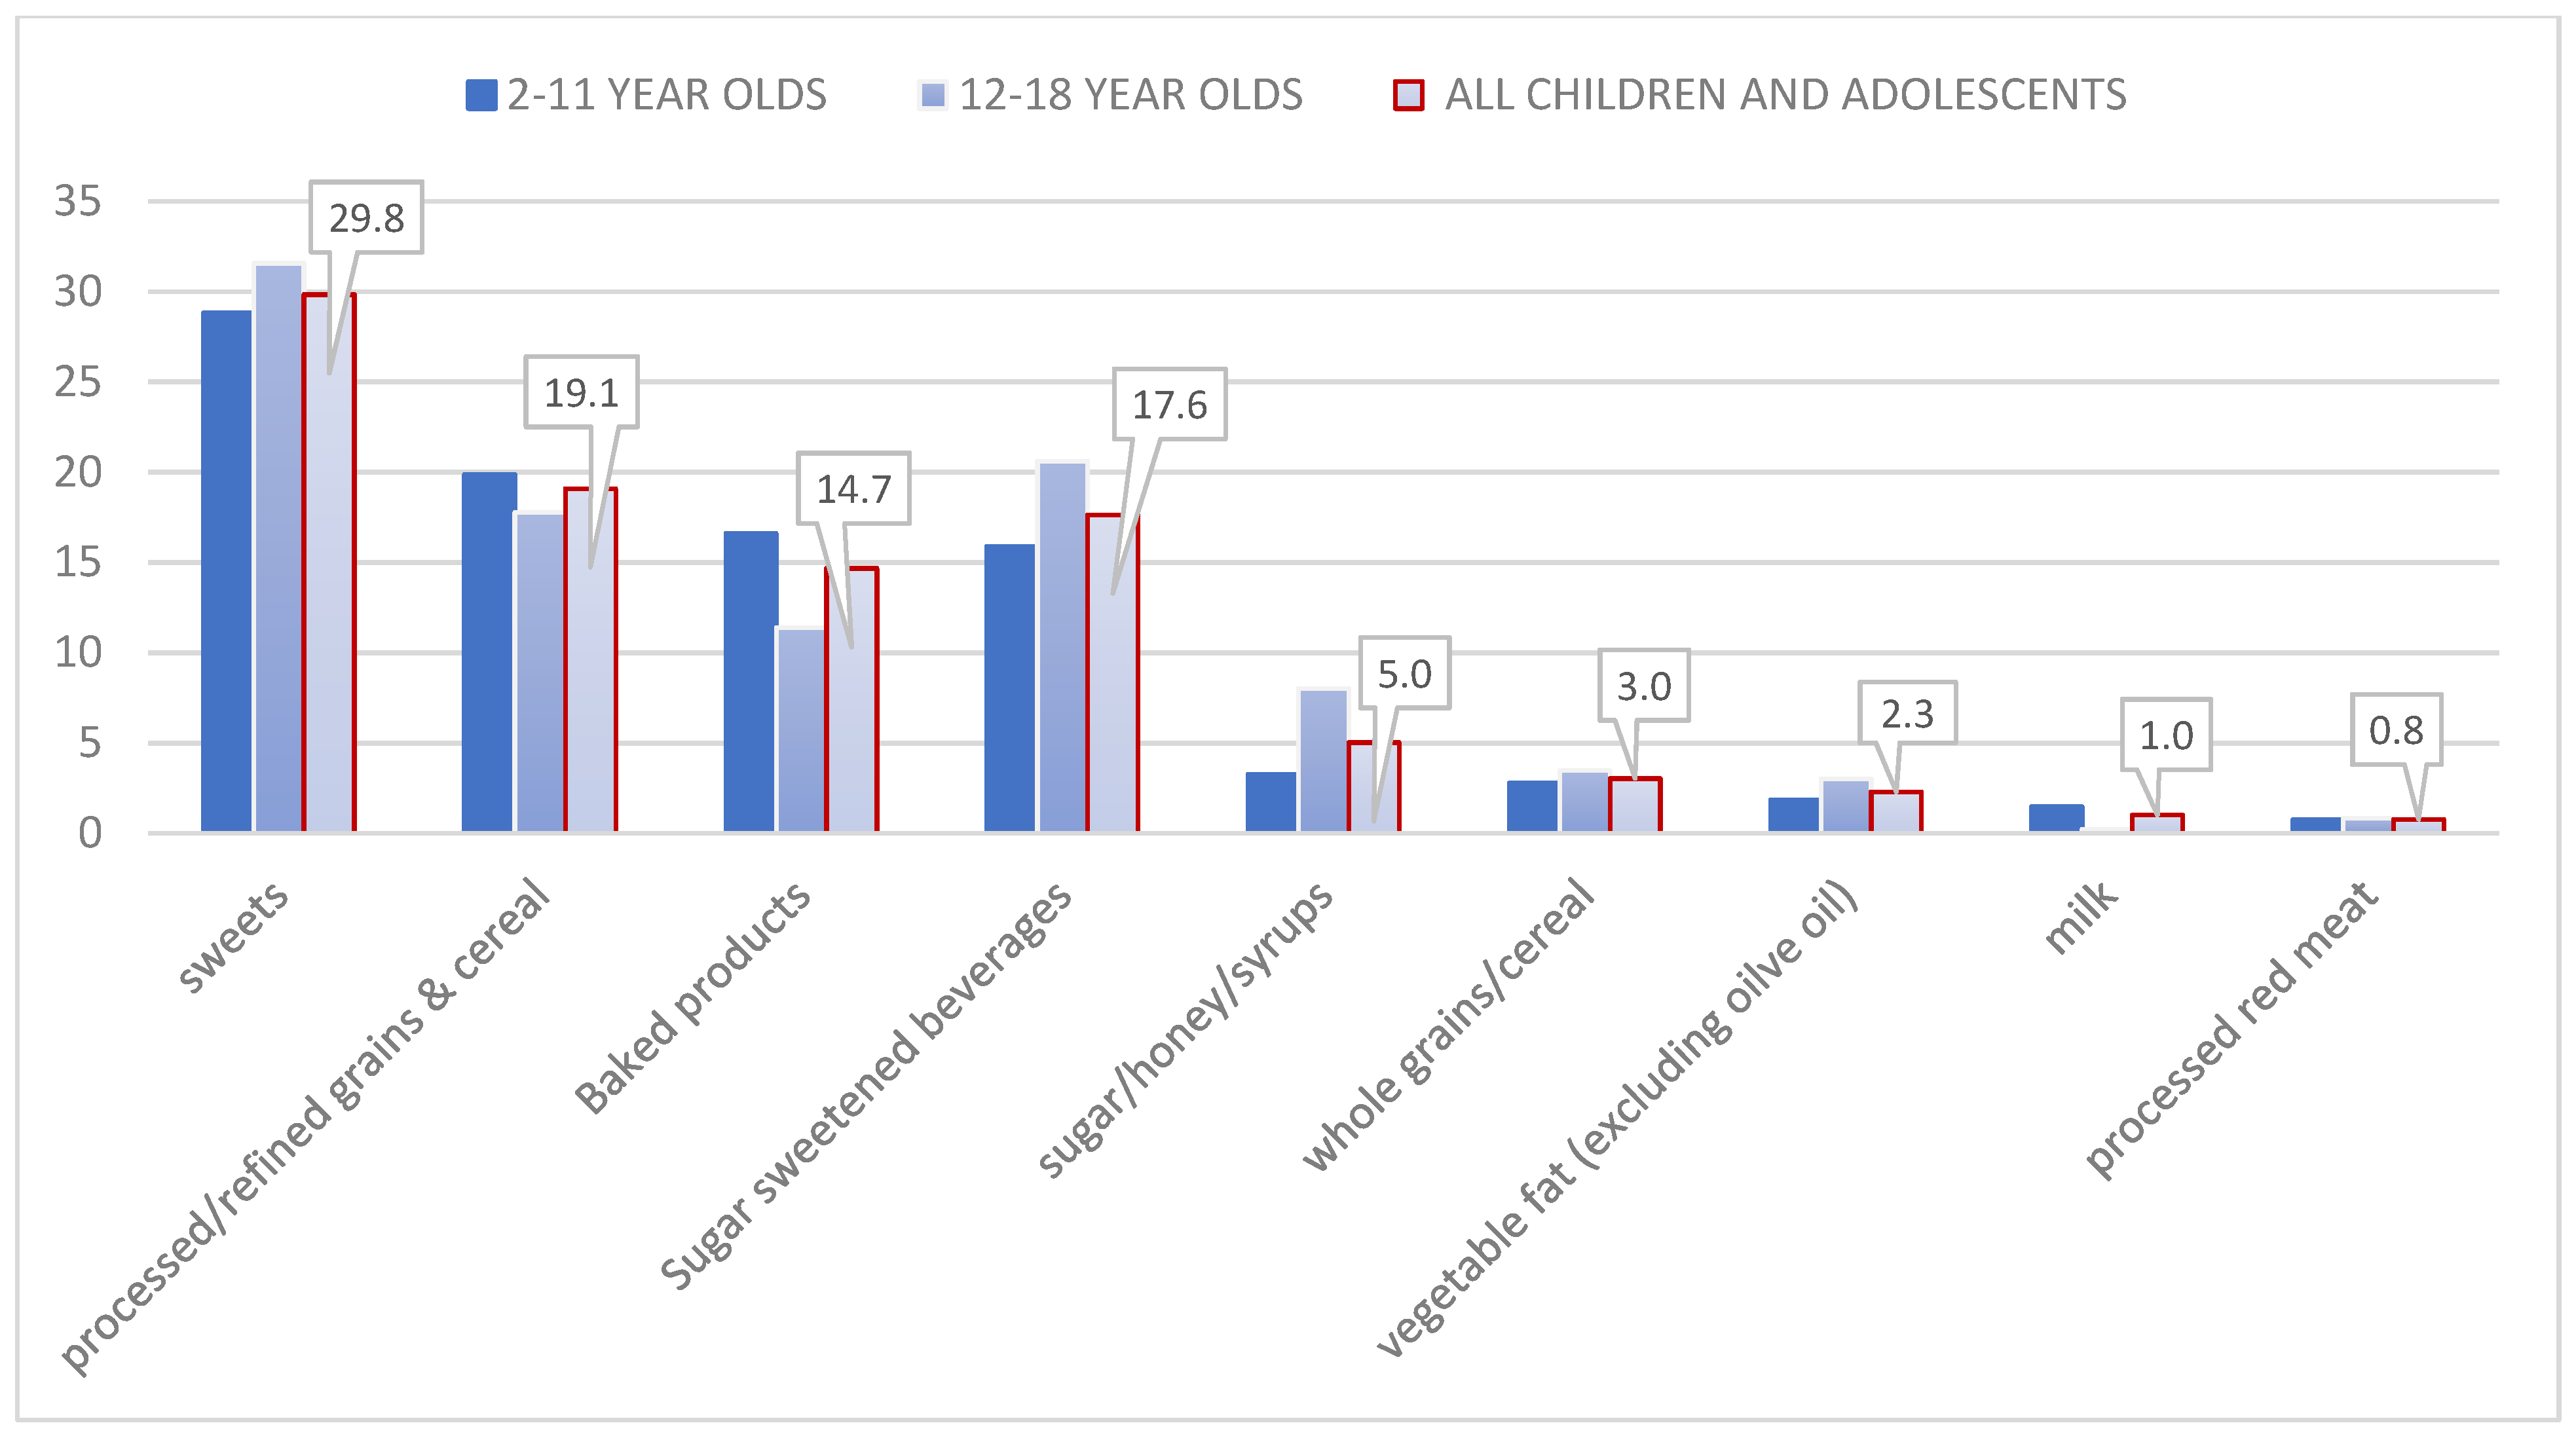
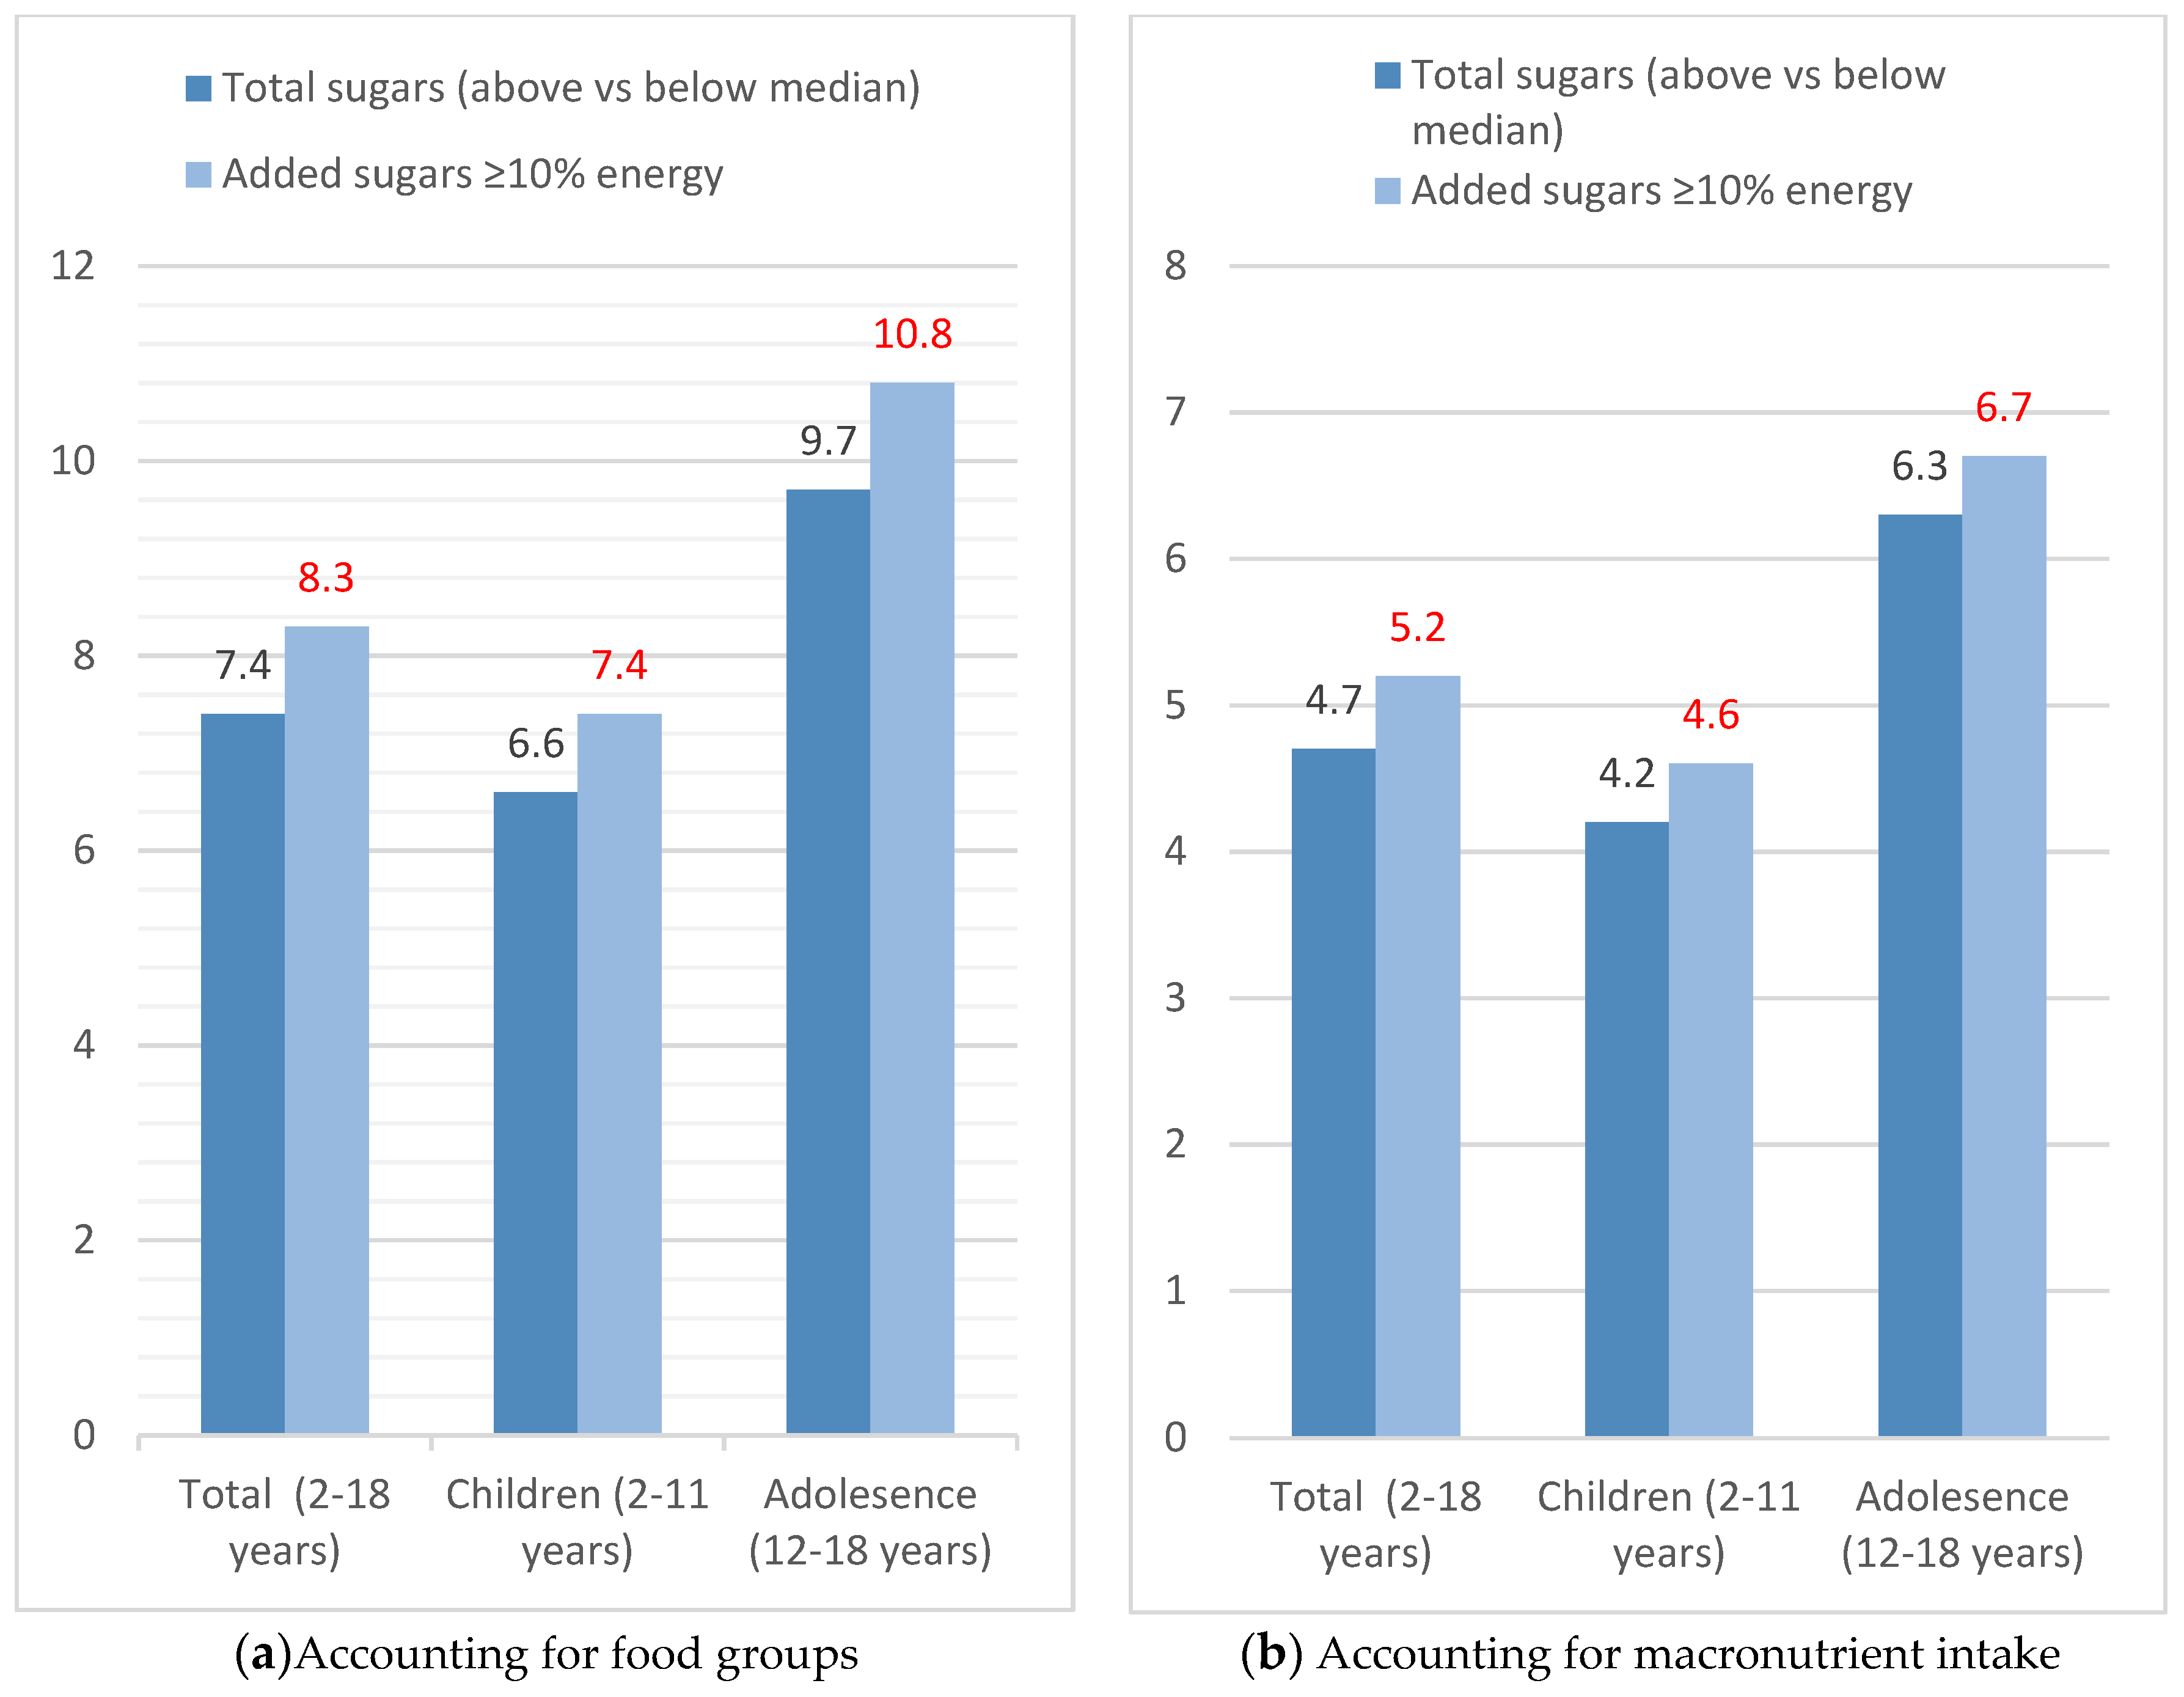
3. Results
4. Discussion
Supplementary Materials
Author Contributions
Funding
Institutional Review Board Statement
Acknowledgments
Conflicts of Interest
References
- World Health Organization (WHO). Obesity and Overweight. 2020. Available online: https://www.who.int/news-room/fact-sheets/detail/obesity-and-overweight (accessed on 27 April 2021).
- NCD Risk Factor Collaboration (NCD-RISC). Worldwide trends in body-mass index, underweight, overweight, and obesity from 1975 to 2016: A pooled analysis of 2416 population-based measurement studies in 128·9 million children, adolescents, and adults. Lancet 2017, 390, 2627–2642. [Google Scholar] [CrossRef] [Green Version]
- Spinelli, A.; Buoncristiano, M.; Kovacs, V.A.; Yngve, A.; Spiroski, I.; Obreja, G.; Starc, G.; Pérez, N.; Rito, A.I.; Kunešová, M.; et al. Prevalence of Severe Obesity among Primary School Children in 21 European Countries. Obes. Facts 2019, 12, 244–258. [Google Scholar] [CrossRef]
- Grundy, S.M.; Brewer, H.B., Jr.; Cleeman, J.I.; Smith, S.C., Jr.; Lenfant, C. Definition of metabolic syndrome: Report of the National Heart, Lung, and Blood Institute/American Heart Association conference on scientific issues related to definition. Circulation 2004, 109, 433–438. [Google Scholar] [CrossRef] [PubMed] [Green Version]
- Powell, E.S.; Smith-Taillie, L.P.; Popkin, B.M. Added Sugars Intake Across the Distribution of US Children and Adult Consumers: 1977–2012. J. Acad. Nutr. Diet. 2016, 116, 1543–1550.e1541. [Google Scholar] [CrossRef] [Green Version]
- Bray, G.A.; Popkin, B.M. Dietary sugar and body weight: Have we reached a crisis in the epidemic of obesity and diabetes? Health be damned! Pour on the sugar. Diabetes Care 2014, 37, 950–956. [Google Scholar] [CrossRef] [Green Version]
- Kahn, R.; Sievenpiper, J.L. Response to Comment on Kahn and Sievenpiper. Dietary Sugar and Body Weight: Have We Reached a Crisis in the Epidemic of Obesity and Diabetes? We Have, but the Pox on Sugar Is Overwrought and Overworked. Diabetes Care 2014; 37: 957–962. Diabetes Care 2014, 37, e189. [Google Scholar] [CrossRef] [PubMed] [Green Version]
- Ervin, R.B.; Ogden, C.L. Consumption of added sugars among U.S. adults, 2005–2010. NCHS Data Brief. 2013, 122, 1–8. [Google Scholar]
- Erickson, J.; Slavin, J. Total, Added, and Free Sugars: Are Restrictive Guidelines Science-Based or Achievable? Nutrients 2015, 7, 2866–2878. [Google Scholar] [CrossRef]
- Wang, H.; Jeong, H.; Kim, N.H.; Kang, Y.; Hwang, K.; Lee, H.; Hong, J.H.; Oh, K.S. Association between beverage intake and obesity in children: The Korea National Health and Nutrition Examination Survey (KNHANES) 2013–2015. Nutr. Res. Pract. 2018, 12, 307–314. [Google Scholar] [CrossRef] [PubMed]
- Laverty, A.A.; Magee, L.; Monteiro, C.A.; Saxena, S.; Millett, C. Sugar and artificially sweetened beverage consumption and adiposity changes: National longitudinal study. Int. J. Behav. Nutr. Phys. Act. 2015, 12, 137. [Google Scholar] [CrossRef] [Green Version]
- Millar, L.; Rowland, B.; Nichols, M.; Swinburn, B.; Bennett, C.; Skouteris, H.; Allender, S. Relationship between raised BMI and sugar sweetened beverage and high fat food consumption among children. Obesity 2014, 22, E96–E103. [Google Scholar] [CrossRef]
- Yu, P.; Chen, Y.; Zhao, A.; Bai, Y.; Zheng, Y.; Zhao, W.; Zhang, Y. Consumption of sugar-sweetened beverages and its association with overweight among young children from China. Public Health Nutr. 2016, 19, 2336–2346. [Google Scholar] [CrossRef] [Green Version]
- Farajian, P.; Risvas, G.; Panagiotakos, D.B.; Zampelas, A. Food sources of free sugars in children’s diet and identification of lifestyle patterns associated with free sugars intake: The GRECO (Greek Childhood Obesity) study. Public Health Nutr. 2016, 19, 2326–2335. [Google Scholar] [CrossRef] [Green Version]
- Nicklas, T.A.; O’Neil, C.E.; Liu, Y. Intake of added sugars is not associated with weight measures in children 6 to 18 years: National Health and Nutrition Examination Surveys 2003–2006. Nutr. Res. 2011, 31, 338–346. [Google Scholar] [CrossRef]
- Lommi, S.; Figueiredo, R.A.O.; Tuorila, H.; Viljakainen, H. Frequent use of selected sugary products associates with thinness, but not overweight during preadolescence: A cross-sectional study. Br. J. Nutr. 2020, 124, 631–640. [Google Scholar] [CrossRef] [Green Version]
- Lin, P.Y.; Lin, F.Y.; Chen, T.C.; Chen, W.L.; Doong, J.Y.; Shikanai, S.; Sarukura, N.; Yamamoto, S. Relationship between Sugar Intake and Obesity among School-Age Children in Kaohsiung, Taiwan. J. Nutr. Sci. Vitaminol. 2016, 62, 310–316. [Google Scholar] [CrossRef] [PubMed] [Green Version]
- Shikanai, S.; Koung Ry, L.; Takeichi, H.; Emiko, S.; San, P.; Sarukura, N.; Kamoshita, S.; Yamamoto, S. Sugar intake and body weight in Cambodian and Japanese children. J. Med. Investig. 2014, 61, 72–78. [Google Scholar] [CrossRef] [PubMed] [Green Version]
- Morales-Suarez-Varela, M.; Peraita-Costa, I.; Llopis-Morales, A.; Picó, Y.; Bes-Rastrollo, M.; Llopis-Gonzalez, A. Total Sugar Intake and Macro and Micronutrients in Children Aged 6–8 Years: The ANIVA Study. Nutrients 2020, 12, 349. [Google Scholar] [CrossRef] [PubMed] [Green Version]
- Valente, H.; Teixeira, V.; Padrão, P.; Bessa, M.; Cordeiro, T.; Moreira, A.; Mitchell, V.; Lopes, C.; Mota, J.; Moreira, P. Sugar-sweetened beverage intake and overweight in children from a Mediterranean country. Public Health Nutr. 2011, 14, 127–132. [Google Scholar] [CrossRef] [Green Version]
- Wang, J.; Shang, L.; Light, K.; O’Loughlin, J.; Paradis, G.; Gray-Donald, K. Associations between added sugar (solid vs. liquid) intakes, diet quality, and adiposity indicators in Canadian children. Appl. Physiol. Nutr. Metab. 2015, 40, 835–841. [Google Scholar] [CrossRef] [Green Version]
- Liberali, R.; Kupek, E.; Assis, M.A.A.D. Dietary Patterns and Childhood Obesity Risk: A Systematic Review. Child. Obes. 2020, 16, 70–85. [Google Scholar] [CrossRef] [PubMed]
- Magriplis, E.; Dimakopoulos, I.; Karageorgou, D.; Mitsopoulou, A.V.; Bakogianni, I.; Micha, R.; Michas, G.; Ntouroupi, T.; Tsaniklidou, S.M.; Argyri, K.; et al. Aims, design and preliminary findings of the Hellenic National Nutrition and Health Survey (HNNHS). BMC Med. Res. Methodol. 2019, 19, 37. [Google Scholar] [CrossRef] [PubMed]
- Blanton, C.A.; Moshfegh, A.J.; Baer, D.J.; Kretsch, M.J. The USDA Automated Multiple-Pass Method accurately estimates group total energy and nutrient intake. J. Nutr. 2006, 136, 2594–2599. [Google Scholar] [CrossRef]
- Moshfegh, A.J.; Rhodes, D.G.; Baer, D.J.; Murayi, T.; Clemens, J.C.; Rumpler, W.V.; Paul, D.R.; Sebastian, R.S.; Kuczynski, K.J.; Ingwersen, L.A.; et al. The US Department of Agriculture Automated Multiple-Pass Method reduces bias in the collection of energy intakes. Am. J. Clin. Nutr. 2008, 88, 324–332. [Google Scholar] [CrossRef] [PubMed]
- Burrows, T.L.; Martin, R.J.; Collins, C.E. A systematic review of the validity of dietary assessment methods in children when compared with the method of doubly labeled water. J. Am. Diet. Assoc. 2010, 110, 1501–1510. [Google Scholar] [CrossRef]
- Trichopoulou, A.; Georga, K. Composition Tables of Foods and Greek Dishes; Parisianou Publications: Athens, GA, USA, 2004. [Google Scholar]
- Block, G.; Dresser, C.M.; Hartman, A.M.; Carroll, M.D. Nutrient sources in the American diet: Quantitative data from the NHANES II survey. I. Vitamins and minerals. Am. J. Epidemiol. 1985, 122, 13–26. [Google Scholar] [CrossRef]
- U.S. Department of Health and Human Services; U.S. Department of Agriculture. 2015–2020 Dietary Guidelines for Americans, 8th ed.; 2015. Available online: https://health.gov/our-work/food-nutrition/previous-dietary-guidelines/2015 (accessed on 9 May 2021).
- Cole, T.J.; Lobstein, T. Extended international (IOTF) body mass index cut-offs for thinness, overweight and obesity. Pediatric Obes. 2012, 7, 284–294. [Google Scholar] [CrossRef] [PubMed]
- Brophy, S.; Cooksey, R.; Gravenor, M.B.; Mistry, R.; Thomas, N.; Lyons, R.A.; Williams, R. Risk factors for childhood obesity at age 5: Analysis of the millennium cohort study. BMC Public Health 2009, 9, 467. [Google Scholar] [CrossRef] [Green Version]
- Dwyer, G.M.; Hardy, L.L.; Peat, J.K.; Baur, L.A. The validity and reliability of a home environment preschool-age physical activity questionnaire (Pre-PAQ). Int. J. Behav. Nutr. Phys. Act. 2011, 8, 86. [Google Scholar] [CrossRef] [Green Version]
- Hagströmer, M.; Bergman, P.; De Bourdeaudhuij, I.; Ortega, F.B.; Ruiz, J.R.; Manios, Y.; Rey-López, J.P.; Phillipp, K.; von Berlepsch, J.; Sjöström, M. Concurrent validity of a modified version of the International Physical Activity Questionnaire (IPAQ-A) in European adolescents: The HELENA Study. Int. J. Obes. 2008, 32, S42–S48. [Google Scholar] [CrossRef] [PubMed] [Green Version]
- Arvidsson, D.; Slinde, F.; Hulthèn, L. Physical activity questionnaire for adolescents validated against doubly labelled water. Eur. J. Clin. Nutr. 2005, 59, 376–383. [Google Scholar] [CrossRef] [PubMed] [Green Version]
- Börnhorst, C.; Huybrechts, I.; Hebestreit, A.; Krogh, V.; De Decker, A.; Barba, G.; Moreno, L.A.; Lissner, L.; Tornaritis, M.; Loit, H.M.; et al. Usual energy and macronutrient intakes in 2–9-year-old European children. Int. J. Obes. 2014, 38, S115–S123. [Google Scholar] [CrossRef] [PubMed] [Green Version]
- Tooze, J.A.; Krebs-Smith, S.M.; Troiano, R.P.; Subar, A.F. The accuracy of the Goldberg method for classifying misreporters of energy intake on a food frequency questionnaire and 24-h recalls: Comparison with doubly labeled water. Eur. J. Clin. Nutr. 2012, 66, 569–576. [Google Scholar] [CrossRef] [Green Version]
- Hess, J.; Latulippe, M.E.; Ayoob, K.; Slavin, J. The confusing world of dietary sugars: Definitions, intakes, food sources and international dietary recommendations. Food Funct. 2012, 3, 477–486. [Google Scholar] [CrossRef]
- Newens, K.J.; Walton, J. A review of sugar consumption from nationally representative dietary surveys across the world. J. Hum. Nutr. Diet. 2016, 29, 225–240. [Google Scholar] [CrossRef] [Green Version]
- Brisbois, T.D.; Marsden, S.L.; Anderson, G.H.; Sievenpiper, J.L. Estimated intakes and sources of total and added sugars in the Canadian diet. Nutrients 2014, 6, 1899–1912. [Google Scholar] [CrossRef] [PubMed] [Green Version]
- Marriott, B.P.; Olsho, L.; Hadden, L.; Connor, P. Intake of added sugars and selected nutrients in the United States, National Health and Nutrition Examination Survey (NHANES) 2003–2006. Crit. Rev. Food Sci. Nutr. 2010, 50, 228–258. [Google Scholar] [CrossRef]
- Joyce, T.; Gibney, M.J. The impact of added sugar consumption on overall dietary quality in Irish children and teenagers. J. Hum. Nutr. Diet. 2008, 21, 438–450. [Google Scholar] [CrossRef]
- Fulgoni, V.L., III; Gaine, P.C.; Scott, M.O.; Ricciuto, L.; DiFrancesco, L. Association of Added Sugars Intake with Micronutrient Adequacy in US Children and Adolescents: NHANES 2009–2014. Curr. Dev. Nutr. 2019, 3, nzz126. [Google Scholar] [CrossRef]
- Felitti, V.J.; Jakstis, K.; Pepper, V.; Ray, A. Obesity: Problem, solution, or both? Perm. J. 2010, 14, 24–30. [Google Scholar] [CrossRef]
- Benton, D.; Young, H.A. Reducing Calorie Intake May Not Help You Lose Body Weight. Perspect. Psychol. Sci. 2017, 12, 703–714. [Google Scholar] [CrossRef] [Green Version]
- McKelvey, L.M.; Saccente, J.E.; Swindle, T.M. Adverse Childhood Experiences in Infancy and Toddlerhood Predict Obesity and Health Outcomes in Middle Childhood. Child. Obes. 2019, 15, 206–215. [Google Scholar] [CrossRef] [PubMed]
- Mitsopoulou, A.V.; Magriplis, E.; Michas, G.; Micha, R.; Chourdakis, M.; Chrousos, G.P.; Roma, E.; Panagiotakos, D.B.; Zampelas, A.; Karageorgou, D.; et al. Micronutrient dietary intakes and their food sources in adults: The Hellenic National Nutrition and Health Survey (HNNHS). J. Hum. Nutr. Diet. 2021, 34, 616–628. [Google Scholar] [CrossRef] [PubMed]
- Akgul Gundogdu, N.; Sevig, E.U.; Guler, N. The effect of the solution-focused approach on nutrition-exercise attitudes and behaviours of overweight and obese adolescents: Randomised controlled trial. J. Clin. Nurs. 2018, 27, e1660–e1672. [Google Scholar] [CrossRef] [PubMed]


| Age Category | ||||
|---|---|---|---|---|
| Total | Children | Adolescents | p Value | |
| n | 1165 | 781 | 384 | - |
| Weight, kg, mean (SD) | 40.7 (17.1) | 31.9 (10.6) | 58.6 (13.6) | <0.001 |
| Height, m, mean, (SD) | 1.44 (0.23) | 1.33 (0.19) | 1.66 (0.11) | <0.001 |
| BMI, kg/m2, mean, (SD) | 18.5 (3.3) | 17.3 (2.4) | 21.1 (3.4) | <0.001 |
| Weight status *, n (%) | <0.001 | |||
| Healthy weight | 1000 (85.8) | 699 (89.5) | 301 (78.4) | |
| Overweight | 142 (12.2) | 66 (8.5) | 76 (19.8) | |
| Obese | 23 (2.0) | 16 (2.1) | 7 (1.8) | |
| Total sugar | ||||
| Grams, median (IQR) | 43.7 (32.5, 70.0) | 41.2 (41.2, 66.8) | 55.7 (38.1, 80.6) | <0.001 |
| Total calories from total sugars, median (IQR) | 175 (165, 280) | 165 (165, 267) | 222 (153, 319) | <0.001 |
| Total % energy intake, mean, (SD) | 15.6 (6.7) | 16.3 (6.3) | 14.3 (7.4) | <0.001 |
| ≥median, n (%) | 587 (41.8) | 303 (38.8) | 184 (47.9) | 0.003 |
| Added sugar | ||||
| Total grams, median (IQR) | 28.4 (17.7, 34.5) | 28.4 (22.7, 28.4) | 24.5 (13.1, 44.6) | <0.001 |
| Total calories from added sugar, median (IQR) | 114 (71, 138) | 114 (91, 114) | 98 (52, 178) | <0.001 |
| Total % energy intake median (IQR) | 9.4 (4.5, 9.4) | 9.4 (6.3, 9.4) | 5.5 (3.5, 9.8) | <0.001 |
| ≥median, n (%) | 259 (22.2) | 156 (20.0) | 0.008 | |
| ≥10% of total energy, n (%) | 240 (20.6) | 146 (18.7) | 94 (24.5) | 0.022 |
| Total METS, median (IQR) | 0 (0, 3953) | 0 (0, 2016) | 3228 (1477, 6628) | <0.001 |
| Total screen time (hours), median 1 (IQR) | 3 (1.5, 3.75) | 3.75 (1.6, 3.75) | 2.45 (1.3, 4.0) | <0.001 |
| Primary guardian Educational level, n (%) | <0.001 | |||
| ≤6 years | 29 (3.11) | 8 (1.2) | 21 (7.6) | |
| >6–12 years | 599 (64.2) | 457 (69.6) | 142 (51.5) | |
| ≥12 years | 305 (32.7) | 192 (29.2) | 113 (40.9) | |
| Primary Guardian Professional Status, n (%) | <0.001 | |||
| Employed | 727 (78.8) | 561 (86.0) | 166 (61.3) | |
| Unemployed/Homeworkers | 157 (17.0) | 86 (13.2) | 71 (26.2) | |
| Pension | 30 (4.2) | 5 (0.8) | 34 (12.6) |
| Food Group Intake Per Day | Added Sugars Intake Status | Significance | ||
|---|---|---|---|---|
| <10% Total Calories | ≥10% Total Calories | p Value | ||
| Children (2–11 years) | Food groups (median; IQR) | |||
| Fruit, gr | 0 (0, 116) | 71.3 (0, 166) | <0.001 | |
| Vegetables, gr | 0 (0, 71) | 55 (14, 96.2) | <0.001 | |
| Animal protein, gr | 53 1 | 54 (22, 86) | <0.001 | |
| Non milk dairy, gr | 30 1 | 20.1 (0, 46.5) | <0.001 | |
| Energy, kcal | 1378 (571) | 1692 (777) | <0.001 | |
| Macronutrients, % Energy | ||||
| Non sugars carbohydrates | 29.8 (6.3) | 27.0 (8.9) | <0.001 | |
| Total sugars | 14.6 (4.3) | 23.9 (8.1) | <0.001 | |
| Animal protein | 7.5 (7.5, 7.6) | 7.1 (4.7, 10.3) | <0.001 | |
| Vegetable protein | 4.1 (1.2) | 4.2 (1.8) | 0.514 | |
| Total Fat | 40.1 (5.8) | 36.7 (7.0) | <0.001 | |
| Total Fiber | 7.1 (7.1, 9.9) | 10.7 (7.5, 16.5) | <0.001 | |
| Adolescents (12–18 years) | Food groups (median; IQR) | |||
| Fruit, gr | 87 (0, 193) | 4 (0, 147) | 0.029 | |
| Vegetables, gr | 138 (59, 254) | 110 (41, 199) | 0.135 | |
| Animal protein, gr | 98 (52, 183) | 59 (23, 106) | <0.001 | |
| Non milk dairy, gr | 30 (11, 73) | 23 (7, 60) | 0.180 | |
| Energy, kcal | 1862 (749) | 1799 (780) | 0.484 | |
| Macronutrients, %Energy | ||||
| Non sugars carbohydrates | 29.4 (8.3) | 29.3 (10.0) | 0.889 | |
| Total sugars | 12.2 (6.5) | 20.7 (6.0 | <0.001 | |
| Animal protein, %Energy | 9.0 (5.5, 11.8) | 6.4 (4.1, 10.5) | <0.001 | |
| Vegetable protein, %Energy | 4.0 (2.0) | 4.2 (2.0) | 0.607 | |
| Total Fat, %Energy | 42.1 (9.0) | 37.7 (9.6) | <0.001 | |
| Total Fiber, gr/day | 12.9 (8.9, 18.3) | 13.1 (9.4, 18.2) | 0.726 | |
| Model 1 | Model 2 | |||||
|---|---|---|---|---|---|---|
| Odds Ratio | 95% Conf.Interval | Odds Ratio | [95% Conf.Interval] | |||
| Total Sugar, % energy (above vs below median) | 2.33 | 1.298 | 4.183 | 1.69 | 1.008 | 2.817 |
| Added Sugars, % energy (above vs below median) | 2.64 | 1.459 | 4.789 | 1.80 | 1.046 | 3.124 |
| Added Sugars ≥10% energy | 2.57 | 1.398 | 4.717 | 1.77 | 1.008 | 3.096 |
Publisher’s Note: MDPI stays neutral with regard to jurisdictional claims in published maps and institutional affiliations. |
© 2021 by the authors. Licensee MDPI, Basel, Switzerland. This article is an open access article distributed under the terms and conditions of the Creative Commons Attribution (CC BY) license (https://creativecommons.org/licenses/by/4.0/).
Share and Cite
Magriplis, E.; Michas, G.; Petridi, E.; Chrousos, G.P.; Roma, E.; Benetou, V.; Cholopoulos, N.; Micha, R.; Panagiotakos, D.; Zampelas, A. Dietary Sugar Intake and Its Association with Obesity in Children and Adolescents. Children 2021, 8, 676. https://doi.org/10.3390/children8080676
Magriplis E, Michas G, Petridi E, Chrousos GP, Roma E, Benetou V, Cholopoulos N, Micha R, Panagiotakos D, Zampelas A. Dietary Sugar Intake and Its Association with Obesity in Children and Adolescents. Children. 2021; 8(8):676. https://doi.org/10.3390/children8080676
Chicago/Turabian StyleMagriplis, Emmanuella, George Michas, Evgenia Petridi, George P. Chrousos, Eleftheria Roma, Vassiliki Benetou, Nikos Cholopoulos, Renata Micha, Demosthenes Panagiotakos, and Antonis Zampelas. 2021. "Dietary Sugar Intake and Its Association with Obesity in Children and Adolescents" Children 8, no. 8: 676. https://doi.org/10.3390/children8080676
APA StyleMagriplis, E., Michas, G., Petridi, E., Chrousos, G. P., Roma, E., Benetou, V., Cholopoulos, N., Micha, R., Panagiotakos, D., & Zampelas, A. (2021). Dietary Sugar Intake and Its Association with Obesity in Children and Adolescents. Children, 8(8), 676. https://doi.org/10.3390/children8080676