
Association of Blood Mercury Levels with the Risks of Overweight and High Waist-to-Height Ratio in Children and Adolescents: Data from the Korean National Health and Nutrition Examination Survey


Abstract
:1. Introduction
2. Materials and Methods
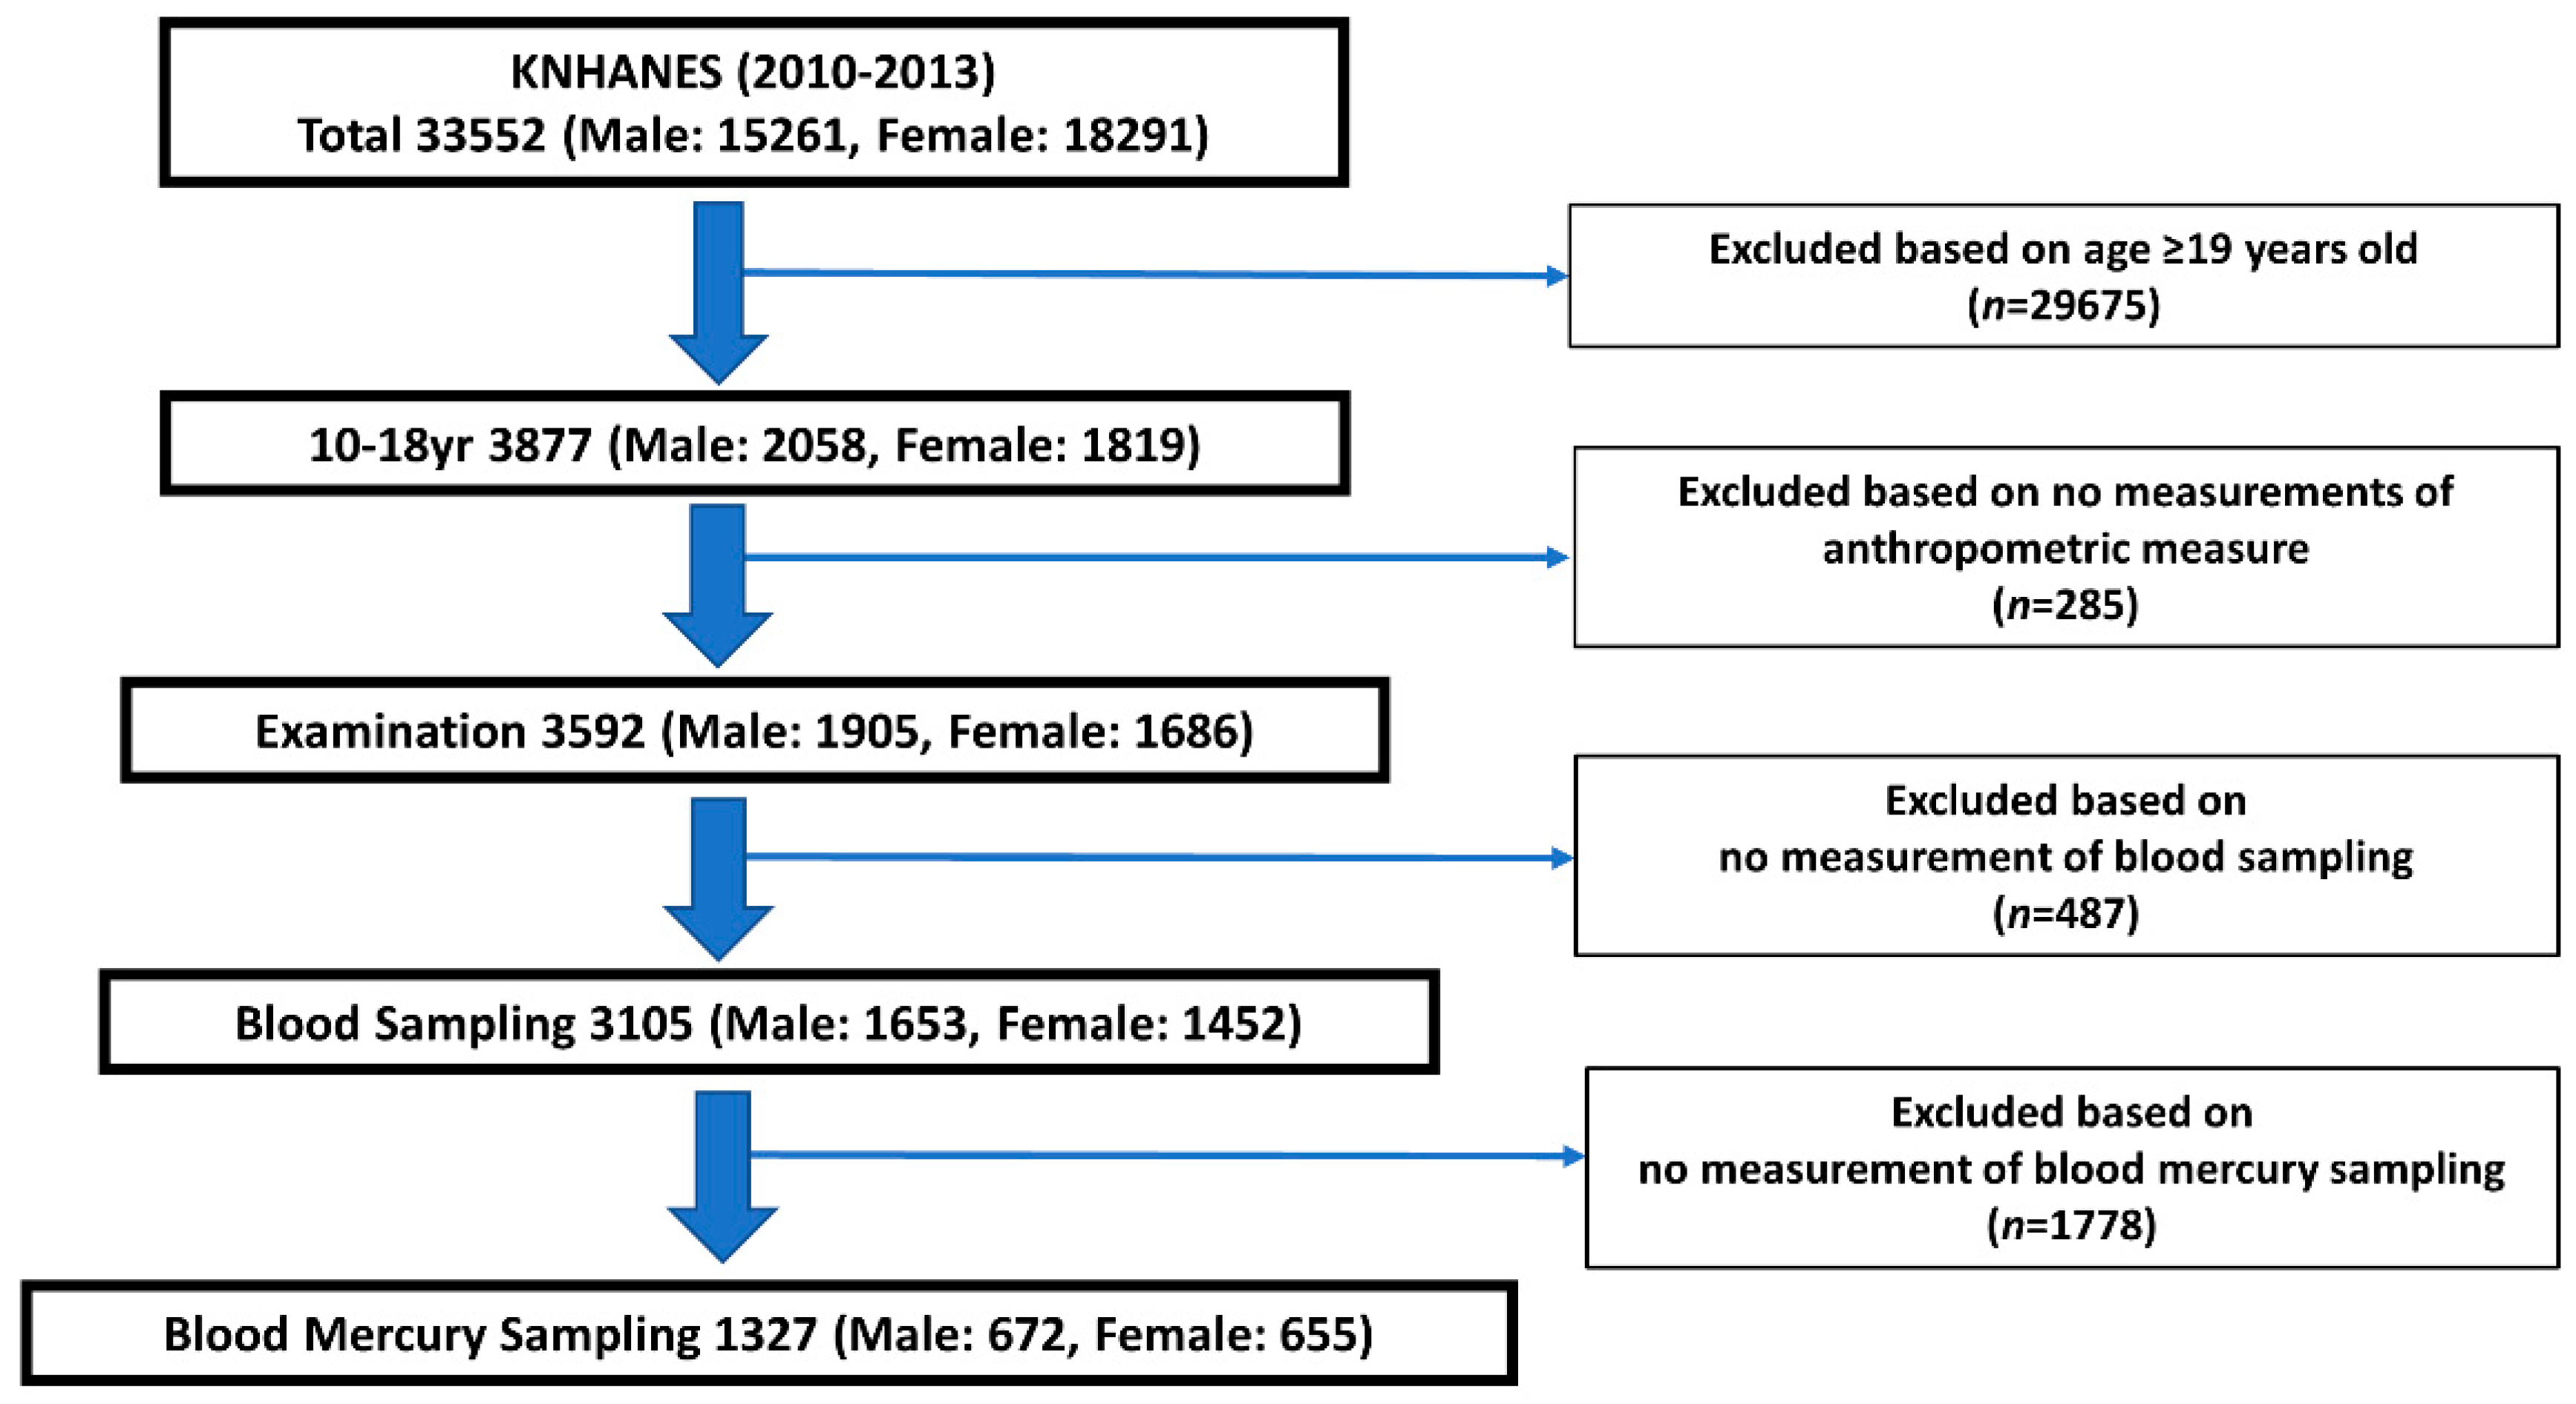
2.1. Study Design
2.2. Ethics Approval and Consent to Participate
2.3. Measurements of the Blood Mercury Levels in Whole Blood
2.4. Determination of Covariates
2.5. Statistical Analysis
3. Results
3.1. Characteristics of the Participant Subsection
3.2. Blood Mercury Levels according to the Participants’ General Characteristics
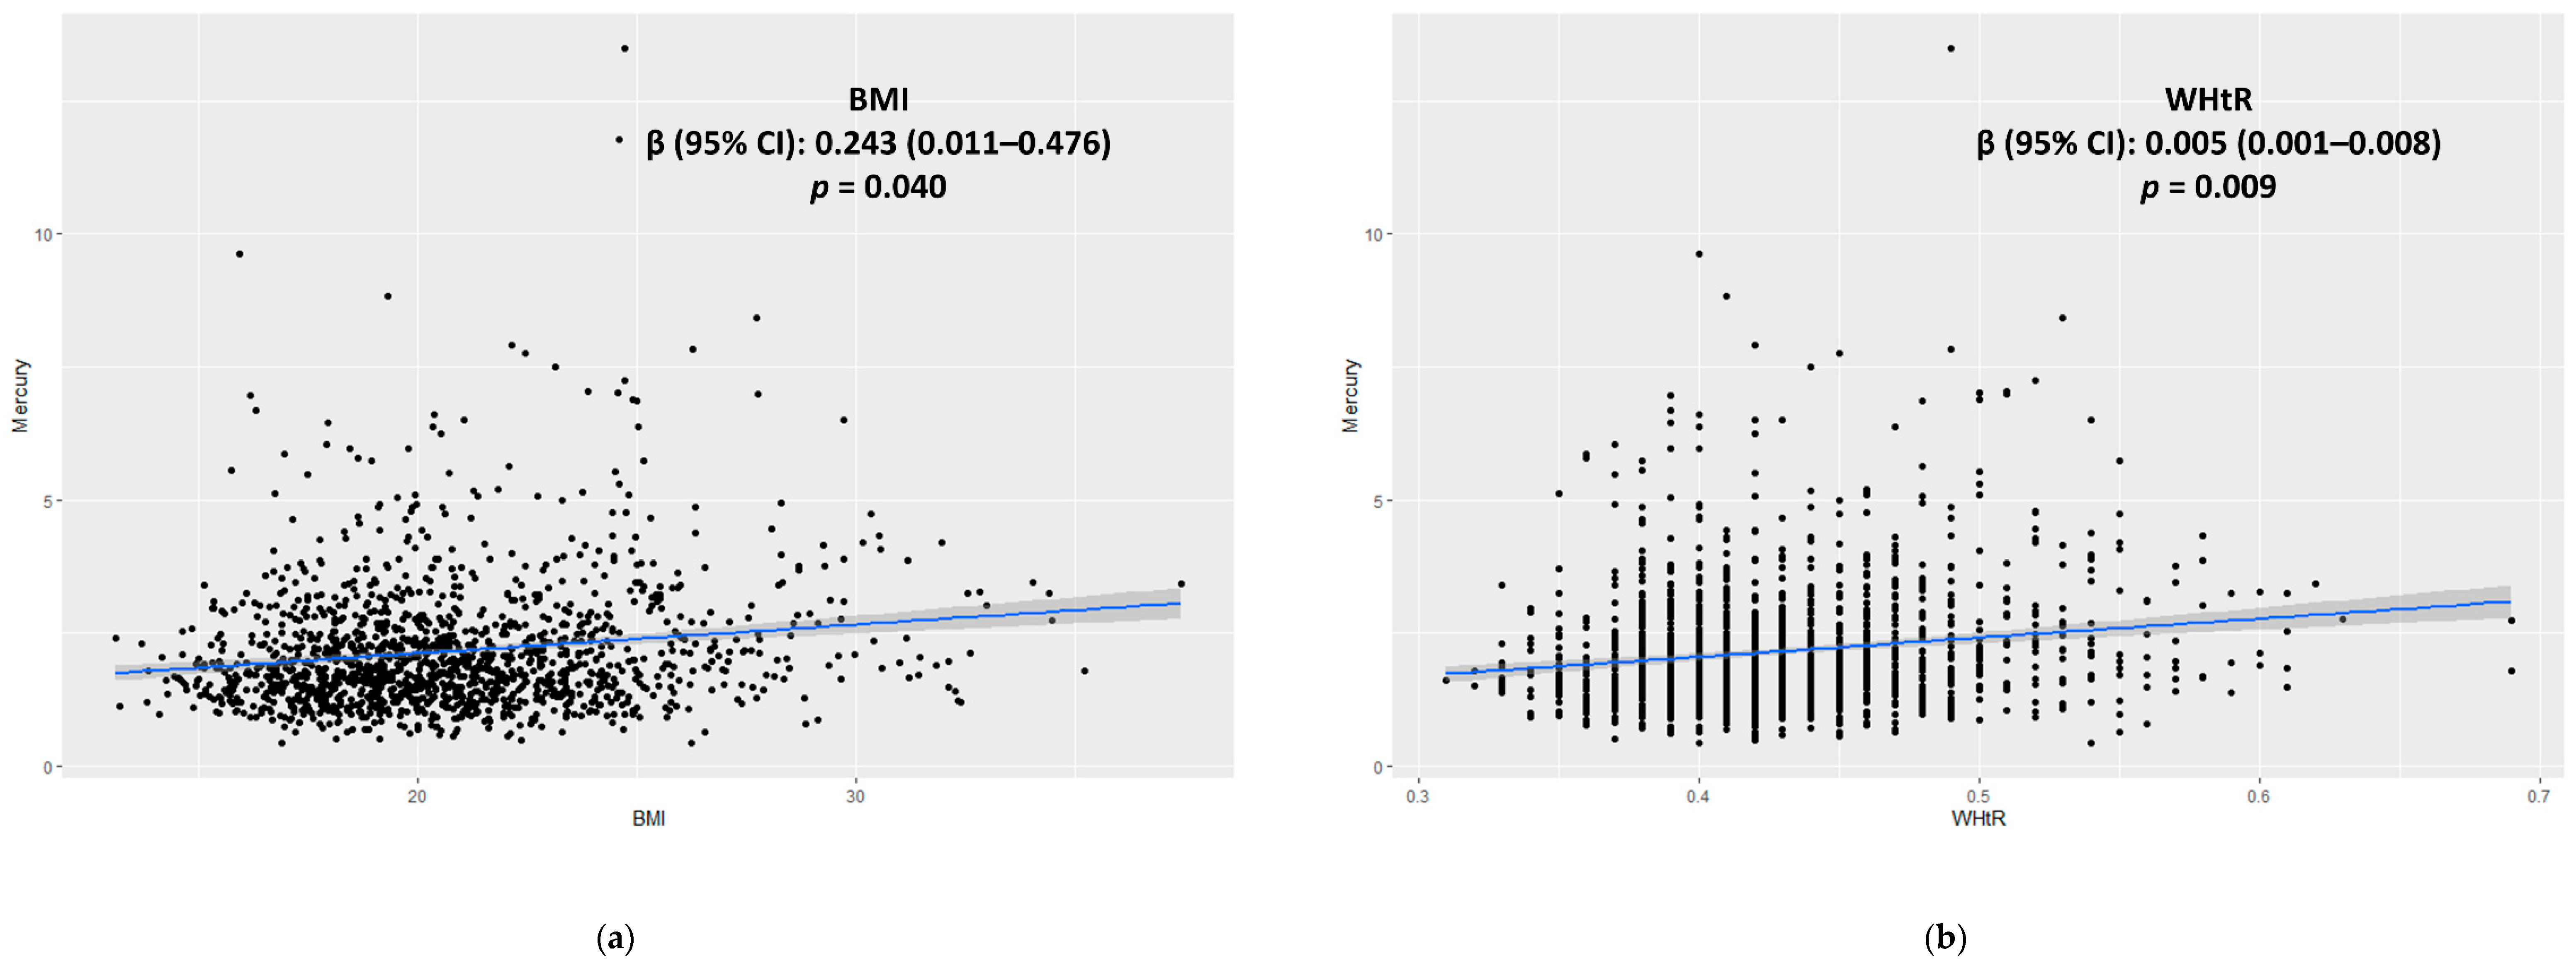
3.3. Associations among the BMI, WHtR, and Blood Mercury Levels
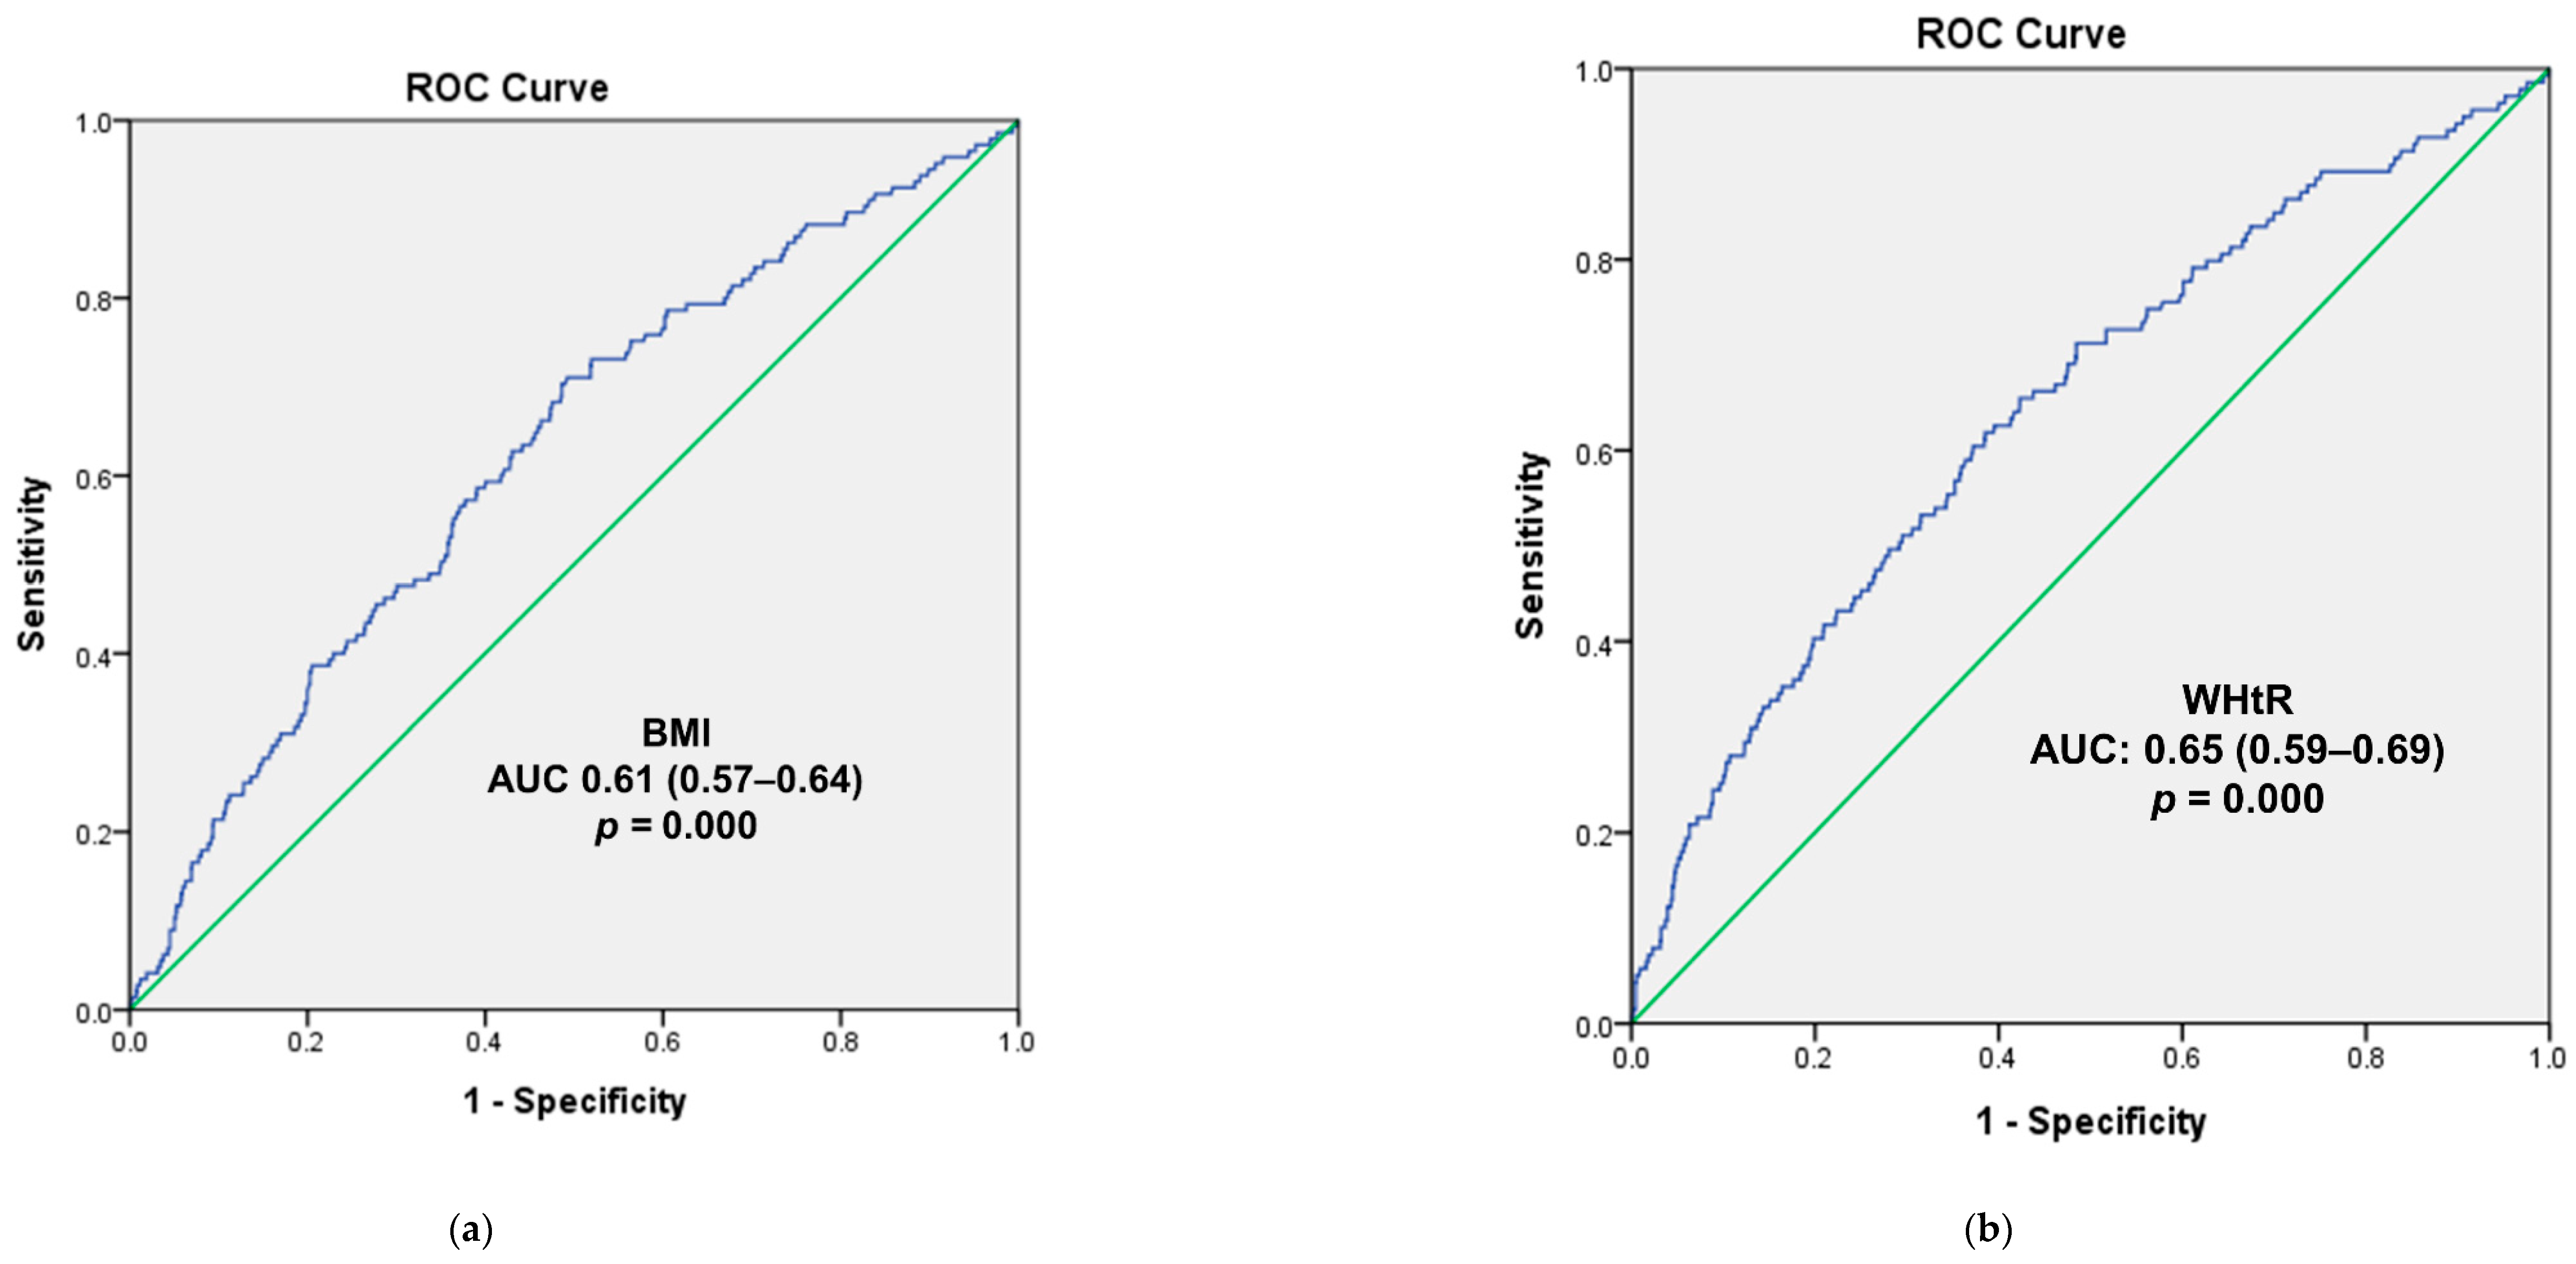
3.4. Logistic Regression and ROC Curve Analysis for the Overweight and High WHtR Groups

| All (n = 1327) | Male (n = 672) | Female (n = 655) | |||||||
|---|---|---|---|---|---|---|---|---|---|
| Normal (n = 1060) | Overweight (n = 267) | p Value | Normal (n = 529) | Overweight (n = 143) | p Value | Normal (n = 531) | Overweight (n = 124) | p Value | |
| Age (yrs.) | 14.33 ± 0.09 | 14.19 ± 0.18 | 0.48 | 14.37 ± 0.13 | 14.02 ± 0.25 | 0.20 | 14.29 ± 0.14 | 14.40 ± 0.27 | 0.71 |
| Age group | 0.55 | 0.30 | |||||||
| 10–12 yrs. | 360 (27.8) | 93 (28.3) | 182 (27.6) | 53 (31.3) | 178 (28.1) | 40 (24.6) | 0.80 | ||
| 13–15 yrs. | 380 (34.3) | 96 (37.8) | 194 (34.3) | 50 (38.7) | 186 (34.3) | 46 (36.6) | |||
| 16–18 yrs. | 320 (37.9) | 78 (33.9) | 153 (38.1) | 40 (29.9) | 167 (37.6) | 38 (38.8) | |||
| Year | 0.49 | 0.55 | 0.55 | ||||||
| 2010 | 266 (25.8) | 71 (24.1) | 125 (24.9) | 43 (26.7) | 141 (26.8) | 28 (21.0) | |||
| 2011 | 266 (26.1) | 72 (28.7) | 140 (26.9) | 33 (26.4) | 126 (25.2) | 39 (31.5) | |||
| 2012 | 277 (24.8) | 50 (20.4) | 141 (25.7) | 27 (19.4) | 136 (23.8) | 23 (21.5) | |||
| 2013 | 251 (23.3) | 74 (26.8) | 123 (22.6) | 40 (27.4) | 128 (24.2) | 34 (26.0) | |||
| Weight (kg) | 51.81 ± 0.37 | 70.77 ± 0.98 | 0.00 * | 54.53 ± 0.58 | 75.17 ± 1.54 | 0.00 * | 48.80 ± 0.40 | 65.39 ± 0.98 | 0.00 * |
| Height (cm) | 161.88 ± 0.39 | 163.54 ± 0.71 | 0.05 | 165.58 ± 0.63 | 166.78 ± 1.09 | 0.34 | 157.78 ± 0.38 | 159.59 ± 0.75 | 0.03 * |
| BMI (kg/m2) | 19.58 ± 0.08 | 26.19 ± 0.21 | 0.00 * | 19.66 ± 0.12 | 26.69 ± 0.26 | 0.00 * | 19.48 ± 0.10 | 25.60 ± 0.34 | 0.00 * |
| WC (cm) | 66.50 ± 0.08 | 82.19 ± 0.59 | 0.00 * | 67.78 ± 0.35 | 85.38 ± 0.84 | 0.00 * | 65.08 ± 0.31 | 78.28 ± 0.73 | 0.00 * |
| WHtR | 0.41 ± 0.00 | 0.50 ± 0.00 | 0.00 * | 0.41 ± 0.00 | 0.51 ± 0.00 | 0.00 * | 0.41 ± 0.00 | 0.49 ± 0.00 | 0.00 * |
| Mercury (µg/L) | 2.09 ± 0.04 | 2.43 ± 0.08 | 0.00 * | 2.13 ± 0.05 | 2.46 ± 0.10 | 0.01 * | 2.05 ± 0.06 | 2.39 ± 0.11 | 0.01 * |
| Hematocrit (%) | 41.66 ± 0.12 | 41.93 ± 0.23 | 0.30 | 43.28 ± 0.16 | 43.49 ± 0.33 | 0.55 | 39.87 ± 0.14 | 40.01 ± 0.21 | 0.56 |
| Seafood consumption in the previous 24 h (g/day) | 54.18 ± 3.27 | 59.31 ± 5.69 | 0.44 | 63.67 ± 5.49 | 52.76 ± 6.86 | 0.22 | 43.68 ± 3.16 | 67.68 ± 9.35 | 0.02 * |
| Household income | 0.42 | 0.15 | 0.22 | ||||||
| Quartile 1 | 126 (14.6) | 29 (12.7) | 61 (15.0) | 12 (11.0) | 65 (14.1) | 17 (14.8) | |||
| Quartile 2 | 274 (29.9) | 82 (34.1) | 137 (30.6) | 37 (29.3) | 137 (29.2) | 45 (39.7) | |||
| Quartile 3 | 342 (29.5) | 71 (24.5) | 172 (28.4) | 35 (22.3) | 170 (30.7) | 36 (27.1) | |||
| Quartile 4 | 311 (26.0) | 83 (28.7) | 156 (26.1) | 57 (37.4) | 155 (26.0) | 26 (18.3) | |||
| Consuming alcohol more than once in the last month | 0.32 | 0.57 | 0.40 | ||||||
| No | 1012 (95.3) | 253 (93.1) | 504 (94.0) | 133 (92.3) | 508 (96.8) | 120 (79.3) | |||
| Yes | 39 (4.7) | 11 (6.9) | 22 (6.0) | 9 (7.7) | 17 (3.2) | 2 (6.0) | |||
| Smoking more than once in the last month | 0.38 | 0.68 | 0.38 | ||||||
| No | 979 (93.7) | 239 (91.8) | 478 (91.1) | 124 (89.7) | 501 (96.7) | 115 (94.4) | |||
| Yes | 50 (6.3) | 18 (8.2) | 35 (8.9) | 12 (10.3) | 15 (3.3) | 6 (5.6) | |||
| Exercise in the last week | 0.07 | 0.02 * | 0.90 | ||||||
| Yes | 489 (57.7) | 136 (65.9) | 303 (68.8) | 88 (82.5) | 186 (45.0) | 48 (45.8) | |||
| No | 334 (42.3) | 63 (34.1) | 114 (31.2) | 18 (17.5) | 220 (55.0) | 45 (54.2) | |||
| All | Male | Female | |||||||
|---|---|---|---|---|---|---|---|---|---|
| n | Crude | Adjusted (n = 1096) | n | Crude | Adjusted (n = 553) | n | Crude | Adjusted (n = 543) | |
| All | 1327 | 2.16 (2.09–2.24) | 2.19 (2.06–2.26) | 672 | 2.13 (2.02–2.24) | 2.18 (1.98–2.38) | 655 | 2.05 (1.92–2.17) | 2.14 (1.91–2.36) |
| Age group | 1327 | 672 | 655 | ||||||
| 10–12 yrs. | 2.09 (1.99–2.19) | 2.31 (1.95–2.67) | 2.09 (1.95–2.24) | 2.39 (1.96–2.82) | 2.08 (1.96–2.20) | 2.21 (1.58–2.84) | |||
| 13–15 yrs. | 2.23 (2.11–2.36) | 2.27 (2.03–2.52) | 2.33 (2.16–2.50) | 2.30 (2.08–2.53) | 2.12 (1.96–2.28) | 2.17 (1.69–2.66) | |||
| 16–18 yrs. | 2.15 (2.02–2.28) | 1.96 (1.59–2.33) | 2.16 (2.02–2.31) | 1.73 (1.31–2.16) | 2.14 (1.92–2.36) | 2.25 (1.66–2.84) | |||
| Overweight Group | 1327 | 672 | 655 | ||||||
| Normal | 2.09 (2.01–2.17) | 2.07 (1.89–2.26) | 2.13 (2.02–2.24) | 2.06 (1.87–2.25) | 2.05 (1.92–2.17) | 2.15 (1.77–2.53) | |||
| Overweight | 2.43 (2.28–2.58) ** | 2.34 (2.08–2.59) ** | 2.46 (2.25–2.66) ** | 2.31 (2.04–2.58) * | 2.39 (2.17–2.62) ** | 2.35 (1.90–2.81) | |||
| WHtR Group | 1296 | 660 | 636 | ||||||
| Normal | 2.11 (2.04–3.29) | 2.14 (1.93–2.35) | 2.14 (2.04–2.24) | 2.16 (1.97–2.35) | 2.08 (1.97–2.20) | 2.22 (1.78–2.66) | |||
| High | 2.53 (2.28–2.77) ** | 2.49 (2.11–2.87)* | 2.51 (2.23–2.78) * | 2.38 (2.04–2.73) | 2.57 (2.07–3.07) * | 2.73 (1.87–3.60) | |||
| Hematocrit | 1327 | 672 | 655 | ||||||
| Quartile 1 | 1.99 (1.86–2.14) | 1.98 (1.74–2.22) | 1.85 (1.67–2.03) | 1.73 (1.45–2.01) | 2.04 (1.87–2.21) | 2.13 (1.71–2.55) | |||
| Quartile 2 | 2.15 (2.02–2.28) | 2.14 (1.88–2.39) | 2.14 (1.93–2.34) * | 1.97 (1.69–2.24) | 2.16 (1.99–2.33) | 2.31 (1.85–2.76) | |||
| Quartile 3 | 2.22 (2.09–2.34) * | 2.25 (2.01–2.49) * | 2.25 (2.09–2.41) ** | 2.24 (1.99–2.49) ** | 2.17 (1.96–2.38) | 2.28 (1.84–2.73) | |||
| Quartile 4 | 2.27 (2.13–2.41) ** | 2.24 (1.99–2.45) * | 2.28 (2.13–2.43) ** | 2.21 (1.98–2.45) ** | 2.16 (1.77–2.54) | 2.37 (1.77–2.97) | |||
| Household Income | 1318 | 667 | 651 | ||||||
| Quartile 1 | 2.12 (1.97–2.27) | 2.11 (1.86–2.35) | 2.11 (1.90–2.31) | 2.08 (1.83–2.34) | 2.13 (1.92–2.36) | 2.20 (1.73–2.67) | |||
| Quartile 2 | 2.03 (1.91–2.15) | 2.01 (1.78–2.25) | 1.98 (1.84–2.11) | 1.92 (1.70–2.13) | 2.09 (1.89–2.28) | 2.17 (1.72–2.62) | |||
| Quartile 3 | 2.16 (2.04–2.28) | 2.12 (1.88–2.35) | 2.24 (2.07–2.41) | 2.14 (1.88–2.39) | 2.07 (1.91–2.23) | 2.16 (1.73–2.59) | |||
| Quartile 4 | 2.35 (2.19–2.52) * | 2.34 (2.06–2.61) | 2.46 (2.23–2.68) * | 2.34 (2.05–2.63) | 2.21 (1.96–2.47) | 2.34 (1.86–2.83) | |||
| Seafood Consumption | 1137 | 576 | 561 | ||||||
| Quartile 1 | 1.99 (1.87–2.13) | 1.98 (1.77–2.20) | 2.09 (1.91–2.27) | 2.02 (1.78–2.26) | 1.91 (1.71–2.10) | 1.96 (1.55–2.38) | |||
| Quartile 2 | 2.13 (1.97–2.29) | 2.10 (1.85–2.36) | 2.15 (1.94–2.37) | 2.04 (1.77–2.31) | 2.10 (1.85–2.26) | 2.18 (1.72–2.64) | |||
| Quartile 3 | 2.19 (2.06–2.32) * | 2.14 (1.90–2.37) | 2.26 (2.04–2.47) | 2.10 (1.84–2.37) | 2.13 (1.97–2.29) | 2.21 (1.77–2.64) * | |||
| Quartile 4 | 2.38 (2.22–2.54) ** | 2.33 (2.04–2.61) * | 2.34 (2.17–2.51) * | 2.29 (2.05–2.53) * | 2.44 (2.13–2.75) ** | 2.49 (2.02–2.96) ** | |||
| Alcohol consumption more than once in the last month | 1315 | 668 | 647 | ||||||
| No | 2.16 (2.09–2.24) | 2.19 (2.04–2.33) | 2.21 (2.11–2.31) | 2.21 (2.06–2.36) | 2.12 (2.01–2.23) | 2.22 (1.87–2.56) | |||
| Yes | 2.17 (1.92–2.42) | 2.09 (1.75–2.45) | 2.15 (1.92–2.38) | 2.03 (1.72–2.34) | 2.20 (1.63–2.77) | 2.23 (1.56–2.89) | |||
| Smoking during the last month | 1021 | 649 | 637 | ||||||
| No | 2.17 (2.09–2.24) | 2.16 (1.99–2.32) | 2.21 (2.10–2.31) | 2.15 (1.99–2.30) | 2.13 (2.02–2.24) | 2.16 (1.85–2.48) | |||
| Yes | 2.13 (1.91–2.35) | 2.13 (1.81–2.45) | 2.15 (1.95–2.36) | 2.09 (1.80–2.39) | 2.06 (.146–2.66) | 2.28 (1.59–2.97) | |||
| Exercise in the last week | 1022 | 523 | 499 | ||||||
| Yes | 2.22 (2.12–2.33) | 2.19 (1.98–2.41) | 2.23 (2.11–2.35) | 2.15 (1.96–2.34) | 2.21 (2.01–2.40) | 2.36 (1.90–2.84) * | |||
| No | 2.09 (1.97–2.22) | 2.11 (1.87–2.35) | 2.19 (1.99–2.41) | 2.22 (1.95–2.48) | 2.03 (1.87–2.18) | 2.09 (1.65–2.55) * | |||
| Body Mass Index | |||||||||
| n | All (n = 1327) | p Value | n | Male (n = 672) | p Value | n | Female (n = 655) | p Value | |
| Model 1 | 1327 | 0.480 (0.270–0.689) | 0.000 * | 672 | 0.451 (0.160–0.741) | 0.002 * | 655 | 0.497 (0.190–0.803) | 0.002 * |
| Model 2 | 1327 | 0.446 (0.235–0.657) | 0.000 * | 672 | 0.425 (0.136–0.713) | 0.004 * | 655 | 0.473 (0.157–0.788) | 0.003 * |
| Model 3 | 1137 | 0.308 (0.097–0.519) | 0.004 * | 576 | 0.280 (0.002–0.558) | 0.050 * | 561 | 0.311 (-0.024–0.647) | 0.070 |
| Model 4 | 1096 | 0.311 (0.090–0.532) | 0.006 * | 553 | 0.268 (−0.030–0.565) | 0.080 | 543 | 0.290 (−0.032–0.613) | 0.080 |
| Model 5 | 833 | 0.243 (0.011–0.476) | 0.040 * | 424 | 0.236 (−0.056–0.527) | 0.110 | 409 | 0.257 (−0.106–0.620) | 0.160 |
| Waist to Height Ratio | |||||||||
| n | All (n = 1327) | p Value | n | Male (n = 672) | p Value | n | Female (n = 655) | p Value | |
| Model 1 | 1325 | 0.006 (0.003–0.009) | 0.000 * | 672 | 0.006 (0.001–0.010) | 0.012 * | 653 | 0.007 (0.003–0.012) | 0.001 * |
| Model 2 | 1325 | 0.006 (0.003–0.009) | 0.000 * | 672 | 0.006 (0.002–0.010) | 0.008 * | 653 | 0.007 (0.003–0.012) | 0.002 * |
| Model 3 | 1135 | 0.005 (0.002–0.008) | 0.002 * | 576 | 0.004 (0.000–0.008) | 0.070 | 559 | 0.006 (0.001–0.011) | 0.024 * |
| Model 4 | 1094 | 0.005 (0.002–0.009) | 0.001 * | 553 | 0.004 (0.000–0.008) | 0.060 | 541 | 0.006 (0.001–0.011) | 0.031 * |
| Model 5 | 831 | 0.005 (0.001–0.008) | 0.009 * | 424 | 0.003 (−0.001–0.008) | 0.164 | 407 | 0.005 (0.001–0.007) | 0.016 * |
| Body Mass Index | ||||||||||
| All (n = 1327) | p | p for Trend | Male (n = 672) | p | p for Trend | Female (n = 655) | p | p for Trend | ||
| Crude | 1.32 (1.13–1.55) | 0.001 * | 1.24 (1.01–1.54) | 0.04 * | 1.42 (1.12–1.80) | 0.004 * | ||||
| Q1 | Reference | Reference | Reference | |||||||
| Q2 | 0.98 (0.61–1.57) | 0.93 | 1.31 (0.69–2.49) | 0.413 | 0.65 (0.32–1.29) | 0.22 | ||||
| Q3 | 1.03 (0.64–1.65) | 0.90 | 0.89 (0.46–1.72) | 0.726 | 1.21 (0.62–2.37) | 0.57 | ||||
| Q4 | 2.27 (1.45–3.75) | 0.00 * | 2.16 (1.17–4.01) | 0.015 * | 2.40 (1.23–4.69) | 0.01 * | ||||
| Model 1 | 1.32 (1.13–1.55) | 0.001 * | 1.26 (1.02–1.56) | 0.03 * | 1.42 (1.12–1.80) | 0.004 * | ||||
| Q1 | Reference | Reference | Reference | |||||||
| Q2 | 0.98 (0.61–1.57) | 0.93 | 1.39 (0.72–2.66) | 0.327 | 0.65 (0.33–1.30) | 0.23 | ||||
| Q3 | 1.03 (0.64–1.66) | 0.89 | 0.93 (0.48–1.82) | 0.833 | 1.22 (0.63–2.38) | 0.56 | ||||
| Q4 | 2.28 (1.45–3.59) | 0.00 * | 2.28 (1.21–4.27) | 0.010 * | 2.41 (1.23–4.71) | 0.01 * | ||||
| Model 2 | 1.23 (1.03–1.46) | 0.02 * | 1.21 (0.96–1.52) | 0.10 | 1.27 (0.98–1.65) | 0.06 | ||||
| Q1 | Reference | Reference | Reference | |||||||
| Q2 | 1.01 (0.61–1.64) | 0.99 | 1.54 (0.76–3.10) | 0.230 | 0.62 (0.30–1.28) | 0.19 | ||||
| Q3 | 0.92 (0.56–1.54) | 0.76 | 0.90 (0.44–1.85) | 0.781 | 1.04 (0.51–2.13) | 0.92 | ||||
| Q4 | 1.88 (1.14–3.15) | 0.01 * | 2.16 (1.06–4.40) | 0.033 * | 1.70 (0.86–3.72) | 0.12 | ||||
| Model 3 | 1.22 (1.03–1.46) | 0.02 * | 1.19 (0.95–1.51) | 0.12 | 1.26 (0.97–1.63) | 0.07 | ||||
| Q1 | Reference | Reference | Reference | |||||||
| Q2 | 0.88 (0.48–1.30) | 0.99 | 1.55 (0.77–3.15) | 0.221 | 0.62 (0.84–3.63) | 0.13 | ||||
| Q3 | 0.79 (0.48–1.30) | 0.75 | 0.89 (0.44–1.82) | 0.749 | 1.04 (0.51–2.12) | 0.92 | ||||
| Q4 | 1.80 (1.10–2.96) | 0.01 * | 2.11 (1.03–4.31) | 0.040 * | 1.75 (0.84–3.63) | 0.13 | ||||
| Model 4 | 1.22 (0.99–1.49) | 0.06 | 1.16 (0.89–1.51) | 0.26 | 1.24 (0.94–1.63) | 0.12 | ||||
| Q1 | Reference | Reference | Reference | |||||||
| Q2 | 1.05 (0.59–1.87) | 0.87 | 2.32 (1.04–5.21) | 0.04 * | 0.46 (0.19–1.13) | 0.09 | ||||
| Q3 | 0.79 (0.44–1.42) | 0.42 | 0.70 (0.30–1.62) | 0.41 | 1.01 (0.44–2.32) | 0.98 | ||||
| Q4 | 1.93 (1.07–3.46) | 0.03 * | 2.36 (1.06–5.29) | 0.04 * | 1.63 (0.76–3.51) | 0.21 | ||||
| Waist to Height Ratio | ||||||||||
| All (n = 1296) | p | p for Trend | Male (n = 660) | p | p for Trend | Female (n = 636) | p | p for Trend | ||
| Crude | 1.36 (1.09–1.67) | 0.005 * | 1.34 (1.04–1.72) | 0.023 * | 1.37 (0.92–2.03) | 0.12 | ||||
| Q1 | Reference | Reference | Reference | |||||||
| Q2 | 1.99 (0.96–4.09) | 0.063 | 2.88 (1.17–7.09) | 0.022 * | 0.96 (0.29–3.13) | 0.94 | ||||
| Q3 | 1.67 (0.83–3.39) | 0.153 | 1.99 (0.82–4.85) | 0.128 | 1.21 (0.37–3.92) | 0.75 | ||||
| Q4 | 2.98 (1.51–5.90) | 0.002 * | 3.44 (1.45–8.15) | 0.005 * | 2.36 (0.77–8.23) | 0.13 | ||||
| Model 1 | 1.35 (1.09–1.67) | 0.005 * | 1.36 (1.06–1.75) | 0.017 * | 1.37 (0.93–2.02) | 0.12 | ||||
| Q1 | Reference | Reference | Reference | |||||||
| Q2 | 2.01 (0.97–4.19) | 0.061 | 3.21 (1.28–8.05) | 0.327 | 1.01 (0.31–3.26) | 0.99 | ||||
| Q3 | 1.66 (0.81–3.39) | 0.166 | 2.16 (0.88–5,34) | 0.833 | 1.25 (0.38–4.08) | 0.71 | ||||
| Q4 | 2.99 (1.49–5.98) | 0.002 * | 3.73 (1.55–8.97) | 0.010 * | 2.39 (0.78–7.39) | 0.13 | ||||
| Model 2 | 1.33 (1.05–1.67) | 0.016 * | 1.34 (1.04–1.72) | 0.024 * | 1.36 (0.87–2.12) | 0.182 | ||||
| Q1 | Reference | Reference | Reference | |||||||
| Q2 | 2.29 (1.03–5.06) | 0.041 * | 4.24 (1.56–11.52) | 0.005 * | 0.86 (0.25–3.04) | 0.819 | ||||
| Q3 | 1.56 (0.70–3.48) | 0.276 | 2.34 (0.86–6.4) | 0.097 | 0.96 (0.26–3.52) | 0.952 | ||||
| Q4 | 3.06 (1.38–6.80) | 0.006 * | 4.15 (1.54–11.19) | 0.005 * | 2.26 (0.68–7.53) | 0.182 | ||||
| Model 3 | 1.31 (1.04–1.66) | 0.021 * | 1.31 (1.03–1.68) | 0.031 * | 1.30 (0.83–2.04) | 0.251 | ||||
| Q1 | Reference | Reference | Reference | |||||||
| Q2 | 2.27 (1.03–5.05) | 0.043 * | 4.36 (1.47–10.77) | 0.005 * | 0.84 (0.24–2.99) | 0.791 | ||||
| Q3 | 1.53 (0.69–3.40) | 0.299 | 2.29 (0.94–6.27) | 0.106 | 0.95 (0.26–3.28) | 0.937 | ||||
| Q4 | 2.98 (1.33–6.65) | 0.008 * | 3.98 (1.47–10.77) | 0.007 * | 2.01 (0.59–6.92) | 0.266 | ||||
| Model 4 | 1.26 (0.97–1.66) | 0.088 | 1.22 (0.91–1.63) | 0.181 | 1.36 (0.82–2.25) | 0.23 | ||||
| Q1 | Reference | Reference | Reference | |||||||
| Q2 | 2.79 (1.13–6.89) | 0.027 * | 7.61 (2.13–27.2) | 0.002 * | 0.59 (0.14–2.60) | 0.49 | ||||
| Q3 | 1.23 (0.48–3.41) | 0.615 | 1.74 (0.46–6.57) | 0.414 | 1.15 (0.31–4.34) | 0.83 | ||||
| Q4 | 3.00 (1.15–7.84) | 0.025 * | 4.77 (1.35–16.89) | 0.016 * | 2.08 (0.53–8.26) | 0.29 | ||||
4. Discussion
5. Conclusions
Funding
Institutional Review Board Statement
Informed Consent Statement
Data Availability Statement
Conflicts of Interest
References
- Clauss, S.B.; de Ferranti, S.D. Update on Preventive Cardiology. Pediatr. Clin. N. Am. 2020, 67, 923–944. [Google Scholar] [CrossRef]
- Salam, R.A.; Padhani, Z.A.; Das, J.K.; Shaikh, A.Y.; Hoodbhoy, Z.; Jeelani, S.M.; Lassi, Z.S.; Bhutta, Z.A. Effects of Lifestyle Modification Interventions to Prevent and Manage Child and Adolescent Obesity: A Systematic Review and Meta-Analysis. Nutrients 2020, 12, 2208. [Google Scholar] [CrossRef] [PubMed]
- Jurado-Castro, J.M.; Gil-Campos, M.; Gonzalez-Gonzalez, H.; Llorente-Cantarero, F.J. Evaluation of Physical Activity and Lifestyle Interventions Focused on School Children with Obesity Using Accelerometry: A Systematic Review and Meta-Analysis. Int. J. Environ. Res. Public Health 2020, 17, 6031. [Google Scholar] [CrossRef] [PubMed]
- Stefan, N. Causes, consequences, and treatment of metabolically unhealthy fat distribution. Lancet Diabetes Endocrinol. 2020, 8, 616–627. [Google Scholar] [CrossRef]
- Lee, K. Blood mercury concentration in relation to metabolic and weight phenotypes using the KNHANES 2011-2013 data. Int. Arch. Occup. Environ. Health 2018, 91, 185–193. [Google Scholar] [CrossRef]
- Menale, C.; Grandone, A.; Nicolucci, C.; Cirillo, G.; Crispi, S.; Di Sessa, A.; Marzuillo, P.; Rossi, S.; Mita, D.G.; Perrone, L.; et al. Bisphenol A is associated with insulin resistance and modulates adiponectin and resistin gene expression in obese children. Pediatr. Obes. 2017, 12, 380–387. [Google Scholar] [CrossRef] [PubMed]
- Kim, K.Y.; Lee, E.; Kim, Y. The Association between Bisphenol A Exposure and Obesity in Children-A Systematic Review with Meta-Analysis. Int. J. Environ. Res. Public Health 2019, 16, 2521. [Google Scholar] [CrossRef] [Green Version]
- Park, J.S.; Ha, K.H.; He, K.; Kim, D.J. Association between Blood Mercury Level and Visceral Adiposity in Adults. Diabetes Metab. J. 2017, 41, 113–120. [Google Scholar] [CrossRef]
- Eom, S.Y.; Choi, S.H.; Ahn, S.J.; Kim, D.K.; Kim, D.W.; Lim, J.A.; Choi, B.S.; Shin, H.J.; Yun, S.W.; Yoon, H.J.; et al. Reference levels of blood mercury and association with metabolic syndrome in Korean adults. Int. Arch. Occup. Environ. Health 2014, 87, 501–513. [Google Scholar] [CrossRef]
- Kang, D.W.; Lee, K.Y. The relationships between blood mercury concentration and body composition measures using 2010 Korean National Health and Nutrition Examination Survey. Korean J. Obes. 2013, 22, 237–242. [Google Scholar] [CrossRef]
- Rothenberg, S.E.; Korrick, S.A.; Fayad, R. The influence of obesity on blood mercury levels for U.S. non-pregnant adults and children: NHANES 2007–2010. Environ. Res. 2015, 138, 173–180. [Google Scholar] [CrossRef] [Green Version]
- Bernhoft, R.A. Mercury toxicity and treatment: A review of the literature. J. Environ. Public Health 2012, 2012, 460508. [Google Scholar] [CrossRef] [PubMed]
- Clarkson, T.W.; Magos, L. The toxicology of mercury and its chemical compounds. Crit. Rev. Toxicol. 2006, 36, 609–662. [Google Scholar] [CrossRef]
- Hong, Y.S.; Kim, Y.M.; Lee, K.E. Methylmercury exposure and health effects. J. Prev. Med. Public Health 2012, 45, 353–363. [Google Scholar] [CrossRef] [Green Version]
- Ruggieri, F.; Majorani, C.; Domanico, F.; Alimonti, A. Mercury in Children: Current State on Exposure through Human Biomonitoring Studies. Int. J. Environ. Res. Public Health 2017, 14, 519. [Google Scholar] [CrossRef] [Green Version]
- Karagas, M.R.; Choi, A.L.; Oken, E.; Horvat, M.; Schoeny, R.; Kamai, E.; Cowell, W.; Grandjean, P.; Korrick, S. Evidence on the human health effects of low-level methylmercury exposure. Environ. Health Perspect. 2012, 120, 799–806. [Google Scholar] [CrossRef] [Green Version]
- Bose-O’Reilly, S.; McCarty, K.M.; Steckling, N.; Lettmeier, B. Mercury exposure and children’s health. Curr. Probl. Pediatr. Adolesc. Health Care 2010, 40, 186–215. [Google Scholar] [CrossRef] [Green Version]
- Ha, E.; Basu, N.; Bose-O’Reilly, S.; Dórea, J.G.; McSorley, E.; Sakamoto, M.; Chan, H.M. Current progress on understanding the impact of mercury on human health. Environ. Res. 2017, 152, 419–433. [Google Scholar] [CrossRef] [Green Version]
- Kesztyüs, D.; Lampl, J.; Kesztyüs, T. The Weight Problem: Overview of the Most Common Concepts for Body Mass and Fat Distribution and Critical Consideration of Their Usefulness for Risk Assessment and Practice. Int. J. Environ. Res. Public Health 2021, 18, 11070. [Google Scholar] [CrossRef]
- Swainson, M.G.; Batterham, A.M.; Tsakirides, C.; Rutherford, Z.H.; Hind, K. Prediction of whole-body fat percentage and visceral adipose tissue mass from five anthropometric variables. PLoS ONE 2017, 12, e0177175. [Google Scholar] [CrossRef]
- Kweon, S.; Kim, Y.; Jang, M.J.; Kim, Y.; Kim, K.; Choi, S.; Chun, C.; Khang, Y.H.; Oh, K. Data resource profile: The Korea National Health and Nutrition Examination Survey (KNHANES). Int. J. Epidemiol. 2014, 43, 69–77. [Google Scholar] [CrossRef] [Green Version]
- Kim, J.H.; Yun, S.; Hwang, S.S.; Shim, J.O.; Chae, H.W.; Lee, Y.J.; Lee, J.H.; Kim, S.C.; Lim, D.; Yang, S.W.; et al. The 2017 Korean National Growth Charts for children and adolescents: Development, improvement, and prospects. Korean J. Pediatr. 2018, 61, 135–149. [Google Scholar] [CrossRef] [PubMed]
- Lee, S.; Yoon, J.H.; Won, J.U.; Lee, W.; Lee, J.H.; Seok, H.; Kim, Y.K.; Kim, C.N.; Roh, J. The Association Between Blood Mercury Levels and Risk for Overweight in a General Adult Population: Results from the Korean National Health and Nutrition Examination Survey. Biol. Trace Elem. Res. 2016, 171, 251–261. [Google Scholar] [CrossRef] [PubMed]
- Yuk, J.S.; Lee, J.H.; Jeon, J.D.; Kim, T.J.; Lee, M.H.; Park, W.I. Menopause and blood mercury levels: The Korea National Health and Nutrition Examination Survey (KNHANES) 2008–2011. Biol. Trace Elem. Res. 2014, 162, 1–7. [Google Scholar] [CrossRef] [PubMed]
- Browning, L.M.; Hsieh, S.D.; Ashwell, M. A systematic review of waist-to-height ratio as a screening tool for the prediction of cardiovascular disease and diabetes: 0·5 could be a suitable global boundary value. Nutr. Res. Rev. 2010, 23, 247–269. [Google Scholar] [CrossRef] [PubMed] [Green Version]
- Shin, Y.Y.; Ryu, I.K.; Park, M.J.; Kim, S.H. The association of total blood mercury levels and overweight among Korean adolescents: Analysis of the Korean National Health and Nutrition Examination Survey (KNHANES) 2010–2013. Korean J. Pediatr. 2018, 61, 121–128. [Google Scholar] [CrossRef] [PubMed] [Green Version]
- Wang, G.; DiBari, J.; Bind, E.; Steffens, A.M.; Mukherjee, J.; Bartell, T.R.; Bellinger, D.C.; Hong, X.; Ji, Y.; Wang, M.C.; et al. In utero exposure to mercury and childhood overweight or obesity: Counteracting effect of maternal folate status. BMC Med. 2019, 17, 216. [Google Scholar] [CrossRef] [Green Version]
- Taylor, C.M.; Emmett, P.M.; Emond, A.M.; Golding, J. A review of guidance on fish consumption in pregnancy: Is it fit for purpose? Public Health Nutr. 2018, 21, 2149–2159. [Google Scholar] [CrossRef] [Green Version]
- Tinkov, A.A.; Ajsuvakova, O.P.; Skalnaya, M.G.; Popova, E.V.; Sinitskii, A.I.; Nemereshina, O.N.; Gatiatulina, E.R.; Nikonorov, A.A.; Skalny, A.V. Mercury and metabolic syndrome: A review of experimental and clinical observations. Biometals 2015, 28, 231–254. [Google Scholar] [CrossRef]
- Moreira, E.L.; de Oliveira, J.; Dutra, M.F.; Santos, D.B.; Gonçalves, C.A.; Goldfeder, E.M.; de Bem, A.F.; Prediger, R.D.; Aschner, M.; Farina, M. Does methylmercury-induced hypercholesterolemia play a causal role in its neurotoxicity and cardiovascular disease? Toxicol. Sci. 2012, 130, 373–382. [Google Scholar] [CrossRef] [Green Version]
- Nambiar, S.; Truby, H.; Davies, P.S.; Baxter, K. Use of the waist-height ratio to predict metabolic syndrome in obese children and adolescents. J. Paediatr. Child Health 2013, 49, E281–E287. [Google Scholar] [CrossRef] [PubMed]
- Branco, V.; Caito, S.; Farina, M.; Teixeira da Rocha, J.; Aschner, M.; Carvalho, C. Biomarkers of mercury toxicity: Past, present, and future trends. J. Toxicol. Environ. Health B Crit. Rev. 2017, 20, 119–154. [Google Scholar] [CrossRef] [PubMed]
- Karatela, S.; Ward, N.; Paterson, J. Mercury Exposure in Mother-Children Pairs in A Seafood Eating Population: Body Burden and Related Factors. Int. J. Environ. Res. Public Health 2019, 16, 2238. [Google Scholar] [CrossRef] [PubMed] [Green Version]
- Eom, S.Y.; Lee, Y.S.; Lee, S.G.; Seo, M.N.; Choi, B.S.; Kim, Y.D.; Lim, J.A.; Hwang, M.S.; Kwon, H.J.; Kim, Y.M.; et al. Lead, Mercury, and Cadmium Exposure in the Korean General Population. J. Korean Med. Sci. 2018, 33, e9. [Google Scholar] [CrossRef]
- White, U.A.; Tchoukalova, Y.D. Sex dimorphism and depot differences in adipose tissue function. Biochim. Biophys. Acta 2014, 1842, 377–392. [Google Scholar] [CrossRef] [Green Version]
- Chang, E.; Varghese, M.; Singer, K. Gender and Sex Differences in Adipose Tissue. Curr. Diabates Rep. 2018, 18, 69. [Google Scholar] [CrossRef]
- Jackson, E.; Shoemaker, R.; Larian, N.; Cassis, L. Adipose Tissue as a Site of Toxin Accumulation. Compr. Physiol. 2017, 7, 1085–1135. [Google Scholar] [CrossRef] [Green Version]
- Hazelhoff, M.H.; Bulacio, R.P.; Torres, A.M. Gender related differences in kidney injury induced by mercury. Int. J. Mol. Sci. 2012, 13, 10523–10536. [Google Scholar] [CrossRef] [Green Version]
- Thomas, D.J.; Fisher, H.L.; Sumler, M.R.; Marcus, A.H.; Mushak, P.; Hall, L.L. Sexual differences in the distribution and retention of organic and inorganic mercury in methyl mercury-treated rats. Environ. Res. 1986, 41, 219–234. [Google Scholar] [CrossRef]
- Fresquez, M.R.; Gonzalez-Jimenez, N.; Gray, N.; Watson, C.H.; Pappas, R.S. High-Throughput Determination of Mercury in Tobacco and Mainstream Smoke from Little Cigars. J. Anal. Toxicol. 2015, 39, 545–550. [Google Scholar] [CrossRef] [Green Version]
- Kowalski, R.; Wiercinski, J. Mercury content in smoke and tobacco from selected cigarette brands. Ecol. Chem. Eng. S 2009, 16, 155–162. [Google Scholar]
- Kim, B.M.; Choi, A.L.; Ha, E.-H.; Pedersen, L.; Nielsen, F.; Weihe, P.; Hong, Y.C.; Budtz-Jørgensen, E.; Grandjean, P. Effect of hemoglobin adjustment on the precision of mercury concentrations in maternal and cord blood. Environ. Res. 2014, 132, 407–412. [Google Scholar] [CrossRef] [PubMed] [Green Version]
- Pluncevic Gligoroska, J.; Gontarev, S.; Dejanova, B.; Todorovska, L.; Shukova Stojmanova, D.; Manchevska, S. Red Blood Cell Variables in Children and Adolescents regarding the Age and Sex. Iran. J. Public Health 2019, 48, 704–712. [Google Scholar] [CrossRef]
- Cumming, S.P.; Standage, M.; Gillison, F.; Malina, R.M. Sex differences in exercise behavior during adolescence: Is biological maturation a confounding factor? J. Adolesc. Health 2008, 42, 480–485. [Google Scholar] [CrossRef] [PubMed]
- U.S. Department of Health and Human Services, Centers for Disease Control and Prevention. Fourth National Report on Human Exposure to Environmental Chemicals, Updated Tables, March 2021; U.S. Department of Health and Human Services, Centers for Disease Control and Prevention: Atlanta, GA, USA, 2021.
- Becker, K.; Kaus, S.; Krause, C.; Lepom, P.; Schulz, C.; Seiwert, M.; Seifert, B. German Environmental Survey 1998 (GerES III): Environmental pollutants in blood of the German population. Int. J. Hyg. Environ. Health 2002, 205, 297–308. [Google Scholar] [CrossRef]
- Wong, S.L.; Lye, E.J. Lead, mercury and cadmium levels in Canadians. Health Rep. 2008, 19, 31. [Google Scholar] [PubMed]
- Schulz, C.; Angerer, J.; Ewers, U.; Heudorf, U.; Wilhelm, M. Revised and new reference values for environmental pollutants in urine or blood of children in Germany derived from the German environmental survey on children 2003–2006 (GerES IV). Int. J. Hyg. Environ. Health 2009, 212, 637–647. [Google Scholar] [CrossRef]
- U.S. Department of Health and Human Services, Centers for Disease Control and Prevention. Fourth National Report on Human Exposure to Environmental Chemicals: Updated Tables, January 2017, Volume One; U.S. Department of Health and Human Services, Centers for Disease Control and Prevention: Atlanta, GA, USA, 2017.
- Supartini, A.; Oishi, T.; Yagi, N. Changes in Fish Consumption Desire and Its Factors: A Comparison between the United Kingdom and Singapore. Foods 2018, 7, 97. [Google Scholar] [CrossRef] [Green Version]
- U.S. Environmental Protection Agency. Exposure Factors Handbook: Chapter 10. Intake of Fish and Shellfish. In Exposure Factors Handbook, 2011 Edition (Final Report). Available online: https://www.epa.gov/sites/production/files/2015-09/documents/efh-chapter10.pdf (accessed on 27 September 2020).
- Koptyug, E. Per Capita Consumption of Fish and Fishery Products in Germany from 1980 to 2019. Available online: https://www.statista.com/statistics/539983/fish-per-capita-consumption-in-germany/ (accessed on 15 December 2020).
- Agriculture and Agri-Food Canada. Per Capita Disappearance: Protein Disappearnce of Animal Protein Sources in Canada (Food Available Per Persion, Per Year). Available online: https://www.agr.gc.ca/eng/animal-industry/poultry-and-egg-market-information/industry-indicators/per-capita-disappearance/?id=1384971854413 (accessed on 23 June 2021).
- Swanson, D.; Block, R.; Mousa, S.A. Omega-3 fatty acids EPA and DHA: Health benefits throughout life. Adv. Nutr. 2012, 3, 1–7. [Google Scholar] [CrossRef]
- Hegstad, M. New Peer Review Further Delays Final Joint EPA-FDA Fish Advisory. Inside EPA’s Risk Policy Rep. 2016, 23, 20–22. [Google Scholar]
Publisher’s Note: MDPI stays neutral with regard to jurisdictional claims in published maps and institutional affiliations. |
© 2021 by the author. Licensee MDPI, Basel, Switzerland. This article is an open access article distributed under the terms and conditions of the Creative Commons Attribution (CC BY) license (https://creativecommons.org/licenses/by/4.0/).
Share and Cite
Cho, K.Y. Association of Blood Mercury Levels with the Risks of Overweight and High Waist-to-Height Ratio in Children and Adolescents: Data from the Korean National Health and Nutrition Examination Survey. Children 2021, 8, 1087. https://doi.org/10.3390/children8121087
Cho KY. Association of Blood Mercury Levels with the Risks of Overweight and High Waist-to-Height Ratio in Children and Adolescents: Data from the Korean National Health and Nutrition Examination Survey. Children. 2021; 8(12):1087. https://doi.org/10.3390/children8121087
Chicago/Turabian StyleCho, Ky Young. 2021. "Association of Blood Mercury Levels with the Risks of Overweight and High Waist-to-Height Ratio in Children and Adolescents: Data from the Korean National Health and Nutrition Examination Survey" Children 8, no. 12: 1087. https://doi.org/10.3390/children8121087
APA StyleCho, K. Y. (2021). Association of Blood Mercury Levels with the Risks of Overweight and High Waist-to-Height Ratio in Children and Adolescents: Data from the Korean National Health and Nutrition Examination Survey. Children, 8(12), 1087. https://doi.org/10.3390/children8121087