Contribution of Discretionary Foods and Drinks to Australian Children’s Intake of Energy, Saturated Fat, Added Sugars and Salt

 , and
, and 
Abstract
:1. Introduction
2. Materials and Methods
2.1. Data Source
2.2. Classification of Discretionary Choices
2.3. Dietary Intake Data
2.4. Sensitivity Analyses
2.5. Statistical Analysis
3. Results
3.1. Sample Characteristics
3.2. Per Capita Consumption
3.3. Per Consumers
3.3.1. Percent of Total Population Consuming
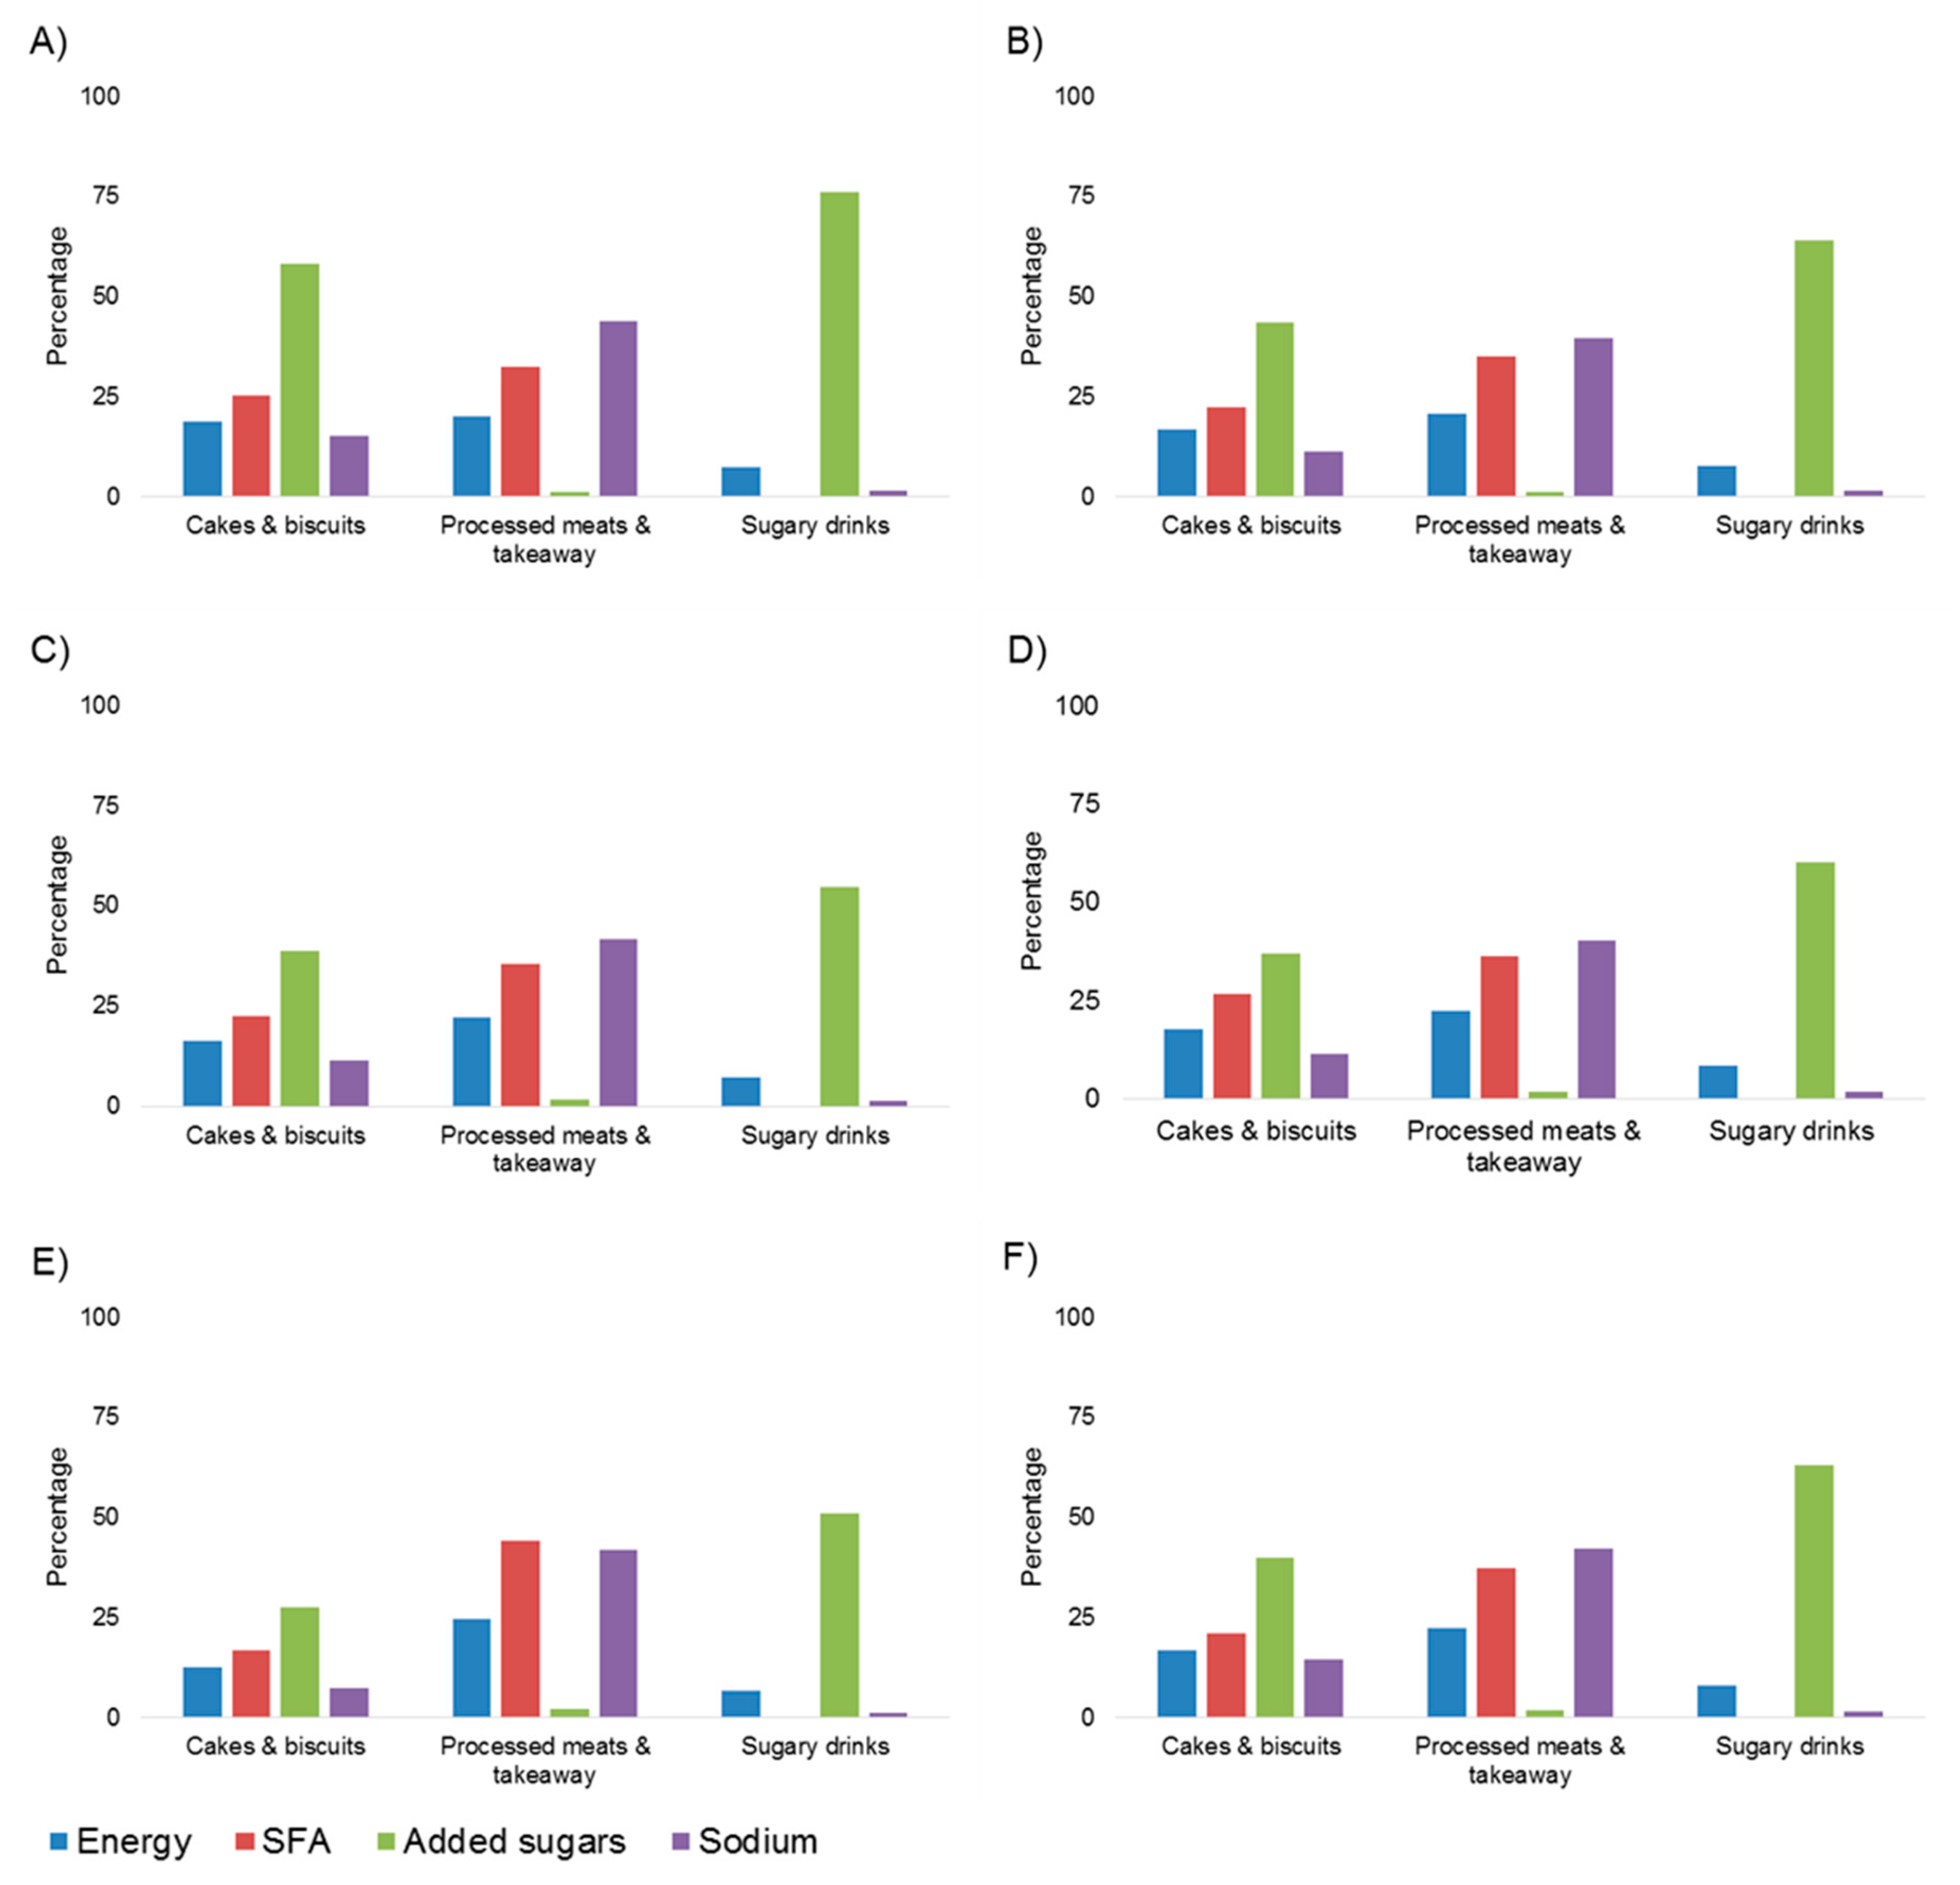
3.3.2. Contribution to Energy, Saturated Fat, Added Sugars and Sodium Intakes
3.4. Sensitivity Analyses Excluding Extreme Mis-Reporters
4. Discussion
5. Conclusions
Supplementary Materials
Acknowledgments
Author Contributions
Conflicts of Interest
Appendix A

| Subgroup Name | Food Codes 1 and Examples |
|---|---|
| Cakes, muffins, slices | 133 Cakes, muffins, scones, cake-type desserts |
| Sweet biscuits | 131 Sweet biscuits |
| Potato crisps and similar snacks | 261 Potato snacks, 262 Corn snacks, 263 Extruded or reformed snacks, 264 Other snacks |
| Dishes containing processed meats | 155 Fish and seafood products (crumbed/battered fish), 185 Sausages, 187 Mixed dishes where beef is main ingredient (patty), 188 Mixed dishes where sausage/bacon is main ingredient (dippy dog), 189 Mixed dishes where chicken is main ingredient (chicken nuggets, wings) |
| Fried potatoes | 241 Potatoes, 24102 Potato products |
| Ice cream and ice blocks | 195 Frozen milk products (ice cream, frozen yoghurts, frozen dairy desserts), 204 Soy-based ice confection, 27303 water ice confection, gelato, sorbet |
| Sugar-sweetened soft drinks | 11501, 11503, 11505 Soft drinks and flavoured mineral waters (excluding intense sweetened) |
| Meat pies and other savoury pastries | 13404, 13405, 13406 Savoury pastry products (quiches, pies, rolls) |
| Cereal-based takeaway | 135 Mixed dishes where cereal is the main ingredient (e.g., pizza, burger, spring rolls, fried rice, pasta) |
| Chocolate | 281 Chocolate and chocolate-based confectionary |
| Higher-fat savoury biscuits | 132 Savoury biscuits |
| Fruit drinks | 113 Fruit drinks (ready to drink or made from concentrate), vegetable drinks, fruit drinks prepared from dry powder |
| Sweet snack bars | 283 Muesli or cereal style bars, 282 Fruit, nut, seed bars |
| Processed meats | 186 Processed meats |
| Cordials | 11401, 11403 Cordial concentrate and made (excluding intense sweetened) |
| Butter and dairy fats | 141 Butters, 142 Dairy blends |
| Lollies and confectionary | 284 Other confectionary |
| All sugar-sweetened drinks | 11401, 11403 Cordial, 11501, 11503, 11505 Soft drinks and flavoured mineral waters, 113 Fruit drinks, 11601, 11602 Sports drinks, 11603 Energy drinks |
| All discretionary choices | All discretionary flagged foods and drinks |
References
- Australian Dietary Guidelines; Report No.: 1864965754; National Health and Medical Research Council: Canberra, Australia, 2015.
- Australian Bureau of Statistics. Australian Health Survey: Nutrition First Results—Foods and Nutrients. 2011–12 Australian Government. 2014. Available online: http://www.abs.gov.au/ausstats/abs@.nsf/Lookup/4364.0.55.007main+features12011-12 (accessed on 13 September 2017).
- Keast, D.R.; Fulgoni, V.L., 3rd; Nicklas, T.A.; O’Neil, C.E. Food sources of energy and nutrients among children in the United States: National Health and Nutrition Examination Survey 2003–2006. Nutrients 2013, 5, 283–301. [Google Scholar] [CrossRef] [PubMed]
- Public Health England. Food Standards Agency. National Diet and Nutrition Survey. 2014. Available online: https://www.gov.uk/government/statistics/national-diet-and-nutrition-survey-results-from-years-1-to-4-combined-of-the-rolling-programme-for-2008-and-2009-to-2011-and-2012 (accessed on 20 September 2017).
- Bowman, S.A.; Gortmaker, S.L.; Ebbeling, C.A.; Pereira, M.A.; Ludwig, D.S. Effects of fast-food consumption on energy intake and diet quality among children in a national household survey. Pediatrics 2004, 113, 112–118. [Google Scholar] [CrossRef]
- Webb, K.L.; Lahti-Koski, M.; Rutishauser, I.; Hector, D.J.; Knezevic, N.; Gill, T.; Peat, J.K.; Leeder, S.R.; CAPS Team. Consumption of ‘extra’ foods (energy-dense, nutrient-poor) among children aged 16–24 months from western Sydney, Australia. Public Health Nutr. 2005, 9, 1035–1044. [Google Scholar] [CrossRef]
- Educator Guide; Report No.: 1864965800; National Health and Medical Research Council: Canberra, Australia, 2013.
- Maffeis, C.; Tato, L. Long-Term effects of childhood obesity on morbidity and mortality. Horm. Res. 2001, 55, 42–45. [Google Scholar] [CrossRef] [PubMed]
- Singh, A.S.; Mulder, C.; Twisk, J.W.; van Mechelen, W.; Chinapaw, M.J. Tracking of childhood overweight into adulthood: A systematic review of the literature. Obes. Rev. 2008, 9, 474–488. [Google Scholar] [CrossRef] [PubMed]
- Mikkilä, V.; Räsänen, L.; Raitakari, O.T.; Pietinen, P.; Viikari, J. Consistent dietary patterns identified from childhood to adulthood: The cardiovascular risk in young finns study. Br. J. Nutr. 2007, 93, 923. [Google Scholar] [CrossRef]
- Australian Bureau of Statistics. National Health Survey: First Results, 2014–15: Australian Government. 2015. Available online: http://www.abs.gov.au/ausstats/abs@.nsf/Lookup/27D7FFFD3AEE46CCCA257AA30014BFFA?opendocument (accessed on 13 September 2017).
- The GBD 2015 Obesity Collaborators. Health Effects of Overweight and Obesity in 195 Countries over 25 Years. N. Engl. J. Med. 2017, 377, 13–27. [Google Scholar]
- World Health Organization. Report of the Commission on Ending Childhood Obesity; World Health Organization: Geneva, Switzerland, January 2016; ISBN 978 92 4 151006 6. [Google Scholar]
- Abarca-Gómez, L.; Abdeen, Z.A.; Hamid, Z.A.; Abu-Rmeileh, N.M.; Acosta-Cazares, B.; Acuin, C.; Adams, R.J.; Aekplakorn, W.; Afsana, K.; Aguilar-Salinas, C.A.; et al. Worldwide trends in body-mass index, underweight, overweight, and obesity from 1975 to 2016: A pooled analysis of 2416 population-based measurement studies in 128.9 million children, adolescents, and adults. Lancet 2017. [Google Scholar] [CrossRef]
- Rangan, A.; Kwana, J.; Flood, V.M.; Louie, J.C.; Gill, T.P. Changes in ‘extra’ food intake among australian children between 1995 and 2007. Obes. Res. Clin. Pract. 2011, 5, e55–e63. [Google Scholar] [CrossRef] [PubMed]
- Aburto, T.C.; Pedraza, L.S.; Sanchez-Pimienta, T.G.; Batis, C.; Rivera, J.A. Discretionary foods have a high contribution and fruit, vegetables, and legumes have a low contribution to the total energy intake of the mexican population. J. Nutr. 2016, 146, 1881S–1887S. [Google Scholar] [CrossRef] [PubMed]
- Australian Bureau of Statistics. Australian Health Survey: Users’ Guide, 2011–13 Australian Government. 2013. Available online: http://www.abs.gov.au/ausstats/abs@.nsf/mf/4363.0.55.001 (accessed on 12 October 2017).
- Bliss, R. Researchers produce innovation in dietary recall. Agric. Res. 2004, 52, 10–12. [Google Scholar]
- Australian Bureau of Statistics. Discretionary Foods, within the ‘Australian Health Survey: Users Guide, 2011–13: Australian Government. 2014. Available online: http://www.abs.gov.au/ausstats/abs@.nsf/Latestproducts/BA1526F0D19FA21DCA257CD2001CA166?opendocument (accessed on 29 September 2017).
- Food Standards Australia New Zealand. AUSNUT 2011–2013. 2015. Available online: http://www.foodstandards.gov.au/science/monitoringnutrients/ausnut/pages/default.aspx (accessed on 29 September 2017).
- Rangan, A.M.; Flood, V.M.; Gill, T.P. Misreporting of energy intake in the 2007 Australian Children’s Survey: Identification, characteristics and impact of misreporters. Nutrients 2011, 3, 186–199. [Google Scholar] [CrossRef] [PubMed]
- Gibson, R.S. Measurement errors in dietary assessment. In Principles of Nutritional Assessment, 2nd ed.; Oxford University Press: New York, NY, USA, 2005; p. 168. [Google Scholar]
- Black, A.E. Critical evaluation of energy intake using the Goldberg cut-off for energy intake: Basal metabolic rate. A practical guide to its calculation, use and limitations. Int. J. Obes. 2000, 24, 1119–1130. [Google Scholar] [CrossRef]
- Goldberg, G.R.; Black, A.E.; Jebb, S.A.; Cole, T.J.; Murgatroyd, P.R.; Coward, W.A.; Prentice, A.M. Critical evaluation of energy intake data using fundamental principles of energy physiology: 1. Derivation of cut-off limits of identify under-recording. Eur. J. Clin. Nut. 1991, 45, 569–581. [Google Scholar]
- Dietary Guidelines for Children and Adolescents in Australia Incorporating the Infant Feeding Guidelines for Health Workers; Report No.: 1864961538; National Health & Medical Research Council: Canberra, Australia, 2003.
- Sichieri, R.; Bezerra, I.N.; Araujo, M.C.; de Moura Souza, A.; Yokoo, E.M.; Pereira, R. Major food sources contributing to energy intake—A nationwide survey of Brazilians aged 10 years and older. Br. J. Nutr. 2015, 113, 1638–1642. [Google Scholar] [CrossRef] [PubMed]
- Svensson, A.; Larsson, C.; Eiben, G.; Lanfer, A.; Pala, V.; Hebestreit, A.; Huybrechts, I.; Fernández-Alvira, J.M.; Russo, P.; Koni, A.C.; et al. European children’s sugar intake on weekdays versus weekends: The IDEFICS study. Eur. J. Clin. Nutr. 2014, 68, 822–828. [Google Scholar] [CrossRef] [PubMed]
- Louie, J.C.; Tapsell, L.C. Intake of total and added sugars and nutrient dilution in Australian children and adolescents. Br. J. Nutr. 2015, 114, 1875–1886. [Google Scholar] [CrossRef] [PubMed]
- Reedy, J.; Krebs-Smith, S.M. Dietary sources of energy, solid fats, and added sugars among children and adolescents in the United States. J. Am. Diet. Assoc. 2010, 110, 1477–1484. [Google Scholar] [CrossRef] [PubMed]
- Van der Bend, D.; Bucher, T.; Schumacher, T.L.; Collins, K.; De Vlieger, N.; Rollo, M.; Burrows, T.L.; Watson, J.F.; Collins, C.E. Trends in food and beverage portion sizes in Australian children; a time-series analysis comparing 2007 and 2011–2012 national data. Children 2017, 4, 69. [Google Scholar] [CrossRef] [PubMed]
- Elliott, T.; Trevena, H.; Sacks, G.; Dunford, E.; Martin, J.; Webster, J.; Swinburn, B.; Moodie, A.; Neal, B.C. A systematic interim assessment of the Australian government’s food and health dialogue. Med. J. Aust. 2014, 200, 92–95. [Google Scholar] [CrossRef] [PubMed]
- Grieger, J.A.; Johnson, B.J.; Wycherley, T.P.; Golley, R.K. Evaluation of simulation models estimating the effect of dietary strategies on nutritional intake: a systematic review. J. Nutr. 2017, 147, 908–931. [Google Scholar] [CrossRef] [PubMed]
- Grieger, J.A.; Johnson, B.J.; Wycherley, T.P.; Golley, R.K. Comparing the nutritional impact of dietary strategies to reduce discretionary choice intake in the Australian adult population: A simulation modelling study. Nutrients 2017, 9, 442. [Google Scholar] [CrossRef] [PubMed]
- O’Hara, B.J.; Grunseit, A.; Phongsavan, P.; Bellew, W.; Briggs, M.; Bauman, A.E. Impact of the swap it, don’t stop it Australian national mass media campaign on promoting small changes to lifestyle behaviors. J. Health Commun. 2016, 21, 1276–1285. [Google Scholar] [CrossRef] [PubMed]
- Jones, A.; Magnusson, R.; Swinburn, B.; Webster, J.; Wood, A.; Sacks, G.; Neal, B. Designing a healthy food partnership: Lessons from the Australian food and health dialogue. BMC Public Health 2016, 16, 651. [Google Scholar] [CrossRef] [PubMed]
- Johnson, B.J.; Hendrie, G.A.; Golley, R.K. Reducing discretionary food and beverage intake in early childhood: A systematic review within an ecological framework. Public Health Nutr. 2016, 19, 1684–1695. [Google Scholar] [CrossRef] [PubMed]
| Food Groupings | % Consuming | Weight (g) | % of Total Weight 2 | kJ | % of Total Energy 3 | SFA (g) | % of Total SFA 3 | Added Sugar (g) | % of Total Added Sugar 3 | Sodium (mg) | % of Total Sodium 3 |
|---|---|---|---|---|---|---|---|---|---|---|---|
| Cakes, muffins and slices | 17.4 | 22.3 | 0.9 | 335.7 | 4.2 | 1.6 | 5.4 | 6.2 | 10.6 | 71 | 3.1 |
| Sweet biscuits | 30.6 | 11.1 | 0.5 | 227.9 | 2.9 | 1.0 | 3.4 | 3.3 | 5.7 | 83 | 3.6 |
| Potato crisps and similar snacks | 26.6 | 28.3 | 1.2 | 211.6 | 2.7 | 1.0 | 3.4 | 0.1 | 0.2 | 62 | 2.7 |
| Dishes containing processed meats | 15.5 | 18.4 | 0.8 | 198.1 | 2.5 | 1.3 | 4.5 | 0.0 | 0.0 | 120 | 5.2 |
| Fried potatoes | 18.4 | 18.7 | 0.8 | 197.2 | 2.5 | 0.6 | 1.9 | 0.0 | 0.0 | 35 | 1.5 |
| Ice cream and ice blocks | 20.2 | 22.3 | 0.9 | 179.1 | 2.2 | 1.5 | 5.2 | 3.3 | 5.6 | 12 | 0.5 |
| Sugar-sweetened soft drinks | 24.8 | 112.5 | 4.7 | 173.9 | 2.2 | 0.0 | 0.0 | 10.8 | 18.6 | 16 | 0.7 |
| Meat pies and other savoury pastries | 10.5 | 18.0 | 0.8 | 172.9 | 2.2 | 1.0 | 3.5 | 0.2 | 0.4 | 79 | 3.4 |
| Cereal-based takeaway foods | 7.2 | 15.3 | 0.6 | 166.0 | 2.1 | 1.0 | 3.3 | 0.2 | 0.3 | 85 | 3.7 |
| Chocolate | 18.7 | 7.8 | 0.3 | 162.8 | 2.0 | 1.3 | 4.4 | 3.4 | 5.8 | 7 | 0.3 |
| Higher-fat savoury biscuits | 11.2 | 4.9 | 0.2 | 103.2 | 1.3 | 0.5 | 1.8 | 0.2 | 0.4 | 40 | 1.7 |
| Fruit drinks | 17.4 | 55.5 | 2.3 | 96.3 | 1.2 | 0.0 | 0.0 | 4.7 | 8.0 | 3 | 0.2 |
| Sweet snack bars | 16.5 | 5.5 | 0.2 | 92.5 | 1.2 | 0.3 | 1.0 | 0.9 | 1.6 | 7 | 0.3 |
| Processed meats | 23.9 | 9.8 | 0.4 | 84.8 | 1.1 | 0.5 | 1.6 | 0.1 | 0.1 | 128 | 5.5 |
| Cordials | 9.9 | 43.2 | 1.8 | 65.8 | 0.8 | 0.0 | 0.0 | 3.9 | 6.7 | 3 | 0.1 |
| Butter and dairy fats | 21.4 | 1.9 | 0.1 | 54.8 | 0.7 | 0.9 | 3.1 | 0.0 | 0.0 | 12 | 0.5 |
| Lollies and confectionary | 15.7 | 3.7 | 0.2 | 53.3 | 0.7 | 0.0 | 0.1 | 2.2 | 3.7 | 4 | 0.2 |
| All sugar-sweetened drinks | 45.8 | 221.9 | 9.2 | 349.0 | 4.4 | 0.0 | 0.0 | 20.1 | 34.7 | 26 | 1.1 |
| All discretionary choices | 98.6 | 477.6 | 19.9 | 3079.7 | 38.5 | 14.2 | 49.0 | 50.3 | 86.7 | 938 | 50.6 |
| Food Subgroup | % of Total Population Consuming 2 | Quantity (g) per Consumer | Energy (kJ) | |||||||||||||||
| 2–3 y | 4–8 y | 9–13 y | 14–16 y | 17–18 y | All 2–18 y | 2–3 y | 4–8 y | 9–13 y | 14–16 y | 17–18 y | All 2–18 y | 2–3 y | 4–8 y | 9–13 y | 14–16 y | 17–18 y | All 2–18 y | |
| Cakes, muffins and slices | 13.6 | 19.1 | 19.6 | 17.3 | 12.1 | 17.4 | 108.1 | 118.9 | 135.1 | 147.9 | 98.2 | 128.7 | 1638.8 | 1755.0 | 2022.0 | 2306.1 | 1441.2 | 1934.2 |
| Sweet biscuits | 37.5 | 35.0 | 31.4 | 23.0 | 17.8 | 30.6 | 32.8 | 31.9 | 40.9 | 49.1 | 42.0 | 36.3 | 618.6 | 619.4 | 808.2 | 981.3 | 822.0 | 744.3 |
| Potato crisps and similar snacks | 17.0 | 31.3 | 33.5 | 21.7 | 18.6 | 26.6 | 32.2 | 39.5 | 37.8 | 50.5 | 51.4 | 41.7 | 645.3 | 795.8 | 784.6 | 1046.3 | 1058.1 | 855.6 |
| Dishes containing processed meats | 19.0 | 18.0 | 15.1 | 10.8 | 11.7 | 15.5 | 72.3 | 117.4 | 124.8 | 140.3 | 168.9 | 118.9 | 785.5 | 1242.8 | 1350.0 | 1526.5 | 1855.4 | 1280.5 |
| Fried potatoes | 16.2 | 17.4 | 18.6 | 20.9 | 20.1 | 18.4 | 61.0 | 60.1 | 104.3 | 164.2 | 119.5 | 101.7 | 640.8 | 661.8 | 1106.6 | 1683.6 | 1260.7 | 1072.5 |
| Ice cream and ice blocks | 14.0 | 22.8 | 24.9 | 17.9 | 13.6 | 20.2 | 54.4 | 85.1 | 119.8 | 136.8 | 148.9 | 110.5 | 411.8 | 694.0 | 950.8 | 1124.8 | 1168.9 | 886.4 |
| Sugar-sweetened soft drinks | 6.0 | 16.9 | 29.4 | 37.4 | 43.2 | 24.8 | 188.9 | 283.9 | 418.3 | 550.4 | 512.1 | 454.7 | 269.7 | 419.1 | 646.1 | 863.6 | 797.3 | 702.5 |
| Meat pies and other savoury pastries | 7.1 | 9.1 | 11.4 | 13.6 | 11.4 | 10.5 | 132.3 | 171.6 | 153.9 | 209.7 | 156.6 | 171.7 | 1196.0 | 1541.9 | 1535.2 | 2079.6 | 1525.8 | 1653.3 |
| Cereal-based takeaway foods | 5.0 | 4.9 | 7.0 | 10.4 | 11.7 | 7.1 | 147.0 | 160.9 | 221.7 | 238.3 | 239.5 | 213.7 | 1628.7 | 1675.8 | 2454.9 | 2580.1 | 2603.9 | 2322.3 |
| Chocolate | 15.3 | 18.1 | 19.8 | 19.7 | 21.2 | 18.7 | 32.8 | 30.8 | 46.8 | 43.1 | 53.9 | 41.7 | 686.8 | 635.0 | 971.4 | 912.4 | 1134.2 | 870.3 |
| Higher-fat savoury biscuits | 11.4 | 12.8 | 11.3 | 10.8 | 6.4 | 11.2 | 22.4 | 32.1 | 46.9 | 80.9 | 38.1 | 44.0 | 462.3 | 671.9 | 980.1 | 1703.4 | 796.7 | 921.1 |
| Fruit drinks | 17.0 | 19.9 | 17.7 | 14.6 | 14.8 | 17.4 | 295.9 | 292.0 | 337.6 | 384.4 | 277.0 | 320.0 | 521.7 | 501.1 | 581.6 | 679.8 | 484.3 | 555.1 |
| Sweet snack bars | 11.0 | 18.3 | 19.8 | 17.9 | 8.3 | 16.5 | 34.9 | 32.0 | 30.7 | 38.9 | 27.7 | 33.3 | 581.9 | 533.2 | 514.4 | 658.0 | 488.4 | 560.3 |
| Processed meats | 18.8 | 24.8 | 26.0 | 23.2 | 25.0 | 23.9 | 21.9 | 36.4 | 41.0 | 51.2 | 49.4 | 41.1 | 174.1 | 298.9 | 346.6 | 488.2 | 435.1 | 354.7 |
| Cordials | 10.3 | 9.8 | 11.3 | 8.9 | 6.8 | 9.9 | 362.3 | 488.3 | 409.9 | 504.2 | 366.6 | 438.2 | 542.3 | 718.7 | 627.7 | 809.5 | 579.1 | 668.2 |
| Butter and dairy fats | 21.3 | 22.1 | 23.3 | 18.9 | 18.9 | 21.4 | 7.5 | 7.0 | 8.9 | 13.7 | 6.0 | 8.7 | 222.8 | 205.2 | 262.8 | 406.0 | 179.2 | 255.8 |
| Lollies and confectionary | 14.7 | 17.5 | 17.3 | 14.4 | 9.8 | 15.7 | 16.3 | 20.7 | 25.5 | 31.0 | 20.3 | 23.6 | 230.5 | 290.2 | 378.4 | 443.5 | 283.8 | 339.7 |
| All sugar-sweetened drinks | 29.5 | 41.0 | 50.8 | 55.3 | 56.4 | 45.8 | 336.2 | 380.4 | 464.7 | 601.7 | 567.7 | 484.5 | 546.0 | 594.3 | 730.8 | 952.2 | 881.6 | 762.0 |
| All discretionary choices | 96.8 | 98.9 | 99.0 | 98.8 | 99.6 | 98.6 | 248.3 | 367.6 | 511.1 | 658.0 | 693.7 | 484.3 | 1858.1 | 2677.3 | 3422.3 | 4015.7 | 3338.1 | 3123.1 |
| Food Subgroup | Saturated Fatty Acids (g) | Added Sugars (g) | Sodium (mg) | |||||||||||||||
| 2–3 y | 4–8 y | 9–13 y | 14–16 y | 17–18 y | All 2–18 y | 2-3 y | 4-8 y | 9–13 y | 14–16 y | 17–18 y | All 2–18 y | 2–3 y | 4–8 y | 9–13 y | 14–16 y | 17–18 y | All 2–18 y | |
| Cakes, muffins, slices | 8.1 | 7.9 | 9.4 | 11.8 | 5.9 | 9.1 | 29.1 | 33.0 | 37.7 | 40.1 | 26.4 | 35.5 | 354 | 375 | 440 | 459 | 289 | 409 |
| Sweet biscuits | 3.1 | 3.4 | 4.7 | 6.0 | 4.8 | 3.2 | 8.6 | 9.0 | 12.1 | 14.4 | 12.3 | 10.7 | 95 | 95 | 128 | 152 | 123 | 270 |
| Potato crisps and similar snacks | 3.0 | 3.8 | 3.3 | 4.3 | 4.3 | 3.7 | 0.2 | 0.4 | 0.2 | 0.6 | 1.1 | 0.4 | 237 | 315 | 271 | 363 | 362 | 310 |
| Dishes containing processed meats | 5.2 | 8.4 | 8.9 | 9.4 | 12.7 | 8.5 | 0.0 | 0.1 | 0.0 | 0.0 | 0.1 | 0.1 | 480 | 790 | 832 | 810 | 1057 | 774 |
| Fried potatoes | 1.9 | 2.0 | 2.9 | 4.3 | 4.2 | 3.0 | 0.0 | 0.0 | 0.0 | 0.0 | 0.0 | 0.0 | 86 | 110 | 184 | 326 | 245 | 189 |
| Ice cream and ice blocks | 3.3 | 6.1 | 8.0 | 9.3 | 8.7 | 7.4 | 7.9 | 12.3 | 17.4 | 20.5 | 21.7 | 16.1 | 27 | 46 | 64 | 76 | 78 | 60 |
| Sugar-sweetened soft drinks | 0.0 | 0.0 | 0.0 | 0.0 | 0.0 | 0.0 | 16.7 | 26.0 | 40.1 | 53.7 | 49.7 | 43.7 | 30 | 44 | 60 | 75 | 64 | 63 |
| Meat pies and other savoury pastries | 6.8 | 8.4 | 9.5 | 11.9 | 9.0 | 9.6 | 2.5 | 1.5 | 2.3 | 2.8 | 2.5 | 2.3 | 539 | 695 | 715 | 890 | 779 | 753 |
| Cereal-based takeaway foods | 9.1 | 9.4 | 13.6 | 15.0 | 15.6 | 13.3 | 0.9 | 1.2 | 2.0 | 2.7 | 2.8 | 2.1 | 819 | 837 | 1220 | 1376 | 1313 | 1182 |
| Chocolate | 5.5 | 5.0 | 7.5 | 7.3 | 9.3 | 6.9 | 13.8 | 13.7 | 20.1 | 18.3 | 23.2 | 18.0 | 26 | 29 | 49 | 35 | 51 | 39 |
| Higher-fat savoury biscuits | 2.3 | 3.4 | 5.0 | 8.9 | 4.0 | 4.7 | 0.8 | 1.5 | 2.1 | 4.1 | 2.0 | 2.1 | 178 | 256 | 381 | 663 | 290 | 355 |
| Fruit drinks | 0.0 | 0.0 | 0.0 | 0.0 | 0.0 | 0.0 | 25.3 | 24.3 | 28.1 | 32.3 | 23.7 | 26.8 | 16 | 19 | 21 | 22 | 21 | 20 |
| Sweet snack bars | 1.9 | 1.7 | 1.4 | 1.9 | 1.3 | 1.7 | 6.0 | 5.7 | 5.3 | 6.3 | 4.7 | 5.7 | 44 | 43 | 40 | 45 | 41 | 43 |
| Processed meats | 0.9 | 1.7 | 1.9 | 2.7 | 2.3 | 2.0 | 0.1 | 0.2 | 0.3 | 0.4 | 0.3 | 0.3 | 275 | 439 | 508 | 763 | 690 | 536 |
| Cordials | 0.0 | 0.0 | 0.0 | 0.0 | 0.0 | 0.0 | 31.9 | 42.2 | 36.9 | 47.5 | 34.1 | 39.3 | 27 | 33 | 27 | 36 | 22 | 30 |
| Butter and dairy fats | 3.6 | 3.4 | 4.3 | 7.0 | 3.1 | 4.3 | 0.0 | 0.0 | 0.0 | 0.0 | 0.0 | 0.0 | 44 | 47 | 58 | 101 | 43 | 58 |
| Lollies and confectionary | 0.1 | 0.1 | 0.4 | 0.2 | 0.0 | 0.2 | 9.6 | 11.6 | 15.1 | 18.7 | 11.1 | 13.7 | 20 | 24 | 29 | 41 | 24 | 28 |
| All sugar-sweetened drinks | 0.0 | 0.0 | 0.0 | 0.0 | 0.0 | 0.0 | 29.2 | 33.0 | 42.1 | 56.0 | 52.9 | 43.9 | 25 | 36 | 53 | 81 | 84 | 57 |
| All discretionary choices | 8.7 | 12.7 | 16.2 | 18.3 | 14.0 | 14.4 | 27.8 | 41.3 | 56.3 | 66.7 | 60.8 | 51.0 | 542 | 854 | 1003 | 1226 | 1054 | 952 |
© 2017 by the authors. Licensee MDPI, Basel, Switzerland. This article is an open access article distributed under the terms and conditions of the Creative Commons Attribution (CC BY) license (http://creativecommons.org/licenses/by/4.0/).
Share and Cite
Johnson, B.J.; Bell, L.K.; Zarnowiecki, D.; Rangan, A.M.; Golley, R.K. Contribution of Discretionary Foods and Drinks to Australian Children’s Intake of Energy, Saturated Fat, Added Sugars and Salt. Children 2017, 4, 104. https://doi.org/10.3390/children4120104
Johnson BJ, Bell LK, Zarnowiecki D, Rangan AM, Golley RK. Contribution of Discretionary Foods and Drinks to Australian Children’s Intake of Energy, Saturated Fat, Added Sugars and Salt. Children. 2017; 4(12):104. https://doi.org/10.3390/children4120104
Chicago/Turabian StyleJohnson, Brittany J., Lucinda K. Bell, Dorota Zarnowiecki, Anna M. Rangan, and Rebecca K. Golley. 2017. "Contribution of Discretionary Foods and Drinks to Australian Children’s Intake of Energy, Saturated Fat, Added Sugars and Salt" Children 4, no. 12: 104. https://doi.org/10.3390/children4120104
APA StyleJohnson, B. J., Bell, L. K., Zarnowiecki, D., Rangan, A. M., & Golley, R. K. (2017). Contribution of Discretionary Foods and Drinks to Australian Children’s Intake of Energy, Saturated Fat, Added Sugars and Salt. Children, 4(12), 104. https://doi.org/10.3390/children4120104