Construction and Validation of a PCA-Based Prediction Model for Preterm Infant Stunting Risk: A Retrospective Study
Abstract
1. Introduction
2. Materials and Methods
2.1. Study Subjects
2.2. Data Collection
2.2.1. General Data Collection
2.2.2. Outcome Data Collection
2.3. Principal Component Analysis (PCA)
2.4. Development and Validation of the Nomogram
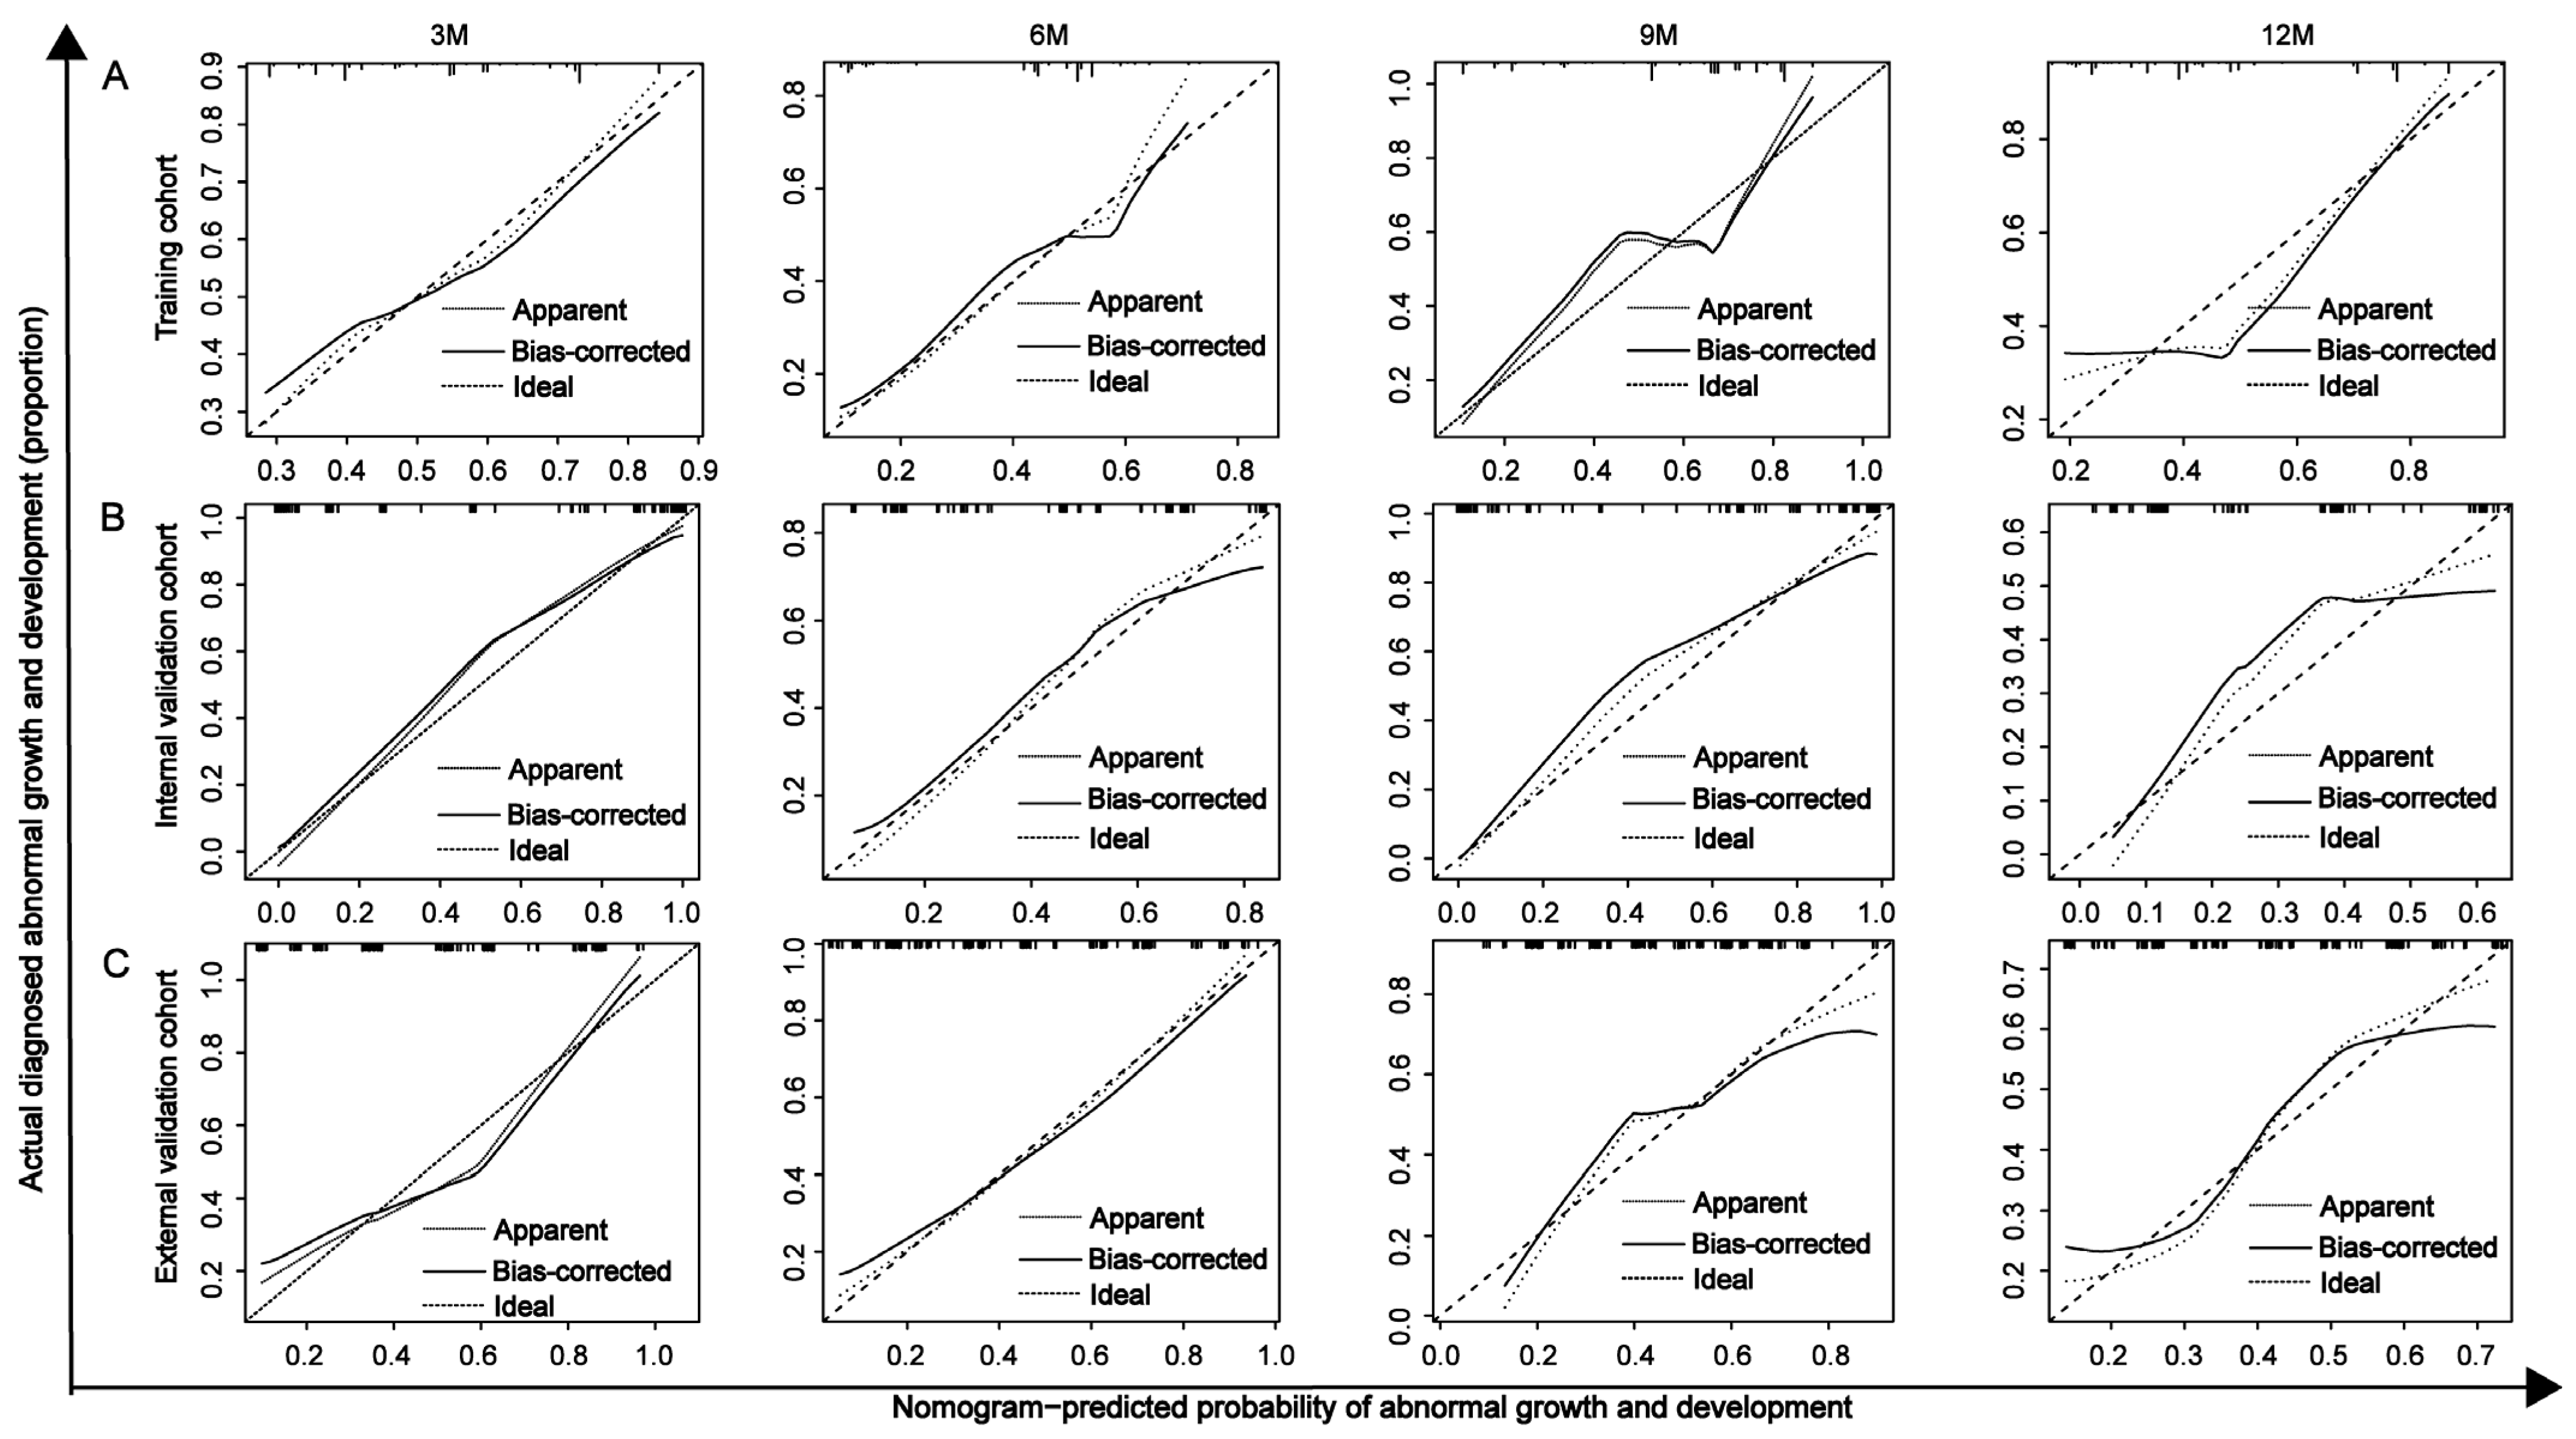
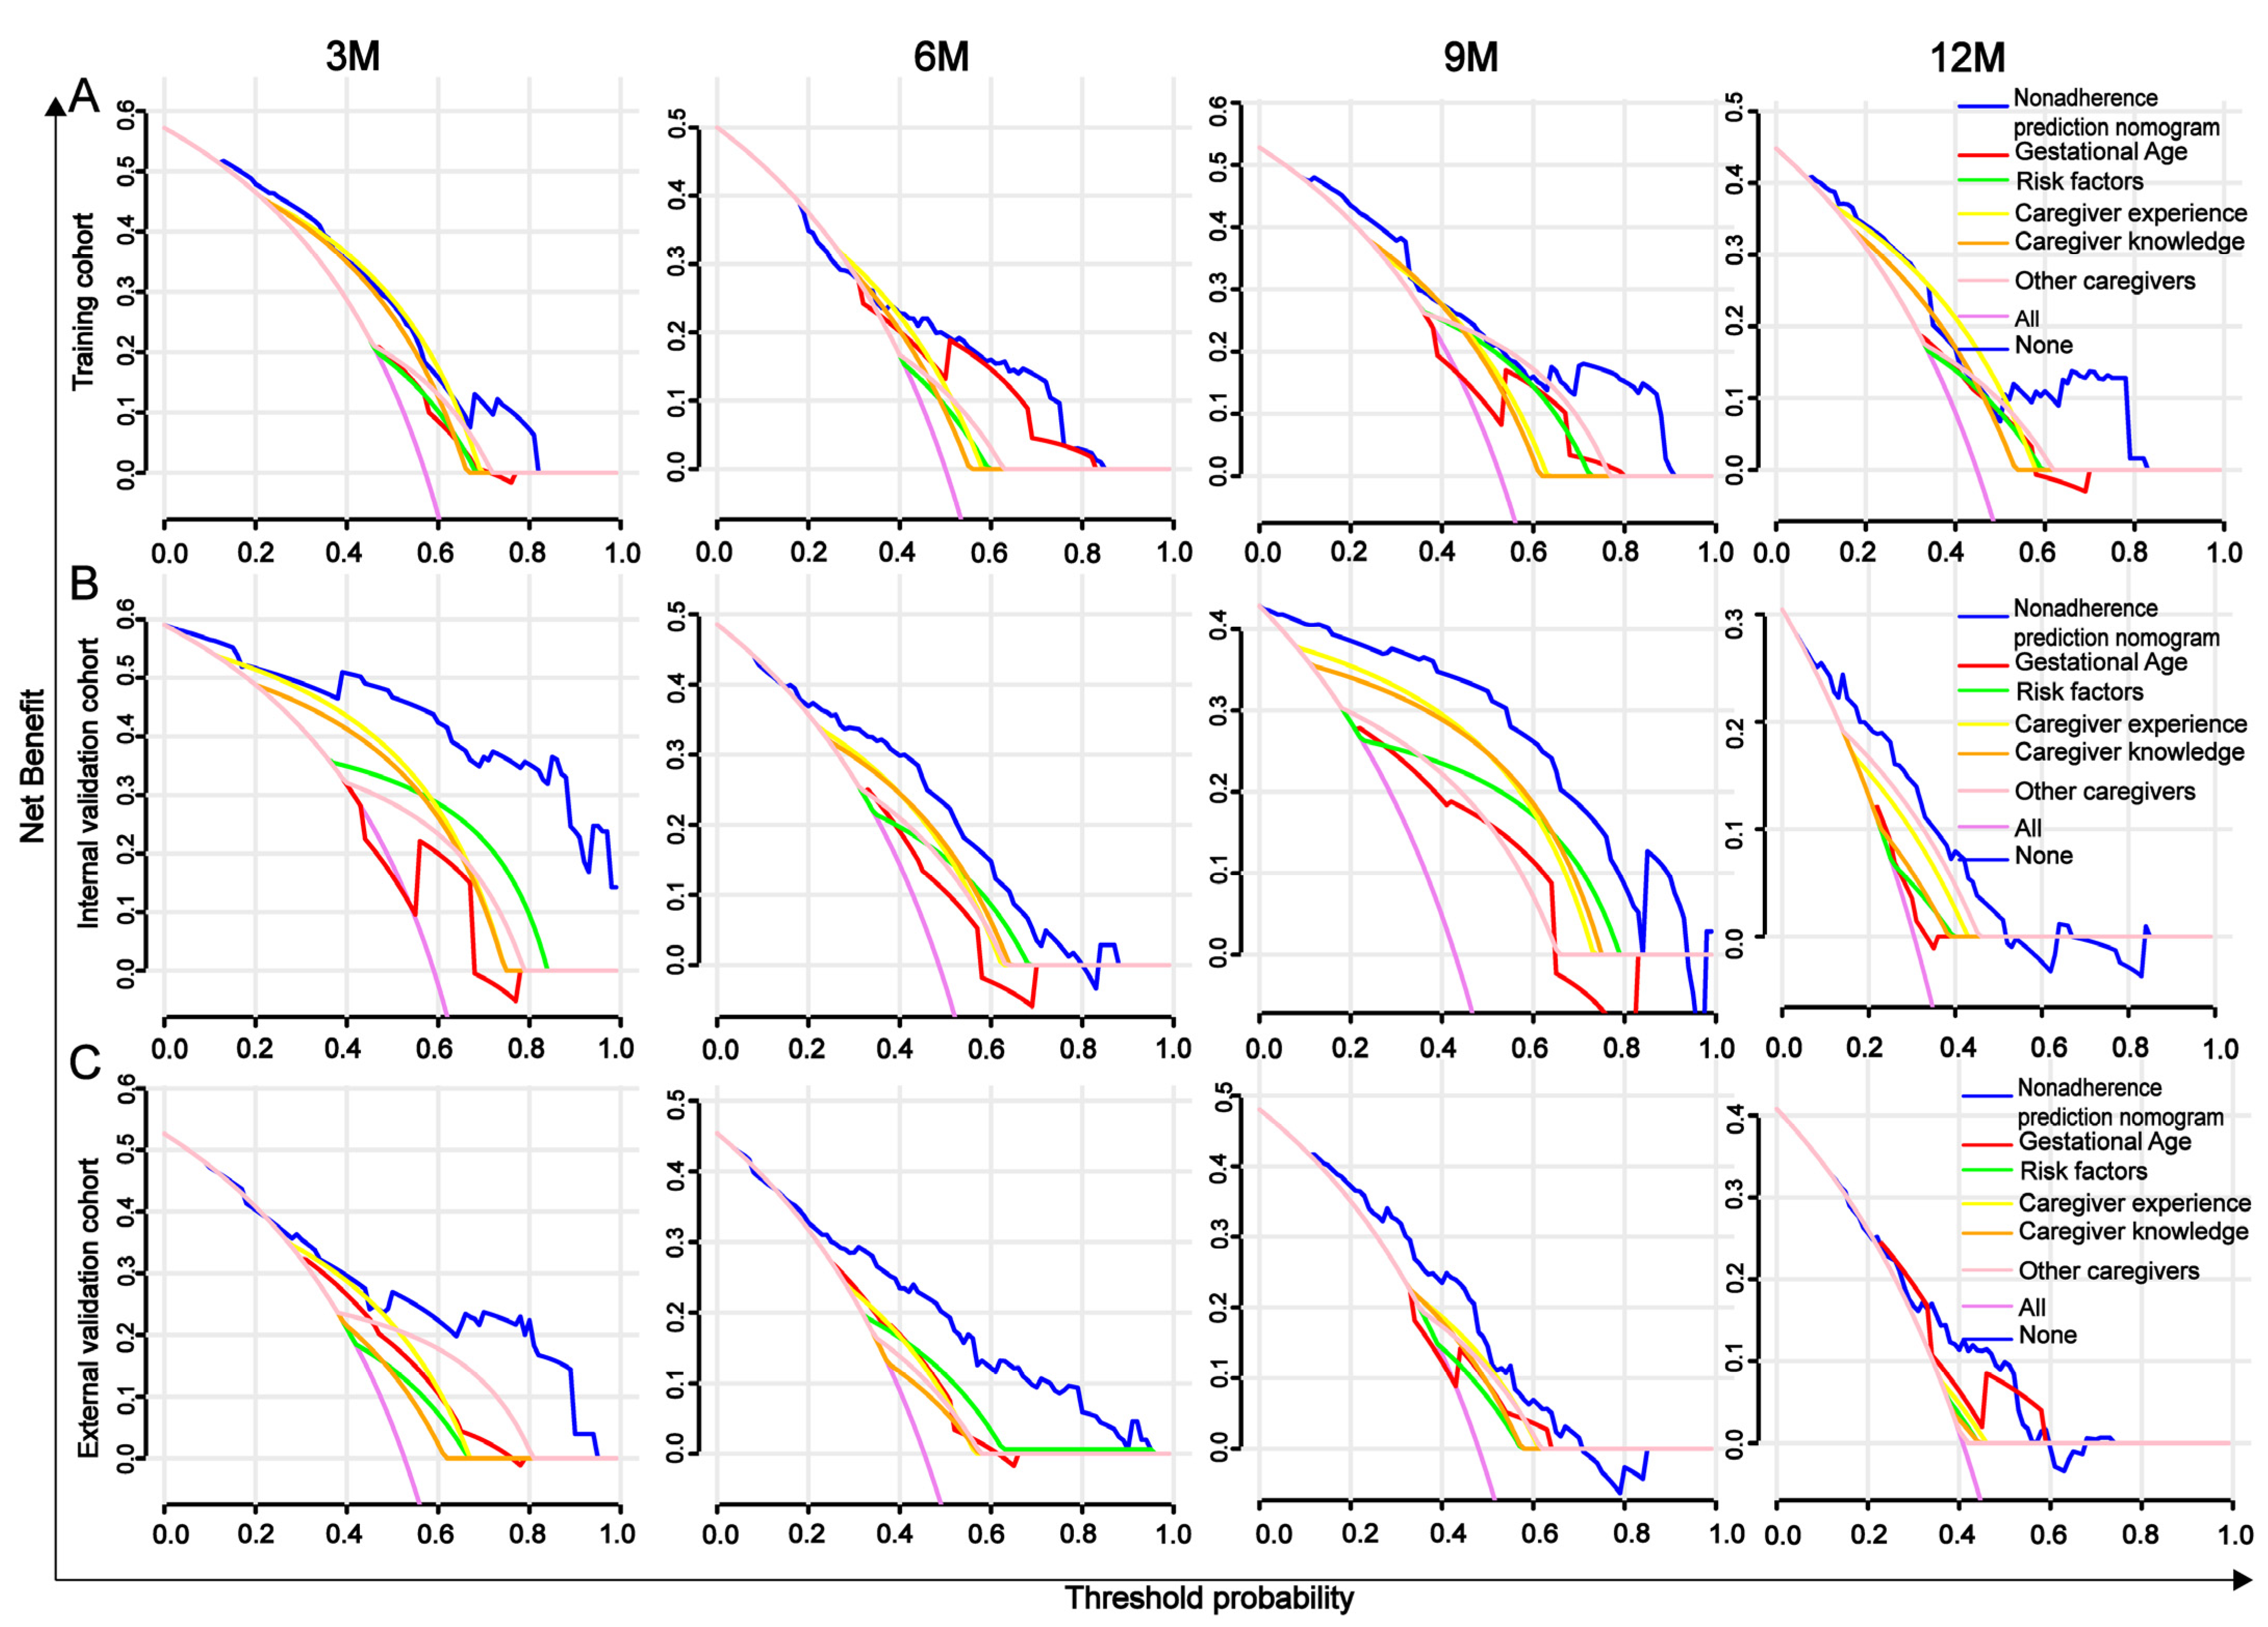
2.5. AUROC, Calibration Curve, C-Index, and DCA Analysis
2.6. Statistical Analysis
3. Results
3.1. Results of Principal Component Analysis
3.2. General Characteristics of Preterm Infants and Primary Caregivers
3.3. Univariate Analysis of Factors Influencing Developmental Delay in Preterm Infants
3.4. Construction of the Nomogram
3.5. Comparison Between the Nomogram and the Five Independent Factors
3.6. Evaluation and Validation of the Nomogram for Predicting Developmental Delay in Preterm Infants
4. Discussion
5. Conclusions
Author Contributions
Funding
Institutional Review Board Statement
Informed Consent Statement
Data Availability Statement
Acknowledgments
Conflicts of Interest
Abbreviations
| PCA | Principal Component Analysis |
| GDS | Gesell Developmental Schedules |
| NBNA | Neonatal Behavioral Neurological Assessment |
| DQ | The developmental quotient |
| AUROC | The area under the curve |
| C-index | The concordance index |
| DCA | Decision curve analysis |
| KMO | Kaiser–Meyer–Olkin |
Appendix A
| Month | Training and Internal Validation | External Validation | ||||
|---|---|---|---|---|---|---|
| KMO | Bartlett’s Test | p | KMO | Bartlett’s Test | p | |
| March | 0.820 | 1639.571 | <0.001 | 0.740 | 507.794 | <0.001 |
| June | 0.810 | 1308.35 | <0.001 | 0.800 | 568.103 | <0.001 |
| September | 0.830 | 1217.548 | <0.001 | 0.750 | 518.131 | <0.001 |
| December | 0.790 | 662.763 | <0.001 | 0.810 | 439.026 | <0.001 |
| Time Point | Ingredients | Test Set and Internal Validation | External Verification | ||||
|---|---|---|---|---|---|---|---|
| Initial Eigenvalue | Variance Contribution Rate (%) | Cumulative Variance Contribution Rate (%) | Initial Eigenvalue | Variance Contribution Rate (%) | Cumulative Variance Contribution Rate (%) | ||
| 3M | 1 | 0.001 | 0.479 | 0.479 | 1.656 | 0.343 | 0.343 |
| 2 | 1.332 | 0.222 | 0.701 | 1.545 | 0.298 | 0.641 | |
| 3 | 0.97 | 0.118 | 0.818 | 0.986 | 0.121 | 0.763 | |
| 4 | 0.712 | 0.063 | 0.881 | 0.799 | 0.08 | 0.842 | |
| 5 | 0.567 | 0.04 | 0.922 | 0.666 | 0.055 | 0.898 | |
| 6 | 0.501 | 0.031 | 0.953 | 0.584 | 0.043 | 0.941 | |
| 7 | 0.446 | 0.025 | 0.978 | 0.552 | 0.038 | 0.979 | |
| 8 | 0.42 | 0.022 | 1 | 0.414 | 0.021 | 1 | |
| 6M | 1 | 1.879 | 0.441 | 0.441 | 1.867 | 0.436 | 0.436 |
| 2 | 1.427 | 0.254 | 0.696 | 1.471 | 0.271 | 0.706 | |
| 3 | 0.812 | 0.083 | 0.778 | 0.742 | 0.069 | 0.775 | |
| 4 | 0.691 | 0.06 | 0.838 | 0.681 | 0.058 | 0.833 | |
| 5 | 0.624 | 0.049 | 0.886 | 0.662 | 0.055 | 0.888 | |
| 6 | 0.603 | 0.045 | 0.932 | 0.615 | 0.047 | 0.935 | |
| 7 | 0.541 | 0.037 | 0.968 | 0.538 | 0.036 | 0.971 | |
| 8 | 0.502 | 0.032 | 1 | 0.48 | 0.029 | 1 | |
| 9M | 1 | 1.879 | 0.441 | 0.441 | 1.86 | 0.433 | 0.433 |
| 2 | 1.387 | 0.241 | 0.682 | 1.325 | 0.22 | 0.652 | |
| 3 | 0.805 | 0.081 | 0.763 | 0.97 | 0.118 | 0.77 | |
| 4 | 0.696 | 0.061 | 0.824 | 0.746 | 0.07 | 0.839 | |
| 5 | 0.647 | 0.052 | 0.876 | 0.671 | 0.056 | 0.895 | |
| 6 | 0.641 | 0.051 | 0.927 | 0.585 | 0.043 | 0.938 | |
| 7 | 0.569 | 0.041 | 0.968 | 0.508 | 0.032 | 0.971 | |
| 8 | 0.507 | 0.032 | 1 | 0.485 | 0.029 | 1 | |
| 12M | 1 | 1.688 | 0.356 | 0.356 | 1.864 | 0.434 | 0.434 |
| 2 | 1.176 | 0.173 | 0.529 | 1.149 | 0.165 | 0.599 | |
| 3 | 0.943 | 0.111 | 0.64 | 1.008 | 0.127 | 0.726 | |
| 4 | 0.912 | 0.104 | 0.744 | 0.834 | 0.087 | 0.813 | |
| 5 | 0.867 | 0.094 | 0.838 | 0.739 | 0.068 | 0.882 | |
| 6 | 0.747 | 0.07 | 0.908 | 0.625 | 0.049 | 0.93 | |
| 7 | 0.693 | 0.06 | 0.968 | 0.585 | 0.043 | 0.973 | |
| 8 | 0.506 | 0.032 | 1 | 0.464 | 0.027 | 1 | |
| Time Point | Indicators | Test Set and Internal Validation | External Verification | |||||||
|---|---|---|---|---|---|---|---|---|---|---|
| F1 | F2 | F3 | F4 | F5 | F1 | F2 | F3 | F4 | ||
| 3M | 1 | −0.011 | 0.562 | −0.152 | 0.060 | 0.367 | −0.096 | −0.103 | ||
| 2 | −0.022 | −0.072 | 0.994 | −0.018 | 0.378 | 0.01 | 0.055 | |||
| 3 | −0.025 | 0.527 | 0.036 | −0.071 | 0.357 | 0.061 | 0.04 | |||
| 4 | 0.242 | −0.012 | −0.002 | 0.281 | −0.021 | −0.025 | 0.179 | |||
| 5 | 0.203 | 0.005 | −0.09 | −0.046 | −0.013 | 0.999 | −0.032 | |||
| 6 | 0.231 | −0.034 | 0.007 | −0.229 | −0.003 | −0.025 | 1.038 | |||
| 7 | 0.232 | 0.015 | 0.028 | 0.423 | 0.008 | −0.064 | −0.128 | |||
| 8 | 0.239 | −0.022 | 0.015 | 0.569 | −0.017 | 0.003 | −0.412 | |||
| 6M | 1 | 0.019 | −0.214 | 1.057 | −0.044 | −0.142 | 0.367 | 0.441 | −0.193 | |
| 2 | 0.015 | 0.487 | 0.037 | −0.043 | 0.025 | 0.397 | 0.04 | −0.132 | ||
| 3 | −0.052 | 0.695 | −0.364 | 0.039 | 0.095 | 0.38 | −0.625 | 0.268 | ||
| 4 | 0.472 | −0.015 | −0.031 | −0.373 | 0.546 | 0.022 | −0.238 | −0.296 | ||
| 5 | 0.312 | −0.03 | 0.077 | −0.087 | 0.362 | 0.023 | 0.282 | −0.362 | ||
| 6 | 0.481 | 0.009 | −0.016 | −0.391 | 0.462 | −0.058 | −0.355 | 0.01 | ||
| 7 | 0.074 | −0.015 | 0.038 | 0.374 | −0.281 | −0.045 | −0.105 | 1.179 | ||
| 8 | −0.324 | 0.004 | −0.058 | 1.114 | −0.119 | −0.044 | 0.956 | 0.035 | ||
| 9M | 1 | 0.001 | −0.216 | 1.064 | 0.082 | 0.132 | 0.478 | 0.187 | −0.197 | |
| 2 | 0.168 | 0.52 | −0.002 | −0.459 | −0.147 | 0.643 | −0.277 | 0.175 | ||
| 3 | −0.125 | 0.692 | −0.314 | 0.36 | −0.085 | −0.11 | 0.904 | 0.019 | ||
| 4 | 0.221 | −0.031 | 0.089 | 0.102 | −0.361 | −0.019 | 0.095 | 0.718 | ||
| 5 | −0.141 | 0.01 | 0.031 | 1.083 | 0.721 | −0.045 | −0.45 | −0.428 | ||
| 6 | 0.233 | −0.039 | 0.092 | 0.079 | −0.156 | 0.021 | −0.138 | 0.544 | ||
| 7 | 0.377 | 0.093 | −0.121 | −0.352 | 0.467 | 0.016 | −0.078 | −0.136 | ||
| 8 | 0.414 | −0.013 | −0.017 | −0.446 | 0.258 | 0.001 | 0.052 | 0.094 | ||
| 12M | 1 | −0.013 | −0.093 | −0.016 | −0.1 | 1.024 | −0.002 | 1.019 | −0.093 | −0.114 |
| 2 | −0.004 | −0.067 | 0.021 | 1.019 | −0.1 | −0.023 | −0.1 | 1.012 | 0.026 | |
| 3 | −0.049 | 1.019 | 0.03 | −0.066 | −0.092 | −0.017 | −0.107 | 0.02 | 0.972 | |
| 4 | −0.115 | 0.03 | 1.03 | 0.021 | −0.02 | 0.226 | −0.083 | −0.044 | 0.143 | |
| 5 | 0.319 | 0.01 | −0.141 | 0.082 | −0.11 | 0.221 | −0.022 | 0.008 | 0.072 | |
| 6 | 0.267 | −0.13 | 0.057 | −0.023 | 0.06 | 0.258 | −0.001 | −0.021 | −0.055 | |
| 7 | 0.336 | −0.007 | −0.077 | −0.014 | 0.041 | 0.243 | −0.058 | 0.03 | 0.029 | |
| 8 | 0.337 | 0.017 | −0.08 | −0.053 | −0.012 | 0.254 | 0.168 | −0.02 | −0.228 | |
Appendix B
Appendix C
| Training Cohort | Internal Validation Cohort | External Validation Cohort | ||||||||
| Characteristics | Healthy Development | Developmental Impairment | p | HealthyDevelopment | DevelopmentalImpairment | p | Healthy Development | Developmental Impairment | p | |
| N = 107 (%) | N = 143 (%) | N = 43 (%) | N = 62 (%) | N = 72 (%) | N = 80 (%) | |||||
| Premature infant | ||||||||||
| NBNA | High | 16 (14.95) | 26 (18.18) | 0.706 | 8 (18.60) | 9 (14.52) | 0.7255 | 36 (50.00) | 43 (53.75) | 0.2584 |
| Middle | 32 (29.91) | 45 (31.47) | 14 (32.56) | 18 (29.03) | 21 (29.17) | 28 (35.00) | ||||
| Low | 59 (55.14) | 72 (50.35) | 21 (48.84) | 35 (56.45) | 15 (20.83) | 9 (11.25) | ||||
| Sex | Female | 37 (34.58) | 56 (39.16) | 0.5423 | 21 (48.84) | 33 (53.23) | 0.8073 | 39 (54.17) | 23 (28.75) | 0.0025 |
| Male | 70 (65.42) | 87 (60.84) | 22 (51.16) | 29 (46.77) | 33 (45.83) | 57 (71.25) | ||||
| Gestational Age | <28 W | 8 (7.48) | 8 (5.59) | 0.0073 | 4 (9.30) | 8 (12.90) | 0.0016 | 5 (6.94) | 16 (20.00) | 0.0003 |
| 28–32 W | 24 (22.43) | 52 (36.36) | 6 (13.95) | 28 (45.16) | 19 (26.39) | 36 (45.00) | ||||
| 32–34 W | 16 (14.95) | 33 (23.08) | 21 (48.84) | 12 (19.35) | 16 (22.22) | 15 (18.75) | ||||
| 34–37 W | 59 (55.14) | 50 (34.97) | 12 (27.91) | 14 (22.58) | 32 (44.44) | 13 (16.25) | ||||
| Delivery Mode | Cesarean Section | 84 (78.50) | 105 (73.43) | 0.4376 | 34 (79.07) | 43 (69.35) | 0.3775 | 57 (79.17) | 64 (80.00) | 1 |
| Natural birth | 23 (21.50) | 38 (26.57) | 9 (20.93) | 19 (30.65) | 15 (20.83) | 16 (20.00) | ||||
| Risk Factors | No | 68 (63.55) | 59 (41.26) | 0.0008 | 35 (81.40) | 20 (32.26) | <0.0001 | 50 (69.44) | 36 (45.00) | 0.0041 |
| Yes | 39 (36.45) | 84 (58.74) | 8 (18.60) | 42 (67.74) | 22 (30.56) | 44 (55.00) | ||||
| Primary caregivers | ||||||||||
| Apartment | City | 80 (74.77) | 112 (78.32) | 0.6593 | 31 (72.09) | 51 (82.26) | 0.3869 | 65 (90.28) | 71 (88.75) | 0.4191 |
| Towns | 10 (9.35) | 14 (9.79) | 4 (9.30) | 5 (8.06) | 6 (8.33) | 5 (6.25) | ||||
| Villages | 17 (15.89) | 17 (11.89) | 8 (18.60) | 6 (9.68) | 1 (1.39) | 4 (5.00) | ||||
| Caregivers Age | <20 Y | 31 (28.97) | 44 (30.77) | 0.7018 | 7 (16.28) | 16 (25.81) | 0.2779 | 18 (25.00) | 33 (41.25) | 0.1167 |
| 20–30 Y | 71 (66.36) | 94 (65.73) | 34 (79.07) | 42 (67.74) | 49 (68.06) | 43 (53.75) | ||||
| 31–40 Y | 5 (4.67) | 4 (2.80) | 1 (2.33) | 4 (6.45) | 5 (6.94) | 3 (3.75) | ||||
| 41–50 Y | 0 (0) | 1 (0.70) | 1 (2.33) | 0 (0.00) | 0 (0.00) | 1 (1.25) | ||||
| Educational level | Primary and lower | 4 (3.74) | 2 (1.40) | 0.0004 | 2 (4.65) | 0 (0.00) | 0.008 | 1 (1.39) | 4 (5.00) | 0.0003 |
| Middle or high school | 88 (82.24) | 128 (89.51) | 38 (88.37) | 55 (88.71) | 56 (77.78) | 68 (85.00) | ||||
| College and above | 15 (14.02) | 13 (9.09) | 3 (6.98) | 7 (11.29) | 15 (20.83) | 8 (10.00) | ||||
| Monthly Household Income | <2 K | 5 (4.67) | 2 (1.40) | 0.0472 | 0 (0.00) | 3 (4.84) | 0.0572 | 5 (6.94) | 2 (2.50) | 0.6123 |
| 2–6 K | 29 (27.10) | 47 (32.87) | 13 (30.23) | 23 (37.10) | 13 (18.06) | 14 (17.50) | ||||
| 7–10 K | 40 (37.38) | 67 (46.85) | 15 (34.88) | 27 (43.55) | 36 (50.00) | 44 (55.00) | ||||
| >10 K | 33 (30.84) | 27 (18.88) | 15 (34.88) | 9 (14.52) | 18 (25.00) | 20 (25.00) | ||||
| Working Condition | Employee | 79 (73.83) | 102 (71.33) | 0.4641 | 33 (75.00) | 36 (58.06) | 0.1397 | 56 (77.78) | 62 (77.5) | 0.8474 |
| Unemployed | 28 (26.17) | 41 (28.67) | 10 (22.73) | 26 (41.94) | 16 (22.22) | 18 (22.50) | ||||
| Caregiving Experience | No | 79 (73.83) | 127 (88.81) | 0.0036 | 20 (46.51) | 59 (95.16) | <0.0001 | 32 (44.44) | 65 (81.25) | <0.0001 |
| Yes | 28 (26.17) | 16 (11.19) | 23 (53.49) | 3 (4.84) | 40 (55.56) | 15 (18.75) | ||||
| Caregiving Knowledge | No | 76 (71.03) | 129 (90.21) | 0.0002 | 19 (44.19) | 56 (90.32) | <0.0001 | 35 (48.61) | 56 (70.00) | <0.0001 |
| Yes | 31 (28.97) | 14 (9.79) | 24 (55.81) | 6 (9.68) | 37 (51.39) | 24 (30.00) | ||||
| Length of Stay | <14 D | 39 (36.45) | 41 (28.67) | 0.4142 | 9 (20.93) | 22 (35.48) | 0.1818 | 52 (72.22) | 52 (65.00) | 0.6253 |
| 14–23 D | 34 (31.78) | 49 (34.27) | 16 (37.21) | 23 (37.10) | 14 (19.44) | 19 (23.75) | ||||
| >23 D | 34 (31.78) | 53 (37.06) | 18 (41.86) | 17 (27.42) | 6 (8.33) | 9 (11.25) | ||||
| Caregiver Sex | Female | 91 (85.05) | 111 (77.62) | 0.1894 | 35 (81.40) | 40 (64.52) | 0.0963 | 60 (83.33) | 66 (82.50) | 1 |
| Male | 16 (14.95) | 32 (22.38) | 8 (18.60) | 22 (35.48) | 12 (16.67) | 14 (17.50) | ||||
| Marital Status | Married or Cohabiting | 102 (95.3) | 138 (96.50) | 0.8859 | 40 (93.02) | 62 (100.00) | 0.1299 | 72 (100.00) | 79 (98.75) | 1 |
| Single | 5 (4.67) | 5 (3.50) | 3 (6.98) | 0 (0.00) | 0 (0.00) | 1 (1.25) | ||||
| Insurance payment | Commercial Insurance | 7 (6.54) | 6 (4.20) | 0.133 | 2 (4.65) | 5 (8.06) | 0.4469 | 0 (0.00) | 1 (1.25) | 0.3177 |
| Rural Medical Care | 18 (16.82) | 36 (25.17) | 6 (13.95) | 13 (20.97) | 55 (76.39) | 56 (70.00) | ||||
| Self-pay | 9 (8.41) | 20 (13.99) | 8 (18.60) | 6 (9.68) | 12 (16.67) | 11 (13.75) | ||||
| Social Insurance | 73 (68.22) | 81 (56.64) | 27 (62.79) | 38 (61.29) | 5 (6.94) | 12 (15.00) | ||||
| Relationship with Newborn | Father | 25 (23.36) | 36 (25.17) | 0.7037 | 9 (20.93) | 16 (25.81) | 0.8021 | 21 (29.17) | 20 (25.00) | 0.5874 |
| Mother | 76 (71.03) | 102 (71.33) | 33 (76.74) | 44 (70.97) | 50 (69.44 | 57 (71.25) | ||||
| Grandparent | 6 (5.61) | 5 (3.50) | 1 (2.33) | 2 (3.23) | 1 (1.39) | 3 (3.75) | ||||
| Other Caregivers | No | 23 (21.50) | 79 (55.24) | <0.0001 | 11 (25.58) | 41 (66.13) | <0.0001 | 10 (13.89) | 42 (52.50) | <0.0001 |
| Yes | 84 (78.50) | 64 (44.76) | 32 (74.42) | 21 (33.87) | 62 (86.11) | 38 (47.50) | ||||
References
- WHO: Recommended definitions, terminology and format for statistical tables related to the perinatal period and use of a new certificate for cause of perinatal deaths. Modifications recommended by FIGO as amended October 14, 1976. Acta Obs. Gynecol Scand. 1977, 56, 247–253.
- Institute of Medicine Committee on Leading Health Indicators for Healthy People. Leading Health Indicators for Healthy People 2020: Letter Report; National Academies Press: Washington, DC, USA, 2011. [Google Scholar]
- Ohuma, E.O.; Moller, A.B.; Bradley, E.; Chakwera, S.; Hussain-Alkhateeb, L.; Lewin, A.; Okwaraji, Y.B.; Mahanani, W.R.; Johansson, E.W.; Lavin, T.; et al. National, regional, and global estimates of preterm birth in 2020, with trends from 2010: A systematic analysis. Lancet 2023, 402, 1261–1271. [Google Scholar] [CrossRef] [PubMed]
- Jing, S.; Chen, C.; Gan, Y.; Vogel, J.; Zhang, J. Incidence and trend of preterm birth in China, 1990–2016: A systematic review and meta-analysis. BMJ Open 2020, 10, e039303. [Google Scholar] [CrossRef] [PubMed]
- Deng, K.; Liang, J.; Mu, Y.; Liu, Z.; Wang, Y.; Li, M.; Li, X.; Dai, L.; Li, Q.; Chen, P.; et al. Preterm births in China between 2012 and 2018: An observational study of more than 9 million women. Lancet Glob. Health 2021, 9, e1226–e1241. [Google Scholar] [CrossRef]
- Mukhopadhyay, K.; Malhi, P.; Mahajan, R.; Narang, A. Neurodevelopmental and behavioral outcome of very low birth weight babies at corrected age of 2 years. Indian J. Pediatr. 2010, 77, 963–967. [Google Scholar] [CrossRef]
- Trønnes, H.; Wilcox, A.J.; Lie, R.T.; Markestad, T.; Moster, D. The association of preterm birth with severe asthma and atopic dermatitis: A national cohort study. Pediatr. Allergy Immunol. 2013, 24, 782–787. [Google Scholar] [CrossRef]
- Aarnoudse-Moens, C.S.; Weisglas-Kuperus, N.; van Goudoever, J.B.; Oosterlaan, J. Meta-analysis of neurobehavioral outcomes in very preterm and/or very low birth weight children. Pediatrics 2009, 124, 717–728. [Google Scholar] [CrossRef]
- Delobel-Ayoub, M.; Arnaud, C.; White-Koning, M.; Casper, C.; Pierrat, V.; Garel, M.; Burguet, A.; Roze, J.-C.; Matis, J.; Picaud, J.-C.; et al. Behavioral problems and cognitive performance at 5 years of age after very preterm birth: The EPIPAGE Study. Pediatrics 2009, 123, 1485–1492. [Google Scholar] [CrossRef]
- Hovi, P.; Andersson, S.; Eriksson, J.G.; Järvenpää, A.L.; Strang-Karlsson, S.; Mäkitie, O.; Kajantie, E. Glucose regulation in young adults with very low birth weight. N. Engl. J. Med. 2007, 356, 2053–2063. [Google Scholar] [CrossRef]
- Crilly, C.J.; Haneuse, S.; Litt, J.S. Predicting the outcomes of preterm neonates beyond the neonatal intensive care unit: What are we missing? Pediatr. Res. 2021, 89, 426–445. [Google Scholar] [CrossRef]
- Han, J.H.; Yoon, S.J.; Lim, J.H.; Shin, J.E.; Eun, H.S.; Park, M.S.; Park, K.I.; Lee, S.M. The impact of neonatal morbidities on child growth and developmental outcomes in very low birth weight infants: A nationwide cohort study. Eur. J. Pediatr. 2022, 181, 197–205. [Google Scholar] [CrossRef] [PubMed]
- Toro, Y.E.L.-D.; Vásquez-Garibay, E.M.; González-Ojeda, A.; Ramírez-Valdivia, J.M.; Troyo-Sanromán, R.; Carmona-Flores, G. A longitudinal evaluation of growth outcomes at hospital discharge of very-low-birth-weight preterm infants. Eur. J. Clin. Nutr. 2012, 66, 474–480. [Google Scholar] [CrossRef] [PubMed]
- Yitayew, M.; Chahin, N.; Rustom, S.; Thacker, L.R.; Hendricks-Muñoz, K.D. Fenton vs. Intergrowth-21st: Postnatal Growth Assessment and Prediction of Neurodevelopment in Preterm Infants. Nutrients 2021, 13, 2841. [Google Scholar] [CrossRef] [PubMed]
- Espinola-Sánchez, M.; Sanca-Valeriano, S.; Campaña-Acuña, A.; Caballero-Alvarado, J. Prediction of neonatal death in pregnant women in an intensive care unit: Application of machine learning models. Heliyon 2023, 9, e20693. [Google Scholar] [CrossRef]
- Bowe, A.K.; Lightbody, G.; Staines, A.; Murray, D.M.; Norman, M. Prediction of 2-Year Cognitive Outcomes in Very Preterm Infants Using Machine Learning Methods. JAMA Netw. Open 2023, 6, e2349111. [Google Scholar] [CrossRef]
- Han, J.H.; Yoon, S.J.; Lee, H.S.; Park, G.; Lim, J.; Shin, J.E.; Eun, H.S.; Park, M.S.; Lee, S.M. Application of Machine Learning Approaches to Predict Postnatal Growth Failure in Very Low Birth Weight Infants. Yonsei Med. J. 2022, 63, 640–647. [Google Scholar] [CrossRef]
- Bhutta, A.T.; Cleves, M.A.; Casey, P.H.; Cradock, M.M.; Anand, K.J. Cognitive and behavioral outcomes of school-aged children who were born preterm: A meta-analysis. JAMA 2002, 288, 728–737. [Google Scholar] [CrossRef]
- Chen, K.; Song, L.; Liu, B.; Wu, M.; Liu, Y.; Wang, L.; Bi, J.; Liu, Q.; Zhang, Y.; Tang, Z.; et al. Low length/weight growth trajectories of early-term infants during the first year: Evidence from a longitudinal study in China. BMJ Open 2022, 12, e051436. [Google Scholar] [CrossRef]
- Ben Salem, K.; Ben Abdelaziz, A. Principal Component Analysis (PCA). Tunis Med. 2021, 99, 383–389. [Google Scholar]
- van Dokkum, N.H.; Reijneveld, S.A.; Heymans, M.W.; Bos, A.F.; de Kroon, M.L.A. Development of a Prediction Model to Identify Children at Risk of Future Developmental Delay at Age 4 in a Population-Based Setting. Int. J. Environ. Res. Public Health 2020, 17, 8341. [Google Scholar] [CrossRef]
- de Melo, G.A.; Peixoto, M.G.M.; Mendonca, M.C.A.; Musetti, M.A.; Serrano, A.L.M.; Ferreira, L.O.G. Performance measurement of Brazilian federal university hospitals: An overview of the public health care services through principal component analysis. J. Health Organ. Manag. 2024, 38, 351–371. [Google Scholar] [CrossRef] [PubMed]
- Long, J.; Wang, N.; Zhai, J.; Liang, C.; Jiang, S.; Zhao, L. Data driven multi-objective economic-environmental robust optimization for refinery planning with multiple modes under uncertainty. Comput. Ind. Eng. 2024, 198, 110697. [Google Scholar] [CrossRef]
- Sun, Q.; Chen, Y.-L.; Yu, Z.-B.; Han, S.-P.; Dong, X.-Y.; Qiu, Y.-F.; Sha, L.; Guo, X.-R. Long-term consequences of the early treatment of children with congenital hypothyroidism detected by neonatal screening in Nanjing, China: A 12-year follow-up study. J. Trop. Pediatr. 2012, 58, 79–80. [Google Scholar] [CrossRef] [PubMed]
- Everitt, B.S.; Dunn, G. Multivariate Data and Multivariate Statistics. In Applied Multivariate Data Analysis; Wiley: Hoboken, NJ, USA, 2001; pp. 1–8. [Google Scholar]
- Chawanpaiboon, S.; Vogel, J.P.; Moller, A.B.; Lumbiganon, P.; Petzold, M.; Hogan, D.; Landoulsi, S.; Jampathong, N.; Kongwattanakul, K.; Laopaiboon, M.; et al. Global, regional, and national estimates of levels of preterm birth in 2014: A systematic review and modelling analysis. Lancet Glob. Health 2019, 7, e37–e46. [Google Scholar] [CrossRef]
- Papastefanou, I.; Nowacka, U.; Syngelaki, A.; Dragoi, V.; Karamanis, G.; Wright, D.; Nicolaides, K.H. Competing-risks model for prediction of small-for-gestational-age neonate from estimated fetal weight at 19–24 weeks’ gestation. Ultrasound Obstet. Gynecol. 2021, 57, 917–924. [Google Scholar] [CrossRef]
- Tesfie, T.K.; Anlay, D.Z.; Abie, B.; Chekol, Y.M.; Gelaw, N.B.; Tebeje, T.M.; Animut, Y. Nomogram to predict risk of neonatal mortality among preterm neonates admitted with sepsis at University of Gondar Comprehensive Specialized Hospital: Risk prediction model development and validation. BMC Pregnancy Childbirth 2024, 24, 139. [Google Scholar] [CrossRef]
- Liu, H.; Li, J.; Guo, J.; Shi, Y.; Wang, L. A prediction nomogram for neonatal acute respiratory distress syndrome in late-preterm infants and full-term infants: A retrospective study. EClinicalMedicine 2022, 50, 101523. [Google Scholar] [CrossRef]
- Cho, H.; Lee, E.H.; Lee, K.S.; Heo, J.S. Machine learning-based risk factor analysis of necrotizing enterocolitis in very low birth weight infants. Sci. Rep. 2022, 12, 21407. [Google Scholar] [CrossRef]
- Salem, N.; Hussein, S. Data dimensional reduction and principal components analysis. Procedia Comput. Sci. 2019, 163, 292–299. [Google Scholar] [CrossRef]
- Chakraborty, P.; Bandyopadhyay, A.; Sahu, P.P.; Burman, A.; Mallik, S.; Alsubaie, N.; Abbas, M.; Alqahtani, M.S.; Soufiene, B.O. Predicting stroke occurrences: A stacked machine learning approach with feature selection and data preprocessing. BMC Bioinform. 2024, 25, 329. [Google Scholar] [CrossRef]
- Muhamad, S.N.; How, V.; Lim, F.L.; Akim, A.M.; Karuppiah, K.; Shabri, N. Author Correction: Assessment of heat stress contributing factors in the indoor environment among vulnerable populations in Klang Valley using principal component analysis (PCA). Sci. Rep. 2024, 14, 24013. [Google Scholar] [CrossRef] [PubMed]
- Deliu, M.; Yavuz, T.S.; Sperrin, M.; Belgrave, D.; Sahiner, U.M.; Sackesen, C.; Kalayci, O.; Custovic, A. Features of asthma which provide meaningful insights for understanding the disease heterogeneity. Clin. Exp. Allergy 2018, 48, 39–47. [Google Scholar] [CrossRef] [PubMed]
- Zhang, X.; Wei, S.; Sun, Q.; Wadood, S.A.; Guo, B. Source identification and spatial distribution of arsenic and heavy metals in agricultural soil around Hunan industrial estate by positive matrix factorization model, principle components analysis and geo statistical analysis. Ecotoxicol. Envrron. Saf. 2018, 159, 354–362. [Google Scholar] [CrossRef]
- Martis, R.J.; Acharya, U.R.; Ray, A.K.; Chakraborty, C. Application of higher order cumulants to ECG signals for the cardiac health diagnosis. Annu. Int. Conf. IEEE Eng. Med. Biol. Soc. 2011, 2011, 1697–1700. [Google Scholar]
- Skranes, J. Executive function deficits in preterm subjects are a combination of social risk factors and brain maldevelopment. Acta. Paediatr. 2017, 106, 1380–1382. [Google Scholar] [CrossRef]
- Yoon, S.J.; Kim, D.; Park, S.H.; Han, J.H.; Lim, J.; Shin, J.E.; Eun, H.S.; Lee, S.M.; Park, M.S. Prediction of Postnatal Growth Failure in Very Low Birth Weight Infants Using a Machine Learning Model. Diagnostics 2023, 13, 3627. [Google Scholar] [CrossRef]
- Morgan, C.; Romeo, D.M.; Chorna, O.; Novak, I.; Galea, C.; Del Secco, S.; Guzzetta, A. The Pooled Diagnostic Accuracy of Neuroimaging, General Movements, and Neurological Examination for Diagnosing Cerebral Palsy Early in High-Risk Infants: A Case Control Study. J. Clin. Med. 2019, 8, 1879. [Google Scholar] [CrossRef]
- Novak, I.; Morgan, C.; Adde, L.; Blackman, J.; Boyd, R.N.; Brunstrom-Hernandez, J.; Cioni, G.; Damiano, D.; Darrah, J.; Eliasson, A.C.; et al. Early, Accurate Diagnosis and Early Intervention in Cerebral Palsy: Advances in Diagnosis and Treatment. JAMA Pediatr. 2017, 171, 897–907. [Google Scholar] [CrossRef]


Disclaimer/Publisher’s Note: The statements, opinions and data contained in all publications are solely those of the individual author(s) and contributor(s) and not of MDPI and/or the editor(s). MDPI and/or the editor(s) disclaim responsibility for any injury to people or property resulting from any ideas, methods, instructions or products referred to in the content. |
© 2025 by the authors. Licensee MDPI, Basel, Switzerland. This article is an open access article distributed under the terms and conditions of the Creative Commons Attribution (CC BY) license (https://creativecommons.org/licenses/by/4.0/).
Share and Cite
Dai, K.; Yu, R.; Meng, Y.; Yang, X.; Jiang, Y.; Luo, J.; Fang, K.; Wang, S.; Rong, Z. Construction and Validation of a PCA-Based Prediction Model for Preterm Infant Stunting Risk: A Retrospective Study. Children 2025, 12, 583. https://doi.org/10.3390/children12050583
Dai K, Yu R, Meng Y, Yang X, Jiang Y, Luo J, Fang K, Wang S, Rong Z. Construction and Validation of a PCA-Based Prediction Model for Preterm Infant Stunting Risk: A Retrospective Study. Children. 2025; 12(5):583. https://doi.org/10.3390/children12050583
Chicago/Turabian StyleDai, Kun, Rong Yu, Yushi Meng, Xiaomeng Yang, Yixin Jiang, Jing Luo, Kui Fang, Suqing Wang, and Zhihui Rong. 2025. "Construction and Validation of a PCA-Based Prediction Model for Preterm Infant Stunting Risk: A Retrospective Study" Children 12, no. 5: 583. https://doi.org/10.3390/children12050583
APA StyleDai, K., Yu, R., Meng, Y., Yang, X., Jiang, Y., Luo, J., Fang, K., Wang, S., & Rong, Z. (2025). Construction and Validation of a PCA-Based Prediction Model for Preterm Infant Stunting Risk: A Retrospective Study. Children, 12(5), 583. https://doi.org/10.3390/children12050583


