Article

Construction and Validation of a PCA-Based Prediction Model for Preterm Infant Stunting Risk: A Retrospective Study

1
School of Nursing, Wuhan University, Wuhan 430071, China
2
Tongji Hospital Affiliated to Tongji Medical College, Huazhong University of Science and Technology, Wuhan 430030, China
3
School of Public Health, Wuhan University, Wuhan 430071, China
4
The First Affiliated Hospital of China Medical University, Shenyang 110001, China
*
Author to whom correspondence should be addressed.
Children 2025, 12(5), 583; https://doi.org/10.3390/children12050583
Submission received: 25 March 2025 / Revised: 20 April 2025 / Accepted: 25 April 2025 / Published: 30 April 2025
(This article belongs to the Section Pediatric Neonatology)

Abstract

:
Objectives: Developmental delay in preterm infants is a critical clinical issue, and early risk identification and prediction are essential. This study aims to develop and validate a predictive model for developmental delay, providing a scientific basis for clinical risk assessment and early intervention. Methods: This study included preterm infants and their primary caregivers who were followed up at our center from May 2023 to September 2024. The samples were randomly divided into a training cohort, an internal validation cohort, and an external validation cohort. Independent risk factors for stunting were identified through univariate and multivariate logistic regression analyses, and predictive models and calibration were constructed accordingly. Results: The five standardized indicators at 3, 6, 9, and 12 months for 507 preterm infants were analyzed using principal component analysis, and their developmental outcomes were grouped accordingly. Logistic regression analyses showed that gestational age, high-risk factors, knowledge of caregiving, caregiving experience, and the presence of other caregivers in the home were independent risk factors for the risk of preterm infants with stunted growth at 3, 6, 9, and 12 months. The nomogram showed the area under the receiver operating characteristic curve values of 0.743, 0.735, 0.752, and 0.774 in the training cohort; 0.855, 0.771, 0.870, and 0.786 in the internal validation cohort; 0.822, 0.804, 0.717, and 0.678 in the external validation cohort, respectively. The calibration curves, consistency index, and decision curve analysis all showed that the model was significantly better than a single indicator in predicting the risk of stunting in preterm infants. Conclusions: The stunting risk prediction model constructed in this study shows good predictive ability, which can help clinicians assess the risk of stunting in preterm infants and support the development of early intervention strategies.

1. Introduction

According to the World Health Organization, preterm birth, defined as delivery occurring before 37 weeks of gestation, serves as one of the key indicators reflecting a nation’s health status [1,2]. A systematic analysis based on data from 103 countries and regions showed that the global incidence of preterm birth was 9.9% in 2020, with approximately 15 million births occurring annually [3]. In China, the incidence of preterm birth has steadily increased, rising from 5.36% in 1990–1994 to 6.1% in 2012–2018 [4,5]. While the continuous improvement in rescue strategies for preterm infants has led to higher survival rates, these infants continue to face numerous serious health challenges. These include conditions such as bronchopulmonary dysplasia, necrotizing enterocolitis, sepsis, and retinopathy of prematurity [6], as well as long-term health issues such as asthma, learning disorders, attention deficit disorders, emotional problems, and growth and developmental delays [7,8,9,10]. As the survival rates for preterm infants continue to rise, research attention is increasingly shifting toward their long-term growth and development [11,12].
It has been shown that early prediction and intervention can significantly reduce growth and developmental abnormalities in preterm infants [13,14]. By comprehensively analyzing maternal and infant health status, birth weight, and gestational age, high-risk preterm infants can be effectively identified and predicted, providing a scientific basis for early intervention [15]. Currently, prediction models of preterm growth and development mainly focus on neurodevelopment or somatic development [16,17]. While both neurodevelopment and somatic development are crucial to the growth process of preterm infants, many studies have not fully explored the dynamics of these two aspects or their interactions over time [18]. Furthermore, a single indicator cannot comprehensively reflect the complexity of preterm infant growth and development and the long-term trajectory. More importantly, many studies overlook the cumulative effects of multidimensional factors over time, such as neurodevelopment, socioeconomics, family environment, and quality of care, when selecting predictors [19]. These factors play a significant role in the long-term development of preterm infants, and their dynamic influence may need to be understood through longitudinal tracking data. Therefore, it is imperative to develop a prediction model for growth failure in preterm infants that integrates multiple factors such as time dimension, neurodevelopment, physical development, and socioeconomics.
Principal Component Analysis (PCA) is a widely used dimensionality reduction technique that identifies key variables based on their contributions by combining multiple related variables into a few principal components. It calculates the weights (i.e., contributions) of each principal component to form a comprehensive index [20]. The advantages of PCA include reducing data dimensionality, extracting the most important information, eliminating multicollinearity among variables, and removing redundant or non-critical information. As a result, PCA enhances the prediction accuracy and stability of the model [21]. PCA has been successfully applied across various fields, including healthcare, education, and the economy, yielding positive results [22,23].
This study aims to apply PCA to analyze the physical development indicators (such as length, weight, and head circumference) and neurodevelopmental indicators (based on the Gesell Developmental Schedules, GDS) of preterm infants to obtain the comprehensive indicators and then combine the social factors to construct a prediction model for comprehensively assessing the development of preterm infants and to overcome the limitation that a single indicator cannot comprehensively evaluate the growth and development of preterm infants. By considering multidimensional factors in the PCA analysis, we aim to build the model and explore its potential to improve prediction accuracy, providing a more reliable basis for clinical intervention and, thus, improving the long-term health prognosis of preterm infants.

2. Materials and Methods

2.1. Study Subjects

This prospective study included preterm infants who were followed up between February 2022 and March 2025 at the neonatal follow-up centers of Tongji Hospital, affiliated with Tongji Medical College of Huazhong University of Science and Technology (Hankou Hospital District and Guanggu Hospital District). The Ethics Committee approved the study protocol (WHU-LFMD-IRB2024046), and all subjects signed a written informed consent.
The inclusion criteria for preterm infants were as follows: (1) gestational age <37 weeks; (2) physical measurements and GDS measurements at four time points: 3, 6, 9, and 12 months. The exclusion criteria included (1) severe congenital anomalies, (2) inherited metabolic disorders, (3) severe asphyxia at birth, and (4) those who died or abandoned treatment.

2.2. Data Collection

2.2.1. General Data Collection

Data collection in this study was conducted in two stages. In the first stage, clinical data on preterm infants were extracted from medical records and follow-up documentation. The collected data included infants’ sex, gestational age, birth weight, length, head circumference, Neonatal Behavioral Neurological Assessment (NBNA)—a standardized evaluation tool assessing neonatal neurobehavioral development based on neurological performance—and pregnancy-related risk factors at birth. Electronic health records were created for each preterm infant during the initial follow-up visit. In the second stage, structured questionnaires were administered to the primary caregivers of the preterm infants to gather sociodemographic and caregiving-related information. The collected data encompassed caregiver sex, age, marital status, educational attainment, employment status, place of residence, monthly household income, medical expenses, length of hospital stay, relationship with the infant, caregiving experience, caregiving-related knowledge, and the presence of other caregivers within the family.

2.2.2. Outcome Data Collection

Physical growth assessment indicators included length, weight, and head circumference at corrected gestational ages of 3, 6, 9, and 12 months. Neurobehavioral development was assessed using the GDS [24], which evaluates five dimensions: adaptability, gross motor skills, fine motor skills, language, and personal–social skills. The developmental quotient (DQ) was calculated using the following formula:
D Q = D e v e l o p m e n t a l   A g e C h r o n o l o g i c a l   A g e   × 100
The evaluation criteria were as follows: DQ ≥ 85 indicates normal development; 70 ≤ DQ < 85 indicates mild developmental delay; and DQ < 70 indicates severe developmental delay. Experienced professionals conducted all assessments over a one-hour session to comprehensively evaluate preterm infant development.

2.3. Principal Component Analysis (PCA)

This study used PCA to integrate standardized indicators of length, weight, head circumference, and the five dimensions of the GDS into a comprehensive developmental quality index, where positive values were defined as “normal development” and negative values as “developmental delay”. Based on the developmental status of preterm infants at 3, 6, 9, and 12 months, subjects were classified into “normal development” and “developmental delay” groups in the training, internal validation, and external validation cohorts to construct and validate the predictive model.

2.4. Development and Validation of the Nomogram

The developmental status of preterm infants at 3, 6, 9, and 12 months in the training, internal validation, and external validation sets were analyzed to compare clinical characteristic differences between groups. Subsequently, univariate analysis was conducted in each dataset to identify potential risk factors for developmental delay. Logistic regression was then used to calculate the regression coefficients for these risk factors in the training set at 3, 6, 9, and 12 months, which were incorporated into the nomogram model. The nomogram scores were further calculated in the internal and external validation sets to assess the model’s performance and applicability.

2.5. AUROC, Calibration Curve, C-Index, and DCA Analysis

The predictive performance of the nomogram for developmental delay at 3, 6, 9, and 12 months was validated using multiple methods. Receiver operating characteristic curves were plotted to analyze the predictive ability of the nomogram at each time point and compare it with individual indicators, with the area under the curve (AUROC) used to quantify discrimination ability. Second, the concordance index (C-index) was calculated to assess the consistency and discrimination performance of the nomogram in the training and validation sets. Calibration curves and the Hosmer–Lemeshow test were used to evaluate the agreement between the predicted and actual probabilities. Additionally, decision curve analysis (DCA) was conducted to assess the nomogram’s potential clinical value and compare it with individual indicators. These methods provided a comprehensive evaluation of the nomogram’s clinical utility.

2.6. Statistical Analysis

Categorical variables were presented as counts and percentages and compared using the chi-square or Fisher’s exact test. NBNA, birth weight, and birth length were described using quartiles (Q1, Q2, Q3). Length, weight, head circumference, and the five dimensions of the GDS at 3, 6, 9, and 12 months were standardized as Z-scores and analyzed using R software. PCA was conducted with a Kaiser–Meyer–Olkin (KMO) value > 0.5 and Bartlett’s test of sphericity with p < 0.001. Principal components were extracted based on eigenvalues and cumulative variance contribution rates (≥80%), and a linear model of the principal components was calculated using the maximum variance rotation method. A composite score was obtained by weighting the principal components according to their variance contribution rates [25]. Based on the PCA results, chi-square tests were used to compare clinical characteristics associated with developmental delay, and logistic regression was performed to calculate risk coefficients for constructing the nomogram model. All statistical tests were two-sided, with a significance level of 0.05 (* p < 0.05, ** p < 0.01, *** p < 0.001, **** p < 0.0001).

3. Results

3.1. Results of Principal Component Analysis

The study sample included 355 preterm infants from the Hankou Hospital District and 152 preterm infants from the Guanggu Hospital District. The preterm infants from the Hankou Hospital district were randomly divided into a training cohort and an internal validation cohort in a 7:3 ratio, and the preterm infants from the Guanggu Hospital District who met the inclusion criteria were used as an external validation cohort and validated in both the internal and external validation cohorts, as shown in Figure 1.
The KMO value and Bartlett’s test of sphericity indicated that the data were appropriate for PCA (Appendix A: Table A1). In the training and internal validation cohorts, three principal components were extracted at 3 months, explaining 81.8% of the total variance; four components were extracted at 6 and 9 months, accounting for 83.8% and 82.4% of the variance, respectively, and five components were extracted at 12 months, explaining 83.8% of the total variance. Four principal components were extracted in the external validation cohorts at 3, 6, 9, and 12 months, accounting for cumulative variance contributions of 84.2%, 83.3%, 83.9%, and 81.3%, respectively. For calculating the composite developmental delay score, the outcome indicators (length, weight, head circumference, and the five dimensions of the GDS) were denoted as X1 to X8. PCA was conducted using the principal component score coefficient matrix, and a composite index formula was constructed by weighting each principal component according to its respective variance contribution rate. The total variance explained by the principal components is presented in Appendix A: Table A2; the rotated principal component score coefficients are shown in Appendix A: Table A3, and the composite index formula is provided in Appendix B.

3.2. General Characteristics of Preterm Infants and Primary Caregivers

In the training, internal validation, and external validation cohorts, the developmental delay group was predominantly concentrated within the gestational age range of 28–32 weeks (34.97%, 19.35%, and 45.0%, respectively), with a higher proportion of high-risk factors observed (58.74%, 32.26%, and 45.0%). The proportion of caregivers with caregiving experience was relatively low (9.79%, 4.84%, and 18.75%), as was the proportion of caregivers with caregiving knowledge (7.69%, 9.68%, and 30.0%). In contrast, the proportion of caregivers without additional support was higher (44.76%, 33.87%, and 47.5%). Educational attainment was primarily at the high school or college level (89.51%, 88.71%, and 85%, respectively). There were significant differences in these factors (p < 0.05) (see Appendix C).

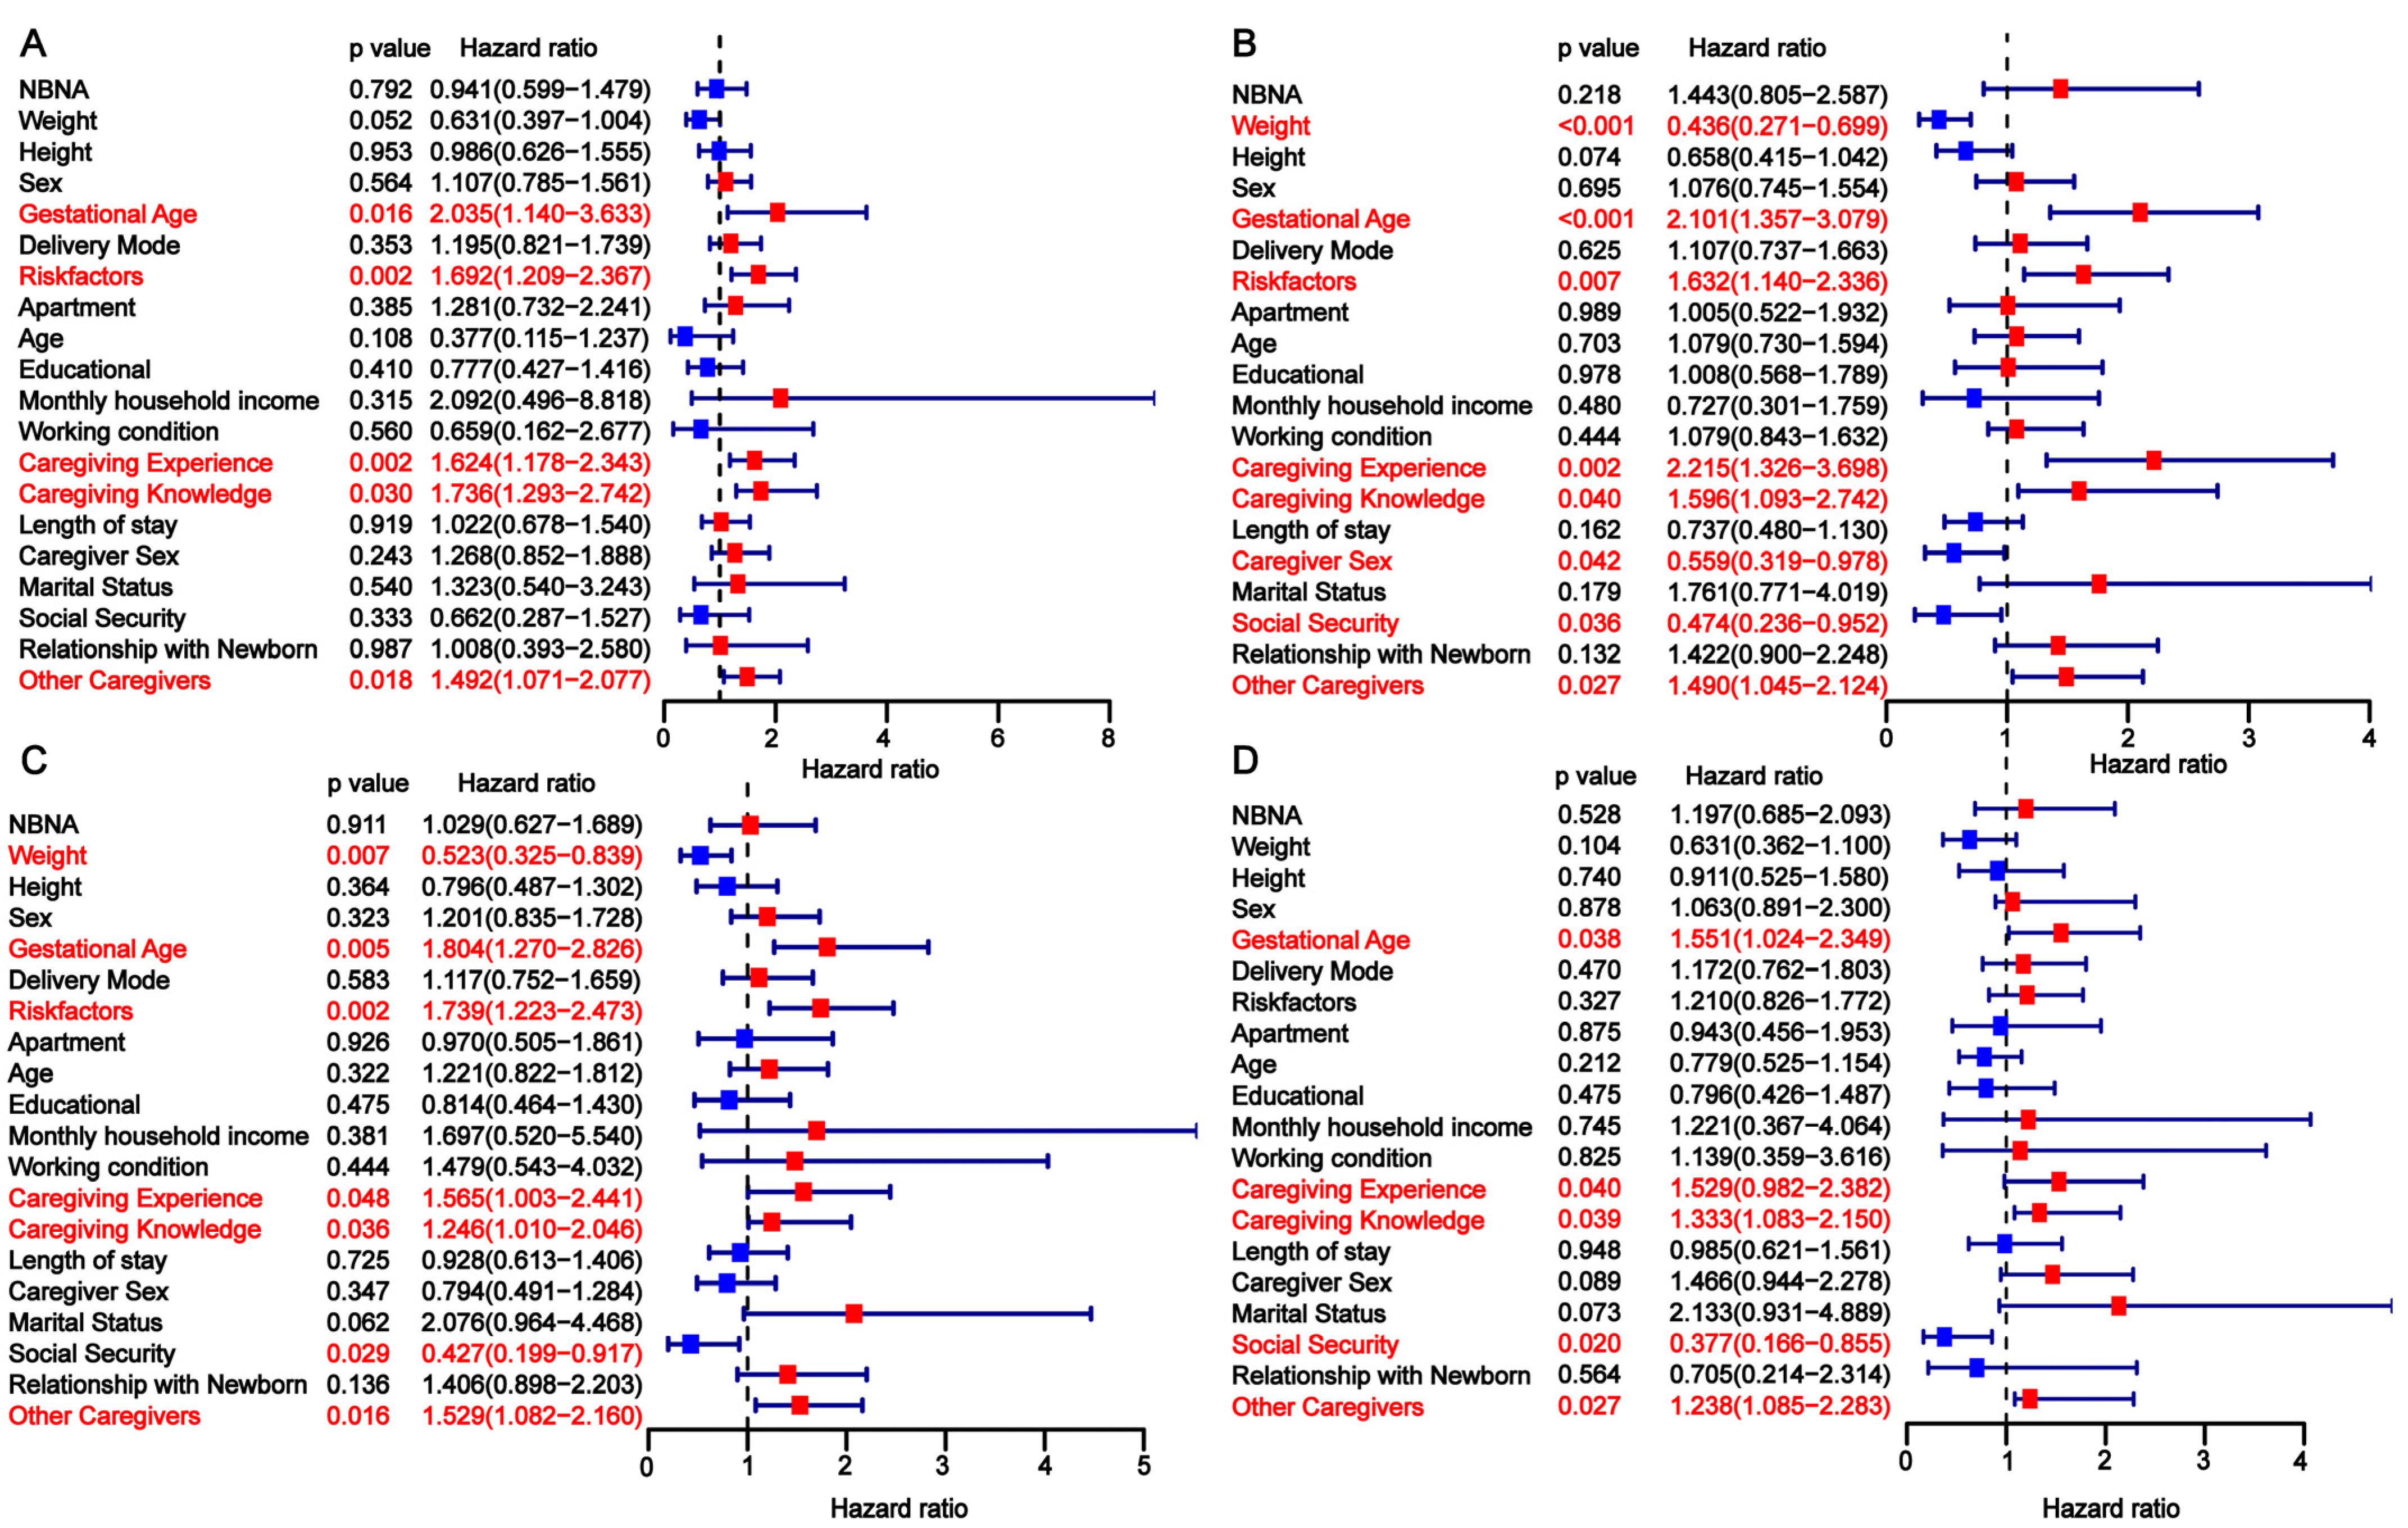
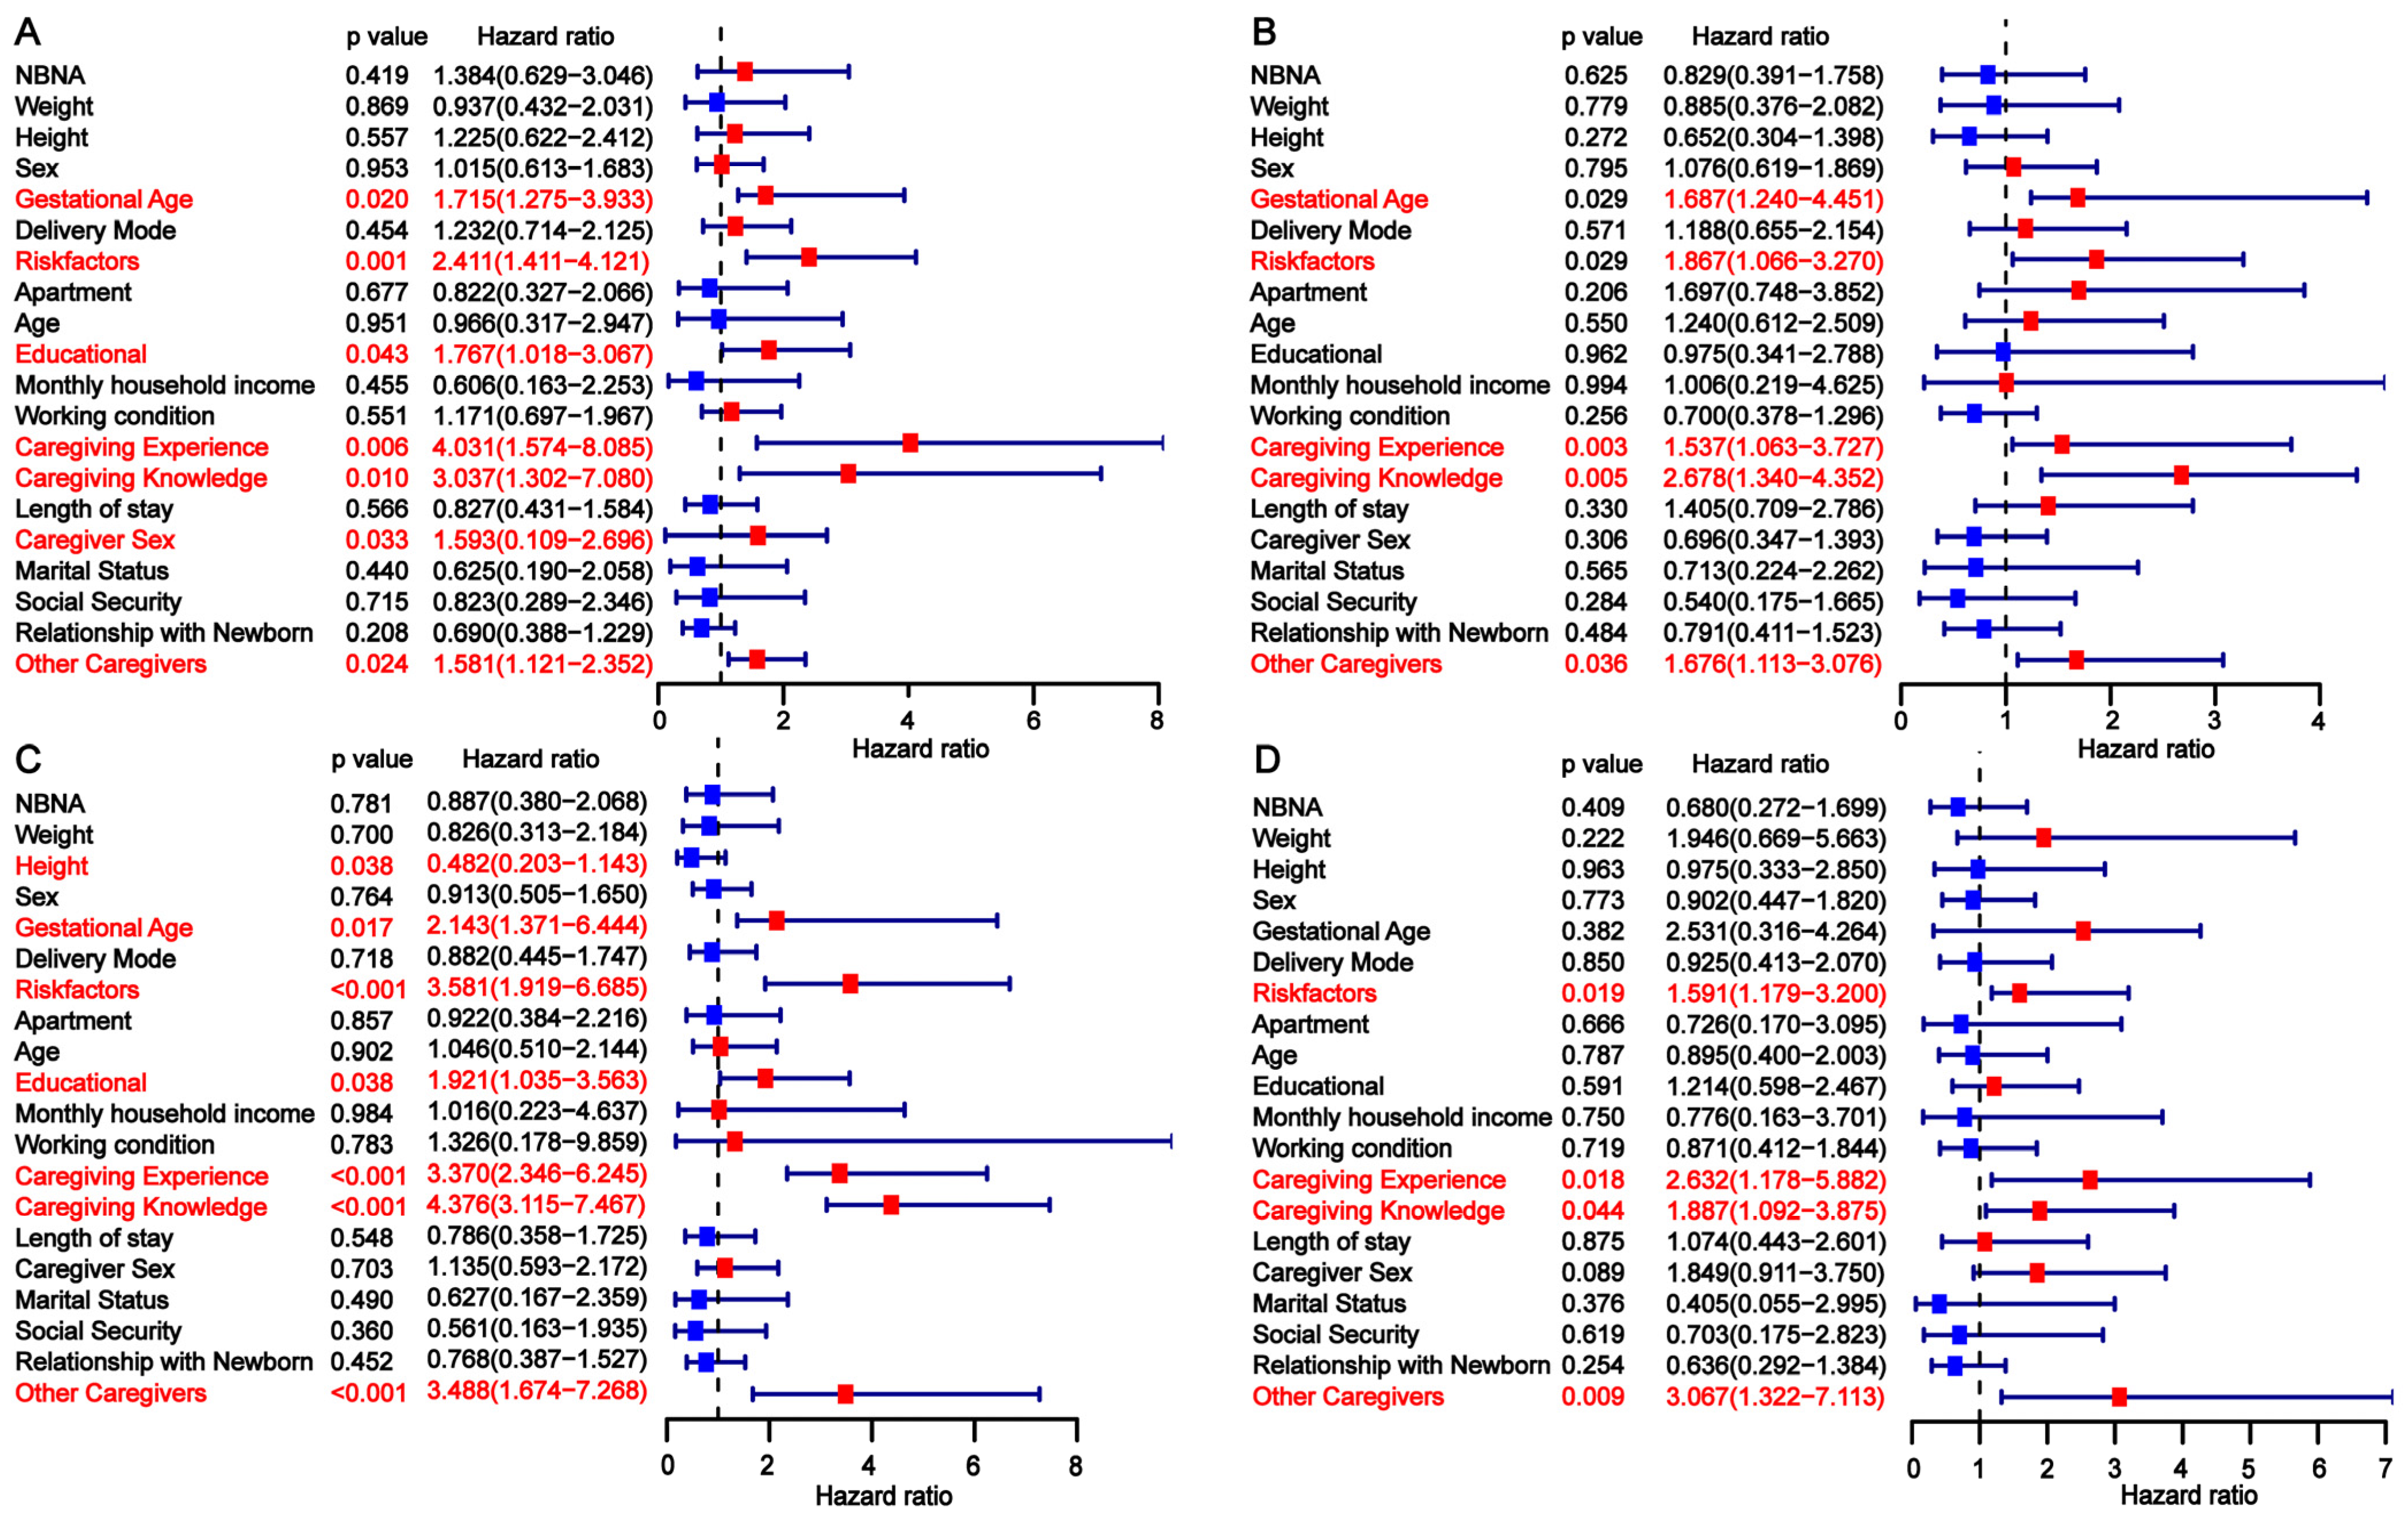
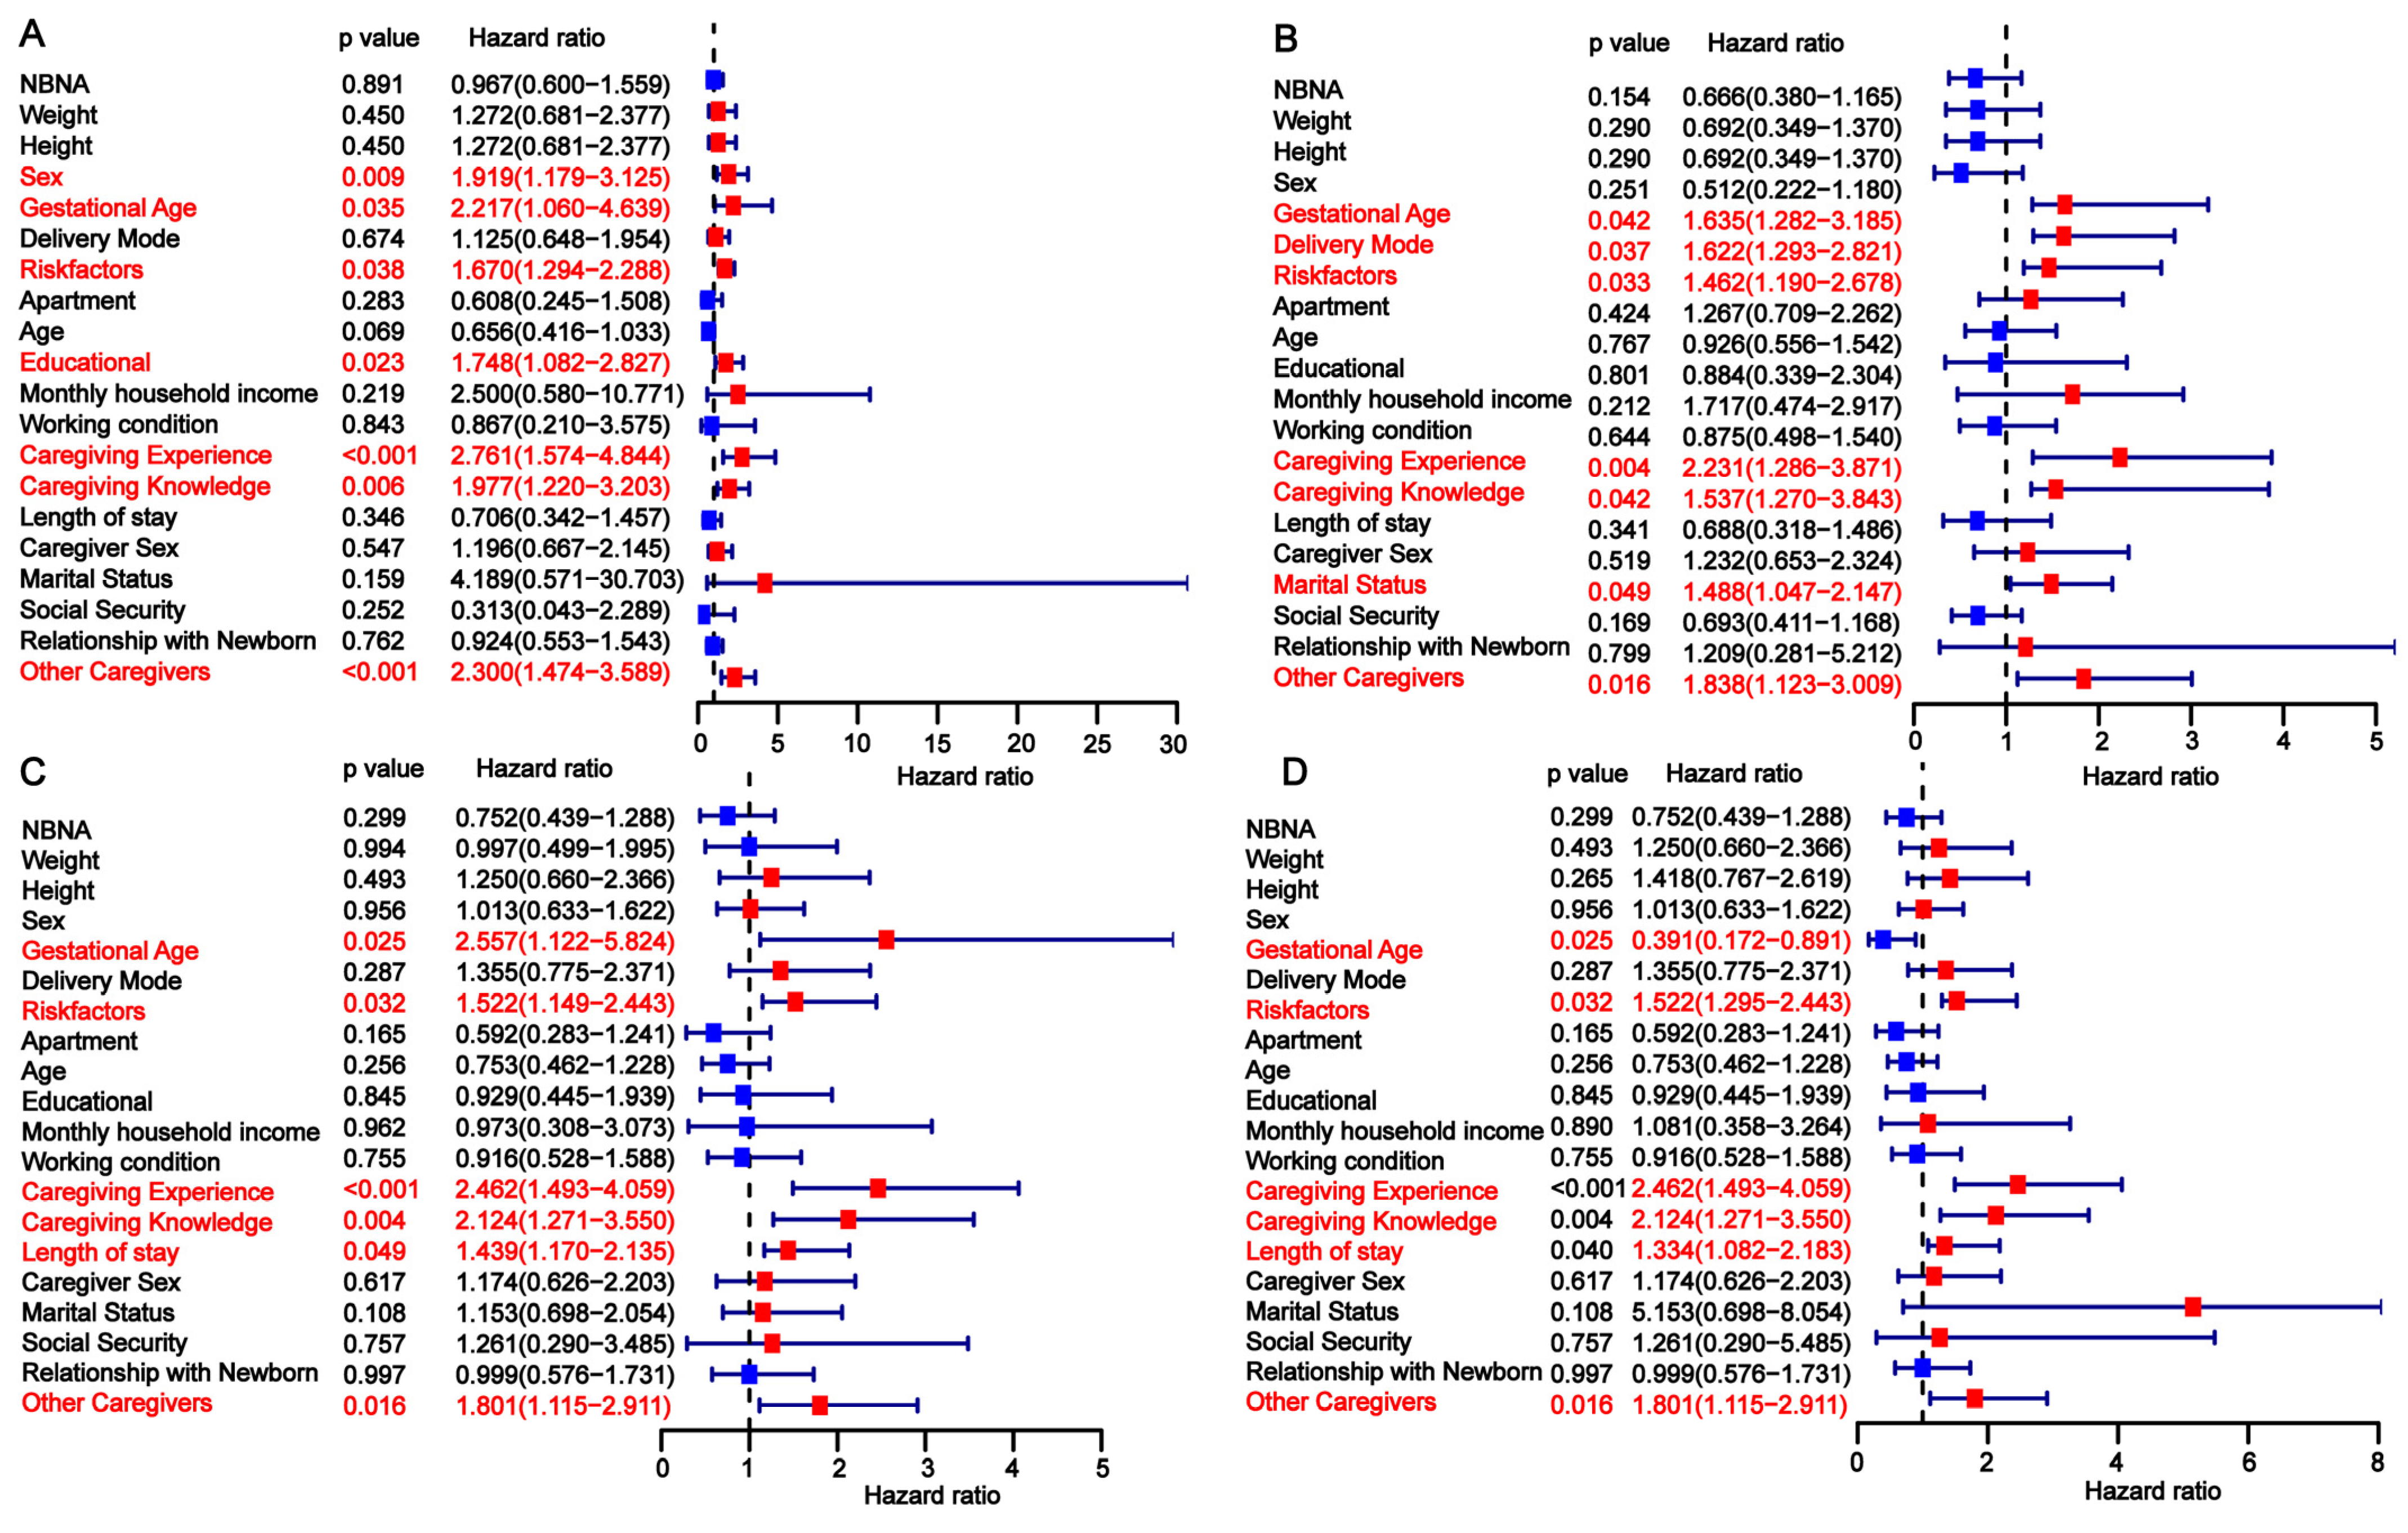
3.3. Univariate Analysis of Factors Influencing Developmental Delay in Preterm Infants

To identify independent risk factors for developmental delay in preterm infants, we conducted a univariate analysis across the three cohorts. In the training cohort, gestational age, risk factors, primary caregiver experience, caregiver knowledge, and the presence of other caregivers were found to be significantly associated with developmental delay at 3, 6, 9, and 12 months (Figure 2). The findings from the univariate analysis in the internal validation cohort were consistent with those in the training cohort (Figure 3). In the external validation cohort, gestational age <28 weeks, the presence of perinatal risk factors, lack of caregiver knowledge and experience, and the absence of other caregivers were also identified as risk factors for developmental delay at 3, 6, 9, and 12 months (Figure 4). Overall, gestational age, risk factors, caregiver experience, caregiver knowledge, and the presence of other caregivers were significantly associated with developmental delay at all four time points.

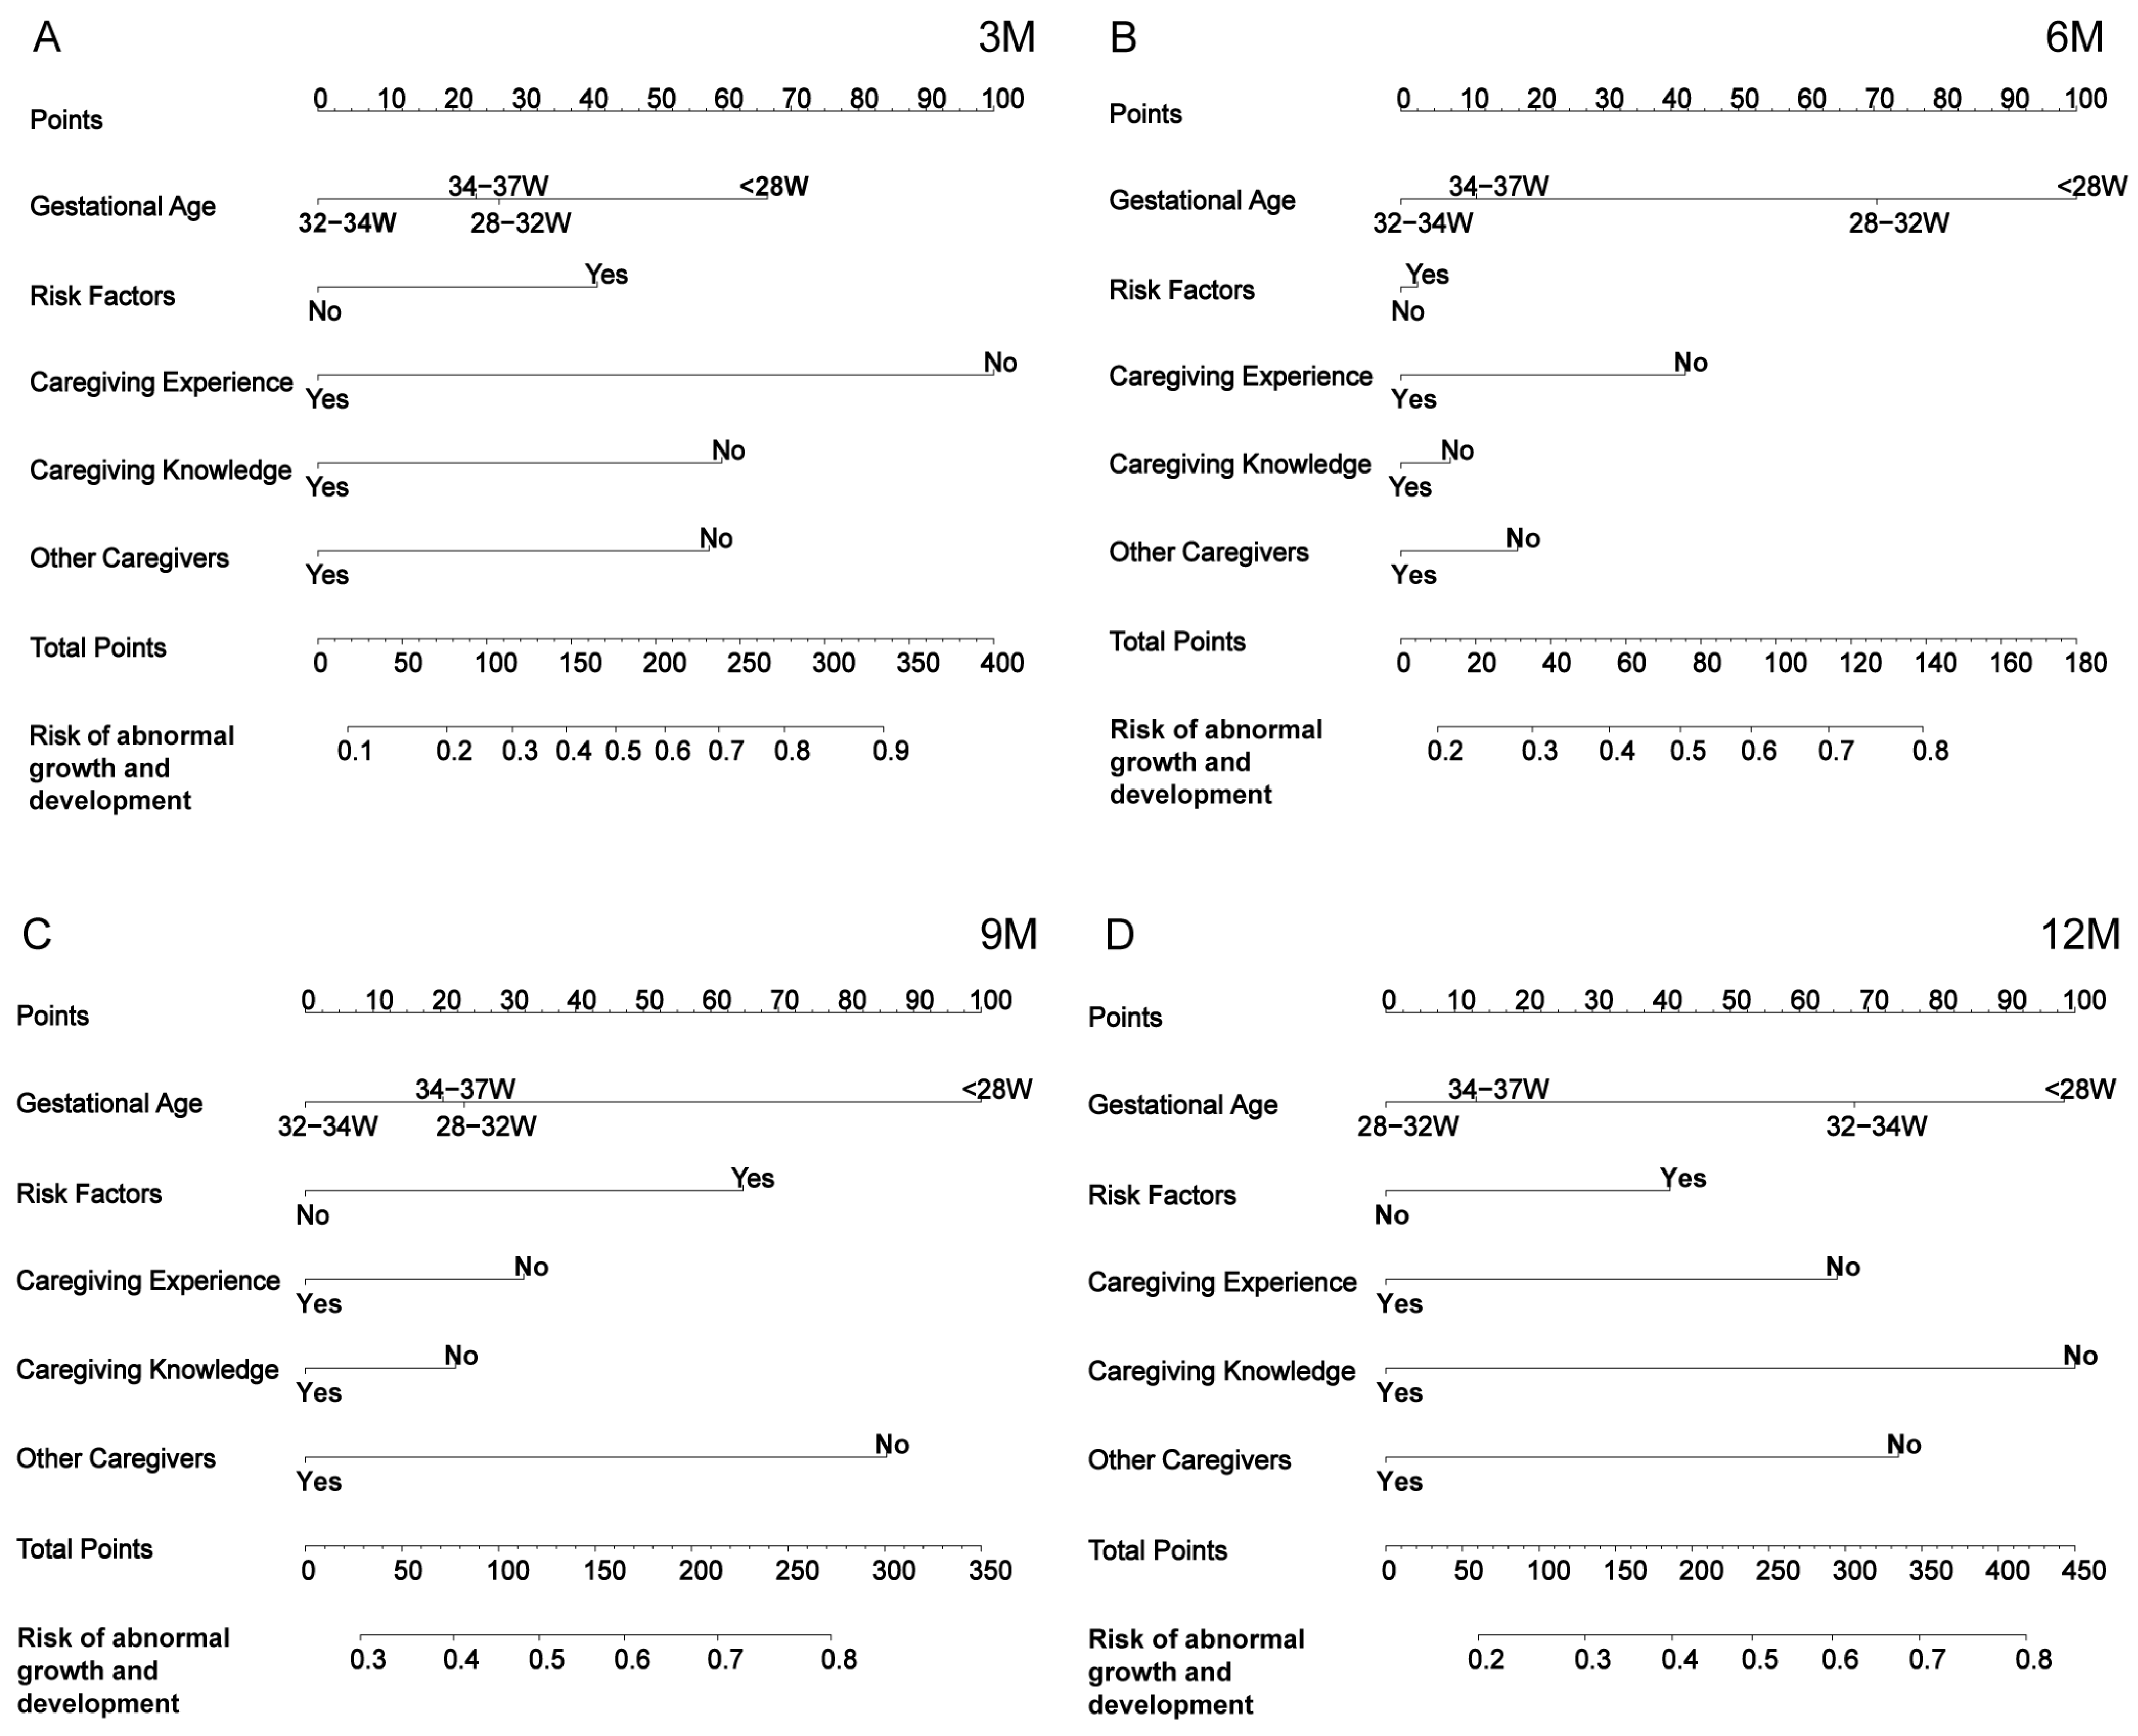
3.4. Construction of the Nomogram

Based on the five common independent prognostic factors identified through univariate analysis at the four time points (3, 6, 9, and 12 months), nomograms were constructed to predict a developmental delay in preterm infants at these time points. Using the nomogram, a risk score can be obtained for each preterm infant by summing the scores of each variable, thereby estimating the probability of developmental delay at 3, 6, 9, and 12 months (Figure 5).

3.5. Comparison Between the Nomogram and the Five Independent Factors

To evaluate the predictive performance of the nomogram for developmental delay in preterm infants, ROC analysis was conducted at 3, 6, 9, and 12 months. The AUROC values of the nomogram in the training cohort were 0.743, 0.735, 0.752, and 0.774, respectively. In the internal validation cohort, the AUROC values were 0.855, 0.771, 0.870, and 0.786, and in the external validation cohort, the AUROC values were 0.822, 0.804, 0.717, and 0.678, indicating good discriminative ability. The AROUC values of the nomogram at all four time points across the three cohorts were higher than those of the five independent risk factors (gestational age, risk factors, caregiver experience, caregiver knowledge, and presence of other caregivers), demonstrating superior predictive performance (Figure 6).

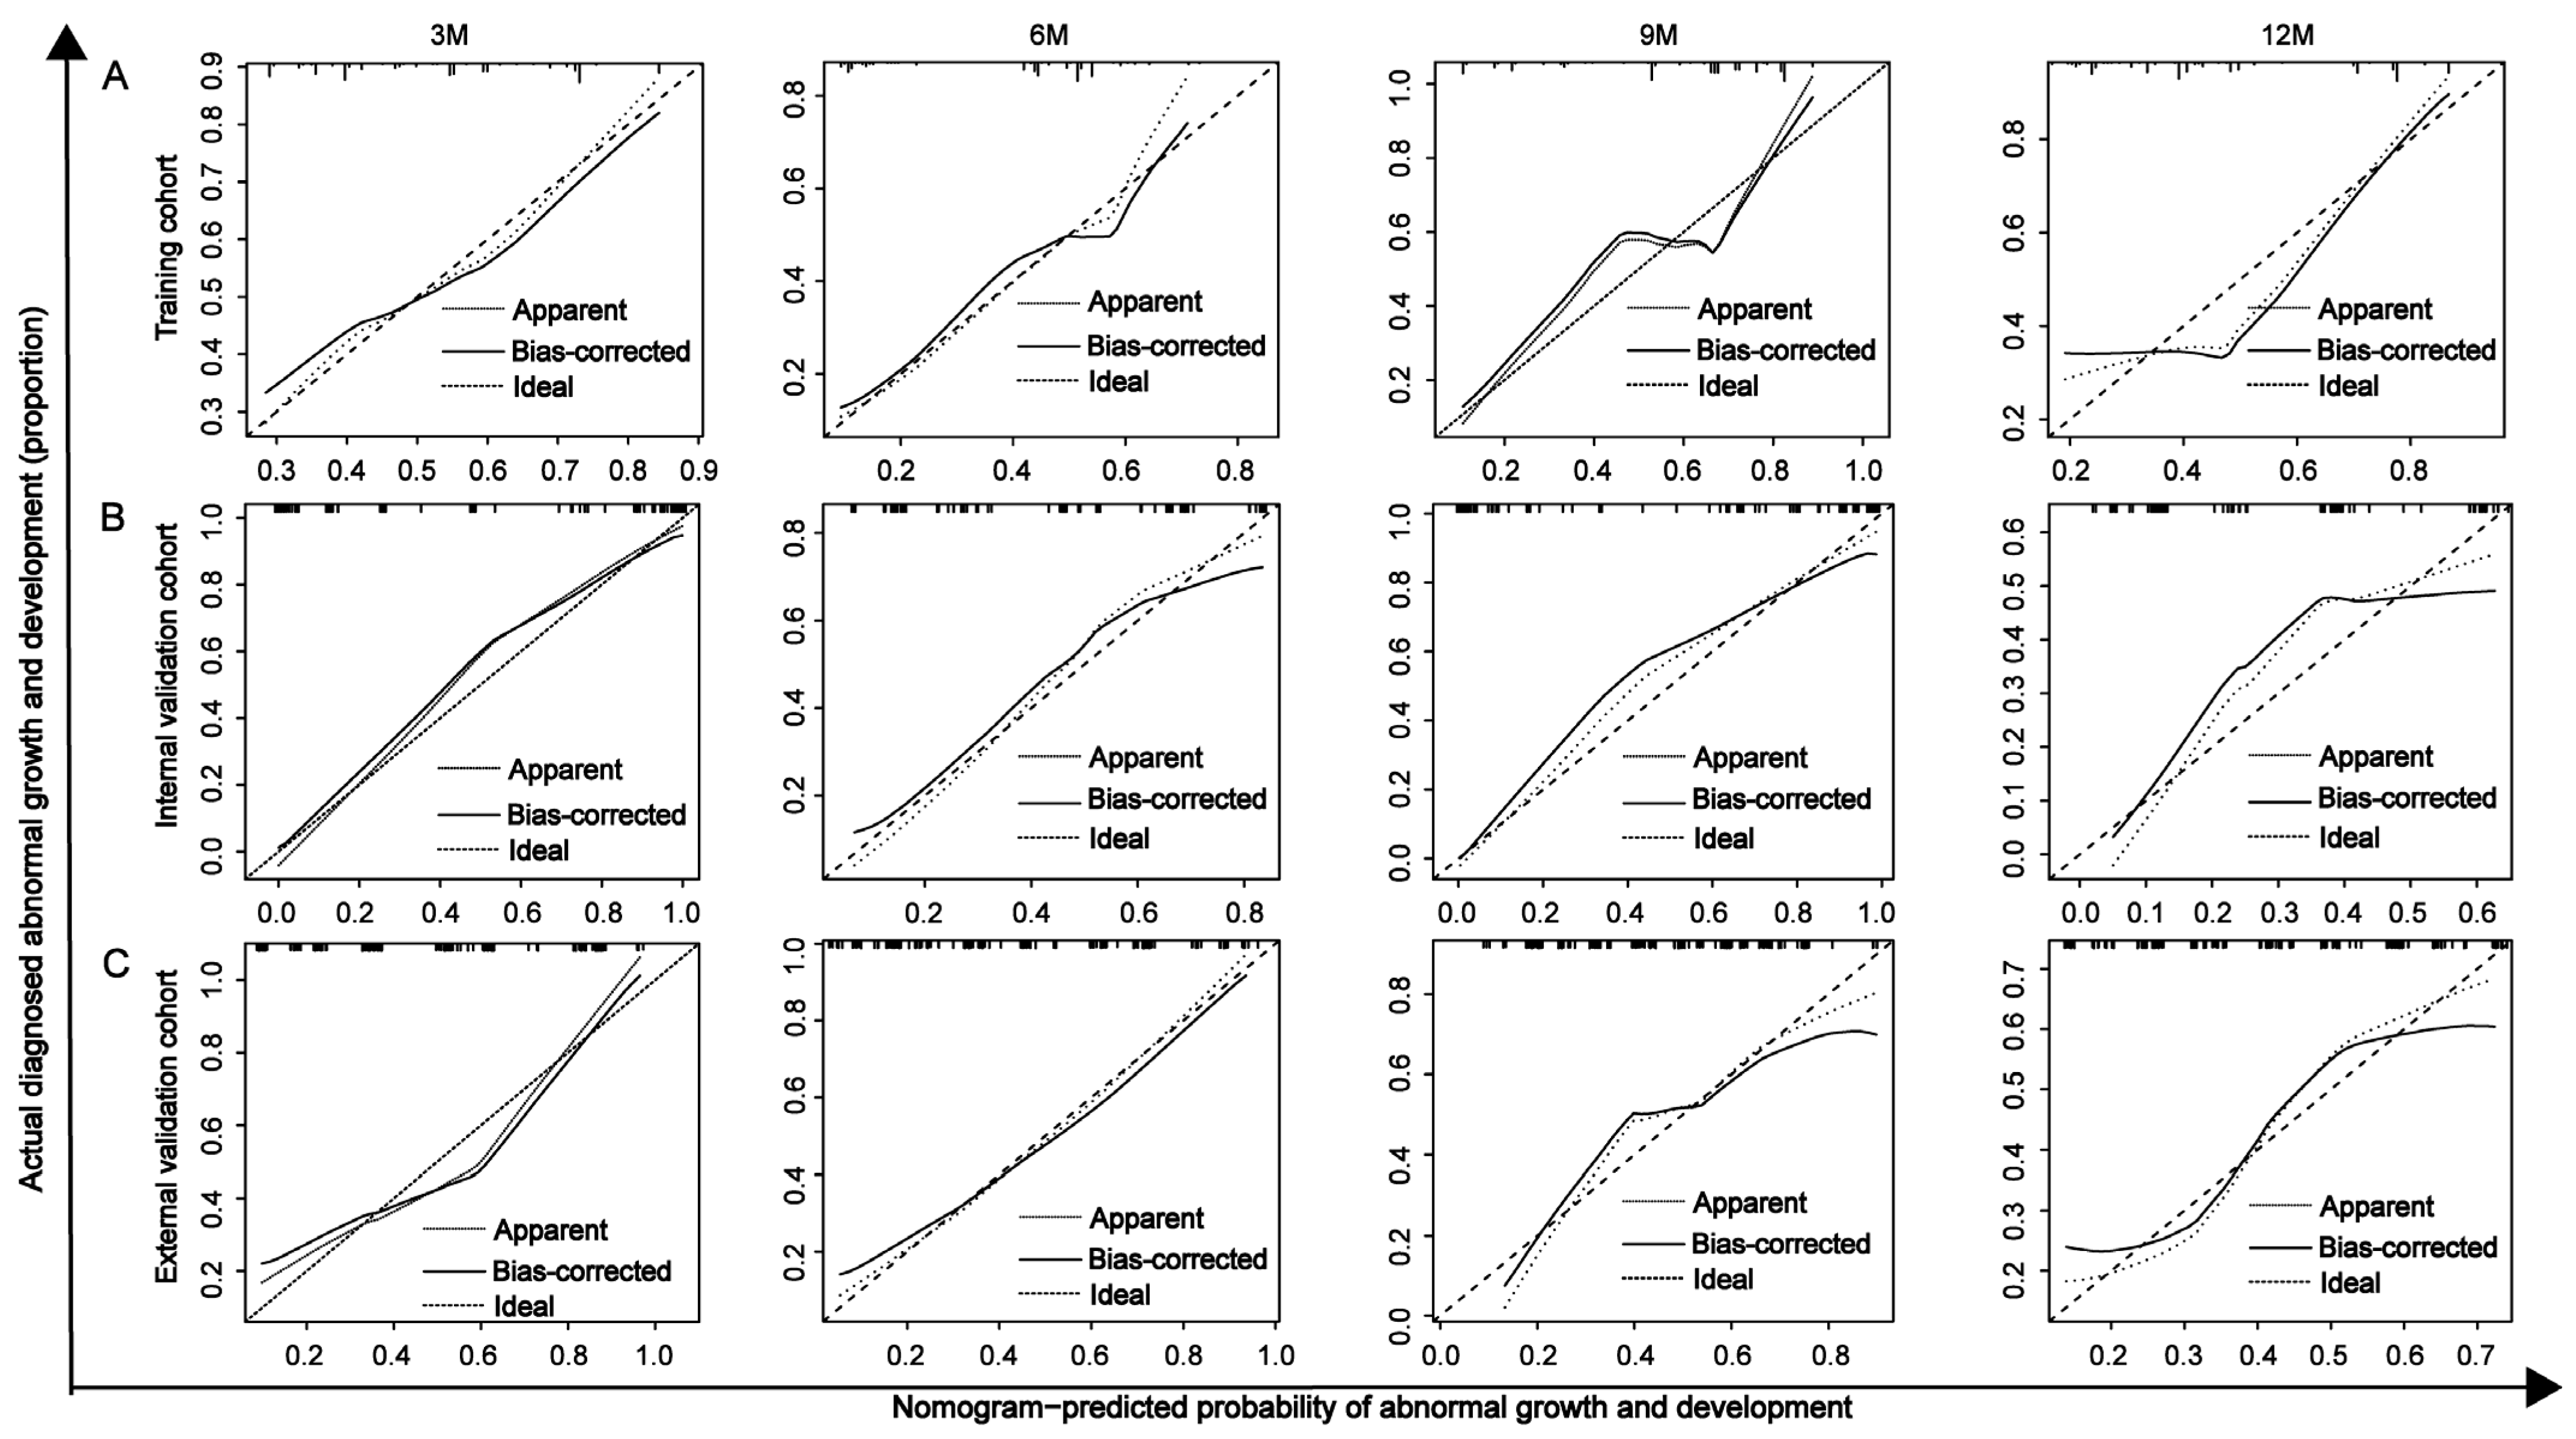
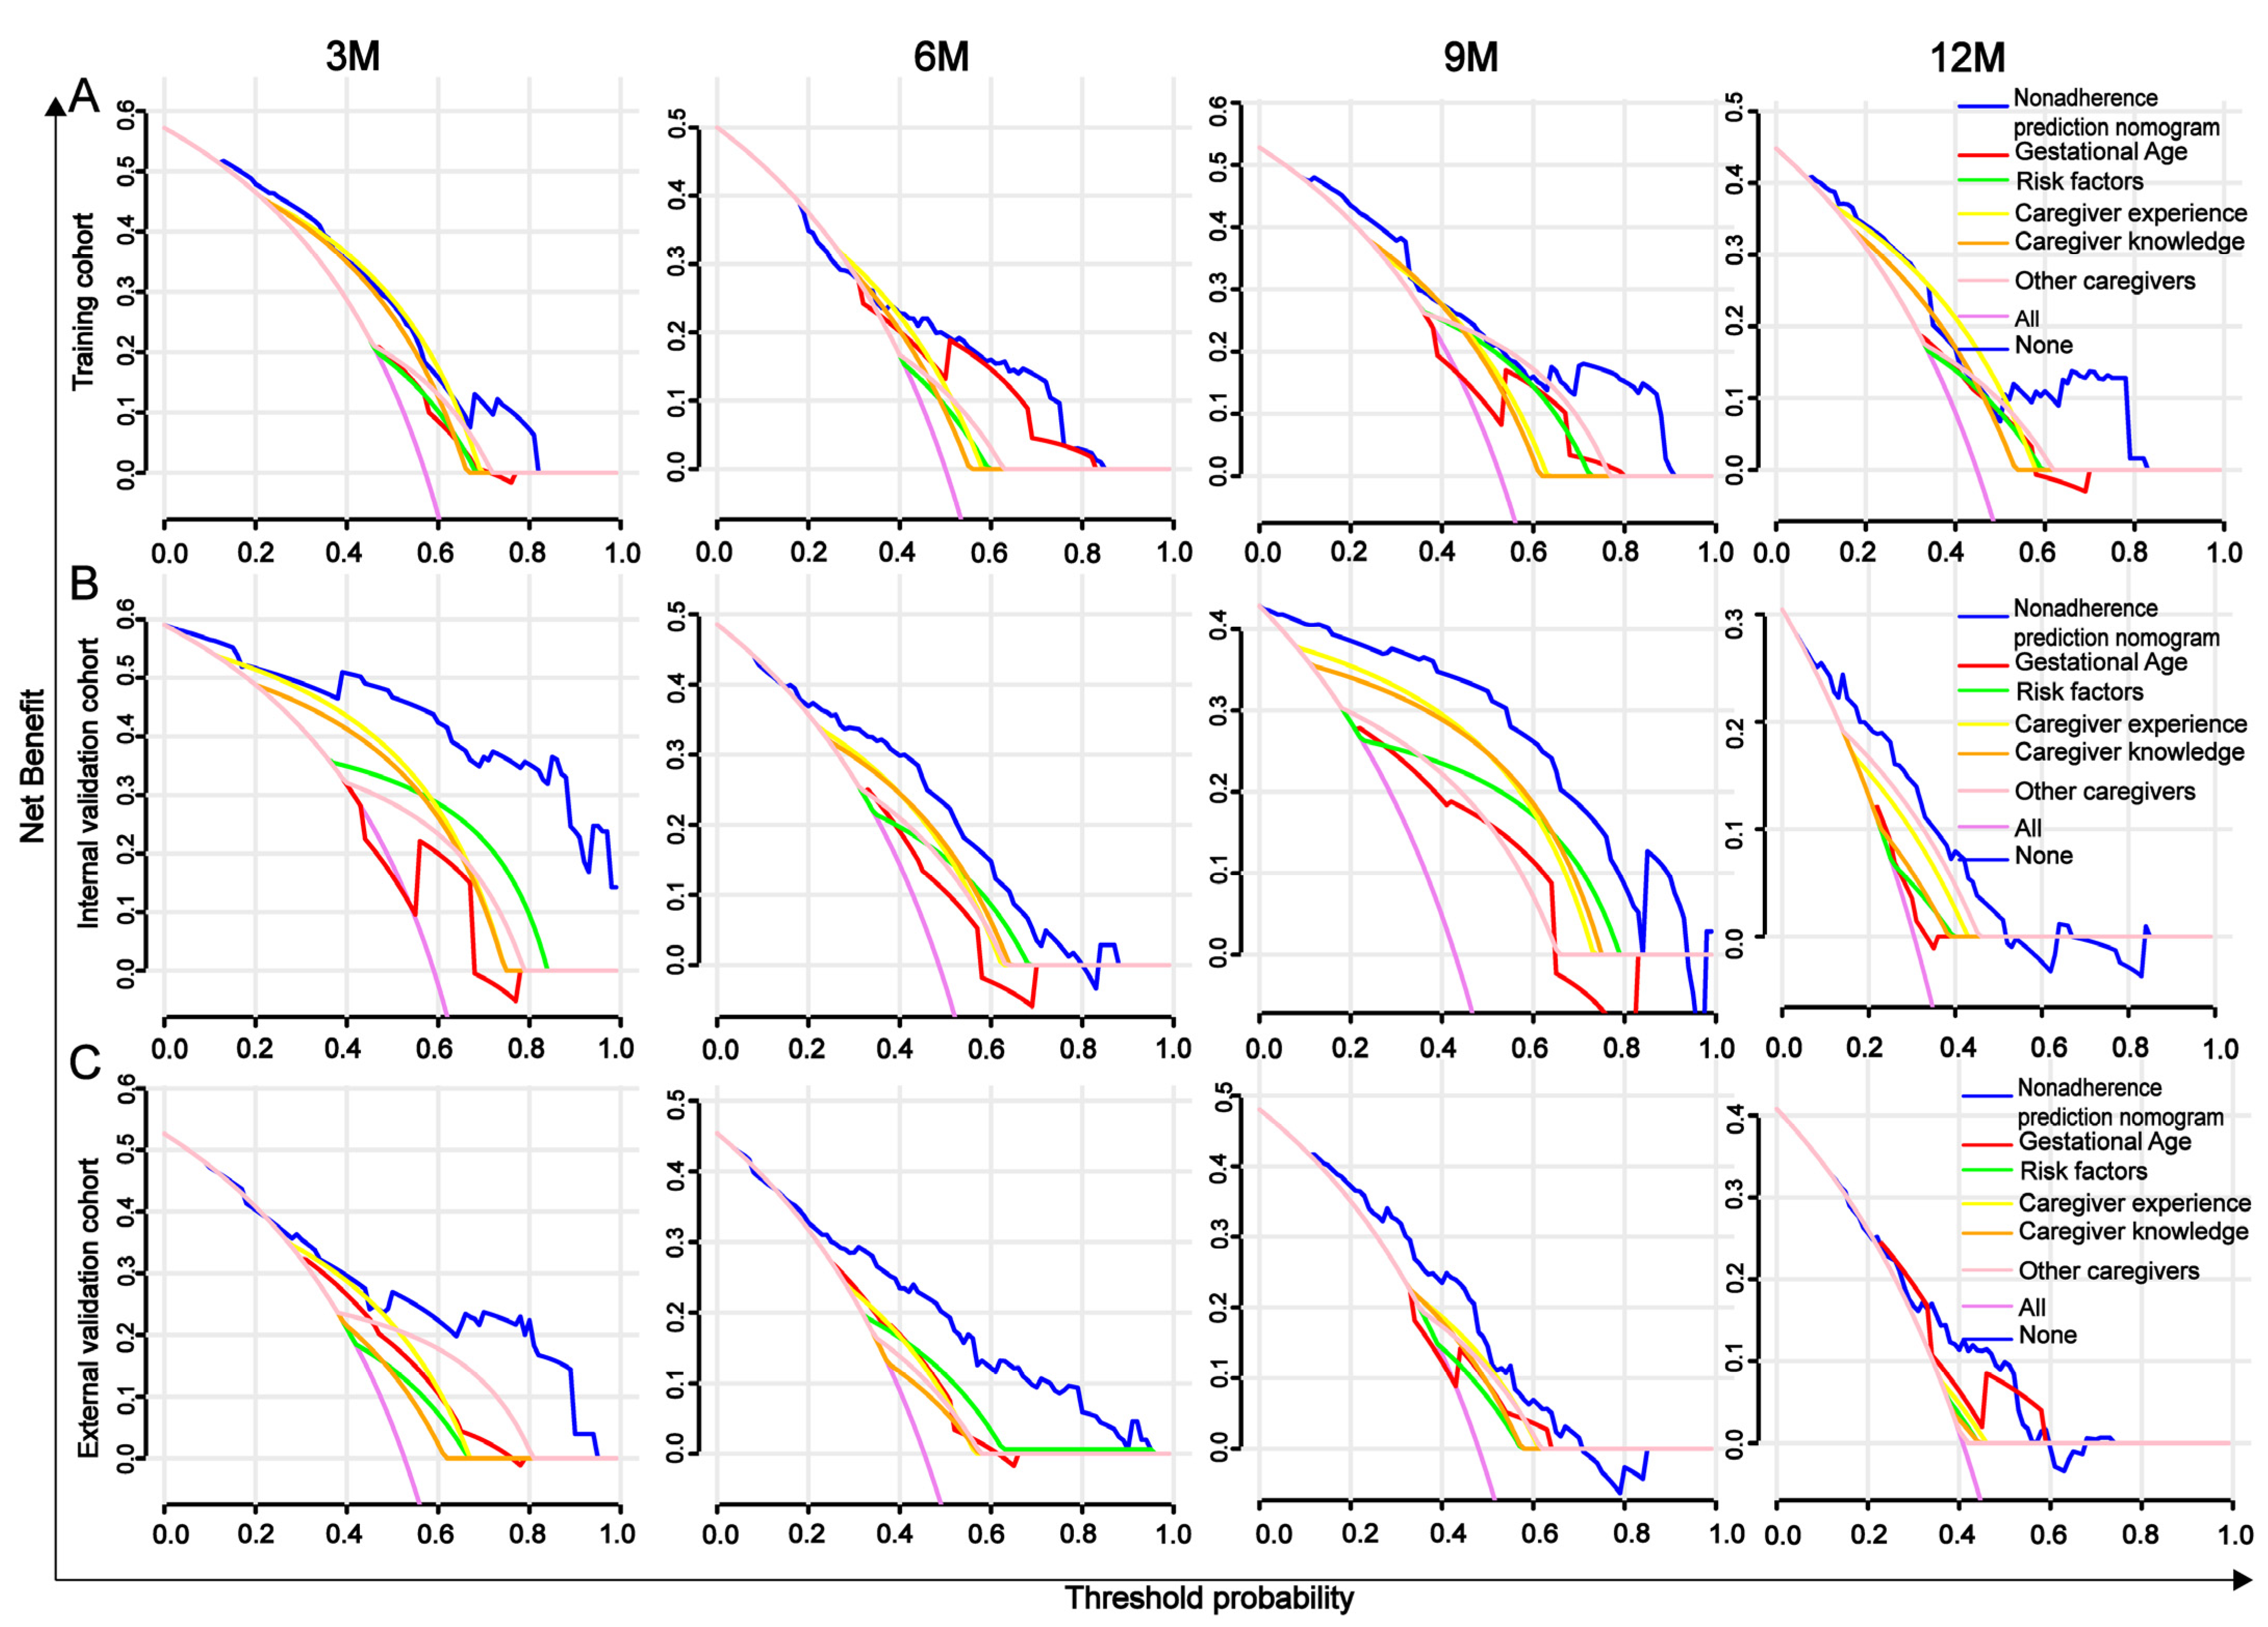
3.6. Evaluation and Validation of the Nomogram for Predicting Developmental Delay in Preterm Infants

The C-index and calibration curves were used to evaluate the discrimination and reliability of the nomogram. The C-index values of the nomogram for predicting developmental delay at 3, 6, 9, and 12 months were 0.77, 0.735, 0.803, and 0.727 in the training cohort; 0.92, 0.792, 0.946, and 0.797 in the internal validation cohort; and 0.826, 0.802, 0.749, and 0.735 in the external validation cohort, demonstrating good discriminative ability. In addition, the calibration curves at all four time points across the three cohorts closely aligned with the reference line, indicating high reliability (Figure 7).
DCA is used to assess the clinical value of diagnostic models and is considered superior to AUROC. In predicting developmental delay in preterm infants at 3, 6, 9, and 12 months, the nomogram’s DCA scores in the training, internal validation, and external validation sets were higher than those of the five independent risk factors (gestational age, risk factors, caregiver experience, caregiver knowledge, and presence of other caregivers), indicating more significant net benefit and superior clinical value (Figure 8).

4. Discussion

Preterm birth is considered one of the key indicators of a country’s health status, as it is the leading cause of neonatal mortality worldwide and the second leading cause of death among children under five years of age [2]. Although significant advances in treatment strategies have improved the survival rate of preterm infants in recent years, surviving preterm infants remain at higher risk of both short-term and long-term health complications [26]. Most current studies on the prognosis of preterm infants focus on individual diseases, and comprehensive models capable of PCA were employed to integrate physical and neurodevelopmental indicators of preterm infants into a composite index, reducing data dimensionality while retaining key information. A comprehensive index was constructed based on cohort data from the Hankou and Guanggu districts of Tongji Hospital. Independent predictive factors were identified through univariate analysis and incorporated into a nomogram to predict the growth and development of preterm infants at 3, 6, 9, and 12 months. To further validate the model’s performance, ROC analysis, calibration curves, C-index, and DCA were used to compare the predictive performance of the nomogram with five independent risk factors. The results demonstrated that the nomogram exhibited superior predictive performance for growth and development at 3, 6, 9, and 12 months. These findings suggest the model could offer valuable guidance for individualized management and intervention strategies for preterm infants.
Currently, there are relatively few studies on neonatal predictive models, particularly in neonatal growth and development, where research remains limited. Existing studies primarily focus on predictive models for specific diseases. For example, Papastefanou et al. [27] used a competing risk model to analyze the joint distribution of gestational age at delivery and birth weight Z-scores, assessing the model’s predictive ability for small-for-gestational-age infants with or without preeclampsia. However, the absence of an external validation cohort limited the model’s generalizability. Tesfie et al. [28] developed a nomogram based on nine predictive factors to predict neonatal mortality, enabling individualized risk prediction. However, the lack of internal and external validation weakened the strength of the evidence. Similarly, Liu et al. [29] developed a predictive nomogram for neonatal acute respiratory distress syndrome based on five independent predictive factors, providing an effective tool for early prediction and timely treatment. However, the small sample size and absence of internal validation compromised the stability of the results. Furthermore, Cho et al. [30] explored the major risk factors for necrotizing enterocolitis in extremely low birth weight infants using six different models. However, this study relied on public database data and lacked clinical data for validation. Notably, compared with previous studies, our study offers certain advantages in data integration and model validation. By applying PCA, we integrated physical and neurodevelopmental indicators of preterm infants and combined them with clinical characteristics to develop a comprehensive predictive model. Both internal and external validation were conducted, effectively overcoming some of the limitations observed in previous research.
PCA, a commonly used dimensionality reduction tool, extracts several uncorrelated principal components through linear transformation, thereby maximizing the explained variance of the original data [31]. It has been validated across various research fields. For example, Chakraborty et al. [32] used PCA to improve the classification performance and stability of a stroke prediction model. Muhamad et al. [33] applied PCA to extract key indicators, enhancing the identification of individuals susceptible to heat stress. Deliu et al. [34] used PCA to identify key variables contributing to asthma heterogeneity, improving the model’s stability and interpretability. Zhang et al. [35] employed PCA to identify sources of heavy metal pollution in agricultural soils, providing a powerful tool for environmental monitoring. These studies demonstrate that PCA can help identify underlying patterns and improve predictive accuracy. Furthermore, the application of PCA addresses the issue of collinearity among multiple indicators [36]. Martis et al. [37] successfully applied PCA to extract features from electrocardiogram signals, enabling the automatic classification of arrhythmias and further demonstrating the practicality of PCA in the medical field. In this study, PCA was used for dimensionality reduction, and logistic regression was applied to construct the predictive model. The validation results showed that the model demonstrated good discrimination and calibration for predicting the risk of developmental delay in preterm infants at 3, 6, 9, and 12 months, providing crucial support for clinical application.
Over time, this study observed that the clinical differences in indicators (such as caregiver knowledge and caregiving ability) among the training, internal validation, and external validation sets decreased at different time points (3, 6, 9, and 12 months). This may be attributed to the greater individual variability in growth and development during the early stages of preterm infants. However, as they age, their growth curves tend to stabilize, and their physical and neurodevelopmental status gradually approaches that of full-term infants. Furthermore, social support plays a critical role in the healthy development of preterm infants. Improvements in healthcare have led to more comprehensive nutritional interventions and early treatments for preterm infants, significantly reducing the adverse effects of high-risk factors [19]. Through the follow-up system, primary caregivers received systematic education and guidance from professionals, helping them better understand the specific needs of preterm infants and implement appropriate interventions. This not only enhanced caregivers’ coping abilities but also contributed to the gradual improvement in the infants’ physical and neurodevelopmental status. The high plasticity of the preterm infant’s nervous system allows for significant mitigation of developmental impairments under appropriate interventions [38]. Long-term follow-up interventions, such as nutritional optimization, improvements in the home environment, and professional guidance, have shown significant benefits for the healthy development of preterm infants. This also explains the gradual reduction in developmental differences observed at later time points (9 and 12 months). These findings emphasize the critical role of social factors, such as accessibility to healthcare resources, the timeliness of educational efforts, and the effectiveness of family support in promoting the healthy development of preterm infants and facilitating early biological interventions. This provides a theoretical basis for the future exploration of personalized interventions and offers practical guidance for developing a more comprehensive health management system for preterm infants.
Although this study has yielded significant findings, several limitations must be considered. First, this study was based on single-center data, and the geographic specificity of the sample may limit the model’s generalizability. Future studies should incorporate multi-center data to validate the model’s stability. Second, the follow-up period in this study was relatively short, covering only the developmental status of preterm infants at 3, 6, 9, and 12 months. Longer follow-up periods are necessary to assess the model’s long-term predictive performance. Moreover, this study did not incorporate internationally recognized neurodevelopmental assessment tools such as the General Movements Assessment (GMA) and the Hammersmith Infant Neurological Examination (HINE), which have demonstrated high sensitivity and feasibility for early prediction of cerebral palsy and related disorders [39]. According to guidelines by Novak et al. [40], GMA combined with MRI is recommended before 5 months of corrected age, and HINE with MRI after 5 months. However, this study did not follow these standards or benchmark its indicators against established gold standards, potentially limiting the model’s clinical applicability and scientific validity. Despite these limitations, this study innovatively combined physical and neurodevelopmental indicators with social factors to develop a comprehensive predictive model based on clinical and social characteristics. This model demonstrated good predictive performance at multiple time points, providing a scientific foundation for the individualized management of preterm infants. Additionally, this study highlighted the importance of educating primary caregivers and enhancing their caregiving abilities during early interventions, which was shown to play a key role in improving the growth and development of preterm infants. These findings offer valuable insights for optimizing intervention strategies and developing long-term care plans for preterm infants.

5. Conclusions

This study developed a predictive model for the growth and developmental risks of preterm infants based on physical and neurodevelopmental indicators using PCA. The model’s predictive performance at 3, 6, 9, and 12 months was validated, demonstrating high discrimination and calibration ability, thus providing a scientific foundation for individualized management and intervention strategies for preterm infants. This study emphasizes the importance of early intervention in improving preterm infant developmental outcomes. Despite limitations related to the geographic specificity of the sample and the relatively short follow-up period, the findings offer both theoretical support and practical guidance for optimizing the health management of preterm infants.

Author Contributions

K.D. drafted the manuscript. R.Y., X.Y., Y.J. and J.L. participated in the study design and the literature search. Y.M. performed the assessments of preterm infants. S.W., K.F. and Z.R. critically reviewed and revised thise manuscript. K.F., S.W. and Z.R. are the corresponding authors. All authors have read and agreed to the published version of the manuscript.

Funding

This research received no specific grant from any funding agency in the public, commercial, or not-for-profit sectors.

Institutional Review Board Statement

This study was conducted in accordance with the Declaration of Helsinki and approved by the Institutional Review Board (IRB) of Wuhan University (protocol code: WHU-LFMD-IRB2024046; date of approval: 24 December 2024).

Informed Consent Statement

Informed consent was obtained from all subjects involved in this study.

Data Availability Statement

The data presented in this study are available upon reasonable request from the corresponding author. Due to privacy and ethical restrictions, certain data cannot be publicly shared.

Acknowledgments

The authors sincerely thank the entire staff of the Neonatal Follow-up Center for their kind assistance and support throughout the follow-up assessment and manuscript preparation processes.

Conflicts of Interest

The authors declare that they have no competing interests. All authors have read and approved the final manuscript and consented to its publication.

Abbreviations

The following abbreviations are used in this manuscript:
PCAPrincipal Component Analysis
GDSGesell Developmental Schedules
NBNANeonatal Behavioral Neurological Assessment
DQThe developmental quotient
AUROCThe area under the curve
C-indexThe concordance index
DCADecision curve analysis
KMOKaiser–Meyer–Olkin

Appendix A

Table A1. Results of the KMO Value and Bartlett’s Test of Sphericity.
MonthTraining and Internal ValidationExternal Validation
KMOBartlett’s TestpKMOBartlett’s Testp
March0.8201639.571<0.0010.740507.794<0.001
June0.8101308.35<0.0010.800568.103<0.001
September0.8301217.548<0.0010.750518.131<0.001
December0.790662.763<0.0010.810439.026<0.001
Table A2. Total Variance Explained.
Time PointIngredientsTest Set and Internal ValidationExternal Verification
Initial EigenvalueVariance Contribution Rate (%)Cumulative Variance Contribution Rate (%)Initial EigenvalueVariance Contribution Rate (%)Cumulative Variance Contribution Rate (%)
3M10.0010.4790.4791.6560.3430.343
21.3320.2220.7011.5450.2980.641
30.970.1180.8180.9860.1210.763
40.7120.0630.8810.7990.080.842
50.5670.040.9220.6660.0550.898
60.5010.0310.9530.5840.0430.941
70.4460.0250.9780.5520.0380.979
80.420.02210.4140.0211
6M11.8790.4410.4411.8670.4360.436
21.4270.2540.6961.4710.2710.706
30.8120.0830.7780.7420.0690.775
40.6910.060.8380.6810.0580.833
50.6240.0490.8860.6620.0550.888
60.6030.0450.9320.6150.0470.935
70.5410.0370.9680.5380.0360.971
80.5020.03210.480.0291
9M11.8790.4410.4411.860.4330.433
21.3870.2410.6821.3250.220.652
30.8050.0810.7630.970.1180.77
40.6960.0610.8240.7460.070.839
50.6470.0520.8760.6710.0560.895
60.6410.0510.9270.5850.0430.938
70.5690.0410.9680.5080.0320.971
80.5070.03210.4850.0291
12M11.6880.3560.3561.8640.4340.434
21.1760.1730.5291.1490.1650.599
30.9430.1110.641.0080.1270.726
40.9120.1040.7440.8340.0870.813
50.8670.0940.8380.7390.0680.882
60.7470.070.9080.6250.0490.93
70.6930.060.9680.5850.0430.973
80.5060.03210.4640.0271
Table A3. Rotated Principal Component Score Coefficients.
Time PointIndicatorsTest Set and Internal ValidationExternal Verification
F1F2F3F4F5F1F2F3F4
3M X 1−0.0110.562−0.152 0.0600.367−0.096−0.103
X 2−0.022−0.0720.994 −0.0180.3780.010.055
X 3−0.0250.5270.036 −0.0710.3570.0610.04
X 40.242−0.012−0.002 0.281−0.021−0.0250.179
X 50.2030.005−0.09 −0.046−0.0130.999−0.032
X 60.231−0.0340.007 −0.229−0.003−0.0251.038
X 70.2320.0150.028 0.4230.008−0.064−0.128
X 80.239−0.0220.015 0.569−0.0170.003−0.412
6M X 10.019−0.2141.057−0.044 −0.1420.3670.441−0.193
X 20.0150.4870.037−0.043 0.0250.3970.04−0.132
X 3−0.0520.695−0.3640.039 0.0950.38−0.6250.268
X 40.472−0.015−0.031−0.373 0.5460.022−0.238−0.296
X 50.312−0.030.077−0.087 0.3620.0230.282−0.362
X 60.4810.009−0.016−0.391 0.462−0.058−0.3550.01
X 70.074−0.0150.0380.374 −0.281−0.045−0.1051.179
X 8−0.3240.004−0.0581.114 −0.119−0.0440.9560.035
9M X 10.001−0.2161.0640.082 0.1320.4780.187−0.197
X 20.1680.52−0.002−0.459 −0.1470.643−0.2770.175
X 3−0.1250.692−0.3140.36 −0.085−0.110.9040.019
X 40.221−0.0310.0890.102 −0.361−0.0190.0950.718
X 5−0.1410.010.0311.083 0.721−0.045−0.45−0.428
X 60.233−0.0390.0920.079 −0.1560.021−0.1380.544
X 70.3770.093−0.121−0.352 0.4670.016−0.078−0.136
X 80.414−0.013−0.017−0.446 0.2580.0010.0520.094
12M X 1−0.013−0.093−0.016−0.11.024−0.0021.019−0.093−0.114
X 2−0.004−0.0670.0211.019−0.1−0.023−0.11.0120.026
X 3−0.0491.0190.03−0.066−0.092−0.017−0.1070.020.972
X 4−0.1150.031.030.021−0.020.226−0.083−0.0440.143
X 50.3190.01−0.1410.082−0.110.221−0.0220.0080.072
X 60.267−0.130.057−0.0230.060.258−0.001−0.021−0.055
X 70.336−0.007−0.077−0.0140.0410.243−0.0580.030.029
X 80.3370.017−0.08−0.053−0.0120.2540.168−0.02−0.228

Appendix B

3M Training and Internal Validation Set: Principal Component Score Formula: F1 = −0.011 X 1 − 0.022 X 2 − 0.025 X 3 + 0.242 X 4 + 0.203 X 5 + 0.231 X 6 + 0.232 X 7 + 0.239 X 8; F2 = 0.562 X 1 − 0.072 X 2 + 0.527 X 3 − 0.012 X 4 + 0.005 X 5 − 0.036 X 6 + 0.015 X 7 − 0.022 X 8; F3 = −0.152 X 1 + 0.994 X 2 + 0.036 X 3 − 0.002 X 4 − 0.090 X 5 + 0.007 X 6 + 0.028 X 7 + 0.015 X 8. Composite Index = 0.475F1 + 0.216F2 + 0.127F3.
3M External Validation Set: Principal Component Score Formula: F1 = 0.060 X 1 − 0.018 X 2 − 0.071 X 3 + 0.281 X 4 − 0.046 X 5 − 0.229 X 6 + 0.423 X 7 + 0.569 X 8; F2 = 0.367 X 1 + 0.378 X 2 + 0.357 X 3 − 0.021 X 4 − 0.013 X 5 − 0.003 X 6 + 0.008 X 7 − 0.017 X 8; F3 = −0.096 X 1 + 0.010 X 2 + 0.061 X 3 − 0.025 X 4 + 0.999 X 5 − 0.025 X 6 − 0.064 X 7 + 0.003 X 8; F4 = −0.103 X 1 + 0.055 X 2 + 0.040 X 3 + 0.179 X 4 − 0.032 X 5 + 1.038 X 6 − 0.128 X 7 − 0.412 X 8. Composite Index = 0.309F1 + 0.274F2 + 0.126F3 + 0.133F4.
6M Training and Internal Validation Set: Principal Component Score Formula: F1 = 0.019 X 1 + 0.015 X 2 − 0.052 X 3 + 0.472 X 4 + 0.312 X 5 + 0.481 X 6 + 0.074 X 7 − 0.324 X 8; F2 = −0.214 X 1 + 0.487 X 2 + 0.695 X 3 − 0.015 X 4 − 0.030 X 5 + 0.009 X 6 − 0.015 X 7 + 0.004 X 8; F3 = 1.057 X 1 + 0.037 X 2 − 0.364 X 3 − 0.031 X 4 + 0.077 X 5 − 0.016 X 6 + 0.038 X 7 − 0.058 X 8; F4 = −0.044 X 1 − 0.043 X 2 + 0.039 X 3 − 0.373 X 4 − 0.087 X 5 − 0.391 X 6 + 0.374 X 7 + 1.114 X 8. Composite Index = 0.358F1 + 0.211F2 + 0.128F3 + 0.141F4.
6M External Validation Set: Principal Component Score Formula: F1 = −0.142 X 1 + 0.025 X 2 + 0.095 X 3 + 0.546 X 4 + 0.362 X 5 + 0.462 X 6 − 0.281 X 7 − 0.119 X 8; F2 = 0.367 X 1 + 0.397 X 2 + 0.380 X 3 + 0.022 X 4 + 0.023 X 5 − 0.058 X 6 − 0.045 X 7 − 0.044 X 8; F3 = 0.441 X 1 + 0.040 X 2 − 0.625 X 3 − 0.238 X 4 + 0.282 X 5 − 0.355 X 6 − 0.105 X 7 + 0.956 X 8; F4 = −0.193 X 1 − 0.132 X 2 + 0.268 X 3 − 0.296 X 4 − 0.362 X 5 + 0.010 X 6 + 1.179 X 7 + 0.035 X 8. Composite Index = 0.307F1 + 0.292F2 + 0.106F3 + 0.128F4.
9M Training and Internal Validation Set: Principal Component Score Formula: F1 = 0.001 X 1 + 0.168 X 2 − 0.125 X 3 + 0.221 X 4 − 0.141 X 5 + 0.233 X 6 + 0.377 X 7 + 0.414 X 8; F2 = −0.216 X 1 + 0.520 X 2 + 0.692 X 3 − 0.031 X 4 + 0.010 X 5 − 0.039 X 6 + 0.093 X 7 − 0.013 X 8; F3 = 1.064 X 1 − 0.002 X 2 − 0.314 X 3 + 0.089 X 4 + 0.031 X 5 + 0.092 X 6 − 0.121 X 7 − 0.017 X 8; F4 = 0.082 X 1 − 0.459 X 2 + 0.360 X 3 + 0.102 X 4 + 1.083 X 5 + 0.079 X 6 − 0.352 X 7 − 0.446 X 8. Composite Index = 0.397F1 + 0.197F2 + 0.127F3 + 0.103F4.
9M External Validation Set: Principal Component Score Formula: F1 = 0.132 X 1 − 0.147 X 2 − 0.085 X 3 − 0.361 X 4 + 0.721 X 5 − 0.156 X 6 + 0.467 X 7 + 0.258 X 8; F2 = 0.478 X 1 + 0.643 X 2 − 0.110 X 3 − 0.019 X 4 − 0.045 X 5 + 0.021 X 6 + 0.016 X 7 + 0.001 X 8; F3 = 0.187 X 1 − 0.277 X 2 + 0.904 X 3 + 0.095 X 4 − 0.022 X 5 − 0.138 X 6 − 0.078 X 7 + 0.052 X 8; F4 = −0.197 X 1 + 0.175 X 2 + 0.019 X 3 + 0.718 X 4 − 0.428 X 5 + 0.544 X 6 − 0.136 X 7 + 0.094 X 8. Composite Index = 0.258F1 + 0.203F2 + 0.141F3 + 0.236F4.
12M Training and Internal Validation Set: Principal Component Score Formula: F1 = 0.019 X 1 + 0.015 X 2 − 0.052 X 3 + 0.472 X 4 + 0.312 X 5 + 0.481 X 6 + 0.074 X 7 − 0.324 X 8; F2 = −0.214 X 1 + 0.487 X 2 + 0.695 X 3 − 0.015 X 4 − 0.030 X 5 + 0.009 X 6 − 0.015 X 7 + 0.004 X 8; F3 = 1.057 X 1 + 0.037 X 2 − 0.364 X 3 − 0.031 X 4 + 0.077 X 5 − 0.016 X 6 + 0.038 X 7 − 0.058 X 8; F4 = −0.044 X 1 − 0.043 X 2 + 0.039 X 3 − 0.373 X 4 − 0.087 X 5 − 0.391 X 6 + 0.374 X 7 + 1.114 X 8. Composite Index = 0.358F1 + 0.211F2 + 0.128F3 + 0.141F4.
12M External Validation Set: Principal Component Score Formula: F1 = −0.002 X 1 − 0.023 X 2 − 0.017 X 3 + 0.226 X 4 + 0.221 X 5 + 0.258 X 6 + 0.243 X 7 + 0.254 X 8; F2 = 1.019 X 1 − 0.100 X 2 − 0.107 X 3 − 0.083 X 4 − 0.022 X 5 − 0.001 X 6 − 0.058 X 7 + 0.168 X 8; F3 = −0.093 X 1 + 1.012 X 2 + 0.020 X 3 − 0.044 X 4 + 0.008 X 5 − 0.021 X 6 + 0.030 X 7 − 0.020 X 8; F4 = −0.114 X 1 + 0.026 X 2 + 0.972 X 3 + 0.143 X 4 + 0.072 X 5 − 0.055 X 6 + 0.029 X 7 − 0.228 X 8. Composite Index = 0.433F1 + 0.126F2 + 0.125F3 + 0.129F4.

Appendix C

General Demographic Characteristics
Training Cohort Internal Validation Cohort External Validation Cohort
Characteristics Healthy
Development
Developmental
Impairment
pHealthyDevelopmentDevelopmentalImpairmentpHealthy
Development
Developmental
Impairment
p
N = 107 (%)N = 143 (%) N = 43 (%)N = 62 (%) N = 72 (%)N = 80 (%)
Premature infant
NBNAHigh16 (14.95)26 (18.18)0.7068 (18.60)9 (14.52)0.725536 (50.00)43 (53.75)0.2584
Middle32 (29.91)45 (31.47) 14 (32.56)18 (29.03) 21 (29.17)28 (35.00)
Low59 (55.14)72 (50.35) 21 (48.84)35 (56.45) 15 (20.83)9 (11.25)
SexFemale37 (34.58)56 (39.16)0.542321 (48.84)33 (53.23)0.807339 (54.17)23 (28.75)0.0025
Male70 (65.42)87 (60.84) 22 (51.16)29 (46.77) 33 (45.83)57 (71.25)
Gestational Age<28 W8 (7.48)8 (5.59)0.00734 (9.30)8 (12.90)0.00165 (6.94)16 (20.00)0.0003
28–32 W24 (22.43)52 (36.36) 6 (13.95)28 (45.16) 19 (26.39)36 (45.00)
32–34 W16 (14.95)33 (23.08) 21 (48.84)12 (19.35) 16 (22.22)15 (18.75)
34–37 W59 (55.14)50 (34.97) 12 (27.91)14 (22.58) 32 (44.44)13 (16.25)
Delivery ModeCesarean Section84 (78.50)105 (73.43)0.437634 (79.07)43 (69.35)0.377557 (79.17)64 (80.00)1
Natural birth23 (21.50)38 (26.57) 9 (20.93)19 (30.65) 15 (20.83)16 (20.00)
Risk FactorsNo68 (63.55)59 (41.26)0.000835 (81.40)20 (32.26)<0.000150 (69.44)36 (45.00)0.0041
Yes39 (36.45)84 (58.74) 8 (18.60)42 (67.74) 22 (30.56)44 (55.00)
Primary caregivers
ApartmentCity80 (74.77)112 (78.32)0.659331 (72.09)51 (82.26)0.386965 (90.28)71 (88.75)0.4191
Towns10 (9.35)14 (9.79) 4 (9.30)5 (8.06) 6 (8.33)5 (6.25)
Villages17 (15.89)17 (11.89) 8 (18.60)6 (9.68) 1 (1.39)4 (5.00)
Caregivers Age<20 Y31 (28.97)44 (30.77)0.70187 (16.28)16 (25.81)0.277918 (25.00)33 (41.25)0.1167
20–30 Y71 (66.36)94 (65.73) 34 (79.07)42 (67.74) 49 (68.06)43 (53.75)
31–40 Y5 (4.67)4 (2.80) 1 (2.33)4 (6.45) 5 (6.94)3 (3.75)
41–50 Y0 (0)1 (0.70) 1 (2.33)0 (0.00) 0 (0.00)1 (1.25)
Educational levelPrimary and lower4 (3.74)2 (1.40)0.00042 (4.65)0 (0.00)0.0081 (1.39)4 (5.00)0.0003
Middle or high school88 (82.24)128 (89.51) 38 (88.37)55 (88.71) 56 (77.78)68 (85.00)
College and above15 (14.02)13 (9.09) 3 (6.98)7 (11.29) 15 (20.83)8 (10.00)
Monthly Household Income<2 K5 (4.67)2 (1.40)0.04720 (0.00)3 (4.84)0.05725 (6.94)2 (2.50)0.6123
2–6 K29 (27.10)47 (32.87) 13 (30.23)23 (37.10) 13 (18.06)14 (17.50)
7–10 K40 (37.38)67 (46.85) 15 (34.88)27 (43.55) 36 (50.00)44 (55.00)
>10 K33 (30.84)27 (18.88) 15 (34.88)9 (14.52) 18 (25.00)20 (25.00)
Working ConditionEmployee79 (73.83)102 (71.33)0.464133 (75.00)36 (58.06)0.139756 (77.78)62 (77.5)0.8474
Unemployed28 (26.17)41 (28.67) 10 (22.73)26 (41.94) 16 (22.22)18 (22.50)
Caregiving ExperienceNo79 (73.83)127 (88.81)0.003620 (46.51)59 (95.16)<0.000132 (44.44)65 (81.25)<0.0001
Yes28 (26.17)16 (11.19) 23 (53.49)3 (4.84) 40 (55.56)15 (18.75)
Caregiving KnowledgeNo76 (71.03)129 (90.21)0.000219 (44.19)56 (90.32)<0.000135 (48.61)56 (70.00)<0.0001
Yes31 (28.97)14 (9.79) 24 (55.81)6 (9.68) 37 (51.39)24 (30.00)
Length of Stay<14 D39 (36.45)41 (28.67)0.41429 (20.93)22 (35.48)0.181852 (72.22)52 (65.00)0.6253
14–23 D34 (31.78)49 (34.27) 16 (37.21)23 (37.10) 14 (19.44)19 (23.75)
>23 D34 (31.78)53 (37.06) 18 (41.86)17 (27.42) 6 (8.33)9 (11.25)
Caregiver SexFemale91 (85.05)111 (77.62)0.189435 (81.40)40 (64.52)0.096360 (83.33)66 (82.50)1
Male16 (14.95)32 (22.38) 8 (18.60)22 (35.48) 12 (16.67)14 (17.50)
Marital StatusMarried or Cohabiting102 (95.3)138 (96.50)0.885940 (93.02)62 (100.00)0.129972 (100.00)79 (98.75)1
Single5 (4.67)5 (3.50) 3 (6.98)0 (0.00) 0 (0.00)1 (1.25)
Insurance paymentCommercial Insurance7 (6.54)6 (4.20)0.1332 (4.65)5 (8.06)0.44690 (0.00)1 (1.25)0.3177
Rural Medical Care18 (16.82)36 (25.17) 6 (13.95)13 (20.97) 55 (76.39)56 (70.00)
Self-pay9 (8.41)20 (13.99) 8 (18.60)6 (9.68) 12 (16.67)11 (13.75)
Social Insurance73 (68.22)81 (56.64) 27 (62.79)38 (61.29) 5 (6.94)12 (15.00)
Relationship with NewbornFather25 (23.36)36 (25.17)0.70379 (20.93)16 (25.81)0.802121 (29.17)20 (25.00)0.5874
Mother76 (71.03)102 (71.33) 33 (76.74)44 (70.97) 50 (69.4457 (71.25)
Grandparent6 (5.61)5 (3.50) 1 (2.33)2 (3.23) 1 (1.39)3 (3.75)
Other CaregiversNo23 (21.50)79 (55.24)<0.000111 (25.58)41 (66.13)<0.000110 (13.89)42 (52.50)<0.0001
Yes84 (78.50)64 (44.76) 32 (74.42)21 (33.87) 62 (86.11)38 (47.50)

References

  1. WHO: Recommended definitions, terminology and format for statistical tables related to the perinatal period and use of a new certificate for cause of perinatal deaths. Modifications recommended by FIGO as amended October 14, 1976. Acta Obs. Gynecol Scand. 1977, 56, 247–253.
  2. Institute of Medicine Committee on Leading Health Indicators for Healthy People. Leading Health Indicators for Healthy People 2020: Letter Report; National Academies Press: Washington, DC, USA, 2011. [Google Scholar]
  3. Ohuma, E.O.; Moller, A.B.; Bradley, E.; Chakwera, S.; Hussain-Alkhateeb, L.; Lewin, A.; Okwaraji, Y.B.; Mahanani, W.R.; Johansson, E.W.; Lavin, T.; et al. National, regional, and global estimates of preterm birth in 2020, with trends from 2010: A systematic analysis. Lancet 2023, 402, 1261–1271. [Google Scholar] [CrossRef] [PubMed]
  4. Jing, S.; Chen, C.; Gan, Y.; Vogel, J.; Zhang, J. Incidence and trend of preterm birth in China, 1990–2016: A systematic review and meta-analysis. BMJ Open 2020, 10, e039303. [Google Scholar] [CrossRef] [PubMed]
  5. Deng, K.; Liang, J.; Mu, Y.; Liu, Z.; Wang, Y.; Li, M.; Li, X.; Dai, L.; Li, Q.; Chen, P.; et al. Preterm births in China between 2012 and 2018: An observational study of more than 9 million women. Lancet Glob. Health 2021, 9, e1226–e1241. [Google Scholar] [CrossRef]
  6. Mukhopadhyay, K.; Malhi, P.; Mahajan, R.; Narang, A. Neurodevelopmental and behavioral outcome of very low birth weight babies at corrected age of 2 years. Indian J. Pediatr. 2010, 77, 963–967. [Google Scholar] [CrossRef]
  7. Trønnes, H.; Wilcox, A.J.; Lie, R.T.; Markestad, T.; Moster, D. The association of preterm birth with severe asthma and atopic dermatitis: A national cohort study. Pediatr. Allergy Immunol. 2013, 24, 782–787. [Google Scholar] [CrossRef]
  8. Aarnoudse-Moens, C.S.; Weisglas-Kuperus, N.; van Goudoever, J.B.; Oosterlaan, J. Meta-analysis of neurobehavioral outcomes in very preterm and/or very low birth weight children. Pediatrics 2009, 124, 717–728. [Google Scholar] [CrossRef]
  9. Delobel-Ayoub, M.; Arnaud, C.; White-Koning, M.; Casper, C.; Pierrat, V.; Garel, M.; Burguet, A.; Roze, J.-C.; Matis, J.; Picaud, J.-C.; et al. Behavioral problems and cognitive performance at 5 years of age after very preterm birth: The EPIPAGE Study. Pediatrics 2009, 123, 1485–1492. [Google Scholar] [CrossRef]
  10. Hovi, P.; Andersson, S.; Eriksson, J.G.; Järvenpää, A.L.; Strang-Karlsson, S.; Mäkitie, O.; Kajantie, E. Glucose regulation in young adults with very low birth weight. N. Engl. J. Med. 2007, 356, 2053–2063. [Google Scholar] [CrossRef]
  11. Crilly, C.J.; Haneuse, S.; Litt, J.S. Predicting the outcomes of preterm neonates beyond the neonatal intensive care unit: What are we missing? Pediatr. Res. 2021, 89, 426–445. [Google Scholar] [CrossRef]
  12. Han, J.H.; Yoon, S.J.; Lim, J.H.; Shin, J.E.; Eun, H.S.; Park, M.S.; Park, K.I.; Lee, S.M. The impact of neonatal morbidities on child growth and developmental outcomes in very low birth weight infants: A nationwide cohort study. Eur. J. Pediatr. 2022, 181, 197–205. [Google Scholar] [CrossRef] [PubMed]
  13. Toro, Y.E.L.-D.; Vásquez-Garibay, E.M.; González-Ojeda, A.; Ramírez-Valdivia, J.M.; Troyo-Sanromán, R.; Carmona-Flores, G. A longitudinal evaluation of growth outcomes at hospital discharge of very-low-birth-weight preterm infants. Eur. J. Clin. Nutr. 2012, 66, 474–480. [Google Scholar] [CrossRef] [PubMed]
  14. Yitayew, M.; Chahin, N.; Rustom, S.; Thacker, L.R.; Hendricks-Muñoz, K.D. Fenton vs. Intergrowth-21st: Postnatal Growth Assessment and Prediction of Neurodevelopment in Preterm Infants. Nutrients 2021, 13, 2841. [Google Scholar] [CrossRef] [PubMed]
  15. Espinola-Sánchez, M.; Sanca-Valeriano, S.; Campaña-Acuña, A.; Caballero-Alvarado, J. Prediction of neonatal death in pregnant women in an intensive care unit: Application of machine learning models. Heliyon 2023, 9, e20693. [Google Scholar] [CrossRef]
  16. Bowe, A.K.; Lightbody, G.; Staines, A.; Murray, D.M.; Norman, M. Prediction of 2-Year Cognitive Outcomes in Very Preterm Infants Using Machine Learning Methods. JAMA Netw. Open 2023, 6, e2349111. [Google Scholar] [CrossRef]
  17. Han, J.H.; Yoon, S.J.; Lee, H.S.; Park, G.; Lim, J.; Shin, J.E.; Eun, H.S.; Park, M.S.; Lee, S.M. Application of Machine Learning Approaches to Predict Postnatal Growth Failure in Very Low Birth Weight Infants. Yonsei Med. J. 2022, 63, 640–647. [Google Scholar] [CrossRef]
  18. Bhutta, A.T.; Cleves, M.A.; Casey, P.H.; Cradock, M.M.; Anand, K.J. Cognitive and behavioral outcomes of school-aged children who were born preterm: A meta-analysis. JAMA 2002, 288, 728–737. [Google Scholar] [CrossRef]
  19. Chen, K.; Song, L.; Liu, B.; Wu, M.; Liu, Y.; Wang, L.; Bi, J.; Liu, Q.; Zhang, Y.; Tang, Z.; et al. Low length/weight growth trajectories of early-term infants during the first year: Evidence from a longitudinal study in China. BMJ Open 2022, 12, e051436. [Google Scholar] [CrossRef]
  20. Ben Salem, K.; Ben Abdelaziz, A. Principal Component Analysis (PCA). Tunis Med. 2021, 99, 383–389. [Google Scholar]
  21. van Dokkum, N.H.; Reijneveld, S.A.; Heymans, M.W.; Bos, A.F.; de Kroon, M.L.A. Development of a Prediction Model to Identify Children at Risk of Future Developmental Delay at Age 4 in a Population-Based Setting. Int. J. Environ. Res. Public Health 2020, 17, 8341. [Google Scholar] [CrossRef]
  22. de Melo, G.A.; Peixoto, M.G.M.; Mendonca, M.C.A.; Musetti, M.A.; Serrano, A.L.M.; Ferreira, L.O.G. Performance measurement of Brazilian federal university hospitals: An overview of the public health care services through principal component analysis. J. Health Organ. Manag. 2024, 38, 351–371. [Google Scholar] [CrossRef] [PubMed]
  23. Long, J.; Wang, N.; Zhai, J.; Liang, C.; Jiang, S.; Zhao, L. Data driven multi-objective economic-environmental robust optimization for refinery planning with multiple modes under uncertainty. Comput. Ind. Eng. 2024, 198, 110697. [Google Scholar] [CrossRef]
  24. Sun, Q.; Chen, Y.-L.; Yu, Z.-B.; Han, S.-P.; Dong, X.-Y.; Qiu, Y.-F.; Sha, L.; Guo, X.-R. Long-term consequences of the early treatment of children with congenital hypothyroidism detected by neonatal screening in Nanjing, China: A 12-year follow-up study. J. Trop. Pediatr. 2012, 58, 79–80. [Google Scholar] [CrossRef] [PubMed]
  25. Everitt, B.S.; Dunn, G. Multivariate Data and Multivariate Statistics. In Applied Multivariate Data Analysis; Wiley: Hoboken, NJ, USA, 2001; pp. 1–8. [Google Scholar]
  26. Chawanpaiboon, S.; Vogel, J.P.; Moller, A.B.; Lumbiganon, P.; Petzold, M.; Hogan, D.; Landoulsi, S.; Jampathong, N.; Kongwattanakul, K.; Laopaiboon, M.; et al. Global, regional, and national estimates of levels of preterm birth in 2014: A systematic review and modelling analysis. Lancet Glob. Health 2019, 7, e37–e46. [Google Scholar] [CrossRef]
  27. Papastefanou, I.; Nowacka, U.; Syngelaki, A.; Dragoi, V.; Karamanis, G.; Wright, D.; Nicolaides, K.H. Competing-risks model for prediction of small-for-gestational-age neonate from estimated fetal weight at 19–24 weeks’ gestation. Ultrasound Obstet. Gynecol. 2021, 57, 917–924. [Google Scholar] [CrossRef]
  28. Tesfie, T.K.; Anlay, D.Z.; Abie, B.; Chekol, Y.M.; Gelaw, N.B.; Tebeje, T.M.; Animut, Y. Nomogram to predict risk of neonatal mortality among preterm neonates admitted with sepsis at University of Gondar Comprehensive Specialized Hospital: Risk prediction model development and validation. BMC Pregnancy Childbirth 2024, 24, 139. [Google Scholar] [CrossRef]
  29. Liu, H.; Li, J.; Guo, J.; Shi, Y.; Wang, L. A prediction nomogram for neonatal acute respiratory distress syndrome in late-preterm infants and full-term infants: A retrospective study. EClinicalMedicine 2022, 50, 101523. [Google Scholar] [CrossRef]
  30. Cho, H.; Lee, E.H.; Lee, K.S.; Heo, J.S. Machine learning-based risk factor analysis of necrotizing enterocolitis in very low birth weight infants. Sci. Rep. 2022, 12, 21407. [Google Scholar] [CrossRef]
  31. Salem, N.; Hussein, S. Data dimensional reduction and principal components analysis. Procedia Comput. Sci. 2019, 163, 292–299. [Google Scholar] [CrossRef]
  32. Chakraborty, P.; Bandyopadhyay, A.; Sahu, P.P.; Burman, A.; Mallik, S.; Alsubaie, N.; Abbas, M.; Alqahtani, M.S.; Soufiene, B.O. Predicting stroke occurrences: A stacked machine learning approach with feature selection and data preprocessing. BMC Bioinform. 2024, 25, 329. [Google Scholar] [CrossRef]
  33. Muhamad, S.N.; How, V.; Lim, F.L.; Akim, A.M.; Karuppiah, K.; Shabri, N. Author Correction: Assessment of heat stress contributing factors in the indoor environment among vulnerable populations in Klang Valley using principal component analysis (PCA). Sci. Rep. 2024, 14, 24013. [Google Scholar] [CrossRef] [PubMed]
  34. Deliu, M.; Yavuz, T.S.; Sperrin, M.; Belgrave, D.; Sahiner, U.M.; Sackesen, C.; Kalayci, O.; Custovic, A. Features of asthma which provide meaningful insights for understanding the disease heterogeneity. Clin. Exp. Allergy 2018, 48, 39–47. [Google Scholar] [CrossRef] [PubMed]
  35. Zhang, X.; Wei, S.; Sun, Q.; Wadood, S.A.; Guo, B. Source identification and spatial distribution of arsenic and heavy metals in agricultural soil around Hunan industrial estate by positive matrix factorization model, principle components analysis and geo statistical analysis. Ecotoxicol. Envrron. Saf. 2018, 159, 354–362. [Google Scholar] [CrossRef]
  36. Martis, R.J.; Acharya, U.R.; Ray, A.K.; Chakraborty, C. Application of higher order cumulants to ECG signals for the cardiac health diagnosis. Annu. Int. Conf. IEEE Eng. Med. Biol. Soc. 2011, 2011, 1697–1700. [Google Scholar]
  37. Skranes, J. Executive function deficits in preterm subjects are a combination of social risk factors and brain maldevelopment. Acta. Paediatr. 2017, 106, 1380–1382. [Google Scholar] [CrossRef]
  38. Yoon, S.J.; Kim, D.; Park, S.H.; Han, J.H.; Lim, J.; Shin, J.E.; Eun, H.S.; Lee, S.M.; Park, M.S. Prediction of Postnatal Growth Failure in Very Low Birth Weight Infants Using a Machine Learning Model. Diagnostics 2023, 13, 3627. [Google Scholar] [CrossRef]
  39. Morgan, C.; Romeo, D.M.; Chorna, O.; Novak, I.; Galea, C.; Del Secco, S.; Guzzetta, A. The Pooled Diagnostic Accuracy of Neuroimaging, General Movements, and Neurological Examination for Diagnosing Cerebral Palsy Early in High-Risk Infants: A Case Control Study. J. Clin. Med. 2019, 8, 1879. [Google Scholar] [CrossRef]
  40. Novak, I.; Morgan, C.; Adde, L.; Blackman, J.; Boyd, R.N.; Brunstrom-Hernandez, J.; Cioni, G.; Damiano, D.; Darrah, J.; Eliasson, A.C.; et al. Early, Accurate Diagnosis and Early Intervention in Cerebral Palsy: Advances in Diagnosis and Treatment. JAMA Pediatr. 2017, 171, 897–907. [Google Scholar] [CrossRef]
Figure 1. Selection strategies for preterm infants were included in this study.
Children 12 00583 g001
Figure 2. Univariate analysis of factors influencing developmental delay in preterm infants at 3 (A), 6 (B), 9 (C), and 12 (D) months in the training cohort.
Children 12 00583 g002
Figure 3. Univariate analysis of factors influencing developmental delay in preterm infants at 3 (A), 6 (B), 9 (C), and 12 (D) months in the internal validation cohort.
Children 12 00583 g003
Figure 4. Univariate analysis of factors influencing developmental delay in preterm infants at 3 (A), 6 (B), 9 (C), and 12 (D) months in the external validation cohort.
Children 12 00583 g004
Figure 5. Nomogram for predicting developmental delay in preterm infants at 3 (A), 6 (B), 9 (C), and 12 (D) months.
Children 12 00583 g005
Figure 6. ROC curves for predicting developmental delay in preterm infants at 3, 6, 9, and 12 months. (A) training cohort, (B) internal validation cohort, and (C) external validation cohort.
Children 12 00583 g006
Figure 7. Calibration curves of the nomogram for predicting developmental delay in preterm infants at 3, 6, 9, and 12 months. (A) training cohort, (B) internal validation cohort, and (C) external validation cohort.
Children 12 00583 g007
Figure 8. Decision curves for predicting developmental delay in preterm infants at 3, 6, 9, and 12 months. (A) training cohort, (B) internal validation cohort, and (C) external validation cohort.
Children 12 00583 g008
Disclaimer/Publisher’s Note: The statements, opinions and data contained in all publications are solely those of the individual author(s) and contributor(s) and not of MDPI and/or the editor(s). MDPI and/or the editor(s) disclaim responsibility for any injury to people or property resulting from any ideas, methods, instructions or products referred to in the content.

