
Association of the rs17782313, rs17773430 and rs34114122 Polymorphisms of/near MC4R Gene with Obesity-Related Biomarkers in a Spanish Pediatric Cohort

 , , ,
, , ,  and
and (This article belongs to the Section Pediatric Endocrinology & Diabetes)
Abstract
1. Introduction
2. Materials and Methods
2.1. Subjects
2.2. Genetic Variables
2.3. Clinical Data
2.4. Laboratory Determinations
2.5. Statistical Analysis
3. Results
3.1. Polymorphic Analysis
3.1.1. Anthropometric Parameters
3.1.2. Biochemical Parameters
3.2. Haplotype Analysis
4. Discussion
5. Conclusions
Author Contributions
Funding
Institutional Review Board Statement
Informed Consent Statement
Data Availability Statement
Conflicts of Interest
References
- Gutiérrez-Cuevas, J.; Santos, A.; Armendariz-Borunda, J. Pathophysiological Molecular Mechanisms of Obesity: A Link between MAFLD and NASH with Cardiovascular Diseases. Int. J. Mol. Sci. 2021, 22, 11629. [Google Scholar] [CrossRef] [PubMed]
- Gutiérrez-Cuevas, J.; Sandoval-Rodriguez, A.; Meza-Rios, A.; Monroy-Ramírez, H.C.; Galicia-Moreno, M.; García-Bañuelos, J.; Santos, A.; Armendariz-Borunda, J. Molecular Mechanisms of Obesity-Linked Cardiac Dysfunction: An Up-Date on Current Knowledge. Cells 2021, 10, 629. [Google Scholar] [CrossRef]
- Gutiérrez-Cuevas, J.; Lucano-Landeros, S.; López-Cifuentes, D.; Santos, A.; Armendariz-Borunda, J. Epidemiologic, Genetic, Pathogenic, Metabolic, Epigenetic Aspects Involved in NASH-HCC: Current Therapeutic Strategies. Cancers 2022, 15, 23. [Google Scholar] [CrossRef]
- Blundell, J.E.; Baker, J.L.; Boyland, E.; Blaak, E.; Charzewska, J.; de Henauw, S.; Frühbeck, G.; Gonzalez-Gross, M.; Hebe-Brand, J.; Holm, L.; et al. Variations in the Prevalence of Obesity Among European Countries, and a Consideration of Possible Causes. Obes. Facts 2017, 10, 25–37. [Google Scholar] [CrossRef]
- Gombert, M.; Carrasco-Luna, J.; Pin-Arboledas, G.; Codoñer-Franch, P. Circadian Rhythm Variations and Nutrition in Children. J. Child Sci. 2018, 8, 60–66. [Google Scholar] [CrossRef]
- Garaulet, M.; Ortega, F.B.; Ruiz, J.R.; Rey-López, J.P.; Béghin, L.; Manios, Y.; Cuenca-García, M.; Plada, M.; Diethelm, K.; Kafatos, A.; et al. Short sleep duration is associated with increased obesity markers in European adolescents: Effect of physical activity and dietary habits. The HELENA study. Int. J. Obes. 2011, 35, 1308–1317. [Google Scholar] [CrossRef] [PubMed]
- Navarro-Solera, M.; Carrasco-Luna, J.; Pin-Arboledas, G.; González-Carrascosa, R.; Soriano, J.M.; Codoñer-Franch, P. Short Sleep Duration Is Related to Emerging Cardiovascular Risk Factors in Obese Children. J. Pediatr. Gastroenterol. Nutr. 2015, 61, 571–576. [Google Scholar] [CrossRef] [PubMed]
- Reddon, H.; Guéant, J.L.; Meyre, D. The importance of gene–environment interactions in human obesity. Clin. Sci. 2016, 130, 1571–1597. [Google Scholar] [CrossRef]
- Yazdi, F.T.; Clee, S.M.; Meyre, D. Obesity genetics in mouse and human: Back and forth, and back again. PeerJ 2015, 3, e856. [Google Scholar] [CrossRef]
- van der Klaauw, A.A.; Farooqi, I.S. The Hunger Genes: Pathways to Obesity. Cell 2015, 161, 119–132. [Google Scholar] [CrossRef]
- Adamska-Patruno, E.; Bauer, W.; Bielska, D.; Fiedorczuk, J.; Moroz, M.; Krasowska, U.; Czajkowski, P.; Wielogorska, M.; Maliszewska, K.; Puckowska, S.; et al. An Association between Diet and MC4R Genetic Polymorphism, in Relation to Obesity and Metabolic Parameters—A Cross Sectional Population-Based Study. Int. J. Mol. Sci. 2021, 22, 12044. [Google Scholar] [CrossRef] [PubMed]
- Yilmaz, Z.; Davis, C.; Loxton, N.J.; Kaplan, A.S.; Levitan, R.D.; Carter, J.C.; Kennedy, J.L. Association between MC4R rs17782313 polymorphism and overeating behaviors. Int. J. Obes. 2015, 39, 114–120. [Google Scholar] [CrossRef]
- López-Rodríguez, G.; Estrada-Neria, A.; Suárez-Diéguez, T.; Tejero, M.E.; Fernández, J.C.; Galván, M. Common polymorphisms in MC4R and FTO genes are associated with BMI and metabolic indicators in Mexican children: Differences by sex and genetic ancestry. Gene 2020, 754, 144840. [Google Scholar] [CrossRef]
- Hammad, M.M.; Abu-Farha, M.; Hebbar, P.; Cherian, P.; Al Khairi, I.; Melhem, M.; Alkayal, F.; Alsmadi, O.; Thanaraj, T.A.; Al-Mulla, F.; et al. MC4R Variant rs17782313 Associates with Increased Levels of DNAJC27, Ghrelin, and Visfatin and Correlates with Obesity and Hypertension in a Kuwaiti Cohort. Front. Endocrinol. 2020, 11, 437. [Google Scholar] [CrossRef]
- Yu, K.; Li, L.; Zhang, L.; Guo, L.; Wang, C. Association between MC4R rs17782313 genotype and obesity: A meta-analysis. Gene 2020, 733, 144372. [Google Scholar] [CrossRef]
- Sull, J.W.; Kim, G.; Jee, S.H. Association of MC4R (rs17782313) with diabetes and cardiovascular disease in Korean men and women. BMC Med. Genet. 2020, 21, 160. [Google Scholar] [CrossRef] [PubMed]
- Xi, B.; Takeuchi, F.; Chandak, G.R.; Kato, N.; Pan, H.W.; AGEN-T2D Consortium; Zhou, D.H.; Pan, H.Y.; Mi, J. Common polymorphism near the MC4R gene is associated with type 2 diabetes: Data from a meta-analysis of 123,373 individuals. Diabetologia 2012, 55, 2660–2666. [Google Scholar] [CrossRef]
- Szkup, M.; Owczarek, A.J.; Schneider-Matyka, D.; Brodowski, J.; Łój, B.; Grochans, E. Associations between the components of metabolic syndrome and the polymorphisms in the peroxisome proliferator-activated receptor gamma (PPAR-γ), the fat mass and obesity-associated (FTO), and the melanocortin-4 receptor (MC4R) genes. Aging 2018, 10, 72–82. [Google Scholar] [CrossRef] [PubMed]
- Goit, R.K.; Taylor, A.W.; Lo, A.C.Y. The central melanocortin system as a treatment target for obesity and diabetes: A brief overview. Eur. J. Pharmacol. 2022, 924, 174956. [Google Scholar] [CrossRef] [PubMed]
- Fernandes, A.E.; de Melo, M.E.; Fujiwara, C.T.; Pioltine, M.B.; Matioli, S.R.; Santos, A.; Cercato, C.; Halpern, A.; Mancini, M.C. Associations between a common variant near the MC4R gene and serum triglyceride levels in an obese pediatric cohort. Endocrine 2015, 49, 653–858. [Google Scholar] [CrossRef]
- Kring, S.I.; Holst, C.; Toubro, S.; Astrup, A.; Hansen, T.; Pedersen, O.; Sørensen, T.I. Common variants near MC4R in relation to body fat, body fat distribution, metabolic traits and energy expenditure. Int. J. Obes. 2010, 34, 182–189. [Google Scholar] [CrossRef]
- Graham, C.A.M.; Pedlar, C.R.; Hearne, G.; Lorente-Cebrián, S.; González-Muniesa, P.; Mavrommatis, Y. The Association of Parental Genetic, Lifestyle, and Social Determinants of Health with Offspring Overweight. Lifestyle Genom. 2020, 13, 99–106. [Google Scholar] [CrossRef]
- Yılmaz, B.; Gezmen Karadağ, M. The current review of adolescent obesity: The role of genetic factors. J. Pediatr. Endocrinol. Metab. 2020, 34, 151–162. [Google Scholar] [CrossRef]
- Grant, S.F.; Bradfield, J.P.; Zhang, H.; Wang, K.; Kim, C.E.; Annaiah, K.; Santa, E.; Glessner, J.T.; Thomas, K.; Garris, M.; et al. Investigation of the locus near MC4R with childhood obesity in Americans of European and African ancestry. Obesity 2009, 17, 1461–1465. [Google Scholar] [CrossRef] [PubMed]
- Pledger, S.L. Gene-Environment Interactions and the Effect on Obesity Risk in LMICs: A Systematic Review. Master’s Thesis, University of Utrecht, Utrecht, The Netherlands, 2023. [Google Scholar]
- Melka, M.G.; Bernard, M.; Mahboubi, A.; Abrahamowicz, M.; Paterson, A.D.; Syme, C.; Lourdusamy, A.; Schumann, G.; Leonard, G.T.; Perron, M.; et al. Genome-wide scan for loci of adolescent obesity and their relationship with blood pressure. J. Clin. Endocrinol. Metab. 2012, 97, 145–150. [Google Scholar] [CrossRef]
- Javanrouh, N.; Khalaj, A.; Guity, K.; Sedaghati-Khayat, B.; Valizadeh, M.; Barzin, M.; Daneshpour, M.S. Presence of CC Gen-otype for rs17773430 Could Affect the Percentage of Excess Weight Loss 1 Year After Bariatric Surgery: Tehran Obesity Treatment Study (TOTS). Obes. Surg. 2020, 30, 537–544. [Google Scholar] [CrossRef]
- Alizadeh, S.; Pooyan, S.; Mirzababaei, A.; Arghavani, H.; Hasani, H.; Mirzaei, K. Interaction of MC4R rs17782313 variants and dietary carbohydrate quantity and quality on basal metabolic rate and general and central obesity in overweight/obese women: A cross-sectional study. BMC Endocr. Disord. 2022, 22, 121. [Google Scholar] [CrossRef] [PubMed]
- Cole, S.A.; Butte, N.F.; Voruganti, V.S.; Cai, G.; Haack, K.; Kent, J.W., Jr.; Blangero, J.; Comuzzie, A.G.; McPherson, J.D.; Gibbs, R.A. Evidence that multiple genetic variants of MC4R play a functional role in the regulation of energy expenditure and appetite in Hispanic children. Am. J. Clin. Nutr. 2010, 91, 191–199. [Google Scholar] [CrossRef] [PubMed]
- Raskiliene, A.; Smalinskiene, A.; Kriaucioniene, V.; Lesauskaite, V.; Petkeviciene, J. Associations of MC4R, LEP, and LEPR Polymorphisms with Obesity-Related Parameters in Childhood and Adulthood. Genes 2021, 12, 949. [Google Scholar] [CrossRef]
- Scherag, A.; Jarick, I.; Grothe, J.; Biebermann, H.; Scherag, S.; Volckmar, A.L.; Vogel, C.I.; Greene, B.; Hebebrand, J.; Hinney, A. Investigation of a genome wide association signal for obesity: Synthetic association and haplotype analyses at the melanocortin 4 receptor gene locus. PLoS ONE 2010, 5, 13967. [Google Scholar] [CrossRef]
- Lv, D.; Zhang, D.D.; Wang, H.; Zhang, Y.; Liang, L.; Fu, J.F.; Xiong, F.; Liu, G.L.; Gong, C.X.; Luo, F.H.; et al. Genetic variations in SEC16B, MC4R, MAP2K5 and KCTD15 were associated with childhood obesity and inter-acted with dietary behaviors in Chinese school-age population. Gene 2015, 560, 149–155. [Google Scholar] [CrossRef]
- Cooke, A.L.; Morris, J.; Melchior, J.T.; Street, S.E.; Jerome, W.G.; Huang, R.; Herr, A.B.; Smith, L.E.; Segrest, J.P.; Remaley, A.T.; et al. A thumbwheel mechanism for APOA1 activation of LCAT activity in HDL. J. Lipid Res. 2018, 59, 1244–1255. [Google Scholar] [CrossRef]
- Yang, T.; Pei, D. Association of cystatin C levels with metabolic syndrome incidence: A nested case-control study with pro-pensity score matching. J. Int. Med. Res. 2021, 49, 300060520986311. [Google Scholar] [CrossRef]
- Samodien, E.; Pheiffer, C.; Erasmus, M.; Mabasa, L.; Louw, J.; Johnson, R. Diet-induced DNA methylation within the hypothalamic arcuate nucleus and dysregulated leptin and insulin signaling in the pathophysiology of obesity. Food Sci. Nutr. 2019, 7, 3131–3145. [Google Scholar] [CrossRef]
- Weihrauch-Blüher, S.; Wiegand, S.; Weihe, P.; Prinz, N.; Weghuber, D.; Leipold, G.; Dannemann, A.; Bergjohann, L.; Reinehr, T.; Holl, R.W.; et al. Uric acid and gamma-glutamyl-transferase in children and adolescents with obesity: Association to anthropometric measures and cardiometabolic risk markers depending on pubertal stage, sex, degree of weight loss and type of patient care: Evaluation of the adiposity patient follow-up registry. Pediatr. Obes. 2023, 18, e12989. [Google Scholar] [CrossRef]
- Dastgheib, S.A.; Bahrami, R.; Setayesh, S.; Salari, S.; Mirjalili, S.R.; Noorishadkam, M.; Sadeghizadeh-Yazdi, J.; Akbarian, E.; Neamatzadeh, H. Evidence from a meta-analysis for association of MC4R rs17782313 and FTO rs9939609 polymorphisms with susceptibility to obesity in children. Diabetes Metab. Syndr. 2021, 15, 102234. [Google Scholar] [CrossRef]
- Wei, B.L.; Yin, R.X.; Liu, C.X.; Deng, G.X.; Guan, Y.Z.; Zheng, P.F. The MC4R SNPs, their haplotypes and gene-environment interactions on the risk of obesity. Mol. Med. 2020, 26, 77. [Google Scholar] [CrossRef]
- Yarizadeh, H.; Mirzababaei, A.; Ghodoosi, N.; Pooyan, S.; Djafarian, K.; Clark, C.C.; Mirzaei, K. The interaction between the dietary inflammatory index and MC4R gene variants on cardiovascular risk factors. Clin. Nutr. 2021, 40, 488–495. [Google Scholar] [CrossRef]
- Loid, P.; Mustila, T.; Mäkitie, R.E.; Viljakainen, H.; Kämpe, A.; Tossavainen, P.; Lipsanen-Nyman, M.; Pekkinen, M.; Mäkitie, O. Rare Variants in Genes Linked to Appetite Control and Hypothalamic Development in Early-Onset Severe Obesity. Front. Endocrinol. 2020, 11, 81. [Google Scholar] [CrossRef]
- Magno, F.C.C.M.; Guaraná, H.C.; da Fonseca, A.C.P.; Pedrosa, A.P.; Zembrzuski, V.M.; Cabello, P.H.; Cabello, G.M.K.; Carneiro, J.R.I.; Rosado, E.L. Association of the MC4R rs17782313 polymorphism with plasma ghrelin, leptin, IL6 and TNFα concentrations, food intake and eating behaviors in morbidly obese women. Eat. Weight Disord. 2021, 4, 1079–1087. [Google Scholar] [CrossRef]
- Frithioff-Bøjsøe, C.; Lund, M.A.V.; Lausten-Thomsen, U.; Hedley, P.L.; Pedersen, O.; Christiansen, M.; Baker, J.L.; Hanse, T.; Holm, J.C. Leptin, adiponectin, and their ratio as markers of insulin resistance and cardiometabolic risk in childhood obesity. Pediatr. Diabetes 2020, 21, 194–202. [Google Scholar] [CrossRef]


| Anthropometric and Clinical Parameters | Biochemical Parameters | ||
|---|---|---|---|
| Male/Female (%) | 53/47 | Glucose (mg/dL) | 93 ± 7 |
| Age (years) | 11.5 ± 2.8 | Insulin (µIU/mL) | 14.8 ± 8.5 |
| Tanner scale of puberty | 2.7 ± 1.2 | Homeostatic model assessment | 3.6 ± 2.1 |
| Body mass index (kg/m2) | 28.6 ± 4.2 | HDL colesterol (mg/dL) | 45 ± 9 |
| Body mass index z-score | 3.9 ± 1.6 | Triglicéridos (mg/dL) | 91 ± 44 |
| Fat mass (%) | 35.1 ± 7.0 | Apolipoprotein A1 (mg/dL) | 131 ± 27 |
| Fat mass index (kg/m2) | 9.6 ± 3.9 | Cystatin C (mg/L) | 0.79 ± 0.46 |
| Waist circumference (cm) | 95.8 ± 16.6 | GGT (U/L) | 16.8 ± 7.5 |
| Waist circumference z-score | 3.1 ± 2.2 | Leptin (ng/mL) | 49.3 ± 23.2 |
| Systolic blood pressure (mm Hg) | 117 ± 13 | Interleukin 6 (pg/mL) | 1.9 ± 1.8 |
| Systolic blood pressure z-score | 0.62 ± 0.49 | TNF-α (mg/mL) | 3.5 ± 1.5 |
| Diastolic blood pressure (mm Hg) | 68 ± 10 | hs-CRP | 3.7 ± 6.3 |
| Diastolic blood pressure z-score | 0.25 ± 0.44 | ||
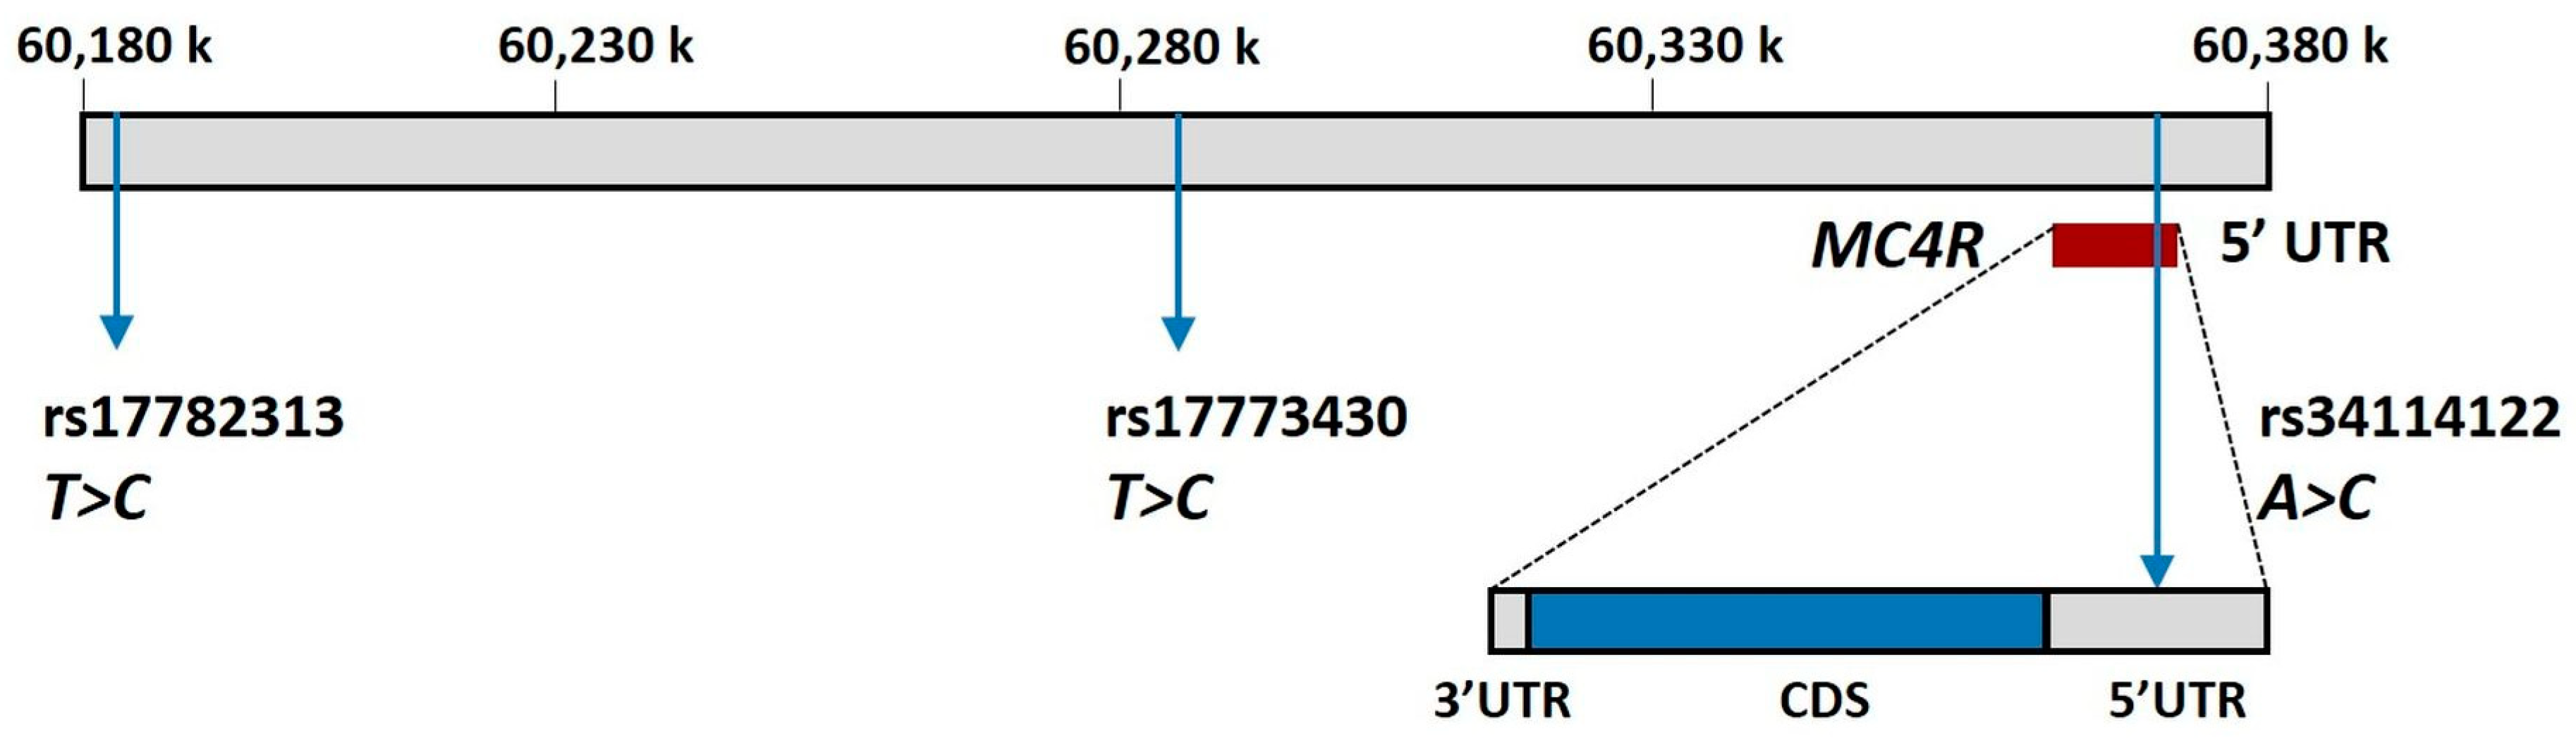
| SNPdb | Chromosome Position | Location | Major Allele | Minor Allele | MAF | p-HWE | eQTL |
|---|---|---|---|---|---|---|---|
| rs17782313 | Chr.18: 60183864 | Intergenic | T | C | 0.7 | 0.076 | MC4R |
| rs17773430 | Chr.18: 60295884 | Intragenic * | T | C | 0.72 | 0.85 | RP11-396N11.1 RP11-866E20.3 |
| rs34114122 | Chr.18: 60372527 | 5′-UTR | A | C | 0.93 | 0.56 | -- |
| rs17782313–rs17773430 | rs17782313–rs34114122 | rs34114122–rs17773430 | |
|---|---|---|---|
| D | 0.0528 | 0.0335 | 0.0050 |
| D′ | 0.5963 | 0.2689 | 0.0989 |
| rs17782313 (T>C) n = 178 | rs17773430 (T>C) n = 178 | rs34114122 (A>C) n = 178 | ||||||||||
|---|---|---|---|---|---|---|---|---|---|---|---|---|
| IM | GT | Mean Dfference * (95% CI) | p | IM | GT | Mean Difference * (95% CI) | p | IM | GT | Mean Difference * (95% CI) | p | |
| BMI z-score | AD | C/C | 0.58 (0.08 to 1.07) | 0.025 | AD | C/C | 0.56 (0.08 to 1.03) | 0.023 | AD | C/C | 1.00 (0.21 to 1.79) | 0.014 |
| FMI (kg/m2) | AD | C/C | 1.11 (0.05 to 2.16) | 0.041 | DO | C/C | 1.53 (0.25 to 2.81) | 0.020 | DO | T/CC/C | 1.95 (0.06 to 3.84) | 0.044 |
| rs17782313 (T>C) n = 178 | rs17773430 (T>C) n = 178 | rs34114122 (A>C) n = 178 | ||||||||||
|---|---|---|---|---|---|---|---|---|---|---|---|---|
| IM | GT | Mean Difference * (95% CI) | p | IM | GT | Mean Difference * (95% CI) | p | IM | GT | Mean Difference * (95% CI) | p | |
| SBP z-score | RE | C/C | 0.49 (0.02 to 0.97) | 0.044 | RE | C/C | 0.49 (0.02 to 0.97) | 0.044 | SD | A/C | 0.15 (−0.22 to 0.52) | 0.42 |
| Glucose (mg/dL) | RE | C/C | 6.36 (2.22 to 10.50) | 0.003 | SD | T/C | 0.46 (−1.64 to 2.56) | 0.67 | SD | A/C | 1.17 (−2.00 to 4.33) | 0.47 |
| Insulin (µIU/mL) | AD | C/C | 2.53 (0.66 to 4.41) | 0.009 | DO | T/C C/C | 2.64 (0.33 to 4.94) | 0.026 | AD | C/C | 2.64 (−0.37 to 5.66) | 0.087 |
| HOMA | AD | C/C | 0.68 (0.23 to 1.14) | 0.004 | DO | T/C C/C | 0.61 (−0.03 to 0.59) | 0.035 | AD | C/C | 0.65 (−0.08 to 1.39) | 0.084 |
| HDL-C (mg/dL) | AD | C/C | −1.67 (−4.19 to 0.84) | 0.19 | AD | C/C | 0.09 (−2.32 to 2.51) | 0.94 | SD | A/C | −5.11 (−9.76 to −0.46) | 0.033 |
| TG (mg/dL) | RE | C/C | 14.1 (−9.2 to 37.4) | 0.24 | DO | T/C C/C | 7.6 (−3.8 to 19.0) | 0.20 | SD | A/C | 18.2 (1.0 to 35.5) | 0.040 |
| ApoA1 (mg/dL) | RE | C/C | −21.8 (−36.4 to −7.2) | 0.004 | AD | C/C | −1.7 (−7.4 to 4.0) | 0.56 | SD | A/C | −5.9 (−17.0 to 5.3) | 0.30 |
| Cys-C (mg/L) | RE | C/C | 0.36 (0.16 to 0.57) | 0.000 | DO | T/C C/C | −0.05 (−0.16 to 0.06) | 0.35 | AD | C/C | −0.07 (−0.20 to 0.07) | 0.34 |
| GGT (U/L) | RE | C/C | 0.35 (−3.51 to 4.21) | 0.86 | RE | C/C | −1.91 (−5.36 to 1.54) | 0.28 | RE | C/C | 3.97 (1.15 to 6.79) | 0.006 |
| Leptin (ng/mL) | RE | C/C | 27.8 (10.7 to 45.0) | 0.002 | SD | T/C | 6.4 (−2.6 to 15.4) | 0.16 | DO | A/CC/C | 11.32 (−1.03 to 23.67) | 0.074 |
| IL 6 (pg/mL) | RE | C/C | 0.54 (−0.29 to 1.37) | 0.20 | RE | C/C | 0.81 (0.05 to 1.57) | 0.038 | AD | C/C | −0.26 (−0.78 to 0.25) | 0.32 |
| TNF-α (mg/mL) | RE | C/C | 0.48 (−0.40 to 1.36) | 0.29 | AD | C/C | 0.03 (−0.32 to 0.37) | 0.89 | SD | A/C | 0.72 (0.08 to 1.35) | 0.029 |
| hs-CRP (mg/L) | SD | T/C | 1.00 (−2.67 to 0.67) | 0.24 | DO | T/C C/C | 1.47 (−0.22 to 3.16) | 0.09 | RE | C/C | 4.90 (−3.02 to 12.81) | 0.23 |
| 17782313 (T>C) | 17773430 (T>C) | 34224122 (A>C) | F | Difference (95% CI) | p | |
|---|---|---|---|---|---|---|
| BMI z-score | T | T | A | 0.5433 | NA | - |
| T | C | A | 0.1375 | 0.04 (−0.65 to 0.73) | 0.91 | |
| C | T | A | 0.1359 | −0.02 (−0.74 to 0.7) | 0.96 | |
| C | C | A | 0.1130 | 0.84 (0.11 to 1.57) | 0.024 | |
| C | T | C | 0.0283 | 0.67 (−0.94 to 2.28) | 0.42 | |
| C | C | C | 0.0261 | 2.55 (0.96 to 4.14) | 0.002 | |
| T | T | C | 0.0158 | −0.35 (−2.53 to 1.83) | 0.75 | |
| FMI (kg/m2) | T | T | A | 0.5421 | NA | |
| T | C | A | 0.1386 | −0.03 (−1.49 to 1.43) | 0.97 | |
| C | T | A | 0.1358 | −0.21 (−1.73 to 1.3) | 0.78 | |
| C | C | A | 0.1133 | 1.81 (0.28 to 3.34) | 0.021 | |
| C | T | C | 0.0293 | 0.86 (−2.27 to 4) | 0.59 | |
| C | C | C | 0.0249 | 5.21 (1.55 to 8.86) | 0.006 | |
| T | T | C | 0.0160 | −1.22 (−5.59 to 3.14) | 0.58 | |
| Insulin (µIU/mL) | T | T | A | 0.5396 | NA | |
| T | T | C | 0.1381 | −0.17 (−2.8 to 2.45) | 0.90 | |
| T | C | A | 0.1305 | 0.76 (−2.03 to 3.55) | 0.59 | |
| T | C | C | 0.1215 | 3.28 (0.68 to 5.89) | 0.014 | |
| C | C | A | 0.0408 | 0.3 (−4.01 to 4.61) | 0.89 | |
| C | T | T | 0.0119 | −2.48 (−10.26 to 5.31) | 0.53 | |
| C | C | C | 0.0105 | 21.9 (13.2 to 30.6) | 0.000 |
Disclaimer/Publisher’s Note: The statements, opinions and data contained in all publications are solely those of the individual author(s) and contributor(s) and not of MDPI and/or the editor(s). MDPI and/or the editor(s) disclaim responsibility for any injury to people or property resulting from any ideas, methods, instructions or products referred to in the content. |
© 2023 by the authors. Licensee MDPI, Basel, Switzerland. This article is an open access article distributed under the terms and conditions of the Creative Commons Attribution (CC BY) license (https://creativecommons.org/licenses/by/4.0/).
Share and Cite
Carrasco-Luna, J.; Navarro-Solera, M.; Gombert, M.; Martín-Carbonell, V.; Carrasco-García, Á.; Del Castillo-Villaescusa, C.; García-Pérez, M.Á.; Codoñer-Franch, P. Association of the rs17782313, rs17773430 and rs34114122 Polymorphisms of/near MC4R Gene with Obesity-Related Biomarkers in a Spanish Pediatric Cohort. Children 2023, 10, 1221. https://doi.org/10.3390/children10071221
Carrasco-Luna J, Navarro-Solera M, Gombert M, Martín-Carbonell V, Carrasco-García Á, Del Castillo-Villaescusa C, García-Pérez MÁ, Codoñer-Franch P. Association of the rs17782313, rs17773430 and rs34114122 Polymorphisms of/near MC4R Gene with Obesity-Related Biomarkers in a Spanish Pediatric Cohort. Children. 2023; 10(7):1221. https://doi.org/10.3390/children10071221
Chicago/Turabian StyleCarrasco-Luna, Joaquín, María Navarro-Solera, Marie Gombert, Vanessa Martín-Carbonell, Álvaro Carrasco-García, Cristina Del Castillo-Villaescusa, Miguel Ángel García-Pérez, and Pilar Codoñer-Franch. 2023. "Association of the rs17782313, rs17773430 and rs34114122 Polymorphisms of/near MC4R Gene with Obesity-Related Biomarkers in a Spanish Pediatric Cohort" Children 10, no. 7: 1221. https://doi.org/10.3390/children10071221
APA StyleCarrasco-Luna, J., Navarro-Solera, M., Gombert, M., Martín-Carbonell, V., Carrasco-García, Á., Del Castillo-Villaescusa, C., García-Pérez, M. Á., & Codoñer-Franch, P. (2023). Association of the rs17782313, rs17773430 and rs34114122 Polymorphisms of/near MC4R Gene with Obesity-Related Biomarkers in a Spanish Pediatric Cohort. Children, 10(7), 1221. https://doi.org/10.3390/children10071221