Article

The Neutrophil-to-Lymphocyte Ratio (NLR) Can Predict Sepsis’s Presence and Severity in Malnourished Infants—A Single Center Experience

by
Alina Emilia Domnicu
1,2,
Eugen Radu Boia
3,4,*,
Mirela Mogoi
5,
Aniko-Maria Manea
6,7,
Tamara Marcela Marcovici
2,8,
Otilia Mărginean
8,9,10 and
Marioara Boia
6,7
1
Ph.D. School Department, ‘Victor Babeş’ University of Medicine and Pharmacy of Timisoara, 300041 Timisoara, Romania
2
Clinical Section I Pediatrics—Nutritional Recovery, Children’s Emergency Hospital ‘Louis Turcanu’, 300011 Timisoara, Romania
3
Department IX Surgery I, Discipline ENT, ‘Victor Babeş’ University of Medicine and Pharmacy of Timisoara, 300041 Timisoara, Romania
4
ENT Department, ‘Victor Babeş’ University of Medicine and Pharmacy of Timisoara, 300041 Timisoara, Romania
5
Pediatric Department, ‘Victor Babeş’ University of Medicine and Pharmacy of Timisoara, 300041 Timisoara, Romania
6
Neonatology and Puericulture Department, ‘Victor Babeş’ University of Medicine and Pharmacy of Timisoara, 300041 Timisoara, Romania
7
Neonatology and Preterm Department, Children’s Emergency Hospital ‘Louis Turcanu’, 300011 Timisoara, Romania
8
Department XI Pediatrics, Discipline I Pediatrics, ‘Victor Babeş’ University of Medicine and Pharmacy of Timisoara, 300041 Timisoara, Romania
9
Department of Pediatrics I, Children’s Emergency Hospital ‘Louis Turcanu’, 300011 Timisoara, Romania
10
Department XI Pediatrics, Discipline I Pediatrics, Disturbances of Growth and Development in Children—BELIVE, 300011 Timisoara, Romania
*
Author to whom correspondence should be addressed.
Children 2023, 10(10), 1616; https://doi.org/10.3390/children10101616
Submission received: 5 September 2023 / Revised: 27 September 2023 / Accepted: 27 September 2023 / Published: 28 September 2023
(This article belongs to the Special Issue Recent Advances in Obstetrics and Perinatal Medicine)

Abstract

:
Sepsis represents one of the leading causes of death in newborns and infants, and prompt diagnosis is essential for achieving favorable outcomes. Regarding malnourished children with concurrent infection, most studies have focused, besides blood culture, on C-reactive protein and procalcitonin. Because malnutrition has a deleterious effect on cellular immune competence, the present study characterized the acute-phase response, including hematological indices, in response to sepsis. Among the examined laboratory biomarkers, procalcitonin and neutrophil-to-lymphocyte ratio were the most accurate discriminators between sepsis patients and those with bacterial infection. Moreover, these two parameters showed a gradual increase between sepsis, severe sepsis, and septic shock patients (p < 0.001). Subgroup analysis of the sepsis group revealed positive correlations of NLR with prolonged ICU stay (<0.001), acute organ dysfunction (0.038), mechanical ventilation (<0.001), and fatality (<0.001). In summary, our results suggest that the neutrophil-to-lymphocyte ratio can be used as an auxiliary diagnostic index in discriminating the presence and severity of bacterial sepsis in malnourished infants.

Graphical Abstract

1. Introduction

Despite ongoing improvements in intensive care technology and diagnostic possibilities, sepsis remains one of the most common causes of death in newborns and infants [1,2,3,4]. Early and accurate sepsis recognition is essential for favorable outcomes [5]. However, this represents a challenge, especially in infants with illness-related malnutrition, due to overlapping clinical manifestations of sepsis and preexisting chronic disease, and also a nonspecific clinical picture [6].
The World Health Organization (WHO) guidelines for the initial assessment and management of pediatric malnutrition include the diagnosis of a possible sepsis [7]. However, clinical evaluation is poorly predictive of sepsis in these patients, and microbiology services are sometimes unavailable, so other readily measurable and less costly laboratory biomarkers are needed. Although the association between pediatric malnutrition and infection has been studied for over half a century, there are still critical gaps in understanding the exact mechanisms [8].
The increased risk for developing a systemic bacterial infection in malnourished children arises from the presence of multiple factors such as prematurity, extrauterine growth restriction (EUGR), innate and adaptative immune functions compromised mainly by the protein and vitamin deficiencies, the microbial translocation across a defective gastrointestinal and respiratory mucosal barrier, and much more [9].
The acute-phase reaction in response to the stress of infection, accompanied by elevated laboratory biomarkers, such as procalcitonin (PCT), C-reactive protein (CRP), and also complete blood count (CBC)-derived indices, such as neutrophil-to-lymphocyte ratio (NLR), has been thoroughly studied over the years [10,11,12,13,14,15,16]. Other proinflammatory cytokines (TNF, IL-1, and IL-6) were also studied. Some papers reported low TNF, IL-1, and IL-6 levels in severely malnourished children consistent with the reduced febrile response in these children [17,18]. However, research regarding the acute phase response in malnourished infants with sepsis has focused mainly on PCT and CRP [17,18,19,20,21,22,23].
The data about the neutrophil function in pediatric malnutrition are scarce. It is suggested that these patients have impaired chemotaxis and lysosomal synthesis and reduced glycolytic activity, but the number is not affected [8,24,25,26,27]. The natural killer cells also have reduced activity, but the effect is reversible after the nutritional recovery [24,25,26,27]. Some descriptive studies observed defects in the adaptative immune function of these children, but for the moment, the data are incomplete and based on the vaccine response [8,24,27].
The present study aimed to characterize the response to sepsis of CBC-derived indices in infants with illness-related malnutrition, given the deleterious effect of malnutrition on cellular immune competence [24,25,26,27]. A second aim was to find a helpful biomarker for discriminating the presence and severity of sepsis in malnourished children.

2. Materials and Methods

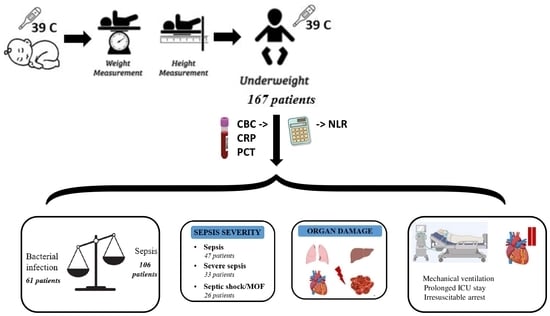
2.1. Study Design and Patient Selection

This cross-sectional retrospective study was performed in one large Romanian reference neonatology and nutritional rehabilitation center. We reviewed 241 consecutive charts of febrile malnourished infants admitted to the Pediatric Emergency Hospital “Louis Turcanu” in Timisoara, Romania, with the suspicion of sepsis between 1 January 2017 and 31 December 2022, in accordance with the Declaration of Helsinki (1975, revised in 2013). The institutional ethics committee approved the study protocol and waived informed consent due to the study’s retrospective nature.
Patients with the following characteristics were included in the study: (1) infants ≤ 1 year of age, (2) presence of malnutrition according to WHO criteria [7], and (3) confirmed admission diagnosis of bacterial infection or sepsis. Patients with incomplete available data, those with hemato-oncological diseases, other sepsis-like presentations confirmed during and after admission (inherited metabolic disorders, intoxication, cold stress, etc.), and HIV patients were excluded.
A gestational age (GA) below 37 weeks defines a preterm birth. The measured weight and height were plotted using WHO growth charts [7] or Fenton growth charts for premature babies [28]. The z score for weight, height, and weight for height were calculated [29]. Malnutrition was defined as stunned (z score < −2.0 SDS in height for age), wasted (z score < −2.0 SDS in weight for height), or underweight (SDS <−2.0 SDS in weight for age) [7,28,29].
Patients were dichotomized into two groups: those with bacterial infection and those with sepsis. According to the International Pediatric Sepsis Consensus [30], bacterial infection was considered any clinical syndrome with a high probability of bacterial infection (positive findings on physical exam, chest radiograph with lobar consolidation or bronchopneumonia, procalcitonin ≥ 0.5 ng/mL) or infection confirmed by positive culture. Sepsis was defined as suspected or proven infection with at least two of the following systemic inflammatory response syndrome (SIRS) criteria: (1) body temperature > 38.5 °C or <36 °C, (2) mean heart rate of more than +2 standard deviations (SD) above normal for age in the absence of external stimuli, or unexplained persistent elevation; OR for children under the age of 1 year: bradycardia defined as a mean heart rate <10th percentile for age, or unexplained persistent depression over a 0.5 h, (3) mean respiratory rate of more than +2 SD above normal for age or need for mechanical ventilation; (4) leukocytosis, leukopenia, or >10% immature neutrophils. Severe sepsis refers to sepsis with cardiovascular organ dysfunction, acute respiratory distress syndrome, or ≥2 organ dysfunctions. Septic shock is considered sepsis with cardiovascular dysfunction despite isotonic fluid administration [30].

2.2. Clinical Assessments and Laboratory Measurements

The following data were extracted: demographic characteristics (age, gender), anthropometric measurements (body weight, height), evolution—including length of Intensive Care Unit (ICU) stay, mechanical ventilation and survival rate, primary diagnosis (infection, sepsis, septic shock) according to the definition by Goldstein et al. [30], and comorbidities. Body weight and height were measured (unclothed) with an infant scale using an attached infantometer (Seca 376 electronic baby scale; Seca Ltd., Hamburg, Germany). Laboratory analysis performed at the time of hospital admission or on the day of drawing blood culture included: CBC using an automated hematology analyzer (Sysmex XN-550, Sysmex Corporation, Kobe, Japan), CRP using a routine automated analyzer (Hitachi 747, Hitachi, Tokyo, Japan), and PCT levels using an electrochemiluminescence assay (Elecsys® BRAHMS PCT kit, Roche Diagnostic, Rotkreuz, Switzerland) on a Cobas® 8000 modular analyzer (Roche Diagnostic, Rotkreuz, Switzerland). Blood cultures drawn during fever were incubated in the BacT/Alert 3D automated blood culture system (BioMerieux, Craponne, France). Based on retrospectively available data, the following CBC-derived indices were calculated: NLR (neutrophil count/lymphocyte count) [31], SII (platelet count × NLR) [32], and SIRI (neutrophil count × monocyte/lymphocyte count) [33].

2.3. Statistical Analysis

The two study groups were defined using descriptive statistics (percentage, mean ± standard deviation (SD), median, and interquartile range (IQR)). The normality of variable data was tested using the Shapiro–Wilk test. Normally distributed continuous variables were expressed as mean ± SDs and compared using the independent t-test. Continuous variables with skewed distribution were plotted as medians (25th and 75th interquartile range (IQR)) and compared using the Mann–Whitney U and Kruskal–Wallis tests. Categorical variables were presented as numbers and percentages (n, %) and analyzed using the Chi-squared test. Spearman’s rank correlation coefficient (r) was used to investigate the relationships between NLR, PCT, and CRP and sepsis evolution. Multiple linear regression analysis was performed to verify which laboratory infection biomarkers (PCT, CRP, and NLR) are independently associated with sepsis. Ultimately, the receiver operating characteristic (ROC) curve was plotted to assess the discrimination ability of those variables in identifying septic patients. Youden’s index (calculated as sensitivity + specificity − 1) determined optimal threshold values. Statistical analyses were performed using Statistical Package for Social Sciences software (SPSS v28.0.1.1., IBM Corporation, Armonk, NY, USA). A two-sided p value below 0.05 was considered statistically significant.

3. Results

3.1. Patient Characteristics

A total of 167 infants with illness-related malnutrition were included in the study, of which almost two halves were septic. The clinical characteristics of the infants enrolled are summarized in Table 1. Most patients were under six months, with a mean age of 3 months for both groups. While male gender was more prevalent among both groups, the percentage was lower in the sepsis group. All infants displayed acute malnutrition, with more than half (58.6%) having multiple anthropometric deficits: 43.7% associated stunting and 34.7% underweight. The sepsis group included cases with a more severe malnutrition grade (mean z score for weight of −2.48), as opposed to the infection group (mean z score for weight of 2.09). Underweight was more prevalent among the sepsis group (p = 0.008).
Almost two-thirds (70.1%) of the entire study group had underlying chronic disease, with no significant statistical differences regarding associated comorbidities between infants with bacterial infection and those with sepsis.
As expected, in terms of laboratory parameters, infants with sepsis presented more elevated levels of classic infection biomarkers such as CRP and procalcitonin (p < 0.001). Moreover, significant statistical differences were noted between the two groups when analyzing the CBC-derived indices.
Regarding infection source, as illustrated in Figure 1, pneumonia was the most common cause among both study groups, followed by digestive and urinary tract infections. The infection source remained unidentified in 16.9% of sepsis cases (18 patients).

3.2. Statistical Analysis of Clinical Characteristics of Sepsis Infants

We also performed subgroup analysis to characterize the sepsis group and to evaluate the relationship between infection biomarkers and sepsis severity, as depicted in Table 2 and Figure 2. Of the sepsis group, 27% required intubation and mechanical ventilation, and 43.3% required ICU hospitalization for more than 7 days. The overall case fatality of our sepsis group was 14.2%, with the majority (86.7%) having multiple anthropometric deficits.
Regarding infection biomarkers, only PCT and NLR showed a gradual increase between the three groups (p < 0.001).

3.3. Correlation Analysis between NLR and Clinical Variables

In order to further assess the relationship between the NLR and sepsis outcomes, we performed Spearman’s correlation analysis. As depicted in Table 3, while both NLR and procalcitonin correlate with sepsis severity, only NLR positively correlates with all investigated outcome parameters. In addition, no significant correlations were found for CRP, except for prolonged ICU stay (p = 0.032).

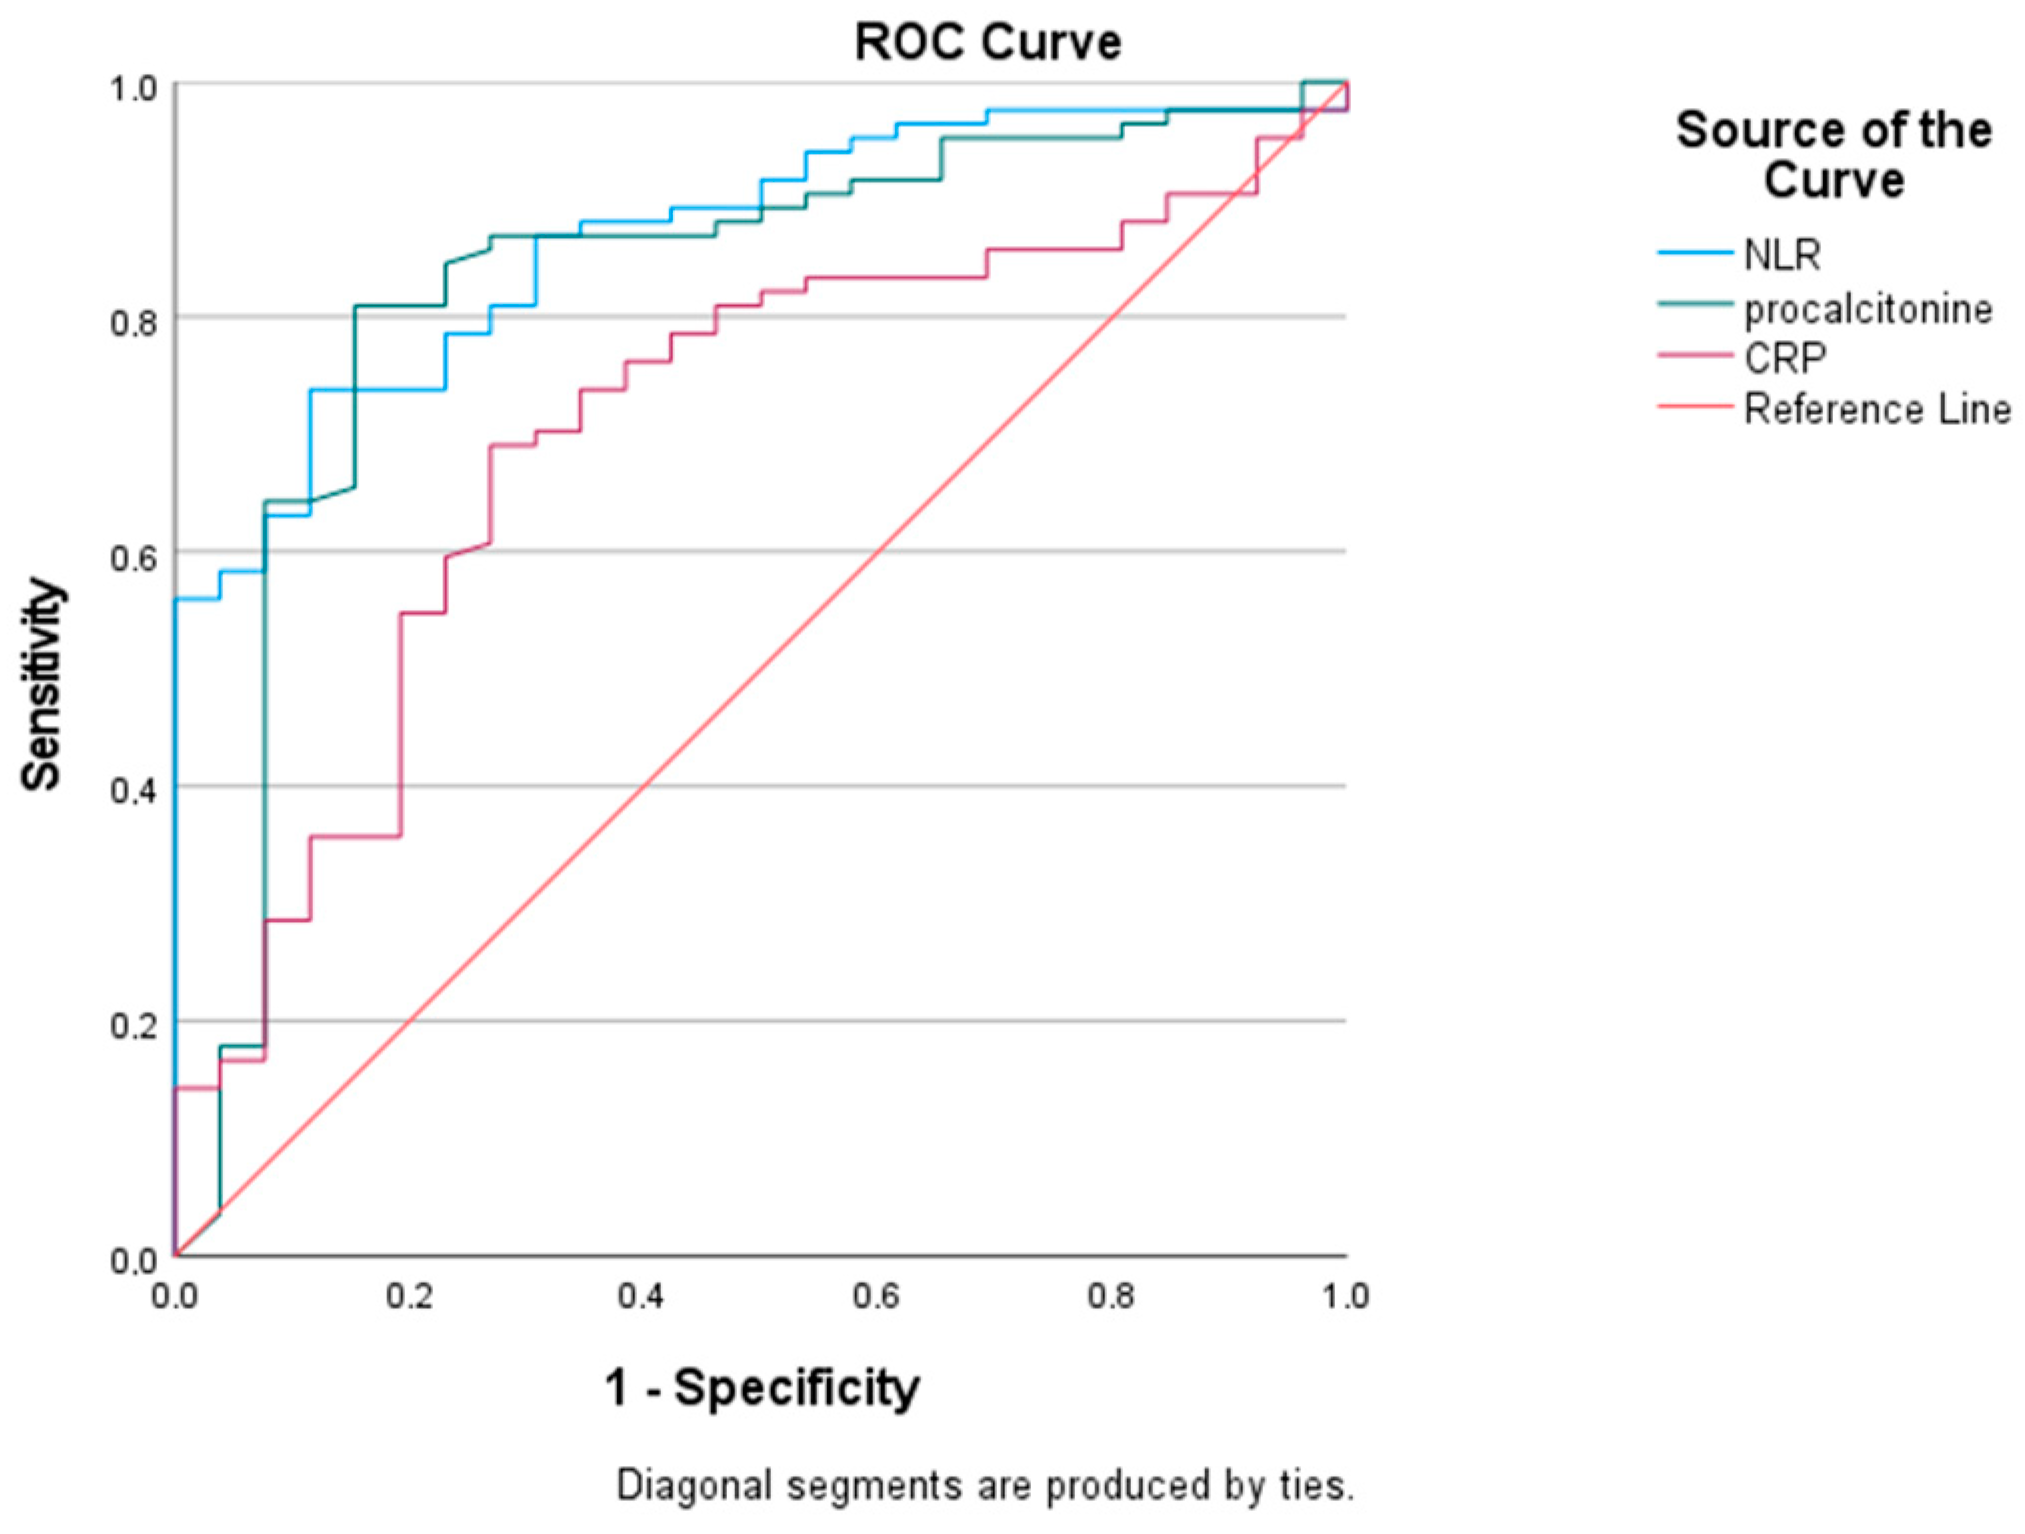
3.4. Diagnostic Performances of PCT, CRP, and NLR

Receiver operating characteristic (ROC) curves were plotted to assess the accuracy of PCT, CRP, and NLR in diagnosing sepsis among the entire study lot (Figure 3). The area under the ROC (curve) revealed similar excellent discriminatory power of NLR and PCT in recognizing septic cases as opposed to CRP, with NLR, PCT, and CRP having sensitivities of 0.85, 0.82, and 0.70 and specificities of 0.69, 0.76, and 0.65, respectively. The threshold values determined by Youden’s index for NLR, PCT, and CRP were 1.43, 1.56 ng/mL, and 28.3 mg/L, respectively (Table 4).

3.5. Association between NLR Levels and Sepsis

Logistic regression analysis was further employed to investigate the independence of NLR in predicting sepsis among our study groups, with sepsis as the dependent variable and NLR, PCT, and CRP as independent variables. After multivariable risk adjustment for age, all three infectious biomarkers remained positively associated with sepsis (Table 5).

4. Discussion

Our findings suggest that NLR helps identify malnourished infants with sepsis and can discriminate sepsis severity.
Illness-related malnutrition, the most common form in the developed world, generates annually increased healthcare costs due to prolonged hospitalization [34,35,36,37,38]. In addition, nutritional status further deteriorates in up to 50% of children during hospital stay [39]. Irrespective of growth restriction at birth, preterm infants are vulnerable to EUGR during neonatal stay and after discharge, related to cumulative protein and energy deficits [40]. The catch-up growth occurs mainly in the first six months of life and continues until the age of two. Because of the immaturity of the gastrointestinal tract’s immune system and the high risk for malnutrition, preterm infants are predisposed to infectious morbidity. De Sousa et al. observed that the risk of developing late-onset sepsis was 4.9-fold higher in children without appropriate catch-up growth [9]. The presented study group included a relatively high number of preterm children (n = 96, 57.5%). One in two infants diagnosed with sepsis was premature.
Sepsis is one of the leading causes of ICU admission and prolonged hospitalization among infants with illness-related malnutrition [41]. Therefore, prompt recognition and management are vital for favorable results [5]. Sepsis remains a major challenge because symptoms can be insidious and nonspecific [6,42,43]. The cornerstone for the pathogenesis of sepsis is inflammation, infection acting as a potent stimulus for the acute-phase response [44,45]. Therefore, research regarding the successful diagnosis of sepsis has focused, besides blood cultures, on inflammatory biomarkers [44]. With respect to nutritional status, most studies have highlighted CRP and PCT as solid markers of concurrent infection in malnourished children, similar to the acute-phase response of well-nourished children [18,46,47,48]. Regarding the prediction of sepsis severity, studies have indicated that elevated CRP and PCT levels were fair indicators of severity, being associated with fatal outcomes but not sufficiently accurate for the diagnosis of invasive bacterial infections in this specific population [20]. In contrast, Manary et al. declared lower CRP levels in infected children with malnutrition [49].
During the last decade, the research regarding sepsis has also included CBC-derived indices. A growing number of studies have pointed out that NLR can be used as a biomarker for systemic inflammatory response due to bacterial infection [50,51,52,53]. This can be explained by the fact that neutrophils increase in the context of bacterial infection through stimulation, demargination, and delayed apoptosis, while lymphocytes are decreased due to migration to the infection site and apoptosis [54,55,56,57,58,59,60,61]. Moreover, pro-inflammatory cytokines activate the anterior hypothalamus, enabling the adrenal gland to release glucocorticoids and aggravate neutrophilia [43]. Regarding the pediatric population, studies involving CBC-derived indices and bacterial sepsis have focused on well-nourished children [53]. Given the fact that, according to different authors, malnutrition has a deleterious effect on cellular immune competence [23,24,25,26,27], the present study aimed at assessing the value of CBC-derived indices in malnourished infants.
Our study group consisted mainly of infants with illness-related malnutrition, with more than half displaying multiple anthropometric deficits. As reported by other studies regarding malnutrition in developed countries, cyanotic heart lesions and gastrointestinal disease were among the most prevalent comorbidities [62,63], along with complications associated with premature birth (bronchopulmonary dysplasia, neurologic disease). In terms of infection source, pneumonia was prevalent among both study groups. This is in keeping with the findings of previous various articles that mention malnutrition’s negative effect on respiratory function by affecting the ventilator drive, causing respiratory muscle weakness, and disrupting pulmonary defense mechanisms [64,65,66,67,68,69]. The mortality rate among our entire study sample was 8.98%, with the majority (86.7%) having multiple anthropometric deficits. This is similar to the results of a previous study which stated that children with multiple anthropometric deficits are 12 times more likely to die than well-nourished children, as opposed to a two-fold increase in children who only exhibit wasting [70]. In contrast, de Souza Menezes et al. found no significant association between mortality and malnutrition in critically ill children [64].
To the best of our knowledge, this study is the first to address the NLR’s diagnostic and prognostic performances in infants with malnutrition. Among the examined laboratory biomarkers, NLR and PCT were the most accurate discriminators between sepsis patients and those with bacterial infection, with areas under the ROC curve offering ‘excellent’ discrimination, according to Hosmer and Lemeshow [71]. An NLR value of 1.43 identified subjects with sepsis with 85% sensibility and 69% specificity. Studies assessing the diagnostic value of NLR in children with sepsis have provided variable results. In terms of a relatively similar age group, this cut-off was similar to that obtained by Dursun et al. regarding a study group with a median age of 18 months that provided a threshold NLR value of 1.97 for discriminating sepsis from non-sepsis; however, the specificity and sensitivity were both lower, 75.6% and 38.4%, respectively [53]. Another study, by Goldberg et al. suggested an NLR threshold of 1.5 for diagnosing late-onset neonatal sepsis, with a sensitivity of 83.9% and a specificity of 79% [72]. Omran et al., 2018 disclosed a sensitivity of 80% and a specificity of 57.1% at a threshold value of 2.7 [73]. Differences in the study population and the testing methods used might explain variations in diagnostic accuracy among studies [74].
In terms of the sepsis group, NLR proved to be positively correlated with prolonged ICU stay (<0.001), acute organ dysfunction (0.038), mechanical ventilation (<0.001), and fatality (<0.001). The results are in agreement with previous pediatric studies, which demonstrated that NLR can predict sepsis severity and outcome [54,75].

5. Limitations

There are, however, limitations that need to be mentioned. (1)This is a retrospective study, susceptible to inherent bias, with almost one-third of all consecutive cases having incomplete documentation or analysis. (2) The subsample sizes were relatively small and stem from a single-center study; results may not be extrapolated to other populations. (3) It was a cross-sectional study; serial measurements might provide a more complex vision of the dynamic correlation between NLR and sepsis. (4) Other pro-inflammatory markers such as TNF, IL-1, and IL-6 were not assessed. Thus, larger prospective studies are warranted.

6. Conclusions and Future Directions

In summary, our results suggest that the NLR can be used as an auxiliary diagnostic index, besides PCT, in discriminating the presence and severity of bacterial sepsis in malnourished infants. An NLR value of 1.43 identified subjects with sepsis with 85% sensibility and 69% specificity. In terms of the sepsis group, NLR proved to be positively correlated with prolonged ICU stay acute organ dysfunction, mechanical ventilation, and fatality. NLR value can be used in low-income settings where other sepsis laboratory markers are not always available, but there is a high malnutrition rate among infants.
We recommend that these findings be validated by multicenter studies. Moreover, longitudinal studies that evaluate these biomarkers after nutritional recovery could provide us with some new insights into the role of malnutrition in systemic infection.

Author Contributions

Conceptualization, A.E.D. and E.R.B.; methodology, M.M. and A.-M.M.; software, E.R.B.; validation, M.M., T.M.M., and O.M.; formal analysis, E.R.B.; investigation, A.E.D. and E.R.B.; resources, A.-M.M., M.B., and A.E.D.; data curation, E.R.B.; writing—original draft preparation, A.E.D.; writing—review and editing, O.M. and M.B.; visualization, T.M.M.; supervision, O.M. and M.B. All authors have read and agreed to the published version of the manuscript.

Funding

This research received no external funding.

Institutional Review Board Statement

The study was conducted in accordance with the Declaration of Helsinki, and approved by the Institutional Review Board of Pediatric Emergency Hospital “Louis Turcanu” in Timisoara, Romania (protocol nr 19985/ 20 December 2022).

Informed Consent Statement

Patient consent was waived due to the retrospective nature of the study.

Data Availability Statement

Data can be made available upon reasonable request due to ethical restrictions.

Conflicts of Interest

The authors declare no conflict of interest.

References

  1. Balamuth, F.; Weiss, S.L.; Neuman, M.I.; Scott, H.; Brady, P.W.; Paul, R.; Farris, R.W.; McClead, R.; Hayes, K.; Gaieski, D.; et al. Pediatric severe sepsis in U.S. children’s hospitals. Pediatr. Crit. Care Med. 2014, 15, 798–805. [Google Scholar] [CrossRef] [PubMed]
  2. Weiss, S.L.; Fitzgerald, J.C.; Pappachan, J.; Wheeler, D.; Jaramillo-Bustamante, J.C.; Salloo, A.; Singhi, S.C.; Erickson, S.; Roy, J.A.; Bush, J.L.; et al. Global epidemiology of pediatric severe sepsis: The sepsis prevalence, outcomes, and therapies study. Am. J. Respir. Crit. Care Med. 2015, 191, 1147–1157. [Google Scholar] [CrossRef] [PubMed]
  3. Schlapbach, L.J.; Straney, L.; Alexander, J.; MacLaren, G.; Festa, M.; Schibler, A.; Slater, A. Mortality related to invasive infections, sepsis, and septic shock in critically ill children in Australia and New Zealand, 2002–2013: A multicentre retrospective cohort study. Lancet Infect. Dis. 2015, 15, 46–54. [Google Scholar] [CrossRef]
  4. Tamelytė, E.; Vaičekauskienė, G.; Dagys, A.; Lapinskas, T.; Jankauskaitė, L. Early Blood Biomarkers to Improve Sepsis/Bacteremia Diagnostics in Pediatric Emergency Settings. Medicina 2019, 55, 99. [Google Scholar] [CrossRef]
  5. Hermon, M.M.; Etmayr, T.; Brandt, J.B.; Sadeghi, K.; Burda, G.; Golej, J. Pediatric infection and sepsis in five age subgroups: Single-center registry. Wien. Med. Wochenschr. 2021, 171, 29–35. [Google Scholar] [CrossRef] [PubMed]
  6. Jones, K.D.; Berkley, J.A. Severe acute malnutrition and infection. Paediatr. Int. Child Health 2014, 34 (Suppl. S1), S1–S29. [Google Scholar] [CrossRef] [PubMed]
  7. Morlese, J.F.; Forrester, T.; Jahoor, F. Acute-phase protein response to infection in severe malnutrition. Am. J. Physiol. 1998, 275, E112–E117. [Google Scholar] [CrossRef]
  8. Dowton, S.B.; Colton, H.R. Acute phase reactants in inflammation and infection. Semin. Hematol. 1988, 25, 84–90. [Google Scholar]
  9. Fleck, A. Clinical and nutritional aspects of changes in acutephase proteins during inflammation. Proc. Nutr. Soc. 1989, 48, 347–354. [Google Scholar] [CrossRef]
  10. Djordjevic, D.; Rondovic, G.; Surbatovic, M.; Stanojevic, I.; Udovicic, I.; Andjelic, T.; Zeba, S.; Milosavljevic, S.; Stankovic, N.; Abazovic, D.; et al. Neutrophil-to-lymphocyte ratio, monocyte-to-lymphocyte ratio, platelet-to-lymphocyte ratio, and mean platelet volume-to-platelet count ratio as biomarkers in critically ill and injured patients: Which ratio to choose to predict outcome and nature of bacteremia? Mediat. Inflamm. 2018, 2018, 3758068. [Google Scholar]
  11. Martins, E.C.; Silveira, L.D.F.; Viegas, K.; Beck, A.D.; Júnior, G.F.; Cremonese, R.V.; Lora, P.S. Neutrophil-lymphocyte ratio in the early diagnosis of sepsis in an intensive care unit: A case-control study. Rev. Bras. Ter. Intensiv. 2019, 31, 64–70. [Google Scholar] [CrossRef]
  12. de Pablo, R.; Monserrat, J.; Prieto, A.; Alvarez-Mon, M. Role of circulating lymphocytes in patients with sepsis. BioMed Res. Int. 2014, 2014, 67108. [Google Scholar]
  13. Huang, Z.; Fu, Z.; Huang, W.; Huang, K. Prognostic value of neutrophil-to-lymphocyte ratio in sepsis: A meta-analysis. Am. J. Emerg. Med. 2020, 38, 641–647. [Google Scholar] [CrossRef]
  14. Doherty, J.F.; Golden, M.H.; Raynes, J.G.; Griffin, G.E.; McAdam, K.P. Acute-phase protein response is impaired in severely malnourished children. Clin. Sci. 1993, 84, 169–175. [Google Scholar] [CrossRef]
  15. Shahrin, L.; Chisti, M.J.; Brintz, B.; Islam, Z.; Shahid, A.S.; Hassan, Z.; Leung, D.T.; Chowdhury, F. Clinical and laboratory predictors of 30-day mortality in severe acute malnourished children with severe pneumonia. Trop. Med. Int. Health 2020, 25, 1422–1430. [Google Scholar] [CrossRef] [PubMed]
  16. Page, A.L.; de Rekeneire, N.; Sayadi, S.; Aberrane, S.; Janssens, A.-C.; Dehoux, M.; Baron, E. Diagnostic and prognostic value of procalcitonin and C-reactive protein in malnourished children. Pediatrics 2014, 133, e363–e370. [Google Scholar] [CrossRef]
  17. Ekanem, E.E.; Umotong, A.B.; Raykundalia, C.; Catty, D. Serum C-reactive protein and C3 complement protein levels in severely malnourished Nigerian children with and without bacterial infections. Acta Paediatr. 1997, 86, 1317–1320. [Google Scholar] [CrossRef] [PubMed]
  18. Malavé, I.; Vethencourt, M.A.; Pirela, M.; Cordero, R. Serum levels of thyroxine-binding prealbumin, C-reactive protein and interleukin-6 in protein-energy undernourished children and normal controls without or with associated clinical infections. J. Trop. Pediatr. 1998, 44, 256–262. [Google Scholar] [CrossRef] [PubMed]
  19. Reid, M.; Badaloo, A.; Forrester, T.; Morlese, J.F.; Heird, W.C.; Jahoor, F. The acute-phase protein response to infection in edematous and nonedematous protein-energy malnutrition. Am. J. Clin. Nutr. 2002, 76, 1409–1415. [Google Scholar] [CrossRef] [PubMed]
  20. Rytter, M.J.; Kolte, L.; Briend, A.; Friis, H.; Christensen, V.B. The immune system in children with malnutrition—A systematic review. PLoS ONE 2014, 9, e105017. [Google Scholar]
  21. Fakhir, S.; Ahmad, P.; Faridi, M.A.; Rattan, A. Cell-mediated immune responses in malnourished host. J. Trop. Pediatr. 1989, 35, 175–178. [Google Scholar] [CrossRef]
  22. Bung, B.G.; Mahalanabis, D.; Mukherjee, K.L.; Bang, F.B. Tand B lymphocyte rosetting in under nourished children. Soc. Exp. Biol. Med. 1975, 149, 199–202. [Google Scholar] [CrossRef] [PubMed]
  23. Chandra, R.K.; Newberne, P.M. Cell-mediated immunity in nutritional imbalance. Fed. Proc. 1980, 39, 3088–3099. [Google Scholar] [PubMed]
  24. Puri, V.; Misra, P.K.; Saxena, K.C.; Saxena, P.N.; Saxena, R.K.; Agrawal, C.G. Immune status in malnutrition. Ind. Pediatr. 1980, 2, 127–133. [Google Scholar]
  25. World Health Organization. Training Course on Child Growth Assessment; WHO: Geneva, Switzerland, 2008; Available online: https://apps.who.int/iris/handle/10665/43601 (accessed on 5 June 2023).
  26. Goldstein, B.; Giroir, B.; Randolph, A. International pediatric sepsis consensus conference: Definitions for sepsis and organ dysfunction in pediatrics. Pediatr. Crit. Care Med. 2005, 6, 2–8. [Google Scholar] [CrossRef]
  27. Walsh, S.R.; Cook, E.; Goulder, F.; Justin, T.; Keeling, N. Neutrophil-lymphocyte ratio as a prognostic factor in colorectal cancer. J. Surg. Oncol. 2005, 91, 181–458. [Google Scholar] [CrossRef]
  28. Hu, B.; Yang, X.R.; Xu, Y.; Sun, Y.F.; Sun, C.; Guo, W.; Zhan, X.; Wang, W.-M.; Qiu, S.J.; Zhou, J.; et al. Systemic immune-inflammation index predicts prognosis of patients after curative resection for hepatocellular car- 461 cinoma. Clin. Cancer Res. 2014, 20, 6212–6222. [Google Scholar] [CrossRef]
  29. Qi, Q.; Zhuang, L.; Shen, Y.; Geng, Y.; Yu, S.; Chen, H.; Liu, L.; Meng, Z.; Wang, P.; Chen, Z. A novel systemic inflammation response index (SIRI) for predicting the survival of patients with pancreatic cancer 464 after chemotherapy. Cancer 2016, 122, 2158–2167. [Google Scholar]
  30. Niseteo, T.; Hojsak, I.; Kolaček, S. Malnourished children acquire nosocomial infections more often and have significantly increased length of hospital stay. Clin. Nutr. 2020, 39, 1560–1563. [Google Scholar] [CrossRef]
  31. Hecht, C.; Weber, M.; Grote, V.; Daskalou, E.; Dell’Era, L.; Flynn, D.; Gerasimidis, K.; Gottrand, F.; Hartman, C.; Hulst, J.; et al. Disease associated malnutrition correlates with length of hospital stay in children. Clin. Nutr. 2015, 34, 53e9. [Google Scholar] [CrossRef]
  32. Pawellek, I.; Dokoupil, K.; Koletzko, B. Prevalence of malnutrition in paediatric hospital patients. Clin. Nutr. 2008, 27, 72e6. [Google Scholar] [CrossRef] [PubMed]
  33. Lu, L.; Mao, X.; Sheng, J.; Huang, J.; Wang, Y.; Tang, Q.; Cai, W. Development and validation of a pediatric nutritional screening score (PNSS) for hospitalized children. Asia Pac. J. Clin. Nutr. 2018, 27, 65–71. [Google Scholar]
  34. Prasadajudio, M.; Devaera, Y.; Noormanto, N.; Kuswiyanto, R.B.; Sudarmanto, B.; Andriastuti, M.; Sidiartha, I.G.L.; Sitorus, N.L.; Basrowi, R.W. Disease-Related Malnutrition in Pediatric Patients with Chronic Disease: A Developing Country Perspective. Curr. Dev. Nutr. 2022, 7, 100021. [Google Scholar] [CrossRef] [PubMed]
  35. Campanozzi, A.; Russo, M.; Catucci, A.; Rutigliano, I.; Canestrino, G.; Giardino, I.; Romondia, A.; Pettoello-Mantovani, M. Hospital-acquired malnutrition in children with mild clinical conditions. Nutrition 2009, 25, 540–547. [Google Scholar] [CrossRef] [PubMed]
  36. Mayr, F.B.; Yende, S.; Angus, D.C. Epidemiology of severe sepsis. Virulence 2014, 5, 4–11. [Google Scholar] [CrossRef]
  37. Sofouli, G.A.; Tsintoni, A.; Fouzas, S.; Vervenioti, A.; Gkentzi, D.; Dimitriou, G. Early Diagnosis of Late-Onset Neonatal Sepsis Using a Sepsis Prediction Score. Microorganisms 2023, 11, 235. [Google Scholar] [CrossRef]
  38. Wilar, R. Diagnostic value of eosinopenia and neutrophil to lymphocyte ratio on early onset neonatal sepsis. Korean J. Pediatr. 2019, 62, 217–223. [Google Scholar] [CrossRef]
  39. Karabulut, B.; Alatas, S.O. Diagnostic Value of Neutrophil to Lymphocyte Ratio and Mean Platelet Volume on Early Onset Neonatal Sepsis on Term Neonate. J. Pediatr. Intensive Care 2021, 10, 143–147. [Google Scholar] [CrossRef]
  40. McAdam, K.P.W.J.; Elin, R.J.; Sipe, I.D.; Wolff, S.M. Changes in human serum amyloid A and C-reactive protein after etiocholanoloneinduced inflammation. J. Clin. Investig. 1978, 61, 390–394. [Google Scholar] [CrossRef]
  41. Delgado, A.F.; Okay, T.S.; Leone, C.; Nichols, B.; Del Negro, G.M.; Vaz, F.A. Hospital malnutrition and inflammatory response in critically ill children and adolescents admitted to a tertiary intensive care unit. Clinics 2008, 63, 357–362. [Google Scholar] [CrossRef]
  42. Manary, M.J.; Broadhead, R.L.; Yaresheski, K.E. Whole-body protein kinetics in marasmus and kwashiorkor during acute infection. Am. J. Clin. Nutr. 1998, 67, 1205–1209. [Google Scholar] [CrossRef] [PubMed]
  43. Amesty-Valbuena, A.; Pereira, N.; Castillo, J.; García, D.; Nuñez, J.R.; Cayama, N.; Morán, A.; Parra, M.A.; Troconiz, C. Mediadores de inflamación (proteina C reactiva) enelniño con desnutriciónproteico-energética y enelniñoeutrófico. Investig. Clin. 2004, 45, 53–62. [Google Scholar]
  44. Manary, M.J.; Yarasheski, K.E.; Berger, R.; Abrams, E.T.; Hart, C.A.; Broadhead, R.L. Wholebody leucine kinetics and the acute phase response during acute infection in marasmic Malawian children. Pediatr. Res. 2004, 55, 940–946. [Google Scholar] [CrossRef]
  45. Li, T.; Dong, G.; Zhang, M.; Xu, Z.; Hu, Y.; Xie, B.; Wang, Y.; Xu, B. Association of Neutrophil-Lymphocyte Ratio and the Presence of Neonatal Sepsis. J. Immunol. Res. 2020, 2020, 7650713. [Google Scholar] [CrossRef] [PubMed]
  46. Alkan Ozdemir, S.; Arun Ozer, E.; Ilhan, O.; Sutcuoglu, S. Can neutrophil to lymphocyte ratio predict late-onset sepsis in preterm infants? J. Clin. Lab. Anal. 2018, 32, e22338. [Google Scholar] [CrossRef] [PubMed]
  47. Hamiel, U.; Bahat, H.; Kozer, E.; Hamiel, Y.; Ziv-Baran, T.; Goldman, M. Diagnostic markers of acute infections in infants aged 1 week to 3 months: A retrospective cohort study. BMJ Open 2018, 8, e018092. [Google Scholar] [CrossRef]
  48. Dursun, A.; Ozsoylu, S.; Akyildiz, B.N. Neutrophil-to-lymphocyte ratio and mean platelet volume can be useful markers to predict sepsis in children. Pak. J. Med. Sci. 2018, 34, 918–922. [Google Scholar] [CrossRef]
  49. de Jager, C.P.; Wever, P.C.; Gemen, E.F.; Kusters, R.; Van Gageldonk-Lafeber, A.B.; Van Der Poll, T.; Laheij, R.J.F. The neutrophil-lymphocyte count ratio in patients with community-acquired pneumonia. PLoS ONE 2012, 7, e46561. [Google Scholar] [CrossRef]
  50. Lee, J.W.; Park, J.S.; Park, K.B.; Yoo, G.H.; Kim, S.S.; Lee, S.M. Prediction of renal cortical defect and scar using neutrophil-to-lymphocyte ratio in children with febrile urinary tract infection. Nuklearmedizin 2017, 56, 109–114. [Google Scholar] [CrossRef]
  51. Zhang, S.; Luan, X.; Zhang, W.; Jin, Z. Platelet-to-Lymphocyte and Neutrophil-to-Lymphocyte Ratio as Predictive Biomarkers for Early-onset Neonatal Sepsis. J. Coll. Physicians Surg. Pak. 2021, 30, 821–824. [Google Scholar]
  52. Ayala, A.; Herdon, C.D.; Lehman, D.L.; Ayala, C.; Chaudry, I. Differential induction of apoptosis in lymphoid tissues during sepsis: Variation in onset, frequency, and the nature of the mediators. Blood 1996, 87, 4261–4275. [Google Scholar] [CrossRef] [PubMed]
  53. Kim, S.C.; Sun, K.H.; Choi, D.H.; Lee, Y.M.; Choi, S.W.; Kang, S.H.; Park, K.H.; Song, H. Prediction of long-term mortality based on neutrophil-lymphocyte ratio after percutaneous coronary intervention. Am. J. Med. Sci. 2016, 351, 467–472. [Google Scholar] [CrossRef] [PubMed]
  54. Urgancı, N.; Polat, T.; Ozer, N.; Kayaalp, N. The presence of clinical signs in malnourished infants with acute lower respiratory tract infections. Paediatr. Child Health 2003, 8, 83–86. [Google Scholar] [CrossRef]
  55. Rosen, E.U.; Geefhuysen, J.; Anderson, R.; Joffe, M.; Rabson, A.R. Leucocyte function in children with kwashiorkor. Arch. Dis. Child. 1975, 50, 220–224. [Google Scholar] [CrossRef]
  56. Schopfer, K.; Douglas, S.D. Neutrophil function in children with kwashiorkor. J. Lab. Clin. Med. 1976, 88, 450–461. [Google Scholar]
  57. Blasquez, A.; Clouzeau, H.; Fayon, M.; Mouton, J.-B.; Thambo, J.-B.; Enaud, R.; Lamireau, T. Evaluation of nutritional status and support in children with congenital heart disease. Eur. J. Clin. Nutr. 2016, 70, 528–531. [Google Scholar] [CrossRef] [PubMed]
  58. Groleau, V.; Thibault, M.; Doyon, M.; Brochu, E.E.; Roy, C.C.; Babakissa, C. Malnutrition in hospitalized children: Prevalence, impact, and management. Can. J. Diet. Pract. Res. 2014, 75, 29–34. [Google Scholar] [CrossRef]
  59. de Souza Menezes, F.; Leite, H.P.; Koch Nogueira, P.C. Malnutrition as an independent predictor of clinical outcome in critically illchildren. Nutrition 2012, 28, 267–270. [Google Scholar] [CrossRef]
  60. Corish, C.A.; Kennedy, N.P. Protein-energy undernutrition in hospital in-patients. Br. J. Nutr. 2000, 83, 575–591. [Google Scholar] [CrossRef]
  61. Santana e Meneses, J.F.; Leite, H.P.; de Carvalho, W.B.; Lopes, J.E. Hypophosphatemia in critically ill children: Prevalence and associated risk factors. Pediatr. Crit. Care Med. 2009, 10, 234–238. [Google Scholar] [CrossRef]
  62. Boles, J.M.; Bion, J.; Connors, A.; Herridge, M.; Marsh, B.; Melot, C.; Pearl, R.; Silverman, H.; Stanchina, M.; Vieillard-Baron, A.; et al. Weaning from mechanical ventilation. Eur. Respir. J. 2007, 29, 1033–1056. [Google Scholar] [CrossRef]
  63. Bagri, N.K.; Jose, B.; Shah, S.K.; Bhutia, T.D.; Kabra, S.K.; Lodha, R. Impact of Malnutrition on the Outcome of Critically Ill Children. Indian J. Pediatr. 2015, 82, 601–605. [Google Scholar] [CrossRef]
  64. Arora, N.S.; Rochester, D.F. Respiratory muscle strength and maximal voluntary ventilation in undernourished patients. Am. Rev. Respir. Dis. 1982, 126, 5–8. [Google Scholar]
  65. McDonald, C.M.; Olofin, I.; Flaxman, S.; Fawzi, W.W.; Spiegelman, D.; Caulfield, L.E.; Black, R.E.; Ezzati, M.; Danaei, G.; on behalf of the Nutrition Impact Model Study. The effect of multiple anthropometric deficits on child mortality: Meta-analysis of individual data in 10 prospective studies from developing countries. Am. J. Clin. Nutr. 2013, 97, 896–901. [Google Scholar] [CrossRef]
  66. Hosmer, D.W.; Lemeshow, S.; Hoboken, N.J. Applied Logistic Regression; John Wiley & Sons, Inc.: Hoboken, NJ, USA, 2000. [Google Scholar]
  67. Goldberg, O.; Amitai, N.; Chodick, G.; Bromiker, R.; Scheuerman, O.; Ben-Zvi, H.; Klinger, G. Can we improve early identification of neonatal late-onset sepsis? A validated prediction model. J. Perinatol. 2020, 40, 1315–1322. [Google Scholar] [CrossRef] [PubMed]
  68. Omran, A.; Maaroof, A.; Mohammad, M.H.S.; Abdelwahab, A. Salivary C-reactive protein, mean platelet volume and neutrophil lymphocyte ratio as diagnostic markers for neonatal sepsis. J. Pediatr. 2018, 94, 82–87. [Google Scholar] [CrossRef] [PubMed]
  69. Bai, L.; Gong, P.; Jia, X.; Zhang, X.; Li, X.; Zhang, Y.; Zhou, H.; Kang, Y. Comparison of neutrophil-to-lymphocyte ratio and platelet-to-lymphocyte ratio for the diagnosis of neonatal sepsis: A systematic review and meta-analysis. BMC Pediatr. 2023, 23, 334. [Google Scholar] [CrossRef] [PubMed]
  70. Zhong, X.; Ma, A.; Zhang, Z.; Liu, Y.; Liang, G. Neutrophil-to-lymphocyte ratio as a predictive marker for severe pediatric sepsis. Transl. Pediatr. 2021, 10, 657–665. [Google Scholar] [CrossRef] [PubMed]
  71. Ibrahim, M.K.; Zambruni, M.; Melby, C.L.; Melby, P.C. Impact of Childhood Malnutrition on Host Defense and Infection. Clin. Microbiol. Rev. 2017, 30, 919–971. [Google Scholar] [CrossRef]
  72. de Sousa, J.C.S.; de Carvalho, A.V.D.; Monte de Prada, L.C.; Marinho, A.P.; de Lima, K.F.; Macedo, S.K.O.; Santos, C.D.P.; da Câmara, S.M.A.; Barreto, A.C.D.N.G.; Pereira, S.A. Nutritional Factors Associated with Late-Onset Sepsis in Very Low Birth Weight Newborns. Nutrients 2021, 14, 196. [Google Scholar] [CrossRef]
  73. Fenton, T.R.; Kim, J.H. A systematic review and meta-analysis to revise the Fenton growth chart for preterm infants. BMC Pediatr. 2013, 13, 59. [Google Scholar] [CrossRef] [PubMed]
  74. Chou, J.H.; Roumiantsev, S.; Singh, R. PediTools Electronic Growth Chart Calculators: Applications in Clinical Care, Research, and Quality Improvement. J. Med. Internet Res. 2020, 22, e16204. [Google Scholar] [CrossRef] [PubMed]
  75. Raaijmakers, A.; Allegaert, K. Catch-Up Growth in Former Preterm Neonates: No Time to Waste. Nutrients 2016, 8, 817. [Google Scholar] [CrossRef] [PubMed]
Figure 1. The prevalence of infection type among the entire sample.
Children 10 01616 g001
Figure 2. Box plot of (a) neutrophil-to-lymphocyte ratio, (b) procalcitonin, and (c) C-reactive protein based on presence and severity of sepsis (Kruskal–Wallis H test); * far out outliers; ◦ mild outliers.
Children 10 01616 g002
Figure 3. The area under the curve of neutrophil-to-lymphocyte ratio, procalcitonin, and C-reactive protein as markers of sepsis in malnourished infants.
Children 10 01616 g003
Table 1. Clinical characteristics of the study lot.
ParametersBacterial Infection
(n = 61)
Sepsis
(n = 106)
p-Value
Age (months)3 (2, 4)3 (2, 5)0.033 U
Males % (n)75.4 (46)51.88 (55)0.004 χ2
Preterm birth % (n)70.49 (43)50 (53)0.035 χ2
Anthropometric parameters
  • Weight (kg), median (IQR)
3.52 (3.01, 4.13)3.86 (3.10, 5.00)0.082 U
  • Height (m), median (IQR)
0.53 ± 0.040.57 ± 0.06<0.001 U
  • Weight for age (z)
−2.09 (−3.07, −1.39)−2.48 (−3.89, −1.86)0.011 U
  • Height for age (z)
−0.90 (−1.51, −0.35)−0.82 (−1.45, −0.12)0.205 U
  • Weight for height (z)
−1.98 (−3.01, −1.20)−2.64 (−3.90, −1.77)0.008 U
Comorbidity % (n)
  • Absent
31.14 (19)29.24 (31)0.637 χ2
  • Genetic disorder
3.27 (2)12.26 (13)0.174 χ2
  • Cardiovascular disorder
14.75 (9)24.52 (26)0.181 χ2
  • Gastrointestinal disorder
16.39 (10)22.64 (24)0.226 χ2
  • Neurological disorder
31.14 (19)34.90 (37)0.340 χ2
  • Respiratory disorder
9.83 (6)7.54 (8)0.975 χ2
  • other
22.95 (14)19.81 (22)0.824 χ2
Laboratory parameters
  • CRP (mg/L)
9.65 (0.83, 36.1)57.2 (17.11, 137)<0.001 U
  • PCT (ng/mL)
0.57 (0.22, 1.47)8.81 (2.49, 23.9)<0.001 U
  • WBC (×103 μL)
11.88 (9.94, 15.7)18.95 (13.77, 26.82)<0.001 U
  • PLT (×103 μL)
436 (287, 516)332 (169, 484)0.004 U
  • MPV (fL)
10.03 ± 1.0210.04 ± 1.140.591 U
  • IG % (×103 μL)
0.40 (0.27, 0.92)0.70 (0.30, 2.42)0.075 U
  • RDW (%)
43.8 (16.1, 49.5)45.2 (37.7, 51.1)0.567 U
  • NLR
1.10 (0.62, 1.64)3.21 (2.03, 5.27)<0.001 U
  • SII
473 (243, 722)935 (429, 1757)<0.001 U
  • SIRI
1.85 (0.97, 3.33)5.56 (2.96, 10.23)<0.001 U
U Mann–Whitney test, χ2 chi-squared. Data are expressed as mean ± standard deviation, median (interquartile range, IQR) or percentage ( %). CRP, C-reactive protein; PCT, procalcitonin; WBC, white blood cell count; PLT, thrombocytes; MPV, mean platelet volume; IG, immature granulocytes; RDW, red blood cell distribution width; NLR, neutrophil-to-lymphocyte ratio; SII, systemic immune-inflammation index; SIRI, systemic inflammation response index. Statistically significant differences are represented in bold.
Table 2. Subgroup analysis regarding clinical parameters of the sepsis lot.
ParametersSepsis
(n = 47)
Severe Sepsis
(n = 33)
Septic Shock/MOF
(n = 26)
p-Value
Age (months)3 (2, 5)3 (2, 4)3.5 (2, 5)0.508
GA (weeks)37 (31, 39)38 (32, 40)37.5 (33.5, 39)0.633
Weight for age (z)−2.23 (−2.77, −1.41)−2.71 (−4.03, −1.98)−3.45 (−4.70, −2.27)0.002
Height for age (z)−0.79 (−1.31, −0.20)−0.73 (−1.59, −0.15)−0.84 (−1.85, −0.37)0.904
Weight for height (z)−2.38 (−3.11, −1.40)−2.83 (−3.90, −2.09)−3.47 (−5.08, −2.25)0.011
Mechanical ventilation % (n)6.38 (3)24.2 (8)69.2 (18)<0.001
Prolonged ICU stay % (n)31.9 (15)48.5 (16)57.7 (15)0.032
Irresuscitable arrest % (n)0057.7 (15)<0.001
CRP (mg/L)65.5 (20.1, 154)47.1 (7.09, 88.5)94.1 (35.5, 51.1)0.293
PCT (ng/mL)4.35 (1.83, 12.4)13.1 (4.37, 21.5)38.3 (6.73, 71.8)<0.001
WBC (×103 μL)18.9 (13.7, 24.2)17.9 (13.9, 29.9)19.3 (13.5, 28)0.877
PLT (×103 μL)336 (179, 488)362 (204, 497)280 (90.7, 451)0.273
MPV (fL)9.90 (9.10, 10.6)9.90 (9.20, 10.95)9.60 (9.10, 10.8)0.820
IG (×103 μL)0.40 (0.27, 1.30)0.70 (0.30, 2.50)1.90 (0.40, 3.30)0.205
RDW (%)46.1 (37.1, 51.6)44.5 (39.3, 53.2)45.8 (35.5, 51.1)0.231
NLR 2.39 (1.65, 3.10)4.80 (2.65, 5.65)5.02 (3.10, 8.56)<0.001
SII867 (269, 1396)1343 (511, 2300)1145 (344, 2725)0.061
SIRI4.90 (2.46, 7.79)6.79 (3.95, 12.4)7.05 (3.41, 14.1)0.142
Data are expressed as median (interquartile range, IQR). GA, gestational age; CRP, C-reactive protein; PCT, procalcitonin; WBC, white blood cell count; PLT, thrombocytes; MPV, mean platelet volume; IG, immature granulocytes; RDW, red blood cell distribution width; NLR, neutrophil-to-lymphocyte ratio; SII, systemic immune-inflammation index; SIRI, systemic inflammation response index. Statistically significant differences are represented in bold.
Table 3. Correlation analysis of infection biomarkers with outcome in the sepsis group.
NLRCRPPCT
rprprp
Prolonged ICU stay (>7 days)0.345<0.001−0.2140.032−0.0320.769
Acute organ dysfunction0.2010.038−0.1090.280−0.0210.847
Mechanical ventilation0.529<0.001−0.0380.7060.1330.222
Nonresuscitable arrest0.405<0.0010.0010.9920.1090.319
Sepsis severity0.470<0.001−0.0150.8790.429<0.001
Abbreviations: NLR, neutrophile-to-lymphocyte ratio; CRP, C-reactive protein; PCT, procalcitonin; r, Spearman correlation.
Table 4. Comparison of PCT, CRP, and NLR in discriminating sepsis.
AUCSE95%CISensitivitySpecificityCut-Offp-Value
PCT0.8280.0510.79–0.930.820.761.56<0.001
CRP0.7040.0570.59–0.810.700.6528.30.002
NLR0.8670.0330.80–0.910.850.691.43<0.001
Abbreviations: NLR, neutrophile-to-lymphocyte ratio; CRP, C-reactive protein; PCT, procalcitonin.
Table 5. Multivariate regression analysis regarding independent predictors of sepsis in the entire study sample.
Multivariate Analysis
Variableβ (95% CI)p-Value
PCT0.212 (0.001–0.007)0.016
CRP0.238 (0–0.002)0.020
NLR0.274 (0.010–0.045)0.002
Abbreviations: NLR, neutrophile-to-lymphocyte ratio; CRP, C-reactive protein; PCT, procalcitonin.
Disclaimer/Publisher’s Note: The statements, opinions and data contained in all publications are solely those of the individual author(s) and contributor(s) and not of MDPI and/or the editor(s). MDPI and/or the editor(s) disclaim responsibility for any injury to people or property resulting from any ideas, methods, instructions or products referred to in the content.

