Plasma APE1/Ref-1 Correlates with Atherosclerotic Inflammation in ApoE−/− Mice

 , ,
, , 

Abstract

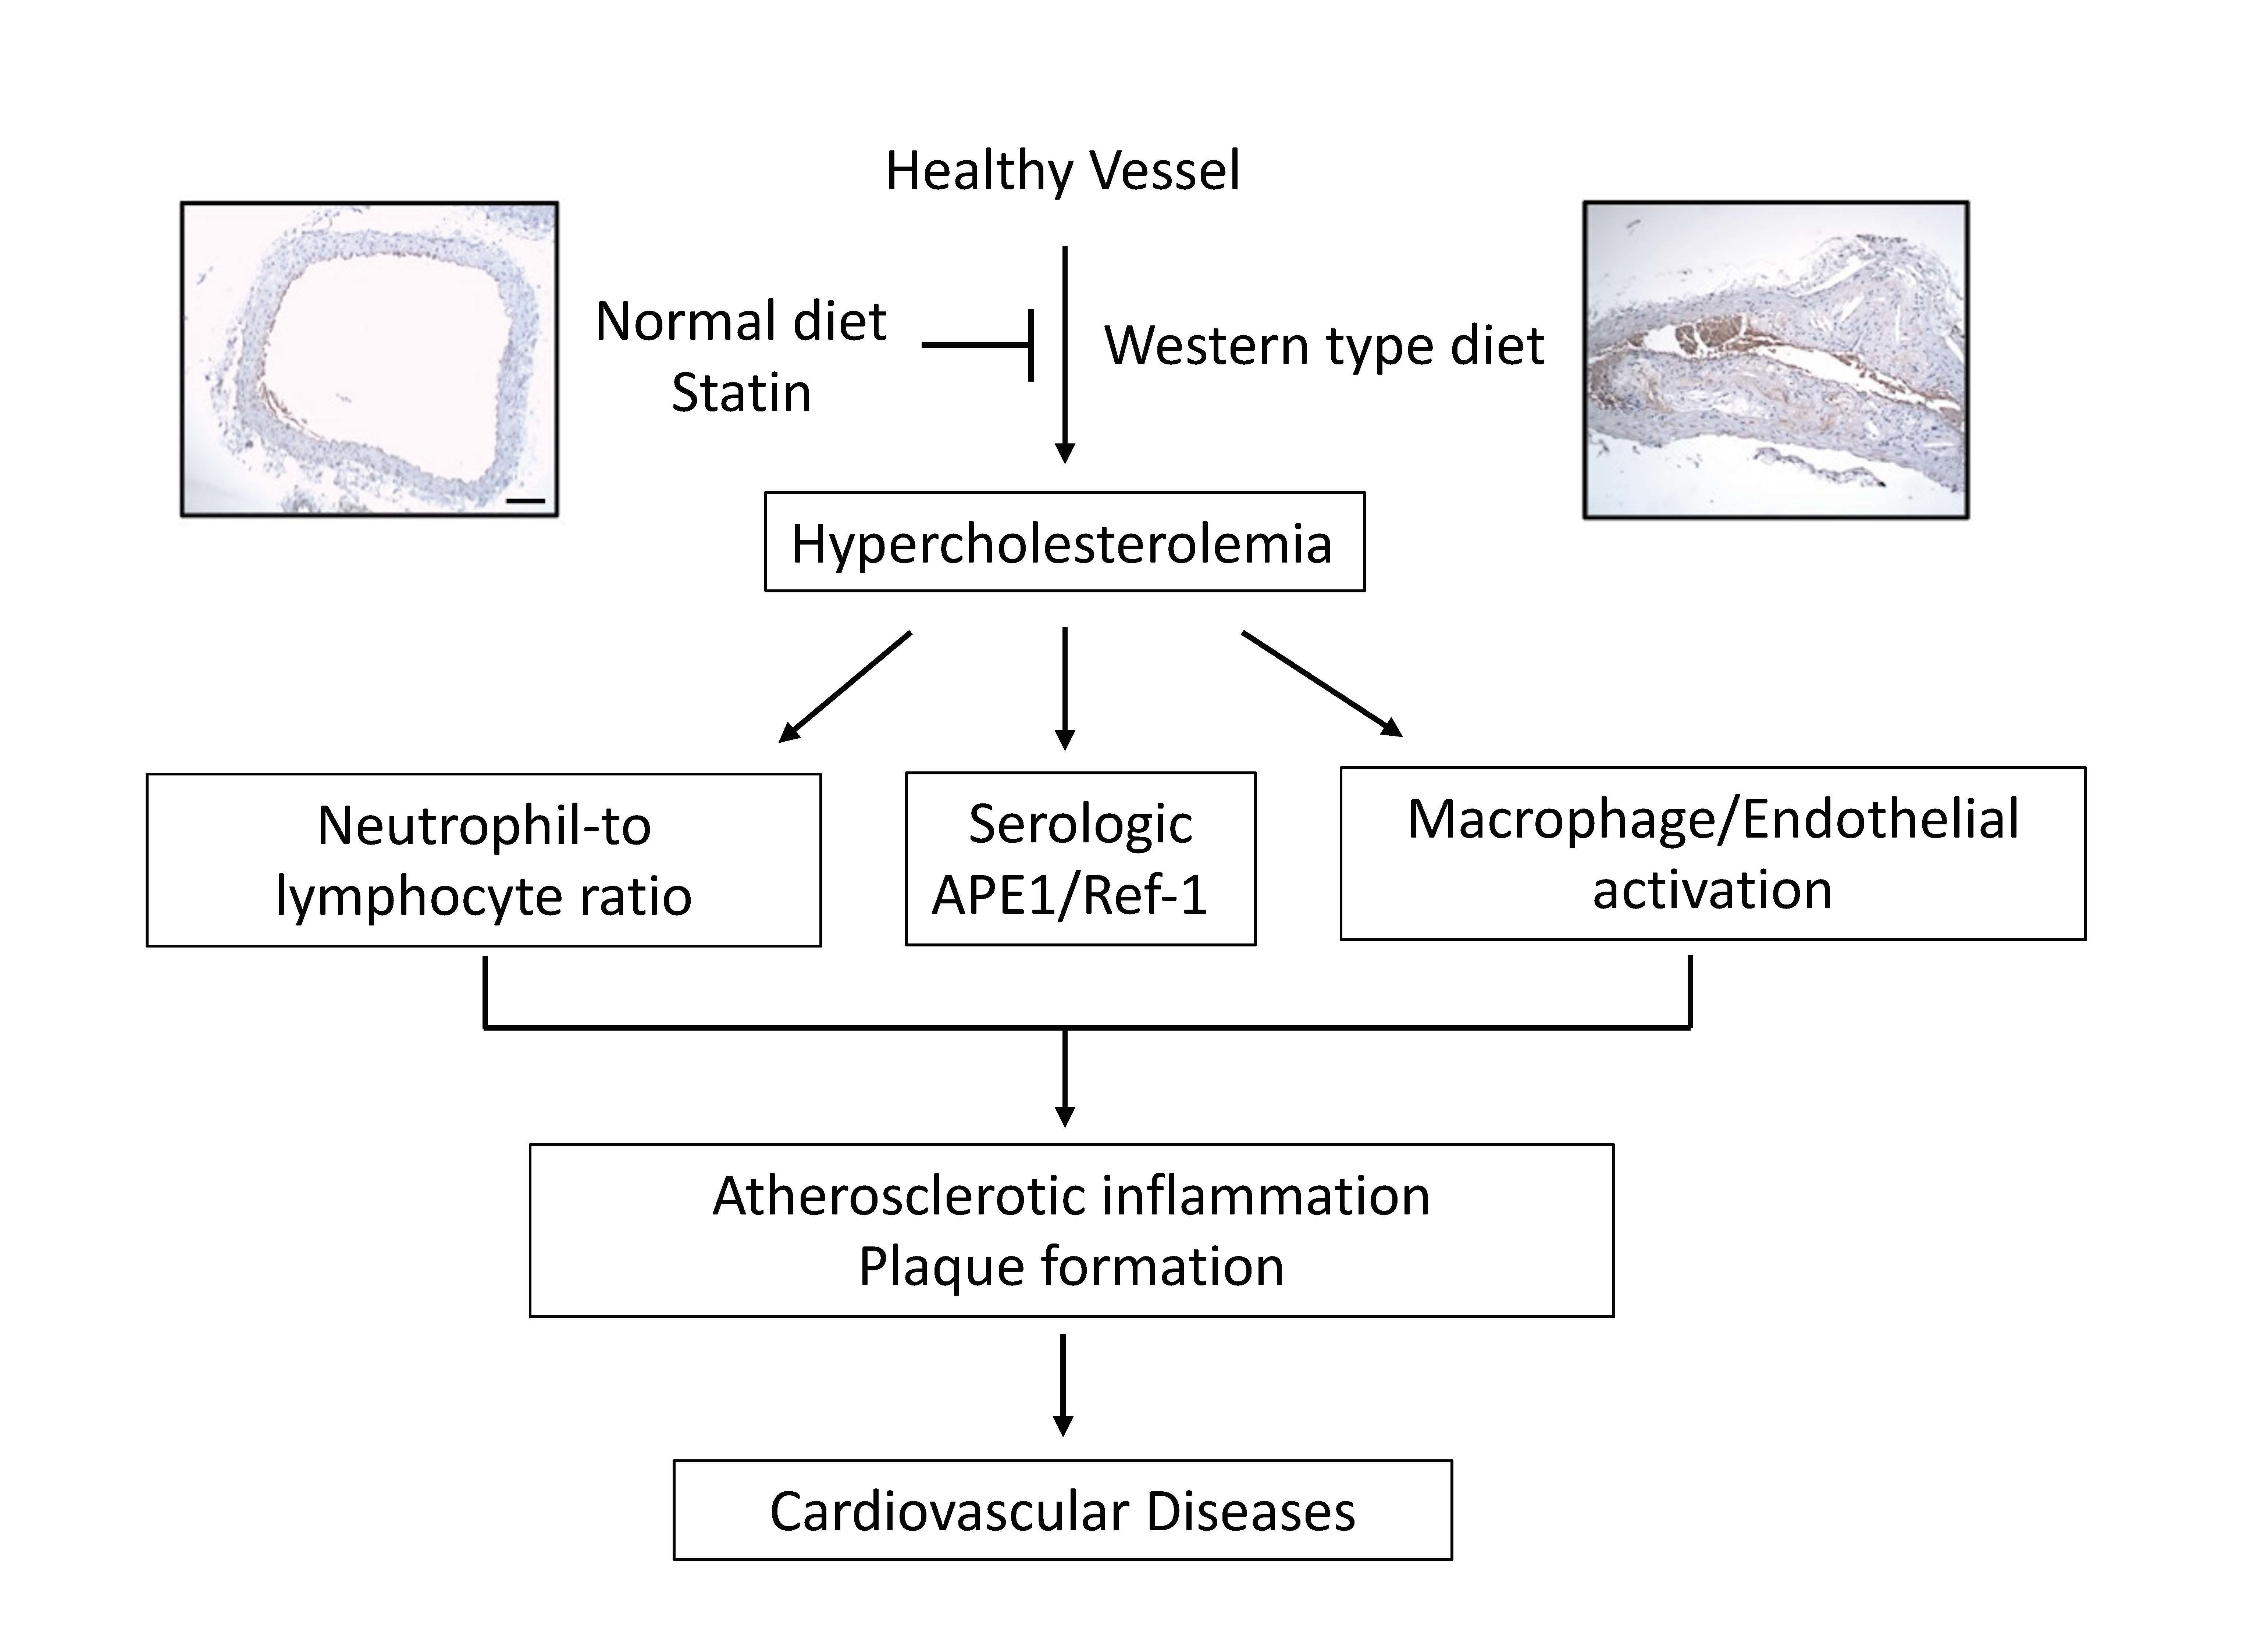
1. Introduction
2. Experimental Section
2.1. Procedures Involving Animals
2.2. Analysis of Blood Cells and Chemistry
2.3. Quantification of Plasma APE1/Ref-1
2.4. Immunoblotting
2.5. Immunohistochemistry
2.6. Immunofluorescence
2.7. Oil Red O Staining
2.8. Statistical Analysis
3. Results
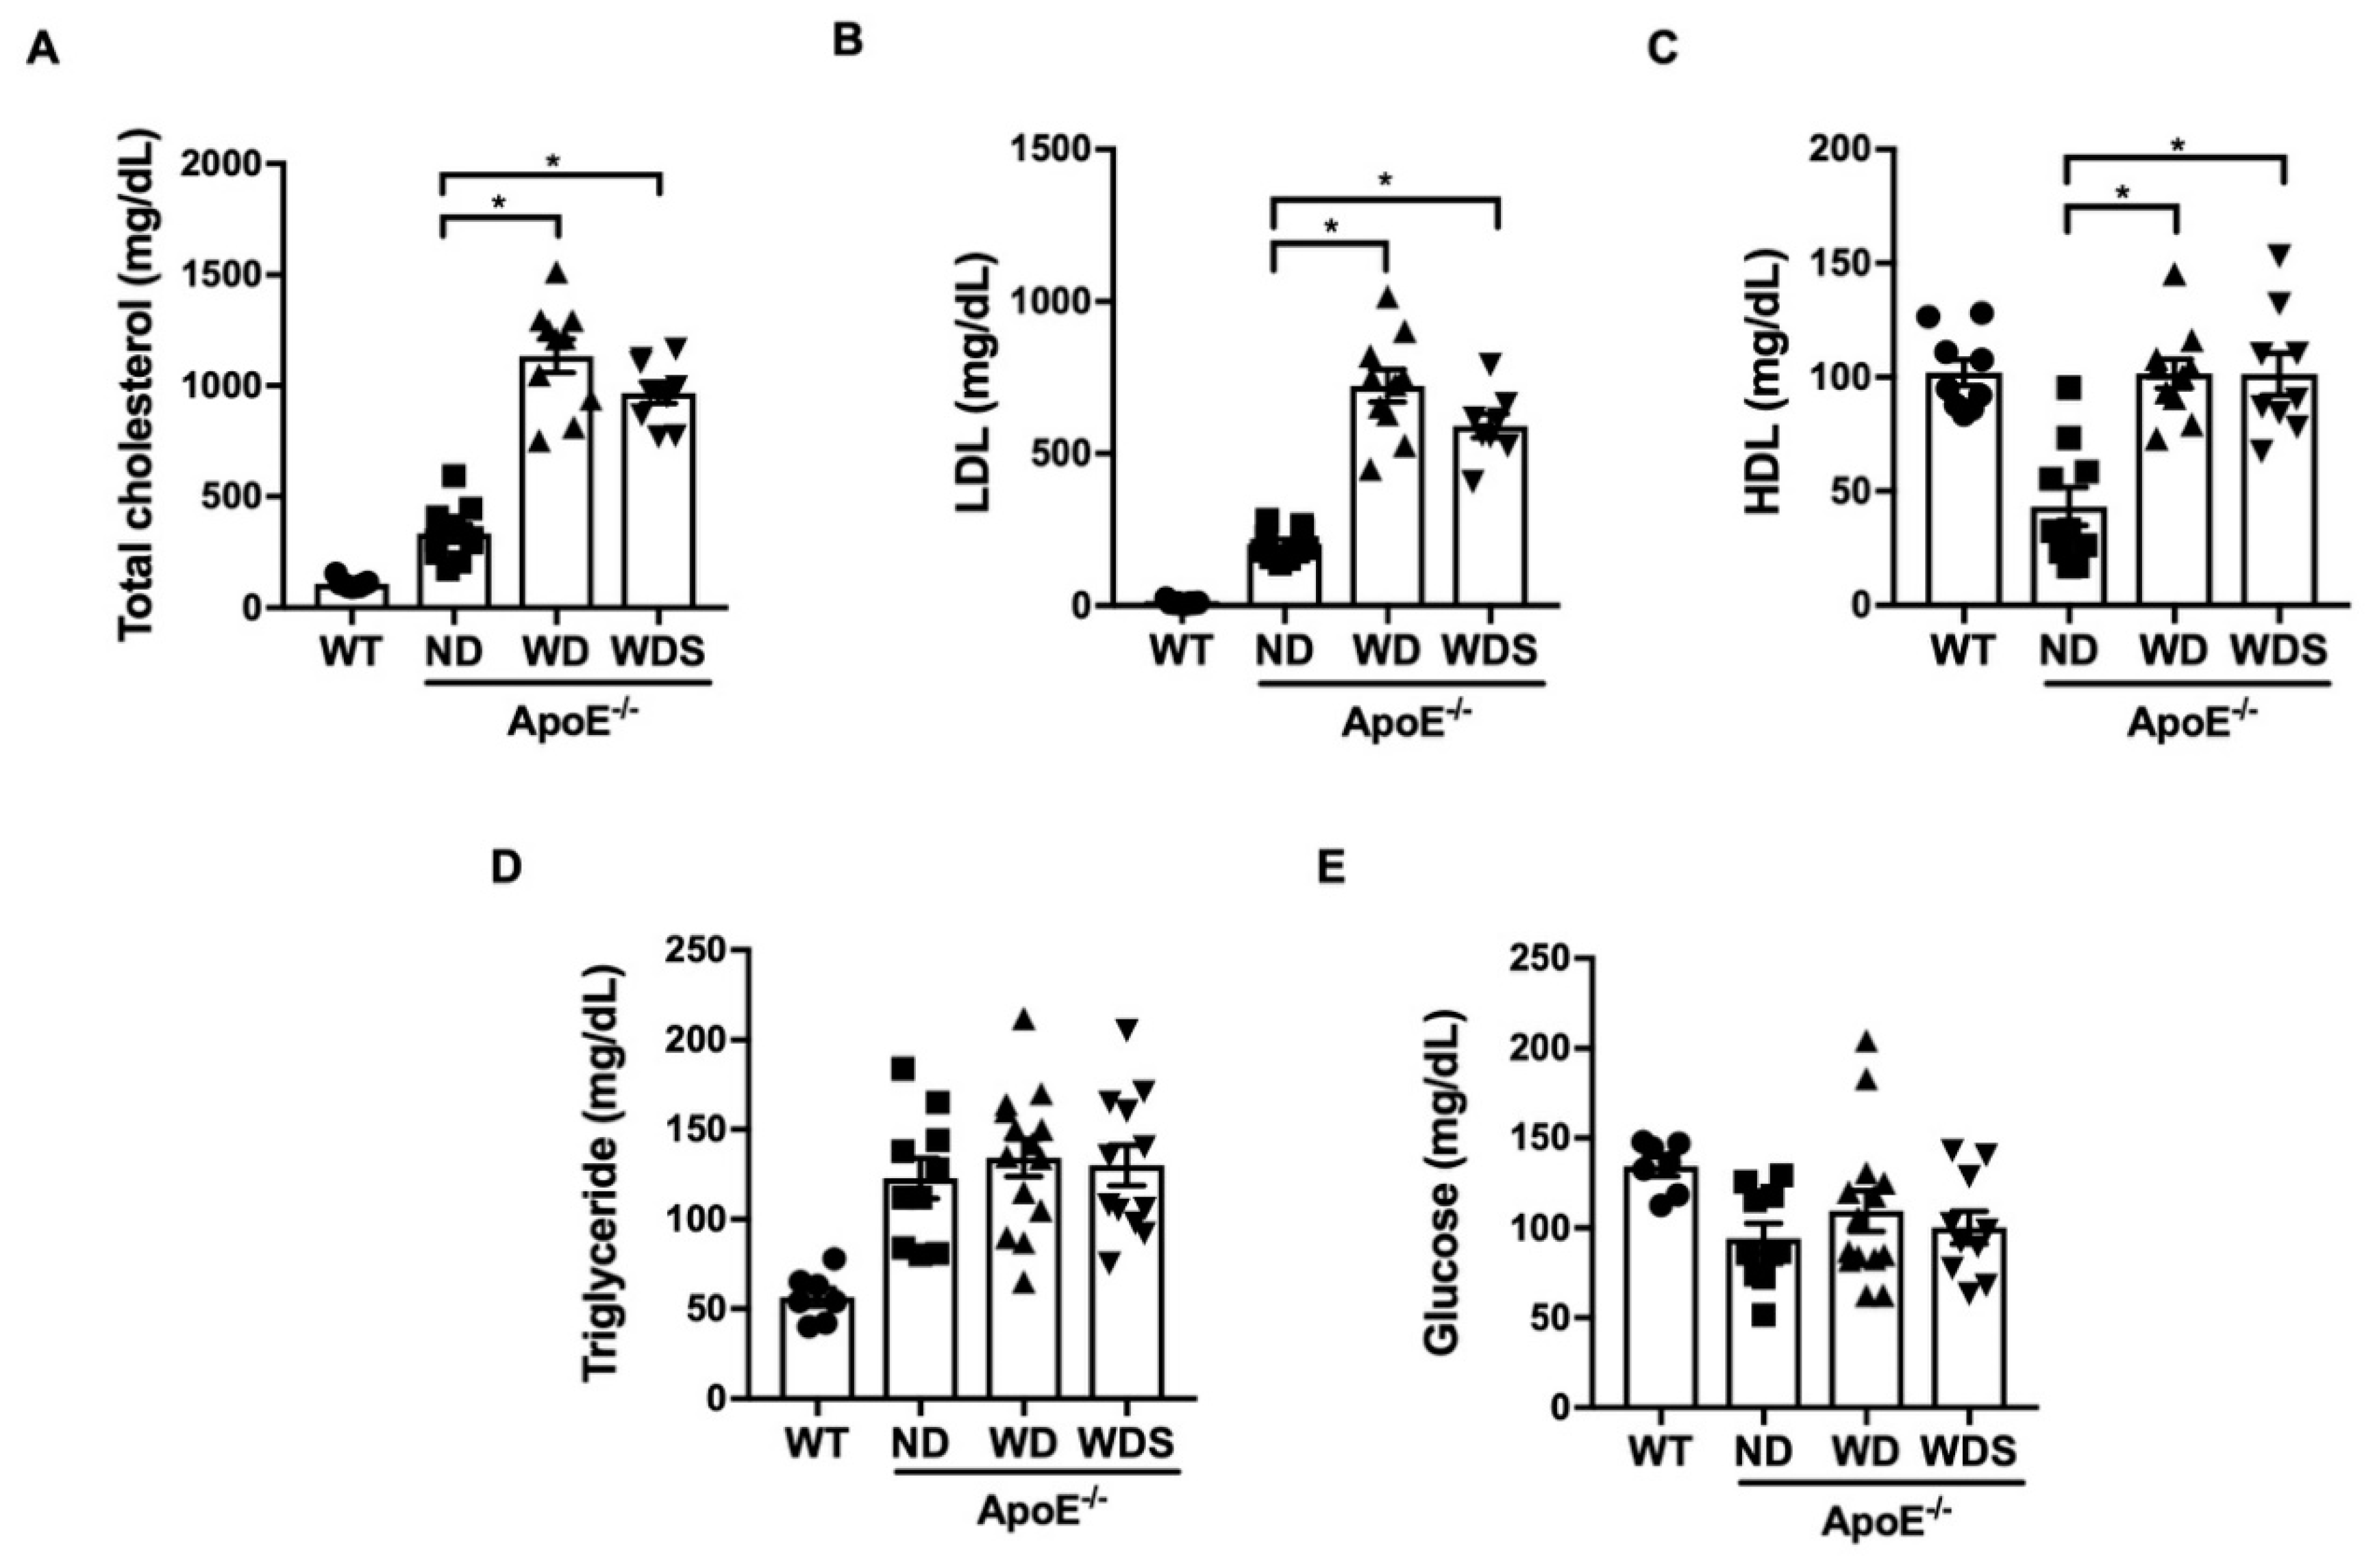
3.1. Plasma Lipid Profile in ApoE−/− Mice Fed with Normal and Western-Type Diet
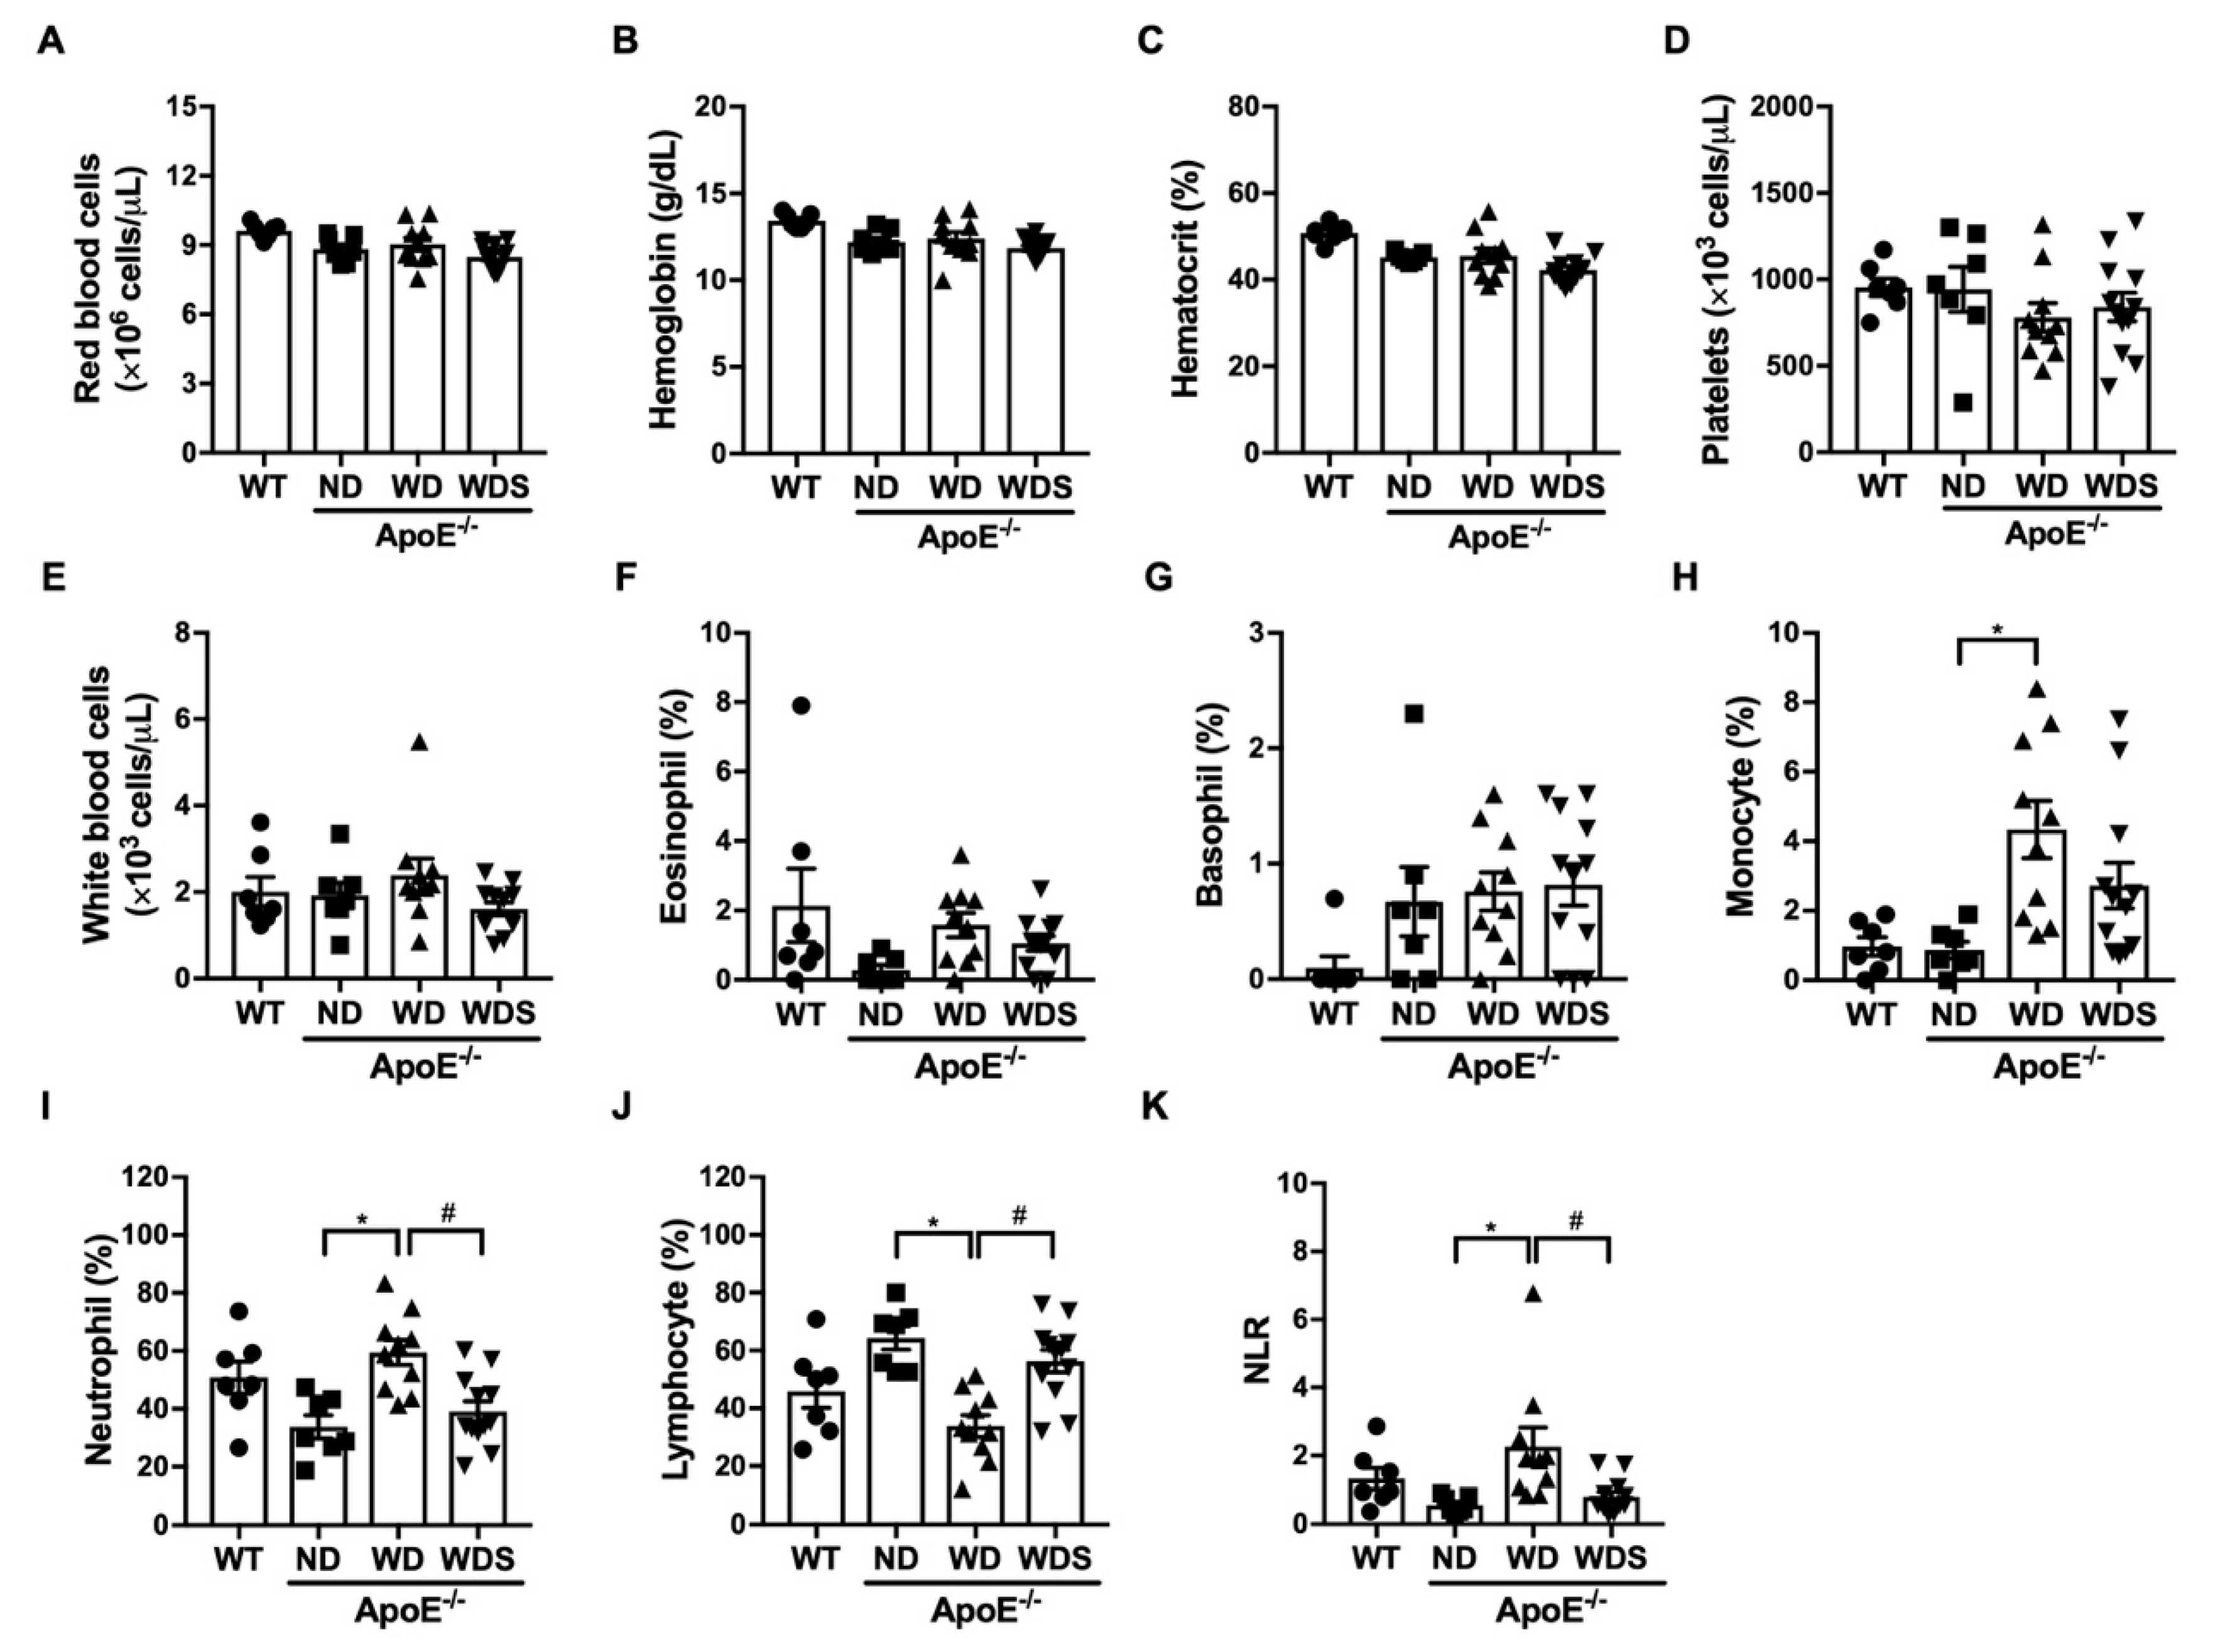
3.2. Hematologic Parameters in ApoE−/− Mice Fed with Western-Type Diet
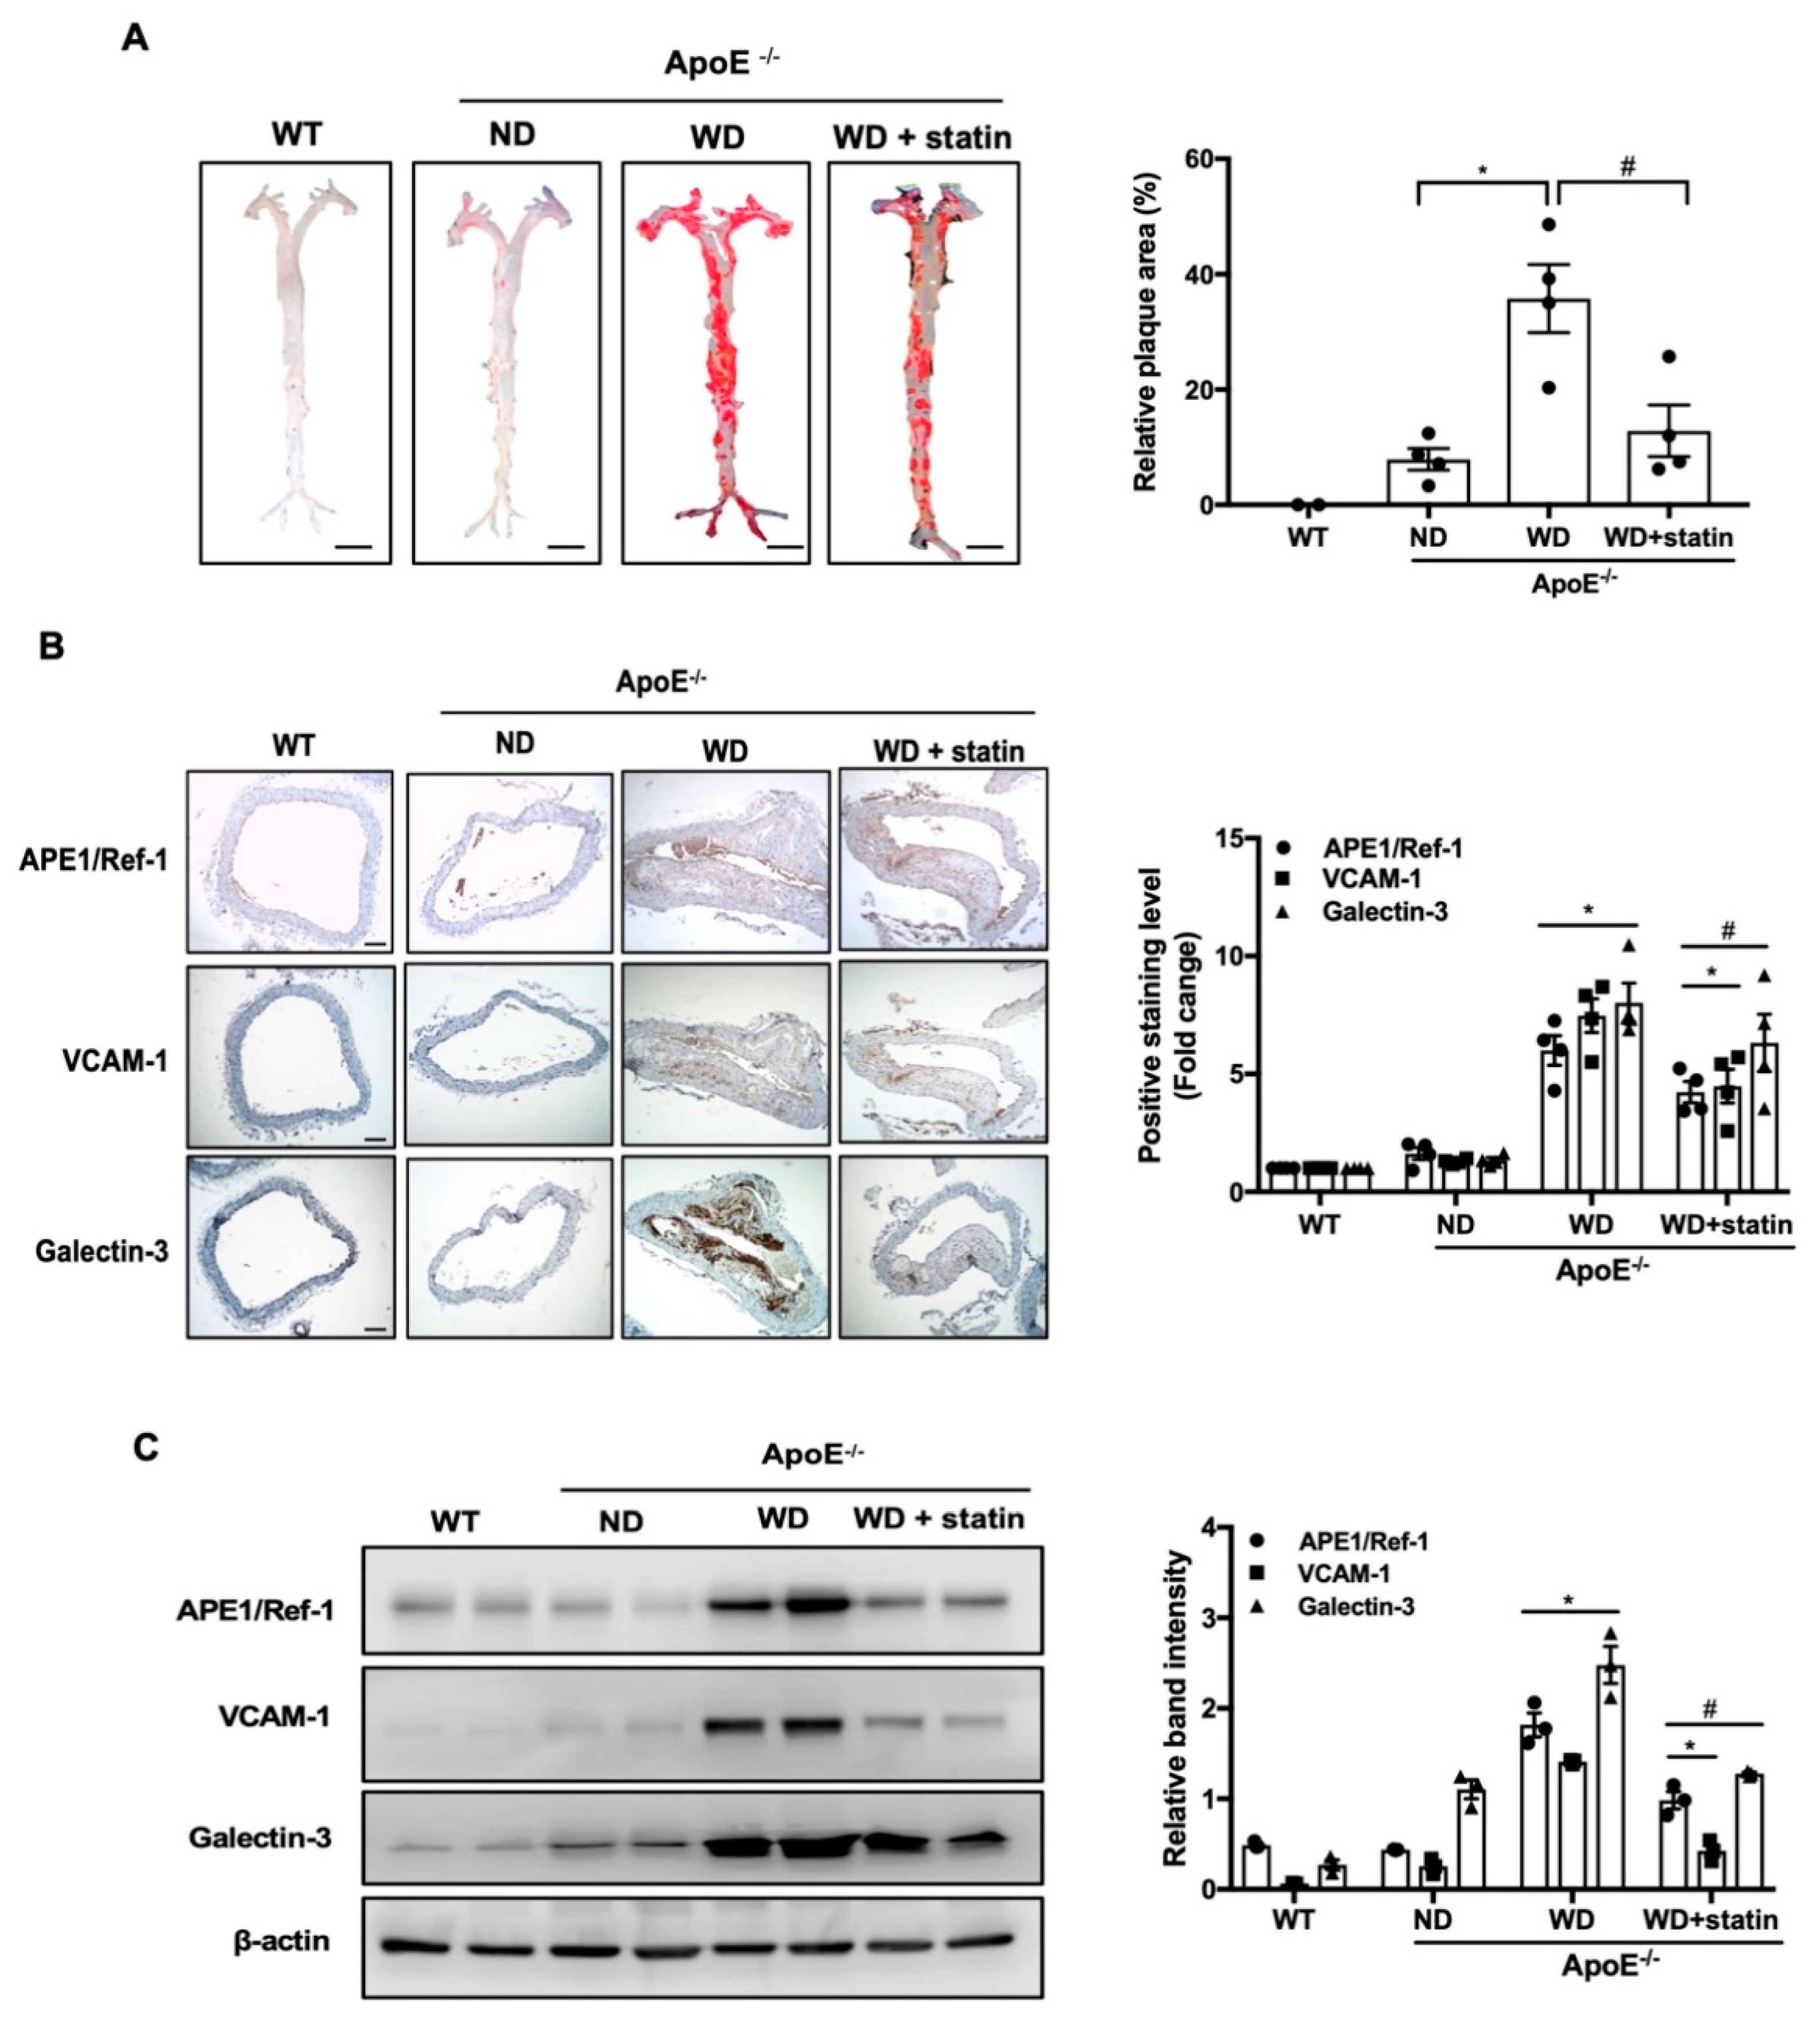
3.3. APE1/Ref-1 Expression Is Increased in Aorta of Atherosclerotic Mice
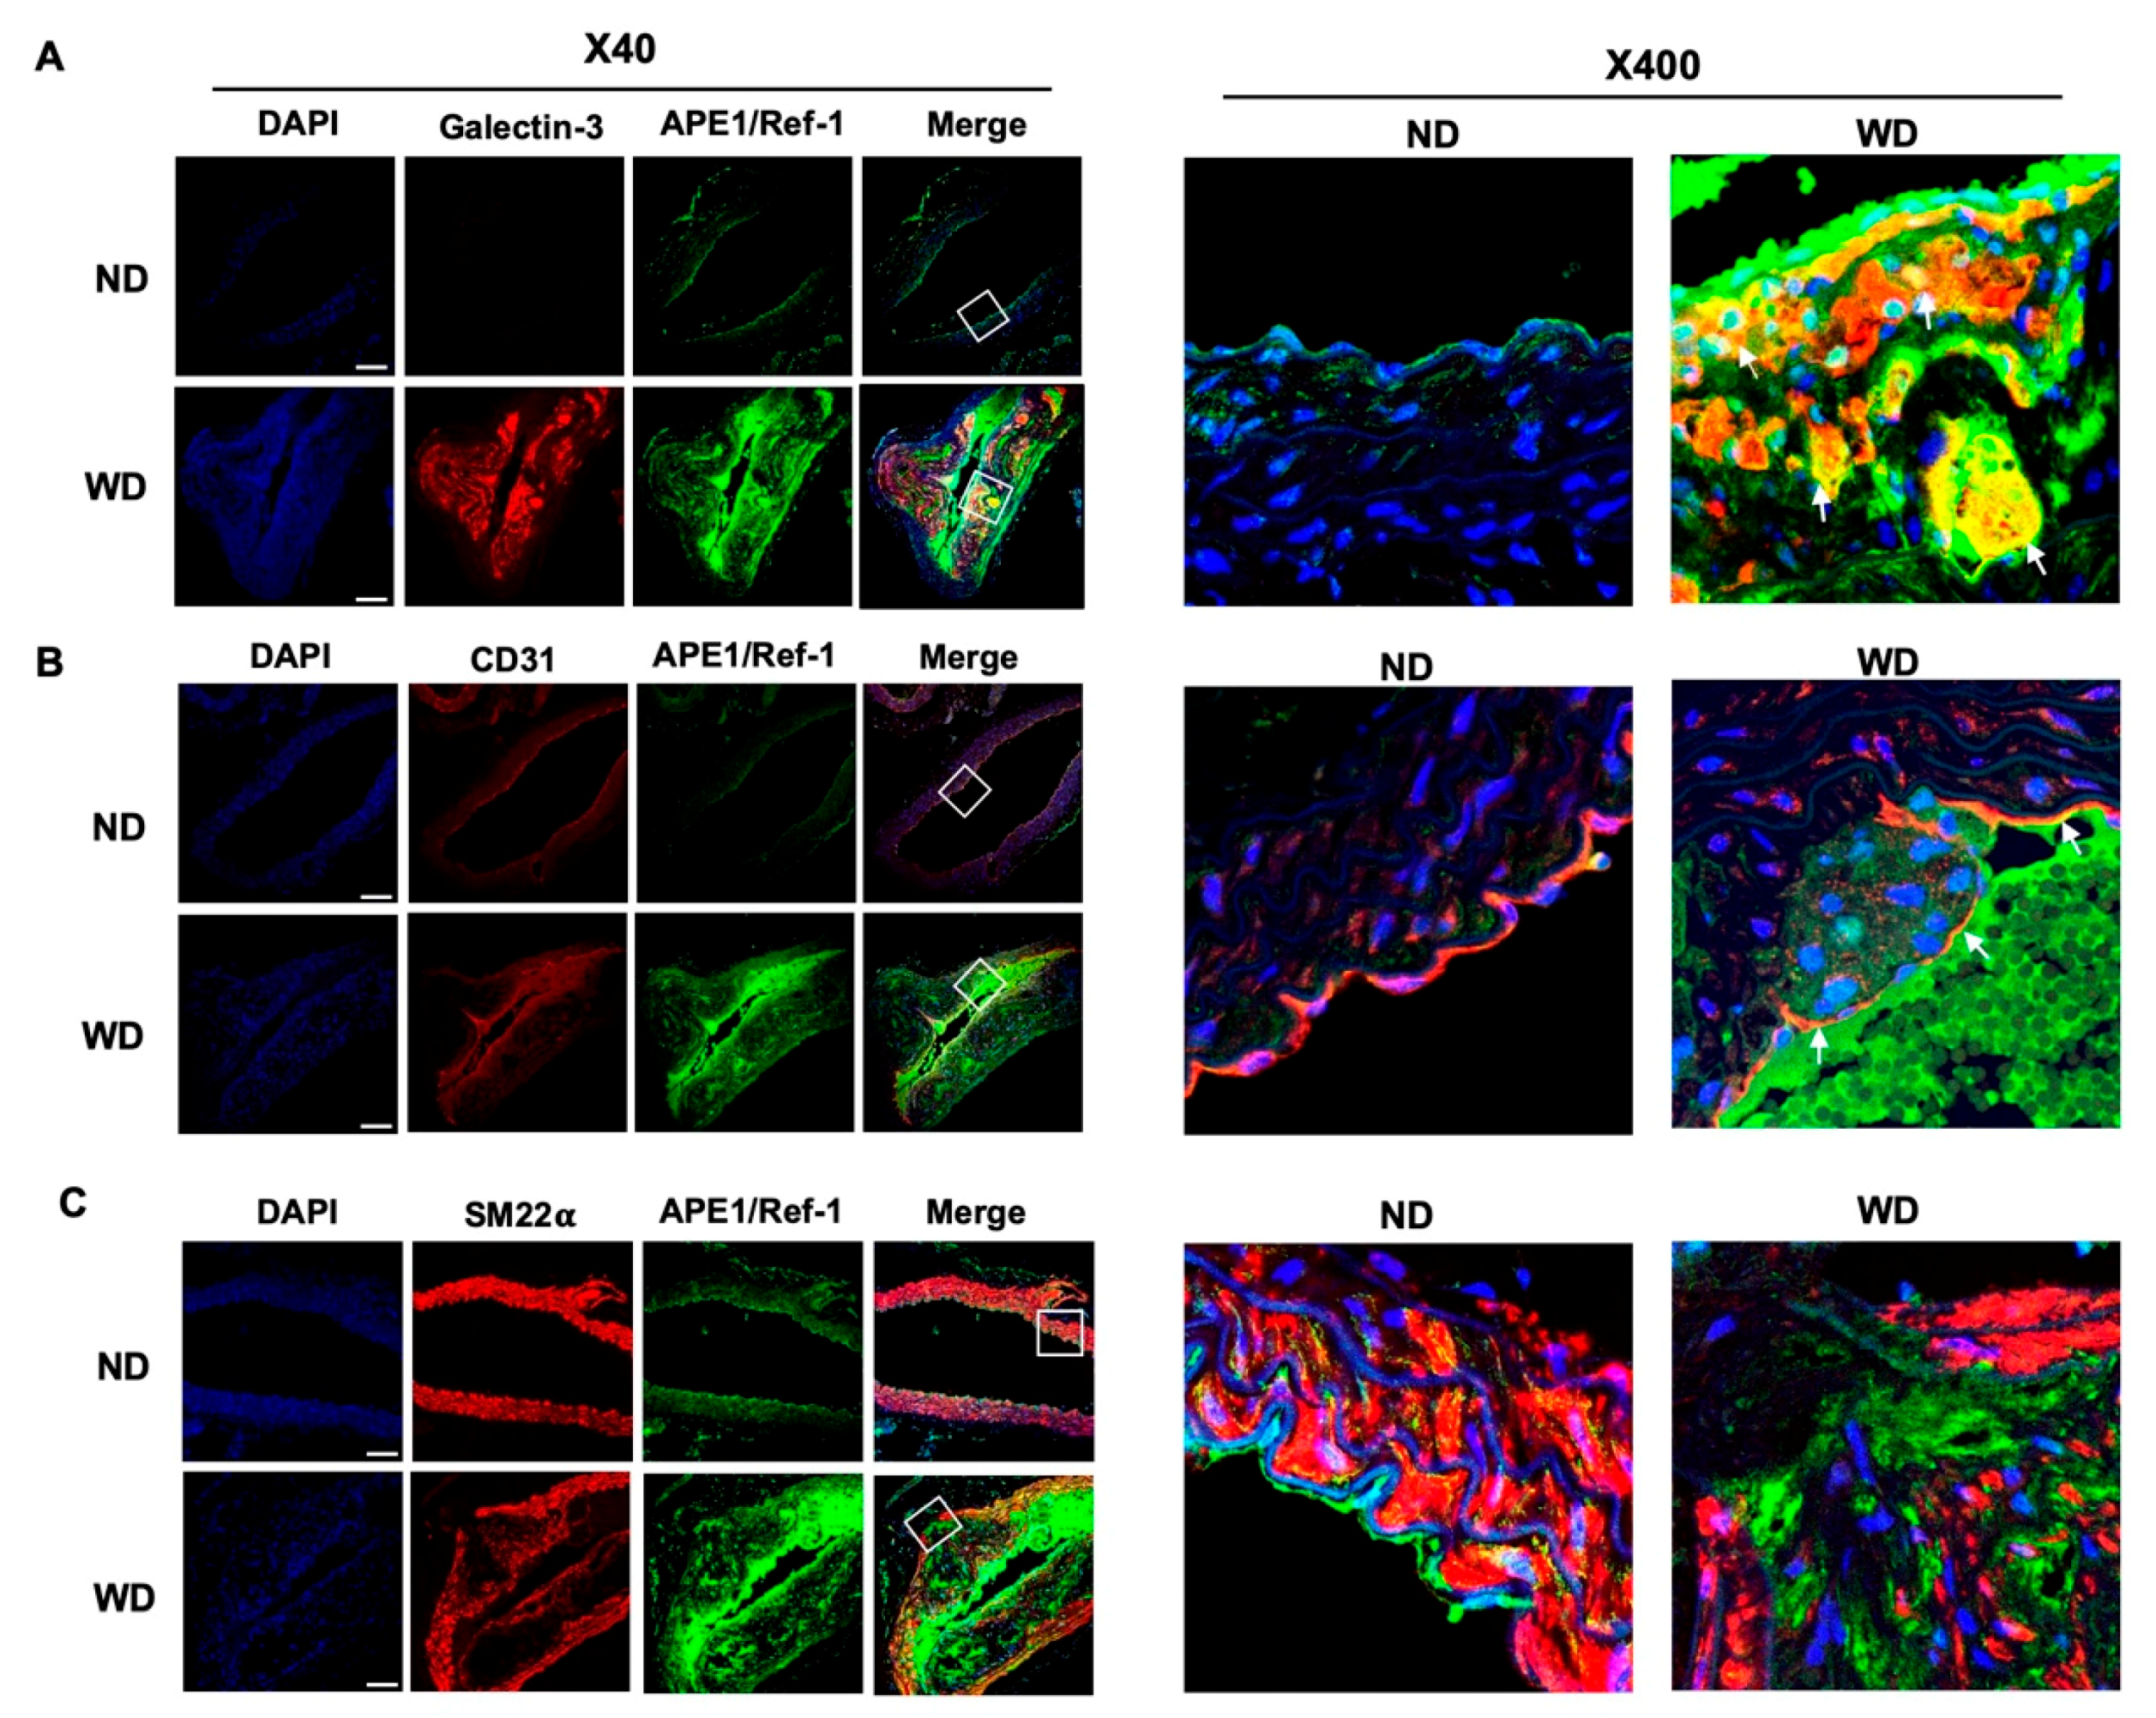
3.4. Upregulated APE1/Ref-1 Is Co-Localized in Macrophages and Endothelial Cells
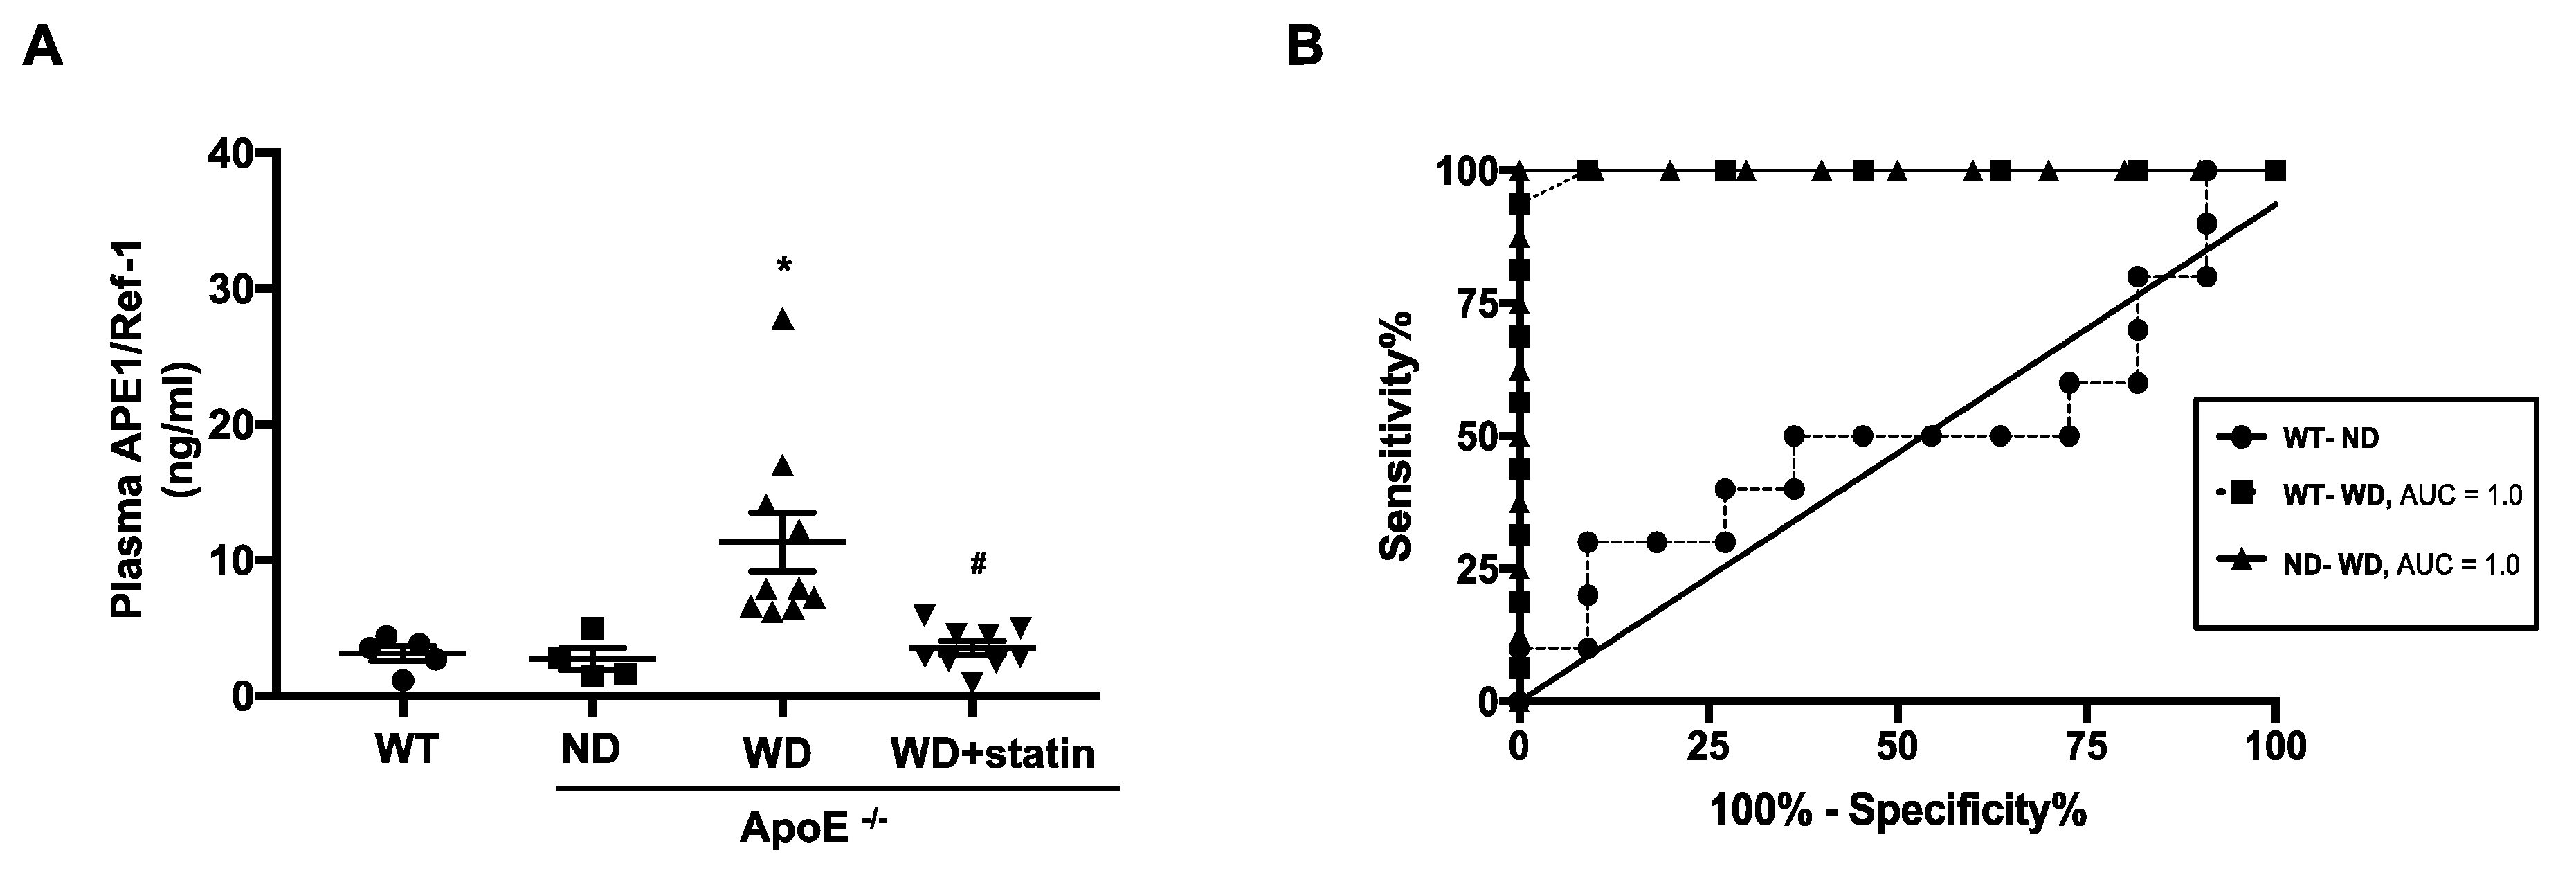
3.5. Plasma APE1/Ref-1 Levels Are Markedly Elevated in ApoE−/− Mice Fed with a Western-Type Diet
3.6. Correlation of Hematologic Parameters with Plasma APE1/Ref-1 Level
4. Discussion
Author Contributions
Funding
Conflicts of Interest
References
- Libby, P. Inflammation in atherosclerosis. Nature 2002, 420, 868–874. [Google Scholar] [CrossRef] [PubMed]
- Godschalk, R.W.; Albrecht, C.; Curfs, D.M.; Schins, R.P.; Bartsch, H.; van Schooten, F.J.; Nair, J. Decreased levels of lipid peroxidation-induced DNA damage in the onset of atherogenesis in apolipoprotein E deficient mice. Mutat. Res. 2007, 621, 87–94. [Google Scholar] [CrossRef] [PubMed]
- Whitaker, A.M.; Schaich, M.A.; Smith, M.R.; Flynn, T.S.; Freudenthal, B.D. Base excision repair of oxidative DNA damage: From mechanism to disease. Front. Biosci. (Landmark Ed.) 2017, 22, 1493–1522. [Google Scholar] [PubMed]
- Cervelli, T.; Borghini, A.; Galli, A.; Andreassi, M.G. DNA damage and repair in atherosclerosis: Current insights and future perspectives. Int. J. Mol. Sci. 2012, 13, 16929–16944. [Google Scholar] [CrossRef]
- Singh, R.B.; Mengi, S.A.; Xu, Y.J.; Arneja, A.S.; Dhalla, N.S. Pathogenesis of atherosclerosis: A multifactorial process. Exp. Clin. Cardiol. 2002, 7, 40–53. [Google Scholar]
- Mahley, R.W. Apolipoprotein E: Cholesterol transport protein with expanding role in cell biology. Science 1988, 240, 622–630. [Google Scholar] [CrossRef]
- Tell, G.; Quadrifoglio, F.; Tiribelli, C.; Kelley, M.R. The many functions of APE1/Ref-1: Not only a DNA repair enzyme. Antioxid. Redox. Signal. 2009, 11, 601–620. [Google Scholar] [CrossRef]
- Whitaker, A.M.; Freudenthal, B.D. APE1: A skilled nucleic acid surgeon. DNA Repair 2018, 71, 93–100. [Google Scholar] [CrossRef]
- Kim, C.S.; Son, S.J.; Kim, E.K.; Kim, S.N.; Yoo, D.G.; Kim, H.S.; Ryoo, S.W.; Lee, S.D.; Irani, K.; Jeon, B.H. Apurinic/apyrimidinic endonuclease1/redox factor-1 inhibits monocyte adhesion in endothelial cells. Cardiovasc. Res. 2006, 69, 520–526. [Google Scholar] [CrossRef]
- Jeon, B.H.; Gupta, G.; Park, Y.C.; Qi, B.; Haile, A.; Khanday, F.A.; Liu, Y.X.; Kim, J.M.; Ozaki, M.; White, A.R.; et al. Apurinic/apyrimidinic endonuclease 1 regulates endothelial NO production and vascular tone. Circ. Res. 2004, 95, 902–910. [Google Scholar] [CrossRef]
- Choi, S.; Lee, Y.R.; Park, M.S.; Joo, H.K.; Cho, E.J.; Kim, H.S.; Kim, C.S.; Park, J.B.; Irani, K.; Jeon, B.H. Histone deacetylases inhibitor trichostatin A modulates the extracellular release of APE1/Ref-1. Biochem. Biophys. Res. Commun. 2013, 435, 403–407. [Google Scholar] [CrossRef] [PubMed]
- Park, M.S.; Lee, Y.R.; Choi, S.; Joo, H.K.; Cho, E.J.; Kim, C.S.; Park, J.B.; Jo, E.K.; Jeon, B.H. Identification of plasma APE1/Ref-1 in lipopolysaccharide-induced endotoxemic rats: Implication of serological biomarker for an endotoxemia. Biochem. Biophys. Res. Commun. 2013, 435, 621–626. [Google Scholar] [CrossRef] [PubMed]
- Lee, Y.R.; Joo, H.K.; Jeon, B.H. The Biological Role of Apurinic/Apyrimidinic Endonuclease1/Redox Factor-1 as a Therapeutic Target for Vascular Inflammation and as a Serologic Biomarker. Biomedicines 2020, 8, 57. [Google Scholar] [CrossRef]
- Jin, S.A.; Seo, H.J.; Kim, S.K.; Lee, Y.R.; Choi, S.; Ahn, K.T.; Kim, J.H.; Park, J.H.; Lee, J.H.; Choi, S.W.; et al. Elevation of the Serum Apurinic/Apyrimidinic Endonuclease 1/Redox Factor-1 in Coronary Artery Disease. Korean Circ. J. 2015, 45, 364–371. [Google Scholar] [CrossRef] [PubMed]
- Jin, S.A.; Lim, B.K.; Seo, H.J.; Kim, S.K.; Ahn, K.T.; Jeon, B.H.; Jeong, J.O. Elevation of Serum APE1/Ref-1 in Experimental Murine Myocarditis. Int. J. Mol. Sci. 2017, 18, 2664. [Google Scholar] [CrossRef] [PubMed]
- Park, M.S.; Choi, S.; Lee, Y.R.; Joo, H.K.; Kang, G.; Kim, C.S.; Kim, S.J.; Lee, S.D.; Jeon, B.H. Secreted APE1/Ref-1 inhibits TNF-alpha-stimulated endothelial inflammation via thiol-disulfide exchange in TNF receptor. Sci. Rep. 2016, 6, 23015. [Google Scholar]
- Nath, S.; Roychoudhury, S.; Kling, M.J.; Song, H.; Biswas, P.; Shukla, A.; Band, H.; Joshi, S.; Bhakat, K.K. The extracellular role of DNA damage repair protein APE1 in regulation of IL-6 expression. Cell. Signal. 2017, 39, 18–31. [Google Scholar] [CrossRef]
- Plump, A.S.; Smith, J.D.; Hayek, T.; Aalto-Setala, K.; Walsh, A.; Verstuyft, J.G.; Rubin, E.M.; Breslow, J.L. Severe hypercholesterolemia and atherosclerosis in apolipoprotein E-deficient mice created by homologous recombination in ES cells. Cell 1992, 71, 343–353. [Google Scholar] [CrossRef]
- Zhou, Q.; Liao, J.K. Statins and cardiovascular diseases: From cholesterol lowering to pleiotropy. Curr. Pharm. Des. 2009, 15, 467–478. [Google Scholar] [CrossRef]
- Mohanta, S.; Yin, C.; Weber, C.; Hu, D.; Habenicht, A.J. Aorta Atherosclerosis Lesion Analysis in Hyperlipidemic Mice. Bio Protoc. 2016, 6, e1833. [Google Scholar] [CrossRef]
- Meng, Z.; Wang, M.; Xing, J.; Liu, Y.; Li, H. Myricetin ameliorates atherosclerosis in the low-density-lipoprotein receptor knockout mice by suppression of cholesterol accumulation in macrophage foam cells. Nutr. Metab. 2019, 16, 25. [Google Scholar] [CrossRef] [PubMed]
- Meng, L.B.; Yu, Z.M.; Guo, P.; Wang, Q.Q.; Qi, R.M.; Shan, M.J.; Lv, J.; Gong, T. Neutrophils and neutrophil-lymphocyte ratio: Inflammatory markers associated with intimal-media thickness of atherosclerosis. Thromb. Res. 2018, 170, 45–52. [Google Scholar] [CrossRef] [PubMed]
- Corriere, T.; Di Marca, S.; Cataudella, E.; Pulvirenti, A.; Alaimo, S.; Stancanelli, B.; Malatino, L. Neutrophil-to-Lymphocyte Ratio is a strong predictor of atherosclerotic carotid plaques in older adults. Nutr. Metab. Cardiovasc. Dis. 2018, 28, 23–27. [Google Scholar] [CrossRef] [PubMed]
- Ley, K.; Huo, Y. VCAM-1 is critical in atherosclerosis. J. Clin. Investig. 2001, 107, 1209–1210. [Google Scholar] [CrossRef]
- Papaspyridonos, M.; McNeill, E.; De Bono, J.P.; Smith, A.; Burnand, K.G.; Channon, K.M.; Greaves, D.R. Galectin-3 is an amplifier of inflammation in atherosclerotic plaque progression through macrophage activation and monocyte chemoattraction. Arterioscler. Thromb. Vasc. Biol. 2008, 28, 433–440. [Google Scholar] [CrossRef]
- Ho, M.K.; Springer, T.A. Mac-2, a novel 32,000 Mr mouse macrophage subpopulation-specific antigen defined by monoclonal antibodies. J. Immunol. 1982, 128, 1221–1228. [Google Scholar]
- Leenen, P.J.; De Bruijn, M.F.; Voerman, J.S.; Campbell, P.A.; Van Ewijk, W. Markers of mouse macrophage development detected by monoclonal antibodies. J. Immunol. Methods 1994, 174, 5–19. [Google Scholar] [CrossRef]
- Reddick, R.L.; Zhang, S.H.; Maeda, N. Atherosclerosis in mice lacking apo E. Evaluation of lesional development and progression. Arterioscler. Thromb. 1994, 14, 141–147. [Google Scholar] [CrossRef]
- Rong, J.X.; Li, J.; Reis, E.D.; Choudhury, R.P.; Dansky, H.M.; Elmalem, V.I.; Fallon, J.T.; Breslow, J.L.; Fisher, E.A. Elevating high-density lipoprotein cholesterol in apolipoprotein E-deficient mice remodels advanced atherosclerotic lesions by decreasing macrophage and increasing smooth muscle cell content. Circulation 2001, 104, 2447–2452. [Google Scholar] [CrossRef]
- Muller, A.M.; Hermanns, M.I.; Skrzynski, C.; Nesslinger, M.; Muller, K.M.; Kirkpatrick, C.J. Expression of the endothelial markers PECAM-1, vWf, and CD34 in vivo and in vitro. Exp. Mol. Pathol. 2002, 72, 221–229. [Google Scholar] [CrossRef]
- Winder, S.J.; Sutherland, C.; Walsh, M.P. Biochemical and functional characterization of smooth muscle calponin. Adv. Exp. Med. Biol. 1991, 304, 37–51. [Google Scholar] [PubMed]
- Patino, R.; Ibarra, J.; Rodriguez, A.; Yague, M.R.; Pintor, E.; Fernandez-Cruz, A.; Figueredo, A. Circulating monocytes in patients with diabetes mellitus, arterial disease, and increased CD14 expression. Am. J. Cardiol. 2000, 85, 1288–1291. [Google Scholar] [CrossRef]
- Guasti, L.; Dentali, F.; Castiglioni, L.; Maroni, L.; Marino, F.; Squizzato, A.; Ageno, W.; Gianni, M.; Gaudio, G.; Grandi, A.M.; et al. Neutrophils and clinical outcomes in patients with acute coronary syndromes and/or cardiac revascularisation. A systematic review on more than 34,000 subjects. Thromb. Haemost. 2011, 106, 591–599. [Google Scholar] [CrossRef] [PubMed]
- Balta, S.; Demirkol, S.; Unlu, M.; Arslan, Z.; Celik, T. Neutrophil to lymphocyte ratio may be predict of mortality in all conditions. Br. J. Cancer 2013, 109, 3125–3126. [Google Scholar] [CrossRef]
- Horne, B.D.; Anderson, J.L.; John, J.M.; Weaver, A.; Bair, T.L.; Jensen, K.R.; Renlund, D.G.; Muhlestein, J.B.; Intermountain Heart Collaborative Study Group. Which white blood cell subtypes predict increased cardiovascular risk? J. Am. Coll. Cardiol. 2005, 45, 1638–1643. [Google Scholar] [CrossRef]
- Song, S.H.; Cho, E.J.; Park, M.S.; Lee, Y.R.; Joo, H.K.; Kang, G.; Kang, S.K.; Choi, S.; Jeon, B.H. Redox Regulating Protein APE1/Ref-1 Expression is Increased in Abdominal Aortic Coarctation-induced Hypertension Rats. J. Korean Soc. Hypertens 2012, 18, 126–135. [Google Scholar] [CrossRef]
- Martinet, W.; Knaapen, M.W.; De Meyer, G.R.; Herman, A.G.; Kockx, M.M. Elevated levels of oxidative DNA damage and DNA repair enzymes in human atherosclerotic plaques. Circulation 2002, 106, 927–932. [Google Scholar] [CrossRef]
- Stroes, E.; Kastelein, J.; Cosentino, F.; Erkelens, W.; Wever, R.; Koomans, H.; Luscher, T.; Rabelink, T. Tetrahydrobiopterin restores endothelial function in hypercholesterolemia. J. Clin. Investig. 1997, 99, 41–46. [Google Scholar] [CrossRef]
- Laursen, J.B.; Somers, M.; Kurz, S.; McCann, L.; Warnholtz, A.; Freeman, B.A.; Tarpey, M.; Fukai, T.; Harrison, D.G. Endothelial regulation of vasomotion in apoE-deficient mice: Implications for interactions between peroxynitrite and tetrahydrobiopterin. Circulation 2001, 103, 1282–1288. [Google Scholar] [CrossRef]
- Landmesser, U.; Hornig, B.; Drexler, H. Endothelial function: A critical determinant in atherosclerosis? Circulation 2004, 109, II27–II33. [Google Scholar] [CrossRef]
- Bonthu, S.; Heistad, D.D.; Chappell, D.A.; Lamping, K.G.; Faraci, F.M. Atherosclerosis, vascular remodeling, and impairment of endothelium-dependent relaxation in genetically altered hyperlipidemic mice. Arterioscler. Thromb. Vasc. Biol. 1997, 17, 2333–2340. [Google Scholar] [CrossRef] [PubMed]
- Shah, A.; Gray, K.; Figg, N.; Finigan, A.; Starks, L.; Bennett, M. Defective Base Excision Repair of Oxidative DNA Damage in Vascular Smooth Muscle Cells Promotes Atherosclerosis. Circulation 2018, 138, 1446–1462. [Google Scholar] [CrossRef] [PubMed]
- Fritz, G.; Grosch, S.; Tomicic, M.; Kaina, B. APE/Ref-1 and the mammalian response to genotoxic stress. Toxicology 2003, 193, 67–78. [Google Scholar] [CrossRef]
- Grosch, S.; Kaina, B. Transcriptional activation of apurinic/apyrimidinic endonuclease (Ape, Ref-1) by oxidative stress requires CREB. Biochem. Biophys. Res. Commun. 1999, 261, 859–863. [Google Scholar] [CrossRef] [PubMed]
- Ramana, C.V.; Boldogh, I.; Izumi, T.; Mitra, S. Activation of apurinic/apyrimidinic endonuclease in human cells by reactive oxygen species and its correlation with their adaptive response to genotoxicity of free radicals. Proc. Natl. Acad. Sci. USA 1998, 95, 5061–5066. [Google Scholar] [CrossRef] [PubMed]
- Lee, Y.R.; Joo, H.K.; Lee, E.O.; Cho, H.S.; Choi, S.; Kim, C.S.; Jeon, B.H. ATP Binding Cassette Transporter A1 is Involved in Extracellular Secretion of Acetylated APE1/Ref-1. Int. J. Mol. Sci. 2019, 20, 3178. [Google Scholar] [CrossRef] [PubMed]
- Lee, Y.R.; Kim, K.M.; Jeon, B.H.; Choi, S. Extracellularly secreted APE1/Ref-1 triggers apoptosis in triple-negative breast cancer cells via RAGE binding, which is mediated through acetylation. Oncotarget 2015, 6, 23383–23398. [Google Scholar] [CrossRef]
- MacKinnon, A.C.; Liu, X.; Hadoke, P.W.; Miller, M.R.; Newby, D.E.; Sethi, T. Inhibition of galectin-3 reduces atherosclerosis in apolipoprotein E-deficient mice. Glycobiology 2013, 23, 654–663. [Google Scholar] [CrossRef]
- Nachtigal, M.; Al-Assaad, Z.; Mayer, E.P.; Kim, K.; Monsigny, M. Galectin-3 expression in human atherosclerotic lesions. Am. J. Pathol. 1998, 152, 1199–1208. [Google Scholar]
- Arar, C.; Gaudin, J.C.; Capron, L.; Legrand, A. Galectin-3 gene (LGALS3) expression in experimental atherosclerosis and cultured smooth muscle cells. FEBS Lett. 1998, 430, 307–311. [Google Scholar] [CrossRef]
- Madrigal-Matute, J.; Lindholt, J.S.; Fernandez-Garcia, C.E.; Benito-Martin, A.; Burillo, E.; Zalba, G.; Beloqui, O.; Llamas-Granda, P.; Ortiz, A.; Egido, J.; et al. Galectin-3, a biomarker linking oxidative stress and inflammation with the clinical outcomes of patients with atherothrombosis. J. Am. Heart Assoc. 2014, 3, e000785. [Google Scholar] [CrossRef]
- Cabanas, C.; Sanchez-Madrid, F.; Bellon, T.; Figdor, C.G.; Te Velde, A.A.; Fernandez, J.M.; Acevedo, A.; Bernabeu, C. Characterization of a novel myeloid antigen regulated during differentiation of monocytic cells. Eur. J. Immunol. 1989, 19, 1373–1378. [Google Scholar] [CrossRef]
- Lertkiatmongkol, P.; Liao, D.; Mei, H.; Hu, Y.; Newman, P.J. Endothelial functions of platelet/endothelial cell adhesion molecule-1 (CD31). Curr. Opin. Hematol. 2016, 23, 253–259. [Google Scholar] [CrossRef]
- Lee, H.M.; Jeon, B.H.; Won, K.J.; Lee, C.K.; Park, T.K.; Choi, W.S.; Bae, Y.M.; Kim, H.S.; Lee, S.K.; Park, S.H.; et al. Gene transfer of redox factor-1 inhibits neointimal formation: Involvement of platelet-derived growth factor-beta receptor signaling via the inhibition of the reactive oxygen species-mediated Syk pathway. Circ. Res. 2009, 104, 219–227, 215p following 227. [Google Scholar] [CrossRef]
- Lee, S.K.; Chung, J.I.; Park, M.S.; Joo, H.K.; Lee, E.J.; Cho, E.J.; Park, J.B.; Ryoo, S.; Irani, K.; Jeon, B.H. Apurinic/apyrimidinic endonuclease 1 inhibits protein kinase C-mediated p66shc phosphorylation and vasoconstriction. Cardiovasc. Res. 2011, 91, 502–509. [Google Scholar] [CrossRef]
- Bjornheden, T.; Levin, M.; Evaldsson, M.; Wiklund, O. Evidence of hypoxic areas within the arterial wall in vivo. Arterioscler. Thromb. Vasc. Biol. 1999, 19, 870–876. [Google Scholar] [CrossRef]
- Logsdon, D.P.; Grimard, M.; Luo, M.; Shahda, S.; Jiang, Y.; Tong, Y.; Yu, Z.; Zyromski, N.; Schipani, E.; Carta, F.; et al. Regulation of HIF1alpha under Hypoxia by APE1/Ref-1 Impacts CA9 Expression: Dual Targeting in Patient-Derived 3D Pancreatic Cancer Models. Mol. Cancer Ther. 2016, 15, 2722–2732. [Google Scholar] [CrossRef]
- Nie, P.; Li, D.; Hu, L.; Jin, S.; Yu, Y.; Cai, Z.; Shao, Q.; Shen, J.; Yi, J.; Xiao, H.; et al. Atorvastatin improves plaque stability in ApoE-knockout mice by regulating chemokines and chemokine receptors. PLoS ONE 2014, 9, e97009. [Google Scholar] [CrossRef]


| Hematologic Parameters with Plasma APE1/Ref-1 | Between Wild Type, ApoE−/− Mice Fed Normal Diet and Western Type Diet (WT, ND and WD) | Between ApoE−/− Mice Fed Western-Type Diet and Atorvastatin-Treated Group (WD and WD + statin) | ||||
|---|---|---|---|---|---|---|
| r | 95% CI a | p Value | r | 95% CI a | p Value | |
| Total cholesterol | 0.609 | 0.213 to 0.833 | 0.006 | 0.366 | −0.106 to 0.703 | n.s |
| Low density lipoprotein | 0.616 | 0.224 to 0.836 | 0.005 | 0.277 | −0.203 to 0.649 | n.s |
| Triglyceride | 0.288 | −0.192 to 0.656 | n.s | −0.055 | −0.497 to 0.409 | n.s |
| monocyte | 0.382 | −0.088 to 0.712 | n.s | 0.059 | −0.406 to 0.500 | n.s |
| Neutrophil | 0.313 | −0.165 to 0.671 | n.s | 0.611 | 0.217 to 0.834 | 0.005 |
| Lymphocyte | -0.347 | −0.692 to 0.127 | n.s | −0.616 | −0.836 to −0.224 | 0.005 |
| Neutrophil/lymphocyte ratio | 0.633 | 0.251 to 0.845 | 0.004 | 0.786 | 0.515 to 0.914 | <0.001 |
© 2020 by the authors. Licensee MDPI, Basel, Switzerland. This article is an open access article distributed under the terms and conditions of the Creative Commons Attribution (CC BY) license (http://creativecommons.org/licenses/by/4.0/).
Share and Cite
Lee, Y.R.; Joo, H.K.; Lee, E.-O.; Park, M.S.; Cho, H.S.; Kim, S.; Jin, H.; Jeong, J.-O.; Kim, C.-S.; Jeon, B.H. Plasma APE1/Ref-1 Correlates with Atherosclerotic Inflammation in ApoE−/− Mice. Biomedicines 2020, 8, 366. https://doi.org/10.3390/biomedicines8090366
Lee YR, Joo HK, Lee E-O, Park MS, Cho HS, Kim S, Jin H, Jeong J-O, Kim C-S, Jeon BH. Plasma APE1/Ref-1 Correlates with Atherosclerotic Inflammation in ApoE−/− Mice. Biomedicines. 2020; 8(9):366. https://doi.org/10.3390/biomedicines8090366
Chicago/Turabian StyleLee, Yu Ran, Hee Kyoung Joo, Eun-Ok Lee, Myoung Soo Park, Hyun Sil Cho, Sungmin Kim, Hao Jin, Jin-Ok Jeong, Cuk-Seong Kim, and Byeong Hwa Jeon. 2020. "Plasma APE1/Ref-1 Correlates with Atherosclerotic Inflammation in ApoE−/− Mice" Biomedicines 8, no. 9: 366. https://doi.org/10.3390/biomedicines8090366
APA StyleLee, Y. R., Joo, H. K., Lee, E.-O., Park, M. S., Cho, H. S., Kim, S., Jin, H., Jeong, J.-O., Kim, C.-S., & Jeon, B. H. (2020). Plasma APE1/Ref-1 Correlates with Atherosclerotic Inflammation in ApoE−/− Mice. Biomedicines, 8(9), 366. https://doi.org/10.3390/biomedicines8090366