Article

Association between Serum Zinc and Calcification Propensity (T50) in Patients with Type 2 Diabetes Mellitus and In Vitro Effect of Exogenous Zinc on T50

1
Department of Metabolism, Endocrinology and Molecular Medicine, Osaka City University Graduate School of Medicine, 1-4-3 Asahi-machi, Abeno-ku, Osaka 545-8585, Japan
2
Department of Nephrology, Osaka City University Graduate School of Medicine, 1-4-3 Asahi-machi, Abeno-ku, Osaka 545-8585, Japan
3
Division of Internal Medicine, Inoue Hospital, 16-17 enoki-machi, Osaka 564-0053, Japan
4
Department of Vascular Medicine, Osaka City University Graduate School of Medicine, 1-4-3 Asahi-machi, Osaka 545-8585, Japan
5
Vascular Science Center for Translational Research, Osaka City University Graduate School of Medicine, 1-4-3 Asahi-machi, Abeno-ku, Osaka 545-8585, Japan
*
Author to whom correspondence should be addressed.
Biomedicines 2020, 8(9), 337; https://doi.org/10.3390/biomedicines8090337
Submission received: 31 August 2020 / Revised: 6 September 2020 / Accepted: 8 September 2020 / Published: 9 September 2020
(This article belongs to the Section Molecular and Translational Medicine)

Abstract

:
Zinc inhibits vascular calcification in vivo and in vitro. Patients with type 2 diabetes mellitus show hypozincemia and are at an elevated risk of cardiovascular events. Recently, an in vitro test (T50-test) was developed for determination of serum calcification propensity and a shorter T50 means a higher calcification propensity. This cross-sectional study investigated the association between serum zinc and T50 in 132 type 2 diabetes mellitus patients with various kidney functions. Furthermore, the effect of exogenous zinc on T50 was also investigated in vitro using separately pooled serum samples obtained from healthy volunteers and patients with hemodialysis. We measured T50 levels using the established nephelometric method. The median (interquartile range) levels of T50 and serum zinc were 306 (269 to 332) min, and 80.0 (70.1 to 89.8) µg/dL, respectively. Serum zinc level showed a weak, but positive correlation with T50 (rs = 0.219, p = 0.012). This association remained significant in multivariable-adjusted analysis, and was independent of known factors including phosphate, calcium, and magnesium. Kidney function and glycemic control were not significantly associated with T50. Finally, in vitro experiments showed that addition of a physiological concentration of exogenous zinc chloride significantly increased serum T50. Our results indicate that serum zinc is an independent factor with a potential role in suppressing calcification propensity in serum.

1. Introduction

Vascular calcification is common and contributes to cardiovascular mortality in patients with type 2 diabetes mellitus [1,2], as well as those with chronic kidney disease [3,4]. Excess cardiovascular morbidity and mortality in those patients could be explained by redistribution and/or overload of calcium and phosphorus. Primarily, the mechanism of vascular calcification is supposed to be due to ectopic deposition of hydroxyapatite [5,6] induced by increased calcium-phosphorus product (Ca × P) in serum [7,8], which are common under renal dysfunction. In addition, imbalanced-calcification regulators may be involved in vascular calcification [3,9]. For example, bone morphogenetic protein-2 (BMP-2), oxidized lipids, and inflammation are known to accelerate vascular calcification [10]. In contrast, it has been reported that matrix Gla protein (MGP), osteoprotegerin, and osteopontin act on the vascular wall as calcification inhibitors [11].
Intense research has also suggested active regulated mechanisms of vascular calcification similar to osteogenesis. Previous studies reported trans-differentiation of vascular smooth muscle cells (VSMCs) into osteoblast-like cells [12,13]. During the process of vascular calcification, VSMCs seem to lose their original contractile phenotypes and alternatively express bone-related genes. Indeed, expressions of BMP-2 and osteopontin were confirmed in human arterial walls. In contrast to these extracellular factors, recent work focused on runt-related transcription factor 2 (Runx2), an essential transcriptional factor in osteogenesis. Runx2 appears to be involved in repression of the primary VSMC phenotype, in addition to acceleration of the osteogenic phenotype [14].
Except for trans-differentiation of VSMCs, degradation of matrix proteins such as elastin, may be associated with the progression of vascular calcification. That is, degradation of elastin by metalloproteinases (MMPs) provides a scaffold for precipitation of hydroxyapatites. Notably, high-glucose condition might accelerate vascular calcification through elastin degradation by MMPs. Compared to subjects without diabetes, patients with diabetes have upregulated MMPs in the arterial wall and higher plasma levels of MMPs [15,16]. Therefore, it is speculated that diabetic condition and renal dysfunction share some common causal pathways leading to vascular calcification.
In serum, precipitation of supersaturated calcium and phosphate is prevented by the formation of amorphous primary calciprotein particles [17,18]. Primary calciprotein particles spontaneously convert into secondary calciprotein particles, containing crystalline hydroxyapatite [17,18]. An in vitro test (T50-test) for determination of serum calcification propensity has been developed [19]. This assay measures time required for primary calciprotein particles to transform into secondary calciprotein particles in the presence of supersaturating doses of calcium and phosphate, which increase turbidity of samples. Serum T50 can be measured by laser light scatter in turbid samples using nephelometry. Thus, a shorter T50 means a higher calcification propensity. Previous studies have shown that lower T50 predicts vascular stiffness progression and all-cause mortality in patients with chronic kidney disease stage 3 and 4 [20], and all- cause mortality and cardiovascular composite endpoint in hemodialysis patients [21]. A lower T50 was also shown to predict cardiovascular and all-cause mortality in renal transplant recipients [22,23]. While it remains unclear how well in vitro T50 assay results represent the mineralization process in vivo. T50 results have been shown to represent arterial calcification, arterial stiffness, cardiovascular outcomes, and mortality in at least 18 observational and 11 interventional studies [24]. Thus, this assay is considered able to provide novel and clinically important information.
Serum T50 is dependent on the complex interplay of pro-calcifying (i.e., calcium and phosphate) and anti-calcifying serum components (i.e., magnesium and albumin) [19]. Among them, a higher serum phosphate level was the factor most closely associated with lower T50 [21,25]. Phosphate has been reported to induce calcification of VSMCs in vitro [26]. Hyperphosphatemia is a risk factor for vascular calcification and cardiovascular mortality, not only in patients with chronic kidney disease [27], but also in the general population [28]. Thus, suppression of phosphate-induced vascular calcification is clinically important.
Zinc, an essential micronutrient that has catalytic, structural, and regulatory roles [29,30], is absorbed by enterocytes via the intestinal zinc transporter and reaches the bloodstream via basolateral membrane zinc transporter 1, where it binds to albumin in plasma, and can be eliminated by different routes, such as urine and sweat [31]. In insulin-dependent diabetes mellitus patients, urinary zinc levels are higher as compared to healthy individuals, while gastrointestinal absorption of zinc has also been shown to be decreased in those diabetic patients [32]. In other studies, the level of zinc in blood was found to be lower in patients with type 2 diabetes mellitus as compared to non-diabetic subjects [33,34,35]. Zinc deficiency is involved in development and progression of diabetes and zinc supplementation can improve the status of diabetes mellitus and its related complications [36]. A previous meta-analysis of zinc supplementation in patients with type 2 diabetes mellitus provided supportive evidence showing its hypoglycemic and lipid lowering effects [37]. In addition, zinc was recently found to inhibit phosphate-induced vascular calcification, in vitro and in vivo [38].
To date, no reports of association between serum zinc and calcification propensity in patients with type 2 diabetes mellitus have been presented. However, previous studies raise the hypothesis that zinc may be one of the factors affecting serum calcification propensity. To test the hypothesis, we examined the association between serum zinc and T50 levels in patients with type 2 diabetes mellitus. We also performed in vitro experiments to investigate the effect of increased zinc concentration on T50 in separately pooled serum samples obtained from healthy volunteers and hemodialysis patients.

2. Materials and Methods

2.1. Study Design

This study was comprised of two parts. The first was a cross-sectional study using clinical data derived from our previous study of 143 patients with type 2 diabetes mellitus [39], while the second part was an in vitro study of the effect of increased zinc concentration on T50 assay findings, which was conducted using separately pooled serum samples obtained from healthy volunteers and patients with hemodialysis. Such pooled serum samples are routinely measured as a quality control for the T50 assay. Since the in vitro experiments required a serum quantity of at least 1500 µL pooled serum samples were used.

2.2. Ethics Statement

This study followed the ethical guidelines for medical and health research involving human subjects by the Japanese Ministry of Health, Labour and Welfare, and the Declaration of Helsinki. This study was approved by the Ethics Committee of Osaka City University Graduate School of Medicine (approval number 4100, approved on 29 June 2018). Opt-out option for informed consent was performed as explained in instructions posted on the website of the institution.

2.3. Participants of the Cross Sectional Study

The inclusion and exclusion criteria for the clinical study were previously described [39]. Patients with type 1 diabetes or other types of diabetes were not included in this study. For this analysis, we excluded 11 participants because data regarding serum T50 and zinc were not available thus, 132 patients were included.

2.4. Physical and Laboratory Measurements, and Other Clinical Infromation

Blood pressure was determined using an automatic sphygmomanometer (Terumo Co., Ltd., Tokyo, Japan) with a conventional cuff after the subjects had rested for at least 5 min. All blood and urine samples were collected in the morning after an overnight fast for 12 h. Serum and urinary creatinine levels were measured by an enzymatic method. Urinary albumin was measured by an immunoturbidimetry. Serum zinc levels were measured by a commercial laboratory (SRL Co., Ltd., Tokyo, Japan). Hemoglobin A1c was assessed as the National Glycohemoglobin Standardization Program equivalent value (NGSP, %) according to the guidelines of the Japan Diabetes Society [40]. The diagnosis of type 2 diabetes mellitus was based on medical records and the criteria for diabetes mellitus as defined in the Report of the Expert Committee on the Diagnosis and Classification of Diabetes Mellitus [41]. Renal function was assessed by estimated glomerular filtration rate (eGFR) using a formula for the Japanese [42]. In this study serum calcium denotes calcium level adjusted for serum albumin according to Payne et al. [43]. Urinary albumin to creatinine ratio was calculated as an index of albuminuria. Other measurements were obtained using routine laboratory methods at Osaka City University Hospital.
We collected information on age, sex, height, weight, duration of diabetes, current medications, past history of cardiovascular disease (coronary artery disease, peripheral artery disease, aortic disease, and congestive heart failure requiring hospitalization), smoking habit, and laboratory data by asking the participants and/or by reviewing their medical records.

2.5. Devices, Plastic Materials, and Chemicals

The Nephelostar Plus microplate reader with 2 built-in Reagent injectors and MARS software was obtained from BMG Labtech (Offenburg, Germany) and 96-well plates and 96-well plastic covers were from Corning (Kennebunk, ME, USA). All chemicals (NaCl, Tris, Hepes, CaCl2, NaH2PO4, Na2HPO4, NaOH, ZnCl2) were pro-analysis -grade quality and purchased from Wako Pure Chemical Industries, Ltd. (Osaka, Japan).

2.6. Determination of Calcification Propensity (T50)

As previously reported [19], calcification propensity (T50) was evaluated by overloading of calcium and phosphate into serum, in vitro. According to the original method [19], we prepared three stock solutions as follows: (1) NaCl solution: 140 mM NaCl, (2) Calcium solution: 40 mM CaCl2 + 100 mM HEPES + 140 mM NaCl pH-adjusted with 10 M NaOH to 7.40 at 37 °C, and (3) Phosphate solute on: 19.44 mM Na2HPO4 + 4.56 mM NaH2PO4 + 100 mM HEPES + 140 mM NaCl pH-adjusted with 10 M NaOH to 7.40 at 37 °C. For preparation of 96-well plates, all solutions were prewarmed to 34.5 °C in a thermoconstant room.
Serum T50 levels were measured as follows: (1) All stock solutions were prewarmed to 34.5 °C, in a thermocnstant room, (2) In the 96-well plates, 20 µL of NaCl stock solution and 80 µL of serum were mixed in each well, (3) Shacked gently for 1 min, (4) Fifty µL of phosphate stock solution were added and shacked for 1 min, automatically, (5) Fifty µL of calcium stock solutions were added and shacked for 1 min. The final concentrations of calcium and phosphate in each sample were 10 mM and 6 mM, respectively, (6) The 96 wells were covers with a thin seal adhesive sealing film microplate. Because in the outermost lines and rows of the 96 well plate often showed unreliable result in the previous study, these lines were not used in the present study [19].
Serum T50 was determined in duplicate over a period of 600 min per measurement using a nephelometer (Nephelostar Plus®, BMG Labtech, Saitama, Japan) with an internal measurement temperature of 36.5 °C to 37 °C. The setting of the Nephelostar was described as previously [19]. The measurement results were analyzed by the MARS software (BMG Labtech, Saitama, Japan).
All serum samples were measured in a blinded manner. Serum samples from healthy volunteers and dialysis patients were also measured as quality control in serum calcification assay. The coefficients of variation (CV) of inter- and intra-assay were 4.4% and 4.5% for healthy control serum, and 3.2% and 4.5% for hemodialysis control serum.

2.7. In Vitro Experiment to Examine Direct Effect of Exogenous Zinc on T50

As the second part of this study, we conducted in vitro experiments to examine the direct effect of exogenous zinc on T50 measurement. For this, two pooled serum samples, one from healthy volunteers and another from hemodialysis patients, were used. As described above, 80 µL of each serum sample was mixed with 20 µL of NaCl stock solution, 50 µL of phosphate stock solution, and 50 µL of calcium stock solution in a 96-well plate. To the 200 µL of T50 assay mixture, 2 µL of one of the following solutions was added; (a) distilled water (vehicle, final zinc concentration = 0 µM), (b) 1 mM ZnCl2 (final zinc concentration = 10 µM), or (c) 2 mM ZnCl2 (final zinc concentration = 20 µM). After gentle agitation, the plate was sealed with thin film to prevent evaporation, and then incubation was performed at 36.5 °C to 37 °C for measurement of T50.

2.8. Statistics

For the clinical study, we summarized continuous variables as medians (interquartile ranges, IQRs) and categorical variables as numbers and percentages. Correlations were analyzed according to the nonparametric Spearman’s rank correlation test. Independent associations between the variables and serum T50 were assessed by multiple regression analysis. For in vitro experiments in which ZnCl2 was added, T50 was expressed as the mean (SD) of triplicate determinations, and comparison was made by one-way analysis of variance followed by Tukey’s test. These statistical analyses were performed using GraphPad Prism version 6.0 (GraphPad Software, San Diego, CA, USA) or JMP software version 10 (SAS Institute, Inc., Cary, NC, USA). p-values < 0.05 by two-sided tests were considered statistically significant.

3. Results

3.1. Clinical Characteristics of Type 2 Diabetes Patients

Table 1 summarizes the clinical characteristics of the 132 patients with type 2 diabetes mellitus. The age [median (interquartile range)] was 71 (65 to 75) years and 59.1% of the participants were men. Their eGFR [59.0 (37.6 to 73.9) mL/min/1.73 m2] and urinary albumin to creatinine ratio [17 (6 to 212) mg/gCr] showed wide distributions. T50 and serum zinc levels were 306 (269 to 332) min and 80.0 (70.1 to 89.8) µg/dL, respectively.

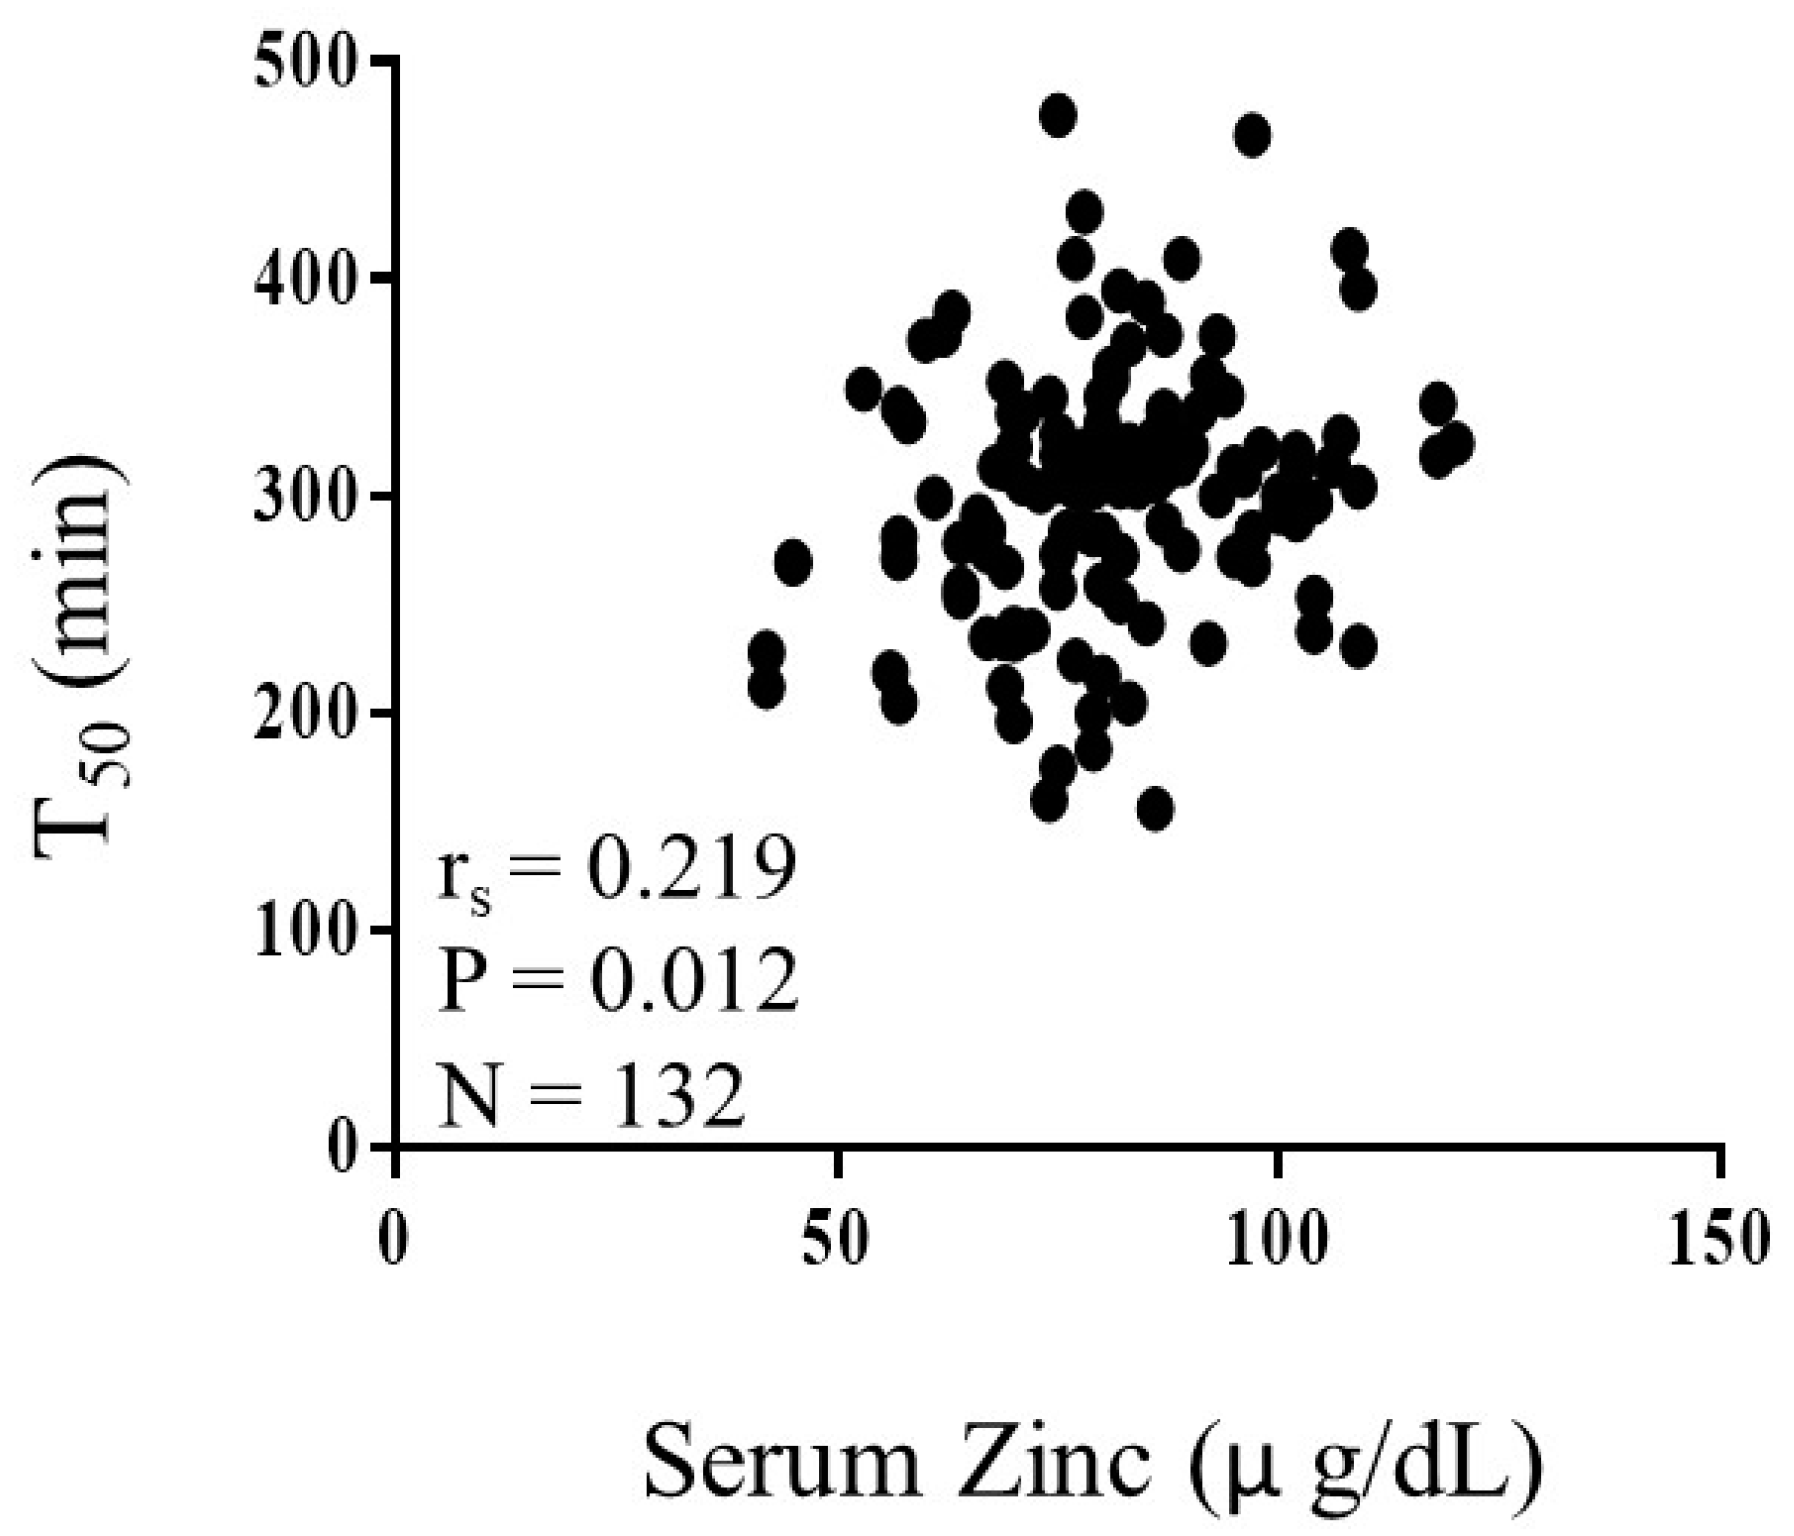
3.2. Correlations between Serum Calcification Propensity and Clinical Factors in Patients with Type 2 Diabetes Mellitus

Table 2 shows the unadjusted correlations between serum T50 levels and various clinical parameters in type 2 diabetes patients. While serum T50 was weakly, but positively correlated with zinc (rs = 0.219, p = 0.012, Figure 1), eGFR (rs = 0.199, p = 0.022), and fasting plasma glucose (rs = 0.282, p = 0.001), it was not significantly correlated with serum magnesium or hemoglobin A1c. Serum T50 level was negatively correlated with urinary albumin-creatinine ratio (rs = −0.247, p = 0.004), blood urea nitrogen (rs = −0.213, p = 0.011), and serum phosphate (rs = −0.227, p = 0.009).

3.3. Independent Association between Serum Calcification Propensity and Zinc in Patients with Type 2 Diabetes Mellitus

We examined whether serum zinc level was a factor associated with serum T50, independent of traditional mineral makers including phosphate, calcium and magnesium, using multiple regression analysis (Table 3). Model 1 included age, sex, any prior cardiovascular disease, current smoking, urinary albumin creatinine ratio, eGFR, corrected calcium, phosphate, magnesium, zinc, and hemoglobin A1c as explanatory variables, with hemoglobin A1c being replaced by plasma glucose in Model 2. Urinary albumin, eGFR and hemoglobin A1c or fasting plasma glucose were not significantly associated with serum T50. In contrast, serum corrected calcium, phosphate, and magnesium were significantly associated with serum T50. Serum Zinc level was also found to be associated significantly and positively with T50 in both Model 1 (β = 0.213, p = 0.038) and Model 2 (β = 0.229, p = 0.024).

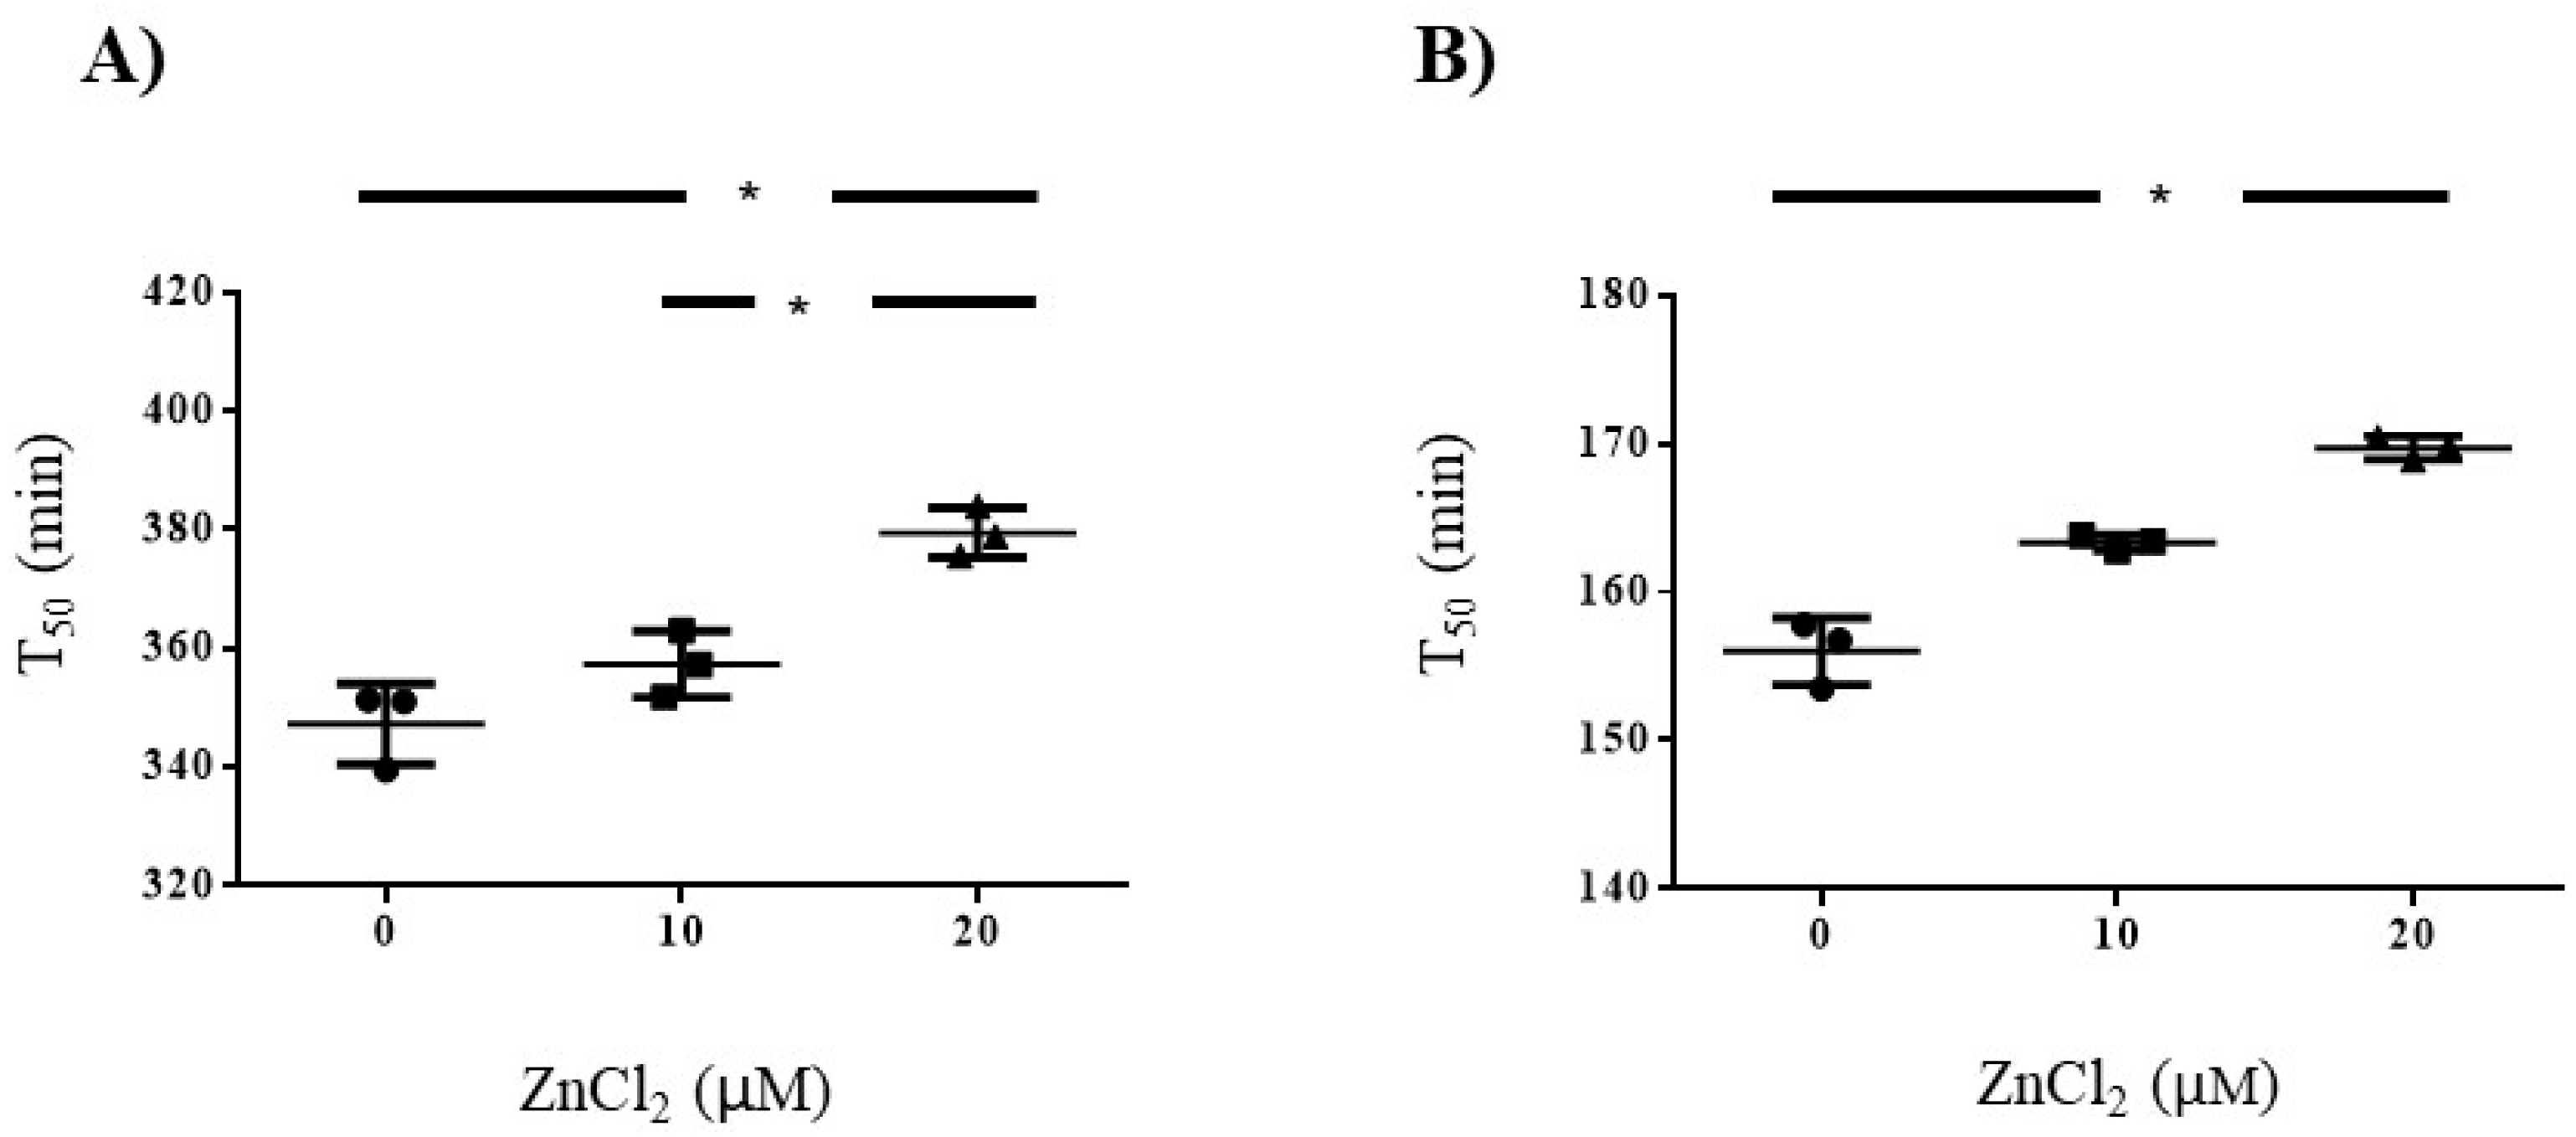
3.4. Influence of Zinc on Serum Calcification Propensity in Pooled Serum Samples Volunterres from Healthy Volunteers and Patients with Hemodialysis

To examine whether zinc directly increases serum T50, zinc was added in the serum calcification propensity assay, in serum obtained from healthy volunteers and patients with hemodialysis, respectively. Supplemental Table S1 summarizes the clinical characteristics of the pooled serum samples from the two groups. Addition of exogenous ZnCl2 significantly modified the T50 level in pooled serum from healthy subjects (0 µM, 347 ± 0.8 min; 10 µM, 357 ± 5.6 min; and 20 µM, 379.5 ± 4.2 min; p < 0.001, Figure 2A), and pooled serum from dialysis patients (0 µM, 156 ± 2.3 min; 10 µM, 163 ± 0.5 min; and 20 µM, 170 ± 0.8 min, p < 0.001, Figure 2B), respectively.

4. Discussion

This is the first study to investigate the association between serum calcification propensity and zinc levels in patients with type 2 diabetes mellitus. Serum zinc level was significantly and positively correlated with serum T50 in the present study. The positive correlation between serum zinc level and T50 was also shown in the previous study including healthy subjects and patients with chronic kidney disease [38]. However, prior to the present investigation, whether serum zinc level is an independent factor associated with serum T50 was not examined. We showed that serum zinc level of the patients with type 2 diabetes mellitus was positively associated with T50 independent of calcium, phosphate, and magnesium, in the multiple regression analysis. These novel findings suggest that zinc has the potential role in suppressing calcification propensity in serum.
In the second part of the present study, we also confirmed that addition of zinc increases serum T50 in separately pooled serum obtained from healthy volunteers and patients with hemodialysis. However, the mechanisms underlying zinc inhibition of serum calcification propensity remain unclear. Even in polyethylene glycol hydrogels, not in serum, zinc was shown to inhibit the transformation of amorphous calcium phosphate (ACP) into hydroxyapatite [44]. In additive -free composite, ACP transformed into brushite within minutes. In contrast, in the presence of zinc, zinc-doped ACP was very stable and did not show any signs of crystallization for up to 20 days. In ACP, zinc ion readily substitutes calcium [45], suppressing crystallization by decreasing solubility [46]. It is thus likely that zinc suppresses the transformation from amorphous primary calciprotein particles into secondary calciprotein particles, containing crystalline hydroxyapatite, in serum.
In a recent study by Voelkl et al., addition of exogenous ZnCl2 (15 µM) did not improve T50 in sera from healthy controls or patients on hemodialysis [38]. The discrepancy between those result and the present may be explained by differences in ZnCl2 concentration. In the present study, we demonstrated that 10 µM ZnCl2 (=60.5 µg/dL) did not significantly modify T50 in serum from hemodialysis patients, which was consistent with the study by Voelkl et al. [38]. In contrast, ZnCl2 at 20 µM (=131 µg/dL), the upper limit of the reference range, significantly increased T50 in those subjects. Crystallization inhibition has been reported to be dependent on zinc concentration in polyethylene glycol hydrogels [44]. Thus, a certain zinc concentration may be required to increase serum T50, because addition of 10 µM of ZnCl2 in the present study or 15 µM of ZnCl2 in that previous study did not increase serum T50 [38].
In patients with type 2 diabetes mellitus, hypomagnesemia and hypozincemia are common, due to reduced intake and/or urinary loss [47,48,49]. In the present study, magnesium was also significantly and positively associated with serum T50. Magnesium is a known anti-calcifying factor, and has been shown to improve serum T50 in vitro [19], while other in vitro findings indicated that it can prevent phosphate-induced calcification in human aortic VSMCs [50]. Similarly, zinc increases zinc finger protein TNF-α-induced protein 3 (TNFAIP3) expression, which subsequently inhibits NF-kB activation and osteo-/chondrogenic reprograming, resulting in suppression of phosphate-induced VSMCs calcification [38]. Another report noted that zinc also inhibits osteochondrogenic phenotypic switch of VSMCs, reflected by reduced phosphate uptake, thus decreasing osteochondrogenic gene expressions of Msx-2, BMP-2, and Sp7, as well as loss of smooth muscle cell-specific markers [51]. That study also demonstrated that zinc preserves the phosphorylation state of Runx2 and Ser451, decreases the level of pyruvate dehydrogenase kinase 4 (PDK4) level, and restores cell viability (Supplemental Figure S1). Together, the present findings of the effect of zinc on serum T50, and the previous reported in vitro effects of zinc on phosphate-induced calcification in VSMCs [38,51], are similar to the effects of magnesium [50]. Although approximately 40% of magnesium binds to albumin or forms a complex with anions, including bicarbonate, phosphate, and citrate, in blood [52], a previous in vitro experiment demonstrated that addition of exogenous magnesium from 0.5 to 1.5 mmol/L increased serum T50 levels [19]. In addition, a recent randomized control trial demonstrated that magnesium supplementation increased serum T50 in patients with stage 3–4 chronic kidney disease [53]. Thus, supplementation with zinc as well as magnesium might be a potential therapeutic option to attenuate serum calcification propensity and the progression of vasculature calcification. Nevertheless, randomized clinical trials are clearly needed before such treatment is recommended.
Albumin is also an anti-calcifying factor associated with serum T50 in vitro [19]. When zinc and albumin were simultaneously included in multiple regression analysis, the significant associations of both factors with serum T50 turned to be non-significant (data not shown). Serum albumin acts as an extracellular zinc buffer that controls zinc concentration in blood, since approximately 75–80% of zinc is bound to albumin, accounting for as much as 98% of the exchangeable fraction of zinc in blood [54,55]. The present study showed that serum albumin is significantly and positively correlated with serum zinc levels in the study, thus a confounding effect might explain the results. Since albumin-bound zinc is exchangeable with other molecules, we speculate that serum albumin confounds the association between serum zinc and T50, at least in part, by an exchange between albumin-bound zinc and calcium.
Several studies have demonstrated that zinc supplementation of 30–100 mg per day increases serum zinc levels in patients with type 2 diabetes mellitus [56,57,58,59]. Meta-analyses of randomized controlled trials involving patients with type 2 diabetes mellitus revealed improvements in glycemic control [60] and dyslipidemia [61] following zinc supplementation. In patients with type 2 diabetes, the antioxidant effects of zinc supplementation have also been recognized [59]. In addition, a prior cohort study demonstrated that lower serum zinc level was an independent factor for coronary heart disease events in patients with type 2 diabetes mellitus [62]. Hence, the effects of zinc for glycemic control, lipid metabolism, antioxidants, and mineralization may contribute to suppress atherosclerosis and vascular calcification associated with type 2 diabetes mellitus. In contrast, other studies of general populations have shown that sustained hyperzincemia may predispose individuals to thrombogenesis [63], prostate cancer [64], and immune dysfunction [65]. In terms of atherosclerosis, there would be a trade-off between the thrombogenic adverse effect of zinc and its anti-arteriosclerotic effects including lipid metabolism and mineralization. Practical guidelines of zinc deficiency in Japan note the potential adverse effects of zinc therapy, including nausea, vomiting, itching, copper deficiency related anemia, and leukopenia [30]. Monitoring of serum zinc level is required to avoid these adverse effects including thrombosis in patients with zinc deficiency.
The present study has several limitations. First, the number of subjects examined and r values obtained in each correlation analysis were relatively low, possibly due to the limitation of the clinical study setting. Second, we cannot be sure whether the findings of this cross-sectional investigation are applicable to non-diabetic patients, or if the findings of in vitro experiments are also applicable for diabetic patients, since we did not perform in vitro experiments to add exogenous zinc to each patient in type 2 diabetes mellitus in the present study. Third, due to the cross-sectional design, the findings only demonstrate an association, not causality of the factor, i.e., zinc supplementation leads to increased serum T50 levels in patient with type 2 diabetes mellitus. To confirm the potential benefits of zinc supplementation, additional interventional studies are required. Fourth, we did not evaluate other serum markers that may influence serum T50. For example, iron has also been reported to be reduce high phosphate induced vascular calcification by inhibiting apoptosis [66]. Future research to investigate the association among serum iron, ferritin, transferrin saturation, and serum T50 is needed. Fifth, the method used for measurement of serum zinc level may be another limitation. In the present study, serum zinc levels were measured according to published practical guidelines for zinc deficiency in Japan [30]. However, fibrinogen contains several binding sites for zin ions [67,68]. Because some zinc might have been removed from the blood samples during extraction of the clots, measurement of zinc in plasma obtained with tubes containing a non-chelation-based anticoagulant might be better than the method used in our study [69]. Sixth, we did not measure plasma free fatty acid levels, though those are known to be elevated in patients with type 2 diabetes mellitus [70,71]. Albumin also binds to fatty acids [72]. Because the binding of zinc and fatty acids to serum albumin is linked allosterically [73], free fatty acids may have effects on modulation of plasma zinc speciation via an allosteric switch to serum albumin [74]. Finally, since pulse wave velocity (PWV) and intima-media thickness (IMT) were not evaluated, the relationship of calcium, magnesium, and zinc with atherothrombotic stage was not examined. While serum zinc was positively correlated with serum calcium and eGFR (r = 0.331, p < 0.001, r = 0.500, p < 0.001, respectively), it was not significantly correlated with serum magnesium in the present patients with type 2 diabetes. Additional studies are needed to investigate the relationship among mineral associated parameters, including calcium, magnesium, and zinc, in various atherothrombotic stages evaluated by PWV or IMT.

5. Conclusions

In summary, serum zinc was found as an independent factor associated positively with serum T50 in patient with type 2 diabetes mellitus. Furthermore, zinc was shown to decrease the propensity of calcification in serum in healthy volunteers as well as patients undergoing hemodialysis

Supplementary Materials

The following are available online at https://www.mdpi.com/2227-9059/8/9/337/s1, Figure S1: Schematic illustration of zinc and calcification; Table S1: Clinical characteristics of the pooled serum from healthy volunteers and patients undergoing hemodialysis. References [38,51] are cited in the supplementary materials.

Author Contributions

S.N., K.M., and T.S. contributed to the concept, design, analysis, interpretation, and writing. M.S., and K.N. contributed to data acquisition and interpretation. H.U., A.T., and M.E. contributed to the concept and interpretation. All authors have read and agreed to the published version of the manuscript.

Funding

This study was partly supported by research grants for T.S. from Astellas Pharma (RS01442), Chugai Pharmaceutical Company (AC-1-20150630164707-161208), and Takeda Pharmaceutical Company (15S01790).

Acknowledgments

The authors thank the participants of this study for providing their medical information. The authors acknowledge the technical assistance of Masayo Sasagawa from the research laboratory at the Department of Metabolism, Endocrinology and Molecular Medicine, Osaka City University Graduate School of Medicine. The authors also acknowledge the technical support of Taeko Takashiro of BMG Labtech.

Conflicts of Interest

The authors declare no conflict of interest.

References

  1. Raghavan, S.; Vassy, J.L.; Ho, Y.; Song, R.J.; Gagnon, D.R.; Cho, K.; Wilson, P.W.F.; Phillips, L.S. Diabetes Mellitus–Related All-Cause and Cardiovascular Mortality in a National Cohort of Adults. J. Am. Heart Assoc. 2019, 8, e011295. [Google Scholar] [CrossRef] [Green Version]
  2. Niskanen, L.; Siitonen, O.; Suhonen, M.; Uusitupa, M.I. Medial Artery Calcification Predicts Cardiovascular Mortality in Patients with NIDDM. Diabetes Care 1994, 17, 1252–1256. [Google Scholar] [CrossRef] [PubMed]
  3. Go, A.; Chertow, G.; Fan, D.; McCulloch, C.; Hsu, C. Chronic kidney disease and the risks of death, cardiovascular events, and hospitalization. N. Engl. J. Med. 2004, 351, 1296–1305. [Google Scholar] [CrossRef]
  4. Gorriz, J.L.; Molina, P.; Cerverón, M.J.; Vila, R.; Bover, J.; Nieto, J.; Barril, G.; Martínez-Castelao, A.; Fernández, E.; Escudero, V.; et al. Vascular Calcification in Patients with Nondialysis CKD over 3 Years. Clin. J. Am. Soc. Nephrol. 2015, 10, 654–666. [Google Scholar] [CrossRef] [PubMed] [Green Version]
  5. Lanzer, P.; Boehm, M.; Sorribas, V.; Thiriet, M.; Janzen, J.; Zeller, T.; Hilaire, C.S.; Shanahan, C.M. Medial vascular calcification revisited: Review and perspectives. Eur. Heart J. 2014, 35, 1515–1525. [Google Scholar] [CrossRef] [PubMed]
  6. Avogaro, A.; Fadini, G.P. Mechanisms of ectopic calcification: Implications for diabetic vasculopathy. Cardiovasc. Diagn. Ther. 2015, 5, 343–352. [Google Scholar]
  7. Houben, E.; Neradova, A.; Schurgers, L.J.; Vervloet, M. The influence of phosphate, calcium and magnesium on matrix Gla-protein and vascular calcification: A systematic review. G. Ital. Nefrol. 2016, 33, gin/33.6.5. [Google Scholar]
  8. Reynolds, J.L.; Joannides, A.J.; Skepper, J.N.; McNair, R.; Schurgers, L.J.; Proudfoot, D.; Jahnen-Dechent, W.; Weissberg, P.L.; Shanahan, C.M. Human Vascular Smooth Muscle Cells Undergo Vesicle-Mediated Calcification in Response to Changes in Extracellular Calcium and Phosphate Concentrations: A Potential Mechanism for Accelerated Vascular Calcification in ESRD. J. Am. Soc. Nephrol. 2004, 15, 2857–2867. [Google Scholar] [CrossRef] [Green Version]
  9. London, G.M. Mechanisms of arterial calcifications and consequences for cardiovascular function. Kidney Int. Suppl. 2013, 3, 442–445. [Google Scholar] [CrossRef] [Green Version]
  10. Demer, L.L.; Tintut, Y. Mineral exploration: Search for the mechanism of vascular calcification and beyond: The 2003 Jeffrey M. Hoeg Award lecture. Arterioscler. Thromb. Vasc. Biol. 2003, 23, 1739–1743. [Google Scholar] [CrossRef] [Green Version]
  11. Wallin, R.; Wajih, N.; Greenwood, G.T.; Sane, D.C. Arterial calcification: A review of mechanisms, animal models, and the prospects for therapy. Med. Res. Rev. 2001, 21, 274–301. [Google Scholar] [CrossRef] [PubMed]
  12. Jablonski, K.L.; Chonchol, M. Vascular calcification in end-stage renal disease. Hemodial. Int. 2013, 17, S17–S21. [Google Scholar] [CrossRef] [Green Version]
  13. Cozzolino, M.; Gallieni, M.; Brancaccio, D. Vascular Calcification in Uremic Conditions: New Insights into Pathogenesis. Semin. Nephrol. 2006, 26, 33–37. [Google Scholar] [CrossRef] [PubMed]
  14. Tanaka, T.; Sato, H.; Doi, H.; Yoshida, C.A.; Shimizu, T.; Matsui, H.; Yamazaki, M.; Akiyama, H.; Kawai-Kowase, K.; Iso, T.; et al. Runx2 Represses Myocardin-Mediated Differentiation and Facilitates Osteogenic Conversion of Vascular Smooth Muscle Cells. Mol. Cell. Biol. 2007, 28, 1147–1160. [Google Scholar] [CrossRef] [PubMed] [Green Version]
  15. Mori, K.; Inaba, M. Diabetees and Vascular Calcification: Diabetes and Aging-Related Complications; Springer: Tokyo, Japan, 2017; pp. 59–68. [Google Scholar]
  16. Sinha, A.; Vyavahare, N. High-glucose levels and elastin degradation products accelerate osteogenesis in vascular smooth muscle cells. Diabetes Vasc. Dis. Res. 2013, 10, 410–419. [Google Scholar] [CrossRef] [PubMed] [Green Version]
  17. Heiss, A.; Jahnen-Dechent, W.; Endo, H.; Schwahn, D. Structural dynamics of a colloidal protein-mineral complex bestowing on calcium phosphate a high solubility in biological fluids. Biointerphases 2007, 2, 16–20. [Google Scholar] [CrossRef] [Green Version]
  18. Heiss, A.; Duchesne, A.; Denecke, B.; Grötzinger, J.; Yamamoto, K.; Renné, T.; Jahnen-Dechent, W. Structural Basis of Calcification Inhibition by α2-HS Glycoprotein/Fetuin-A formation of colloidal calciprotein particles. J. Biol. Chem. 2003, 278, 13333–13341. [Google Scholar] [CrossRef] [Green Version]
  19. Pasch, A.; Farese, S.; Gräber, S.; Wald, J.; Richtering, W.; Floege, J.; Jahnen-Dechent, W. Nanoparticle-Based Test Measures Overall Propensity for Calcification in Serum. J. Am. Soc. Nephrol. 2012, 23, 1744–1752. [Google Scholar] [CrossRef]
  20. Smith, E.R.; Ford, M.L.; Tomlinson, L.A.; Bodenham, E.; McMahon, L.P.; Farese, S.; Rajkumar, C.; Holt, S.G.; Pasch, A. Serum Calcification Propensity Predicts All-Cause Mortality in Predialysis CKD. J. Am. Soc. Nephrol. 2014, 25, 339–348. [Google Scholar] [CrossRef]
  21. Pasch, A.; Block, G.A.; Bachtler, M.; Smith, E.R.; Jahnen-Dechent, W.; Arampatzis, S.; Chertow, G.M.; Parfrey, P.; Ma, X.; Floege, J. Blood Calcification Propensity, Cardiovascular Events, and Survival in Patients Receiving Hemodialysis in the EVOLVE Trial. Clin. J. Am. Soc. Nephrol. 2017, 12, 315–322. [Google Scholar] [CrossRef] [Green Version]
  22. Keyzer, C.A.; De Borst, M.H.; van den Berg, E.; Jahnen-Dechent, W.; Arampatzis, S.; Farese, S.; Bergmann, I.P.; Floege, J.; Navis, G.; Bakker, S.J.; et al. Calcification Propensity and Survival among Renal Transplant Recipients. J. Am. Soc. Nephrol. 2016, 27, 239–248. [Google Scholar] [CrossRef] [PubMed] [Green Version]
  23. Dahle, D.O.; Åsberg, A.; Hartmann, A.; Holdaas, H.; Bachtler, M.; Jenssen, T.G.; Dionisi, M.; Pasch, A. Serum Calcification Propensity Is a Strong and Independent Determinant of Cardiac and All-Cause Mortality in Kidney Transplant Recipients. Am. J. Transplant. 2016, 16, 204–212. [Google Scholar] [CrossRef] [PubMed] [Green Version]
  24. Silaghi, C.N.; Ilyés, T.; Van Ballegooijen, A.J.; Crăciun, A.M. Calciprotein Particles and Serum Calcification Propensity: Hallmarks of Vascular Calcifications in Patients with Chronic Kidney Disease. J. Clin. Med. 2020, 9, 1287. [Google Scholar] [CrossRef] [PubMed]
  25. Bielesz, B.; Reiter, T.; Marculescu, R.; Gleiss, A.; Bojic, M.; Kieweg, H.; Cejka, D. Calcification Propensity of Serum is Independent of Excretory Renal Function. Sci. Rep. 2017, 7, 17941. [Google Scholar] [CrossRef] [Green Version]
  26. Jono, S.; McKee, M.D.; Murry, C.E.; Shioi, A.; Nishizawa, Y.; Mori, K.; Morii, H.; Giachelli, C.M. Phosphate regulation of vascular smooth muscle cell calcification. Circ. Res. 2000, 87, e10–e17. [Google Scholar] [CrossRef]
  27. Block, G.A.; Hulbert-Shearon, T.E.; Levin, N.W.; Port, F.K. Association of serum phosphorus and calcium x phosphate product with mortality risk in chronic hemodialysis patients: A national study. Am. J. Kidney Dis. 1998, 31, 607–617. [Google Scholar] [CrossRef]
  28. Foley, R.N.; Collins, A.J.; Ishani, A.; Kalra, P.A. Calcium-phosphate levels and cardiovascular disease in community-dwelling adults: The Atherosclerosis Risk in Communities (ARIC) Study. Am. Heart J. 2008, 156, 556–563. [Google Scholar] [CrossRef]
  29. Chasapis, C.; Loutsidou, A.C.; Spiliopoulou, C.; Stefanidou, M.E. Zinc and human health: An update. Arch. Toxicol. 2012, 86, 521–534. [Google Scholar] [CrossRef]
  30. Kodama, H.; Tanaka, M.; Naito, Y.; Katayama, K.; Moriyama, M. Japan’s Practical Guidelines for Zinc Deficiency with a Particular Focus on Taste Disorders, Inflammatory Bowel Disease, and Liver Cirrhosis. Int. J. Mol. Sci. 2020, 21, 2941. [Google Scholar] [CrossRef]
  31. Kondaiah, P.; Yaduvanshi, P.S.; Sharp, P.A.; Pullakhandam, R. Iron and Zinc Homeostasis and Interactions: Does Enteric Zinc Excretion Cross-Talk with Intestinal Iron Absorp:tion? Nutrients 2019, 11, 1885. [Google Scholar] [CrossRef] [Green Version]
  32. Kiilerich, S.; Hvid-Jacobsen, K.; Vaag, A.; Sørensen, S.S. 65 Zinc absorption in patients with insulin-dependent diabetes mellitus assessed by whole-body counting technique. Clin. Chim. Acta 1990, 189, 13–18. [Google Scholar] [CrossRef]
  33. Cunningham, J.J.; Fu, A.; Mearkle, P.L.; Brown, R.G. Hyperzincuria in individuals with insulin-dependent diabetes mellitus: Concurrent zinc status and the effect of high-dose zinc supplementation. Metabolism 1994, 43, 1558–1562. [Google Scholar] [CrossRef]
  34. Kazi, T.G.; Afridi, H.I.; Kazi, N.; Jamali, M.K.; Arain, M.B.; Jalbani, N.; Kandhro, G.A. Copper, Chromium, Manganese, Iron, Nickel, and Zinc Levels in Biological Samples of Diabetes Mellitus Patients. Biol. Trace Element Res. 2008, 122, 1–18. [Google Scholar] [CrossRef] [PubMed]
  35. Makhlough, A.; Makhlough, M.; Shokrzadeh, M.; Mohammadian, M.; Sedighi, O.; Faghihan, M. Comparing the Levels of Trace Elements in Patients with Diabetic Nephropathy and Healthy Individuals. Nephro-Urol. Mon. 2015, 7, 28576. [Google Scholar] [CrossRef] [PubMed] [Green Version]
  36. Jansen, J.; Karges, W.; Rink, L. Zinc and diabetes—Clinical links and molecular mechanisms. J. Nutr. Biochem. 2009, 20, 399–417. [Google Scholar] [CrossRef]
  37. Jayawardena, R.; Ranasinghe, P.; Galappatthy, P.; Malkanthi, R.; Constantine, G.R.; Katulanda, P. Effects of zinc supplementation on diabetes mellitus: A systematic review and meta-analysis. Diabetol. Metab. Syndr. 2012, 4, 13. [Google Scholar] [CrossRef] [PubMed] [Green Version]
  38. Voelkl, J.; Tuffaha, R.; Luong, T.T.D.; Zickler, D.; Masyout, J.; Feger, M.; Verheyen, N.; Blaschke, F.; Kuro, O.M.; Tomaschitz, A.; et al. Zinc Inhibits Phosphate-Induced Vascular Calcification through TNFAIP3-Mediated Suppression of NF-kappaB. J. Am. Soc. Nephrol. 2018, 29, 1636–1648. [Google Scholar] [CrossRef] [Green Version]
  39. Sonoda, M.; Shoji, T.; Kuwamura, Y.; Okute, Y.; Naganuma, T.; Shima, H.; Motoyama, K.; Morioka, T.; Mori, K.; Fukumoto, S.; et al. Plasma homocysteine and cerebral small vessel disease as possible mediators between kidney and cognitive functions in patients with diabetes mellitus. Sci. Rep. 2017, 7, 4382. [Google Scholar] [CrossRef] [Green Version]
  40. Seino, Y.; Nanjo, K.; Tajima, N.; Kadowaki, T.; Kashiwagi, A.; Araki, E.; Ito, C.; Inagaki, N.; Iwamoto, Y.; Kasuga, M.; et al. Report of the committee on the classification and diagnostic criteria of diabetes mellitus. J. Diabetes Investig. 2010, 1, 212–228. [Google Scholar] [CrossRef] [Green Version]
  41. The Expert Committee on the Diagnosis and Classification of Diabetes Mellitus. Report of the Expert Committee on the Diagnosis and Classification of Diabetes Mellitus. Diabetes Care 2002, 25, s5–s20. [Google Scholar] [CrossRef] [Green Version]
  42. Matsuo, S.; Imai, E.; Horio, M.; Yasuda, Y.; Tomita, K.; Nitta, K.; Yamagata, K.; Tomino, Y.; Yokoyama, H.; Hishida, A. Revised Equations for Estimated GFR From Serum Creatinine in Japan. Am. J. Kidney Dis. 2009, 53, 982–992. [Google Scholar] [CrossRef] [PubMed]
  43. Payne, R.B.; Little, A.J.; Williams, R.B.; Milner, J.R. Interpretation of Serum Calcium in Patients with Abnormal Serum Proteins. Br. Med. J. 1973, 4, 643–646. [Google Scholar] [CrossRef] [Green Version]
  44. Schweikle, M.; Bjørnøy, S.H.; Van Helvoort, A.T.J.; Haugen, H.J.; Sikorski, P.; Tiainen, H. Stabilisation of amorphous calcium phosphate in polyethylene glycol hydrogels. Acta Biomater. 2019, 90, 132–145. [Google Scholar] [CrossRef] [PubMed]
  45. Gross, K.A.; Komarovska, L.; Viksna, A. Efficient zinc incorporation into hydroxyapatite through crystallization of an amorphous phase could extend the properties of zinc apatites. J. Aust. Ceram. Soc. 2013, 49, 129–135. [Google Scholar]
  46. Kanazaki, N.; Onuma, K.; Trboux, G.; Tusumi, S.; Ito, A. Inhibitory Effect of Magnesium and Zinc on Crystallization Kinetics of Hydroxyapatite (0001) Face. J. Phys. Chem. B 2000, 104, 4189–4194. [Google Scholar] [CrossRef]
  47. Pham, P.-C.T.; Pham, S.V.; Miller, J.M. Hypomagnesemia in Patients with Type 2 Diabetes. Clin. J. Am. Soc. Nephrol. 2007, 2, 366–373. [Google Scholar] [CrossRef] [PubMed] [Green Version]
  48. Wälti, M.K.; Zimmermann, M.B.; Walczyk, T.; Spinas, G.A.; Hurrell, R.F. Measurement of magnesium absorption and retention in type 2 diabetic patients with the use of stable isotopes. Am. J. Clin. Nutr. 2003, 78, 448–453. [Google Scholar] [CrossRef] [Green Version]
  49. Barbagallo, M.; Dominguez, L.J.; Galioto, A.; Ferlisi, A.; Cani, C.; Malfa, L.; Pineo, A.; Busardo, A.; Paolisso, G. Role of magnesium in insulin action, diabetes and cardio-metabolic syndrome X. Mol. Asp. Med. 2003, 24, 39–52. [Google Scholar] [CrossRef]
  50. Louvet, L.; Büchel, J.; Steppan, S.; Passlick-Deetjen, J.; Massy, Z.A. Magnesium prevents phosphate-induced calcification in human aortic vascular smooth muscle cells. Nephrol. Dial. Transplant. 2013, 28, 869–878. [Google Scholar] [CrossRef] [Green Version]
  51. Nagy, A.; Pethő, D.; Gáll, T.; Zavaczki, E.; Nyitrai, M.; Posta, J.; Zarjou, A.; Agarwal, A.; Balla, G.; Balla, J. Zinc Inhibits HIF-Prolyl Hydroxylase Inhibitor-Aggravated VSMC Calcification Induced by High Phosphate. Front. Physiol. 2019, 10, 1584. [Google Scholar] [CrossRef] [Green Version]
  52. Blaine, J.; Chonchol, M.; Levi, M. Renal Control of Calcium, Phosphate, and Magnesium Homeostasis. Clin. J. Am. Soc. Nephrol. 2015, 10, 1257–1272. [Google Scholar] [CrossRef]
  53. Bressendorff, I.; Hansen, D.; Schou, M.; Silver, B.; Pasch, A.; Bouchelouche, P.; Pedersen, L.; Rasmussen, L.M.; Brandi, L. Oral Magnesium Supplementation in Chronic Kidney Disease Stages 3 and 4: Efficacy, Safety, and Effect on Serum Calcification Propensity—A Prospective Randomized Double-Blinded Placebo-Controlled Clinical Trial. Kidney Int. Rep. 2017, 2, 380–389. [Google Scholar] [CrossRef] [Green Version]
  54. Giroux, E.L.; Henkin, R.I. Competition for zinc among serum albumin and amino acids. Biochim. Biophys. Acta (BBA) Gen. Subj. 1972, 273, 64–72. [Google Scholar] [CrossRef]
  55. Handing, K.B.; Shabalin, I.G.; Kassaar, O.; Khazaipoul, S.; Blindauer, C.A.; Stewart, A.J.; Chruszcz, M.; Minor, W. Circulatory zinc transport is controlled by distinct interdomain sites on mammalian albumins. Chem. Sci. 2016, 7, 6635–6648. [Google Scholar] [CrossRef] [PubMed] [Green Version]
  56. Maruthur, N.; Clark, J.M.; Fu, M.; Kao, W.H.L.; Shuldiner, A.R. Effect of zinc supplementation on insulin secretion: Interaction between zinc and SLC30A8 genotype in Old Order Amish. Diabetologia 2014, 58, 295–303. [Google Scholar] [CrossRef] [PubMed] [Green Version]
  57. Heidarian, E.; Amini, M.; Parham, M.; Aminorroaya, A. Effect of Zinc Supplementation on Serum Homocysteine in Type 2 Diabetic Patients with Microalbuminuria. Rev. Diabet. Stud. 2009, 6, 64–70. [Google Scholar] [CrossRef] [Green Version]
  58. Parham, M.; Amini, M.; Aminorroaya, A.; Heidarian, E. Effect of Zinc Supplementation on Microalbuminuria in Patients With Type 2 Diabetes: A Double Blind, Randomized, Placebo-Controlled, Cross-Over Trial. Rev. Diabet. Stud. 2008, 5, 102–109. [Google Scholar] [CrossRef] [Green Version]
  59. Roussel, A.-M.; Kerkeni, A.; Zouari, N.; Mahjoub, S.; Matheau, J.-M.; Anderson, R.A. Antioxidant Effects of Zinc Supplementation in Tunisians with Type 2 Diabetes Mellitus. J. Am. Coll. Nutr. 2003, 22, 316–321. [Google Scholar] [CrossRef]
  60. Capdor, J.; Foster, M.; Petocz, P.; Samman, S. Zinc and glycemic control: A meta-analysis of randomised placebo controlled supplementation trials in humans. J. Trace Elem. Med. Biol. 2013, 27, 137–142. [Google Scholar] [CrossRef]
  61. Foster, M.; Petocz, P.; Samman, S. Effects of zinc on plasma lipoprotein cholesterol concentrations in humans: A meta-analysis of randomised controlled trials. Atherosclerosis 2010, 210, 344–352. [Google Scholar] [CrossRef]
  62. Soinio, M.; Marniemi, J.; Laakso, M.; Lehto, S.; Rönnemaa, T.; Pyöräla, K. Serum Zinc Level and Coronary Heart Disease Events in Patients With Type 2 Diabetes. Diabetes Care 2007, 30, 523–528. [Google Scholar] [CrossRef] [PubMed] [Green Version]
  63. Hughes, S.; Samman, S. The effect of zinc supplementation in humans on plasma lipids, antioxidant status and thrombogenesis. J. Am. Coll. Nutr. 2006, 25, 285–291. [Google Scholar] [CrossRef] [PubMed]
  64. Leitzmann, M.F.; Stampfer, M.J.; Wu, K.; Colditz, G.A.; Willett, W.C.; Giovannucci, E.L. Zinc supplement use and risk of prostate cancer. J. Natl. Cancer Inst. 2003, 95, 1004–1007. [Google Scholar] [CrossRef] [PubMed] [Green Version]
  65. Chandra, R.K. Excessive intake of zinc impairs immune responses. JAMA 1984, 252, 1443–1446. [Google Scholar] [CrossRef]
  66. Ciceri, P.; Elli, F.; Braidotti, P.; Falleni, M.; Tosi, D.; Bulfamante, G.; Block, G.A.; Cozzolino, M. Iron citrate reduces high phosphate-induced vascular calcification by inhibiting apoptosis. Atherosclerosis 2016, 254, 93–101. [Google Scholar] [CrossRef]
  67. Mammadova-Bach, E.; Braun, A. Zinc Homeostasis in Platelet-Related Diseases. Int. J. Mol. Sci. 2019, 20, 5258. [Google Scholar] [CrossRef] [Green Version]
  68. Marx, G. Zinc binding to fibrinogen and fibrin. Arch. Biochem. Biophys. 1988, 266, 285–288. [Google Scholar] [CrossRef]
  69. Knez, M.; Pantovic, A.; Zekovic, M.; Pavlovic, Z.; Glibetić, M.; Zec, M.M. Is There a Link between Zinc Intake and Status with Plasma Fatty Acid Profile and Desaturase Activities in Dyslipidemic Subjects? Nutrients 2019, 12, 93. [Google Scholar] [CrossRef] [Green Version]
  70. Hawkins, M.; Tonelli, J.; Kishore, P.; Stein, D.; Ragucci, E.; Gitig, A.; Reddy, K. Contribution of elevated free fatty acid levels to the lack of glucose effectiveness in type 2 diabetes. Diabetes 2003, 52, 2748–2758. [Google Scholar] [CrossRef] [Green Version]
  71. Salgin, B.; Ong, K.K.; Thankamony, A.; Emmett, P.; Wareham, N.J.; Dunger, D.B.; Thankamony, A.; Taylor-Robinson, D. Higher Fasting Plasma Free Fatty Acid Levels Are Associated with Lower Insulin Secretion in Children and Adults and a Higher Incidence of Type 2 Diabetes. J. Clin. Endocrinol. Metab. 2012, 97, 3302–3309. [Google Scholar] [CrossRef] [Green Version]
  72. Coverdale, J.P.C.; Khazaipoul, S.; Arya, S.; Stewart, A.J.; Blindauer, C.A. Crosstalk between zinc and free fatty acids in plasma. Biochim. Biophys. Acta (BBA) Mol. Cell Biol. Lipids 2019, 1864, 532–542. [Google Scholar] [CrossRef] [PubMed]
  73. Lu, J.; Stewart, A.J.; Sleep, D.; Sadler, P.J.; Pinheiro, T.J.T.; Blindauer, C.A. A Molecular Mechanism for Modulating Plasma Zn Speciation by Fatty Acids. J. Am. Chem. Soc. 2012, 134, 1454–1457. [Google Scholar] [CrossRef] [PubMed]
  74. Barnett, J.P.; Blindauer, C.A.; Kassaar, O.; Khazaipoul, S.; Martin, E.M.; Sadler, P.J.; Stewart, A.J. Allosteric modulation of zinc speciation by fatty acids. Biochim. Biophys. Acta (BBA) Gen. Subj. 2013, 1830, 5456–5464. [Google Scholar] [CrossRef] [PubMed] [Green Version]
Figure 1. Correlation between serum zinc and serum calcification propensity (T50) in patients with type 2 diabetes mellitus. Serum zinc level showed a weak, but significant correlation with serum T50. Abbreviations: rs, Spearman’s correlation coefficient; p, level of significance; N, number of patients.
Biomedicines 08 00337 g001
Figure 2. Influence of zinc on serum calcification propensity (T50) in pooled serum samples from healthy volunteers and patients with hemodialysis. Addition of exogenous 20 µM zinc chloride (ZnCl2) significantly increased T50. Compared to those of control (0 µM of ZnCl2 addition) in pooled serum from healthy subjects (A), and pooled serum from dialysis patients (B) * p < 0.05; statistically significant versus 0 µM ZnCl2 addition.
Biomedicines 08 00337 g002
Table 1. Clinical characteristics of the study participants (n = 132).
MeasurementMedian (IQR) or Percentage
Age (years)71 (65–75)
Male/female, n (%)78 (59.1)/54 (40.9)
Body mass index (kg/m2)24.5 (21.8–27.0)
T50 (min)306 (269–332)
eGFR (mL/min/1.73 m2)59.0 (37.6–73.9)
Creatinine (mg/dL)0.87 (0.69–1.36)
Blood urea nitrogen (mg/dL)17 (15–23)
Serum albumin (g/dL)4.1 (3.8–4.3)
Fasting plasma glucose (mg/dL)119 (99–143)
HbA1c (%)8.0 (7.1–9.2)
Corrected calcium (mg/dL)9.4 (9.2–9.7)
Phosphate (mg/dL)3.8 (3.4–4.2)
Magnesium (mg/dL)2.1 (2.0–2.3)
Zinc (µg/dL)80.0 (70.1–89.8)
Whole PTH (pg/mL)21.6 (16.4–31.2)
Intact PTH (pg/mL)36 (27–54)
Urine albumin to creatinine ratio (mg/gCr)17 (6–212)
Systolic blood pressure (mmHg)125 (110–138)
Diastolic blood pressure (mmHg)65 (60–74)
Current smoker (%)65 (49.2)
Use of mediations
Antihypertensive (%)79 (59.8)
Statin (%)64 (48.4)
Insulin (%)63 (47.7)
Anti-diabetic agent (%)98 (74.2)
Complications
Retinopathy (%)37 (28.2)
Neuropathy (%)66 (50.0)
Any prior cardiovascular disease (%)21 (15.9)
The table gives number and percentage for categorical variables and median (IQR) for continuous variables. Abbreviations are: IQR, interquartile range; eGFR, estimated glomerular filtration rate; HbA1c, hemoglobin A1c; PTH, para-thyroid hormone.
Table 2. Correlation of serum T50 with clinical factors in diabetic patients.
Clinical VariablesCorrelation with T50
rsp
Age−0.2220.010
Body mass index0.0130.886
eGFR0.1990.022
Creatinine−0.1700.051
Blood urea nitrogen−0.2130.011
Serum albumin0.3130.0003
Fasting plasma glucose0.2820.001
HbA10.1660.057
Corrected calcium0.1320.132
Phosphate−0.2270.009
Magnesium0.1130.195
Zinc0.2190.012
Whole-PTH−0.1170.183
Intact-PTH−0.1100.183
Urine albumin to creatinine ratio−0.2470.004
Data include the Spearman’s correlation coefficient (rs-value) and the levels of significance (p-value) (bolded if p < 0.05). Abbreviations are: eGFR, estimated glomerular filtration rate; HbA1c, hemoglobin A1c; PTH, para-thyroid hormone.
Table 3. Factors associated with serum calcification propensity (T50) in 132 type 2 diabetes patients.
Model 1Model 2
βpβp
Age−0.0770.412−0.0560.544
Sex (female = 0. male = 1)0.0420.6330.0350.692
Any Prior cardiovascular disease−0.1430.112−0.1390.117
Current smoking (no = 0, yes = 1)−0.1420.094−0.1350.105
eGFR0.1720.1550.0960.438
Urinary albumin-creatinine ratio0.0040.9680.0280.783
Corrected calcium0.2280.0100.1990.021
Phosphate−0.3280.0007−0.3170.0008
Magnesium0.2260.0090.2160.011
Zinc0.2130.0380.2290.024
HbA1c–0.0540.537--
Fasting plasma glucose--0.1710.053
R20.2440.265
(p < 0.001)(p < 0.001)
Data are the standard regression coefficients (β-value) and levels of significance (p-value) (bolded if p < 0.05). Abbreviations are: HbA1c, hemoglobin A1c; R2, multiple coefficient of determination; -, fasting plasma glucose and HbA1c were not included as explanatory variables in the mode 1 and 2, respectively.

