Article

Resolvin D1 in the Lipopolysaccharide-Induced Inflammatory Microenvironment Mediates Resolution in Human Monocytic THP-1 Cells

1
School/Hospital of Stomatology, Lanzhou University, Lanzhou 730000, China
2
Key Laboratory of Dental Maxillofacial Reconstruction and Biological Intelligence Manufacturing, Lanzhou University, Lanzhou 730000, China
3
Department of Medical Biology, Faculty of Health Sciences, UiT the Arctic University of Norway, 9037 Tromsø, Norway
4
Department of Orthodontics and Dentofacial Orthopedics, The First Clinical Medical College, Lanzhou University, Lanzhou 730000, China
5
School/Hospital of Stomatology, Xi’an Jiaotong University, Xi’an 710000, China
6
Computational Biology Unit, Department of Informatics, University of Bergen, 5008 Bergen, Norway
7
Genomics Support Centre Tromsø (GSCT), Department of Clinical Medicine, Faculty of Health Sciences, UiT the Arctic University of Norway, 9037 Tromsø, Norway
8
Department of Developmental and Surgical Sciences, School of Dentistry, University of Minnesota, Minneapolis, MN 55455, USA
9
School of Dental Medicine, Harvard University, Boston, MA 02115, USA
10
Department of Clinical Dentistry, Faculty of Health Sciences, UiT the Arctic University of Norway, 9037 Tromsø, Norway
*
Authors to whom correspondence should be addressed.
These authors contributed equally to this work.
Biomedicines 2026, 14(5), 1124; https://doi.org/10.3390/biomedicines14051124
Submission received: 6 March 2026 / Revised: 9 May 2026 / Accepted: 13 May 2026 / Published: 15 May 2026
(This article belongs to the Special Issue Inflammatory Mechanisms, Biomarkers and Treatment in Oral Diseases)

Abstract

Objectives: An infectious trigger can initiate a systemic inflammatory response, which in turn activates immune cells and causes the release of various mediators. Local mediators, such as resolvin D1 (RvD1), actively interact with immune cells to promote the resolution of inflammation. This study aimed to determine the impact of RvD1 on the inflammatory response mediated by monocytes in response to LPS. Methods: To investigate the mechanism by which RvD1 affects the monocyte-mediated inflammatory response to LPS, human THP-1 monocytic cells were treated with LPS, RvD1, or vehicle for 24 h. Inflammatory cytokines, interleukin-1β (IL-1β) and tumor necrosis factor (TNF-α), were measured using enzyme-linked immunosorbent assay (ELISA). RNA sequencing (RNA-seq) was used to identify differentially expressed genes (DEGs). The NF-κB and MAPK p38 signaling pathways were validated using real-time quantitative PCR (RT-qPCR) and Western blotting (WB). Results: RvD1 diminished the levels of IL-1β and TNF-α in LPS-induced inflammation. RvD1 significantly enhanced the mRNA expression of CREB, NRF2, and BCL-2. In addition, RvD1 significantly decreased the mRNA expression of CASP3. RvD1 regulated the inflammatory process in human monocytic THP-1 cells via the NF-κB p65 (MyD88, p65) and p38 MAPK signaling pathways (p38, BCL-2) and further suppressed the expression of apoptotic factors (PI3K, caspase-3). Conclusions: RvD1 has been shown to exert pro-resolving effects by regulating the anti-apoptotic gene BCL-2 and activating the NF-κB p65 and MAPK p38 signaling pathways.

1. Introduction

Inflammation is a complex biological process triggered in response to injury, trauma, infection or other danger signals and involves an acute inflammatory response that initiates inflammation and a pro-resolving immune response [1,2,3]. Lipopolysaccharide (LPS), which is found on the outer membrane of E. coli and other Gram-negative bacteria (GNB), is one of the most common inflammatory triggers [4,5,6]. Even at very low concentrations, LPS triggers an inflammatory cascade [7]. In vivo, LPS activates Toll-like receptor (TLR) signaling to trigger a cytokine-mediated inflammatory response and initiate host defense mechanisms [8]. The accumulation of LPS in peripheral blood activates neutrophils (Polymorphonuclear neutrophils, PMNs), monocytes, and macrophages to produce inflammatory cytokines such as interleukin-1 (IL-1β), tumor necrosis factor (TNF-α), and interleukin-6 (IL-6) [9]. At the systemic level, the activation of these inflammatory cytokines induces alterations in metabolic processes, hormonal balance, and the neuroendocrine system, ultimately resulting in abnormal cellular function and progressive dysfunction or failure of multiple organ systems.
Monocytes and macrophages act as the first line of defense as part of host defense, and both can rapidly infiltrate sites of tissue damage, contributing to a return to homeostasis [10]. In particular, the resolution of acute inflammation is initiated when the very first leukocytes arrive at the inflammatory site [11]. Resolvin D1 (RvD1), an endogenous pro-resolving lipid molecule, has demonstrated efficacy against live bacteria, promoting the resolution of several models of sepsis and lung injury and reducing the need for antibiotics in infected mice [12,13]. These results show that RvD1 effectively attenuates bacteria-induced inflammation, especially LPS-induced inflammation. There is evidence that RvD1 binds to neutrophils, Th1 cells, and Th17 cells mainly through cell-specific miRNA regulation, allowing the activation of different intracellular pathways [14]. Furthermore, recent studies have shown that RvD1 mainly activates intracellular signaling pathways through formyl peptide receptor 2 (ALX/FPR2) and cell-specific miRNA219 on the surface of monocytes and synergistically reduces the chemotaxis and infiltration of monocytes to promote the inflammation resolution process [15,16]. However, the mechanism of its specific activation of intracellular signaling pathways is still unclear. Thus, investigating the mechanism by which RvD1 regulates acute inflammation at the gene level is meaningful.
Most studies have used phorbol myristate acetate-activated (PMA) THP-1 monocytic cells as a model for macrophages to simulate the polarized activity of macrophages under inflammatory conditions and study the LPS-mediated actions related to macrophages [17]. However, previous studies have shown that undifferentiated THP-1 monocytic cells can still mediate the expression of Toll-like receptors under LPS stimulation [18,19,20]. Specifically, undifferentiated THP-1 cells can express TLRs upon LPS stimulation due to their intrinsic nature as a monocytic cell line, which harbors an intact and functional TLR signaling pathway. Moreover, resolvin D2 (RvD2) treatment decreases TLR4 expression to mediate resolution in human monocytes [21]. Therefore, in this study, THP-1 monocytic cells without PMA treatment were chosen as an in vitro cell model for resolvin-mediated inflammation resolution.
Based on the critical role of monocytes in inducing and maintaining inflammation, a human monocyte-centric model of acute inflammation was established. Understanding how RvD1 regulates inflammation-related genes to affect monocytes and uncovering the underlying mechanisms by which RvD1 regulates acute inflammation are the core of this research.

2. Materials and Methods

2.1. Cell Culture

Human monocytic THP-1 cells were obtained from ATCC (Manassas, VA, USA). RPMI 1640 (Basal Media, Shanghai, China) was used to maintain the cell lines with 10% fetal bovine serum (Abwbio, Shanghai, China), 100 µg/mL penicillin, 100 µg/mL streptomycin sulfate, and 200 mmol/L L-glutamine. The cell lines were cultured in a humidified atmosphere of 5% CO2 at 37 °C.

2.2. RvD1 Treatment and LPS Exposure

RvD1 (catalog # 10012554) was obtained from Cayman Chemicals (Ann Arbor, MI, USA). Lipopolysaccharide (LPS, Escherichia coli 0111: B4) was obtained from Sigma–Aldrich (St. Louis, MO, USA). Phosphate-buffered saline (PBS, B320JK) was obtained from Basal Media (Shanghai, China). The cells were divided into four groups: the vehicle-treated control group, the LPS group (100 ng/mL), the RvD1 group (100 ng/mL), and the LPS+RvD1 group (100 ng/mL). Different groups of supernatants were collected after 24 h and analyzed via ELISA (Supplementary Table S1). The concentrations of LPS and RvD1 used were based on our previous studies [22,23,24].

2.3. Enzyme-Linked Immunosorbent Assay (ELISA)

THP-1 cells (2 × 10⁵ cells/well) were seeded into 6-well plates and divided into four groups. The levels of secreted TNF-α (catalog # JL10208) and IL-1β (catalog # JL13662) in culture supernatants were determined with sandwich ELISA kits (Jianglai Biology, Shanghai, China). The standard solution, control solution, or sample solution was added to an ELISA plate precoated with a specific capture monoclonal antibody. Then, 100 µL of streptavidin-conjugated horseradish peroxidase was added to each well, followed by incubation of the mixture for 60 min at room temperature in the dark. After thorough washing, a substrate solution containing hydrogen peroxide and chromogen was added. After 15 min, a stop solution was added to each well. Cytokine levels were measured at 450 nm using a plate reader and normalized to the standard curve.

2.4. mRNA Sequencing

After LPS treatment, the cells were harvested, and total RNA was extracted with TRIzol reagent (AmbionÒ, Austin, TX, USA). The integrity and concentration of RNA were assessed, ensuring that the RNA integrity number (RIN) values were ≥6.5. Libraries for RNA sequencing were prepared via the TruSeq RNA Sample Preparation Kit V2 (Illumina, San Diego, CA, USA), with purified and fragmented mRNAs. Strand-specific libraries were constructed to increase the accuracy of gene function annotation and expression analysis. The libraries were subjected to PCR amplification and size selection of DNA fragments between 300 and 400 bp, followed by quality assessment using an Agilent 2100 Bioanalyzer (Agilent Technologies, Santa Clara, CA, USA). The libraries were sequenced on the Illumina Hiseq 2500 platform (Illumina, USA) utilizing a paired-end sequencing method with 2 × 150 bp, resulting in the acquisition of FastQ data.

2.5. Real-Time Quantitative Polymerase Chain Reaction

Total RNA was isolated using the TRIzol-chloroform extraction method (Ambion, Austin, TX, USA) and reverse transcribed into cDNA (Easy Quick RT MasterMix, CWBIO, Beijing, China). A thermal cycler (TC-96/G/HbC, BIOER, Hangzhou, China) was used for reverse transcription or PCR amplification. Real-time quantitative PCR (RT-qPCR) was performed on a Rotor-Gene Q5plex instrument (QIAGEN, Düsseldorf, Germany). GAPDH was used as a reference gene. Each sample was analyzed with the following primer sets listed in Supplementary Table S1. Data were analyzed using the comparative (2−△△CT) method [25].

2.6. Western Blotting

Total protein extraction buffer was prepared by adding 1% PMSF (1mM, Solarbio, Beijing, China) to RIPA solution (Solarbio, Beijing, China). After extraction, total protein concentration was determined using a BCA protein assay kit (CWBIO, China). A total of 40 µg of total protein was loaded onto the polyacrylamide (PAA) gel. Proteins from each group were separated by 12% SDS–PAGE and transferred to nitrocellulose membranes (Bio–Rad, Hercules, CA, USA). The membranes were blocked with 5% nonfat milk. Then, they were incubated with primary and secondary antibodies (1:3000, Proteintech, Rosemont, IL, USA) and visualized using a chemiluminescence system (ChemiScope 6100, QinXiang, Shanghai, China). NcmECL Ultra (NCM Biotech, Suzhou, China) was used to visualize protein bands using a chemiluminescence device (VILBER, Marne-la-vallée, France). The primary antibodies included nuclear factor-kappa B (NF-κB p65, 1:1000, Proteintech, USA), p38 mitogen-activated protein kinase (MAPK p38, 1:1000, Proteintech, USA), phosphoinositide 3-kinase (PI3K, 1:1000, Proteintech, USA), myeloid differentiation factor 88 (MyD88, 1:1000, Proteintech, USA), protein kinase B (AKT, 1:1000, Proteintech, USA), caspase-3 (CASP3, 1:1000, Proteintech, USA), B-cell lymphoma-2 (BCL-2, 1:1000, Proteintech, USA), and β-actin (1:1000, Proteintech, USA). Protein band densities were analyzed with ImageJ’s gel analysis tool (version 1.46r, Bethesda®, Montgomery, MD, USA).

2.7. Statistical Analysis

The data were obtained from three independent experiments and are reported as the means ± SDs (n = 3). For the mRNA sequencing data, differentially expressed genes (DEGs) were defined as an absolute value of log2 (fold change) > 1 and a p-value < 0.05. Other data were analyzed and visualized using GraphPad Prism software (version 10.3.1, San Diego, CA, USA). Data were assessed for normality and homogeneity of variance using the Shapiro–Wilk and Levene tests, respectively. For multiple comparisons, two-way analysis of variance (ANOVA) with Tukey’s post hoc test was used. A p-value < 0.05 was considered statistically significant unless otherwise indicated.

3. Results

3.1. Resolvin D1 Diminished LPS-Induced Inflammation in a Monocytic Cell Model

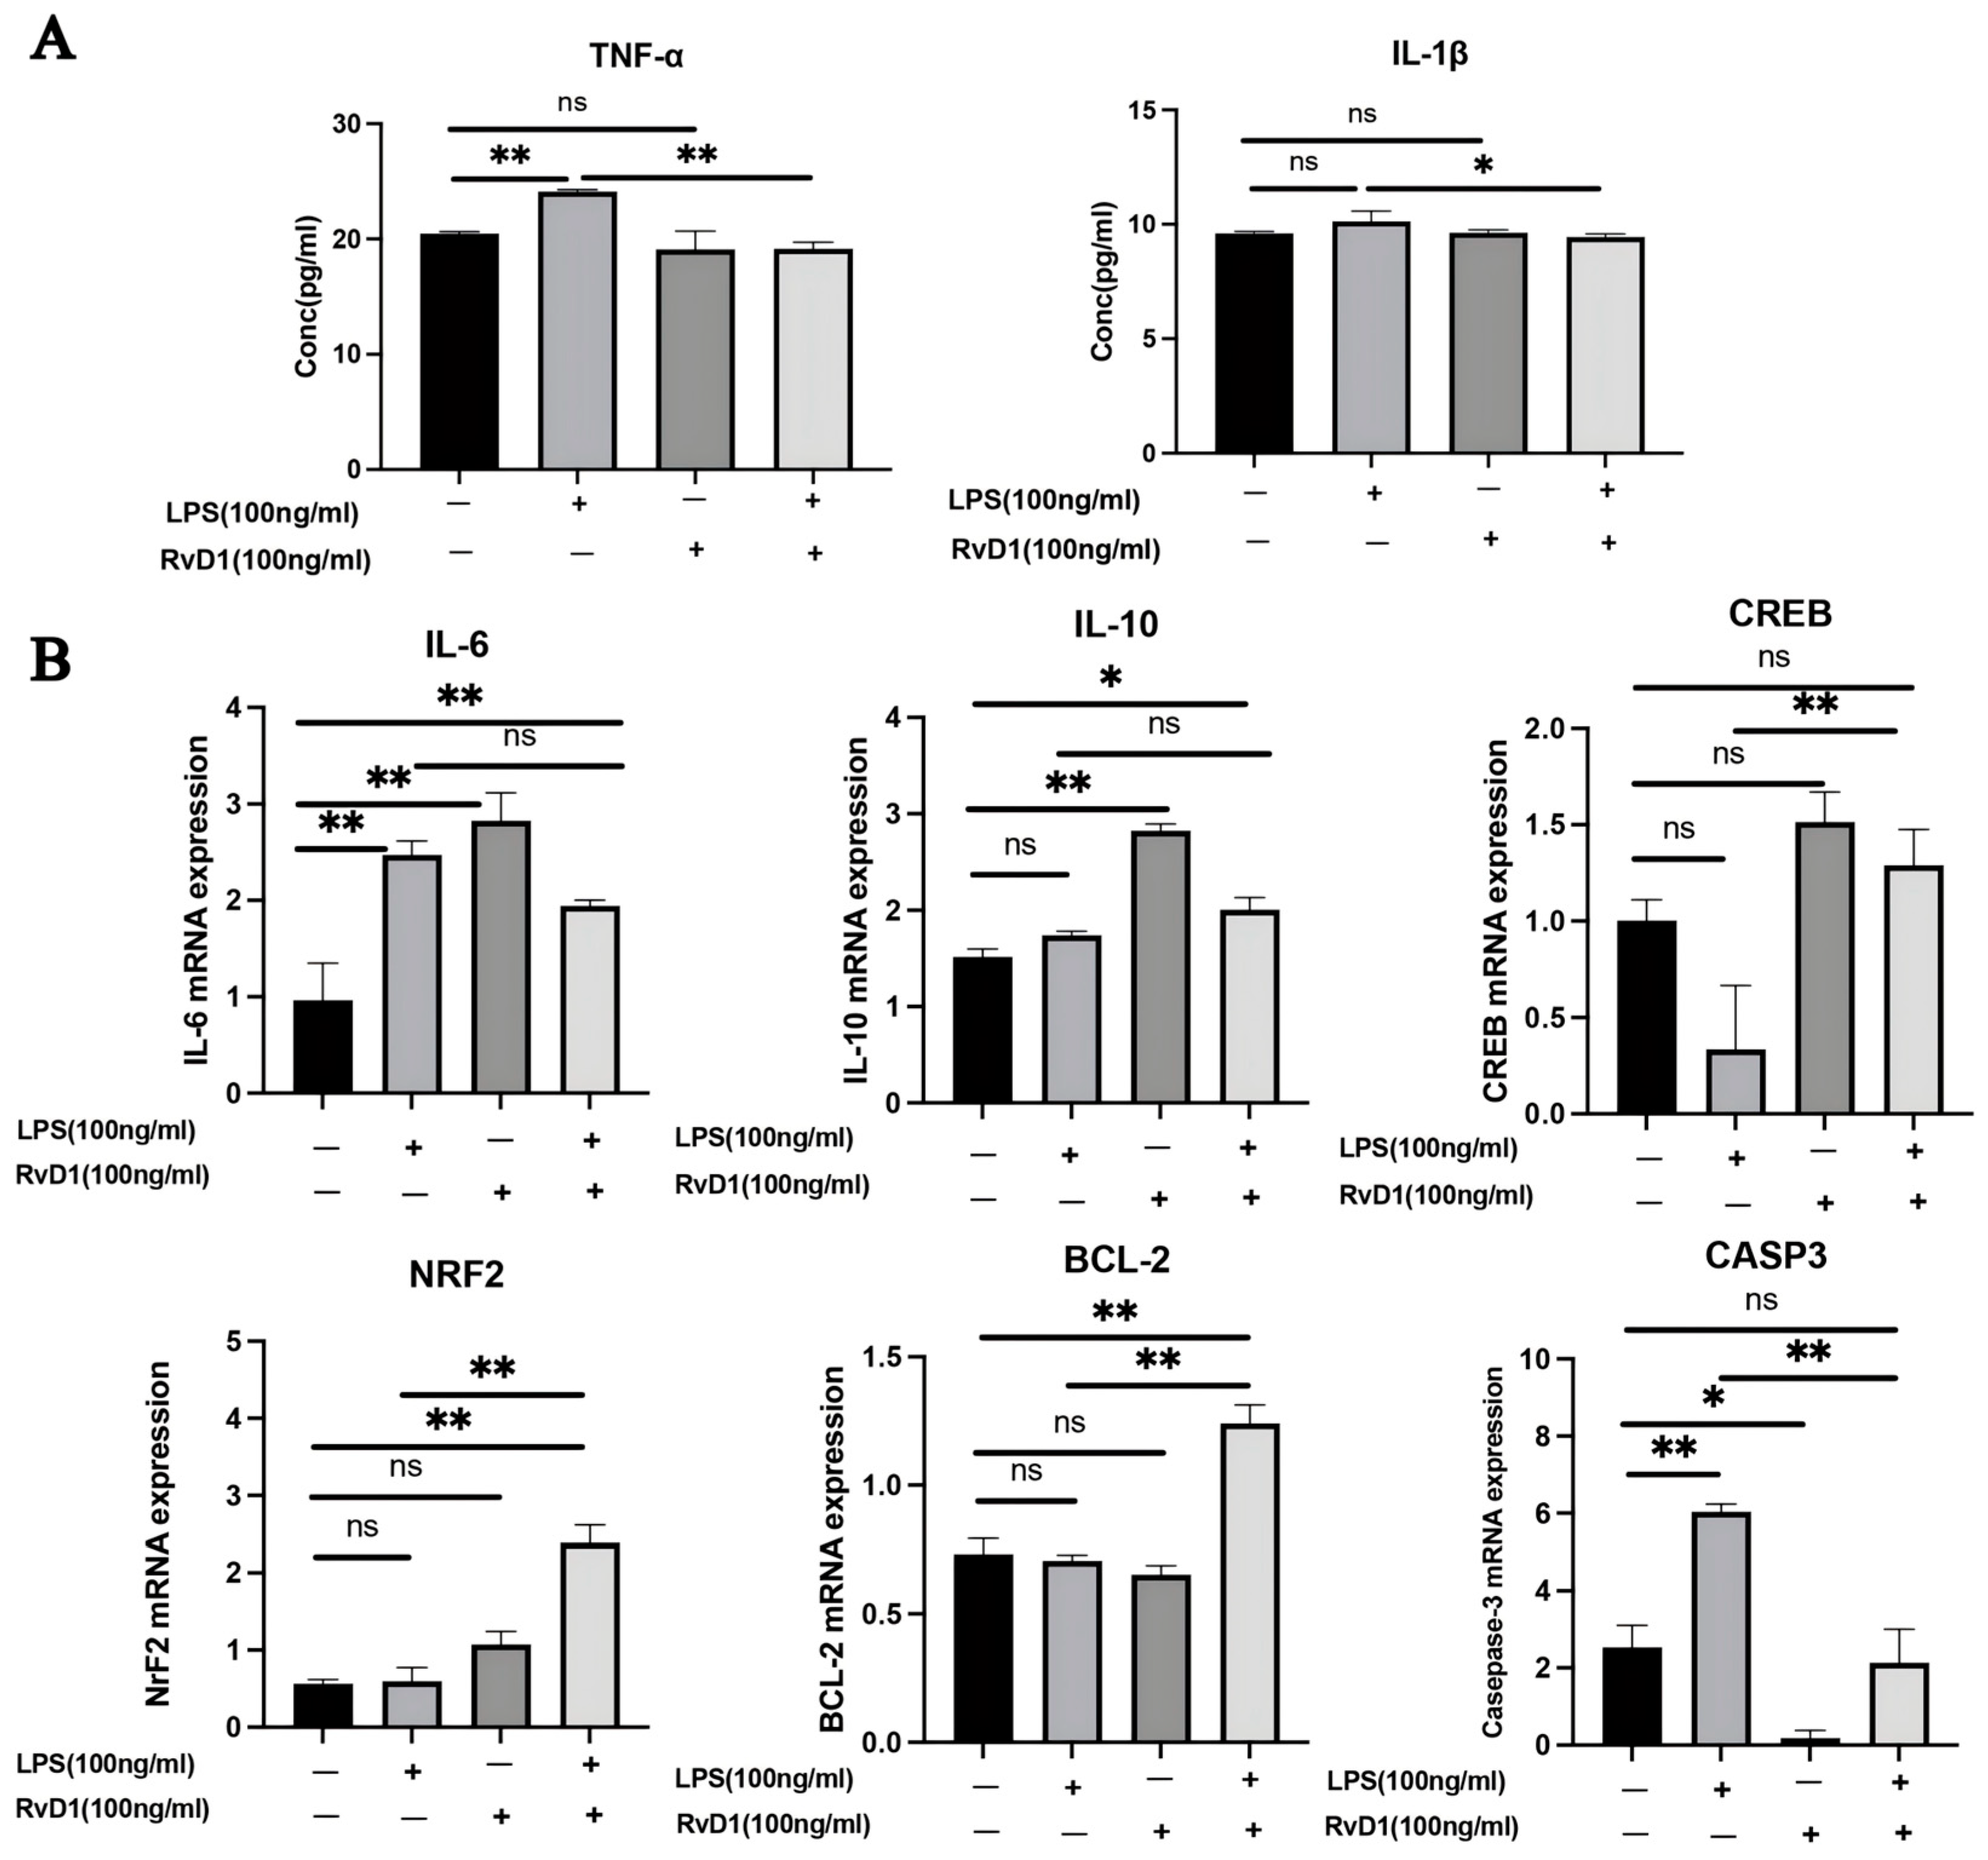
To address the role of RvD1 in an LPS-induced monocytic inflammation model, inflammatory and regulatory markers were assessed by ELISA and qPCR. ELISA analysis showed that LPS stimulation significantly increased TNF-α levels compared with the control group (p = 0.0035). Compared with the LPS-only group, RvD1 treatment significantly reduced the secretion of IL-1β and TNF-α (p = 0.0354 and p = 0.0005, respectively; Figure 1A).
qPCR analysis showed that LPS significantly increased the mRNA expression of IL-6 and CASP3 (p = 0.0006 for both; Figure 1B). Compared with the LPS-only group, LPS+RvD1 treatment showed a trend toward reduced IL-6 expression and increased IL-10 expression, although these changes did not reach statistical significance (p = 0.1218 and p = 0.1155, respectively). Notably, RvD1 significantly enhanced the mRNA expression of CREB (p = 0.0079) and NRF2 (p < 0.0001), reduced CASP3 expression (p = 0.0003), and increased BCL-2 expression (p = 0.0017; Figure 1B). These results suggest that RvD1 suppresses LPS-induced inflammatory cytokine production and may promote cytoprotective and anti-apoptotic transcriptional responses in monocytic cells.

3.2. Screening and Enrichment Analyses of DEGs

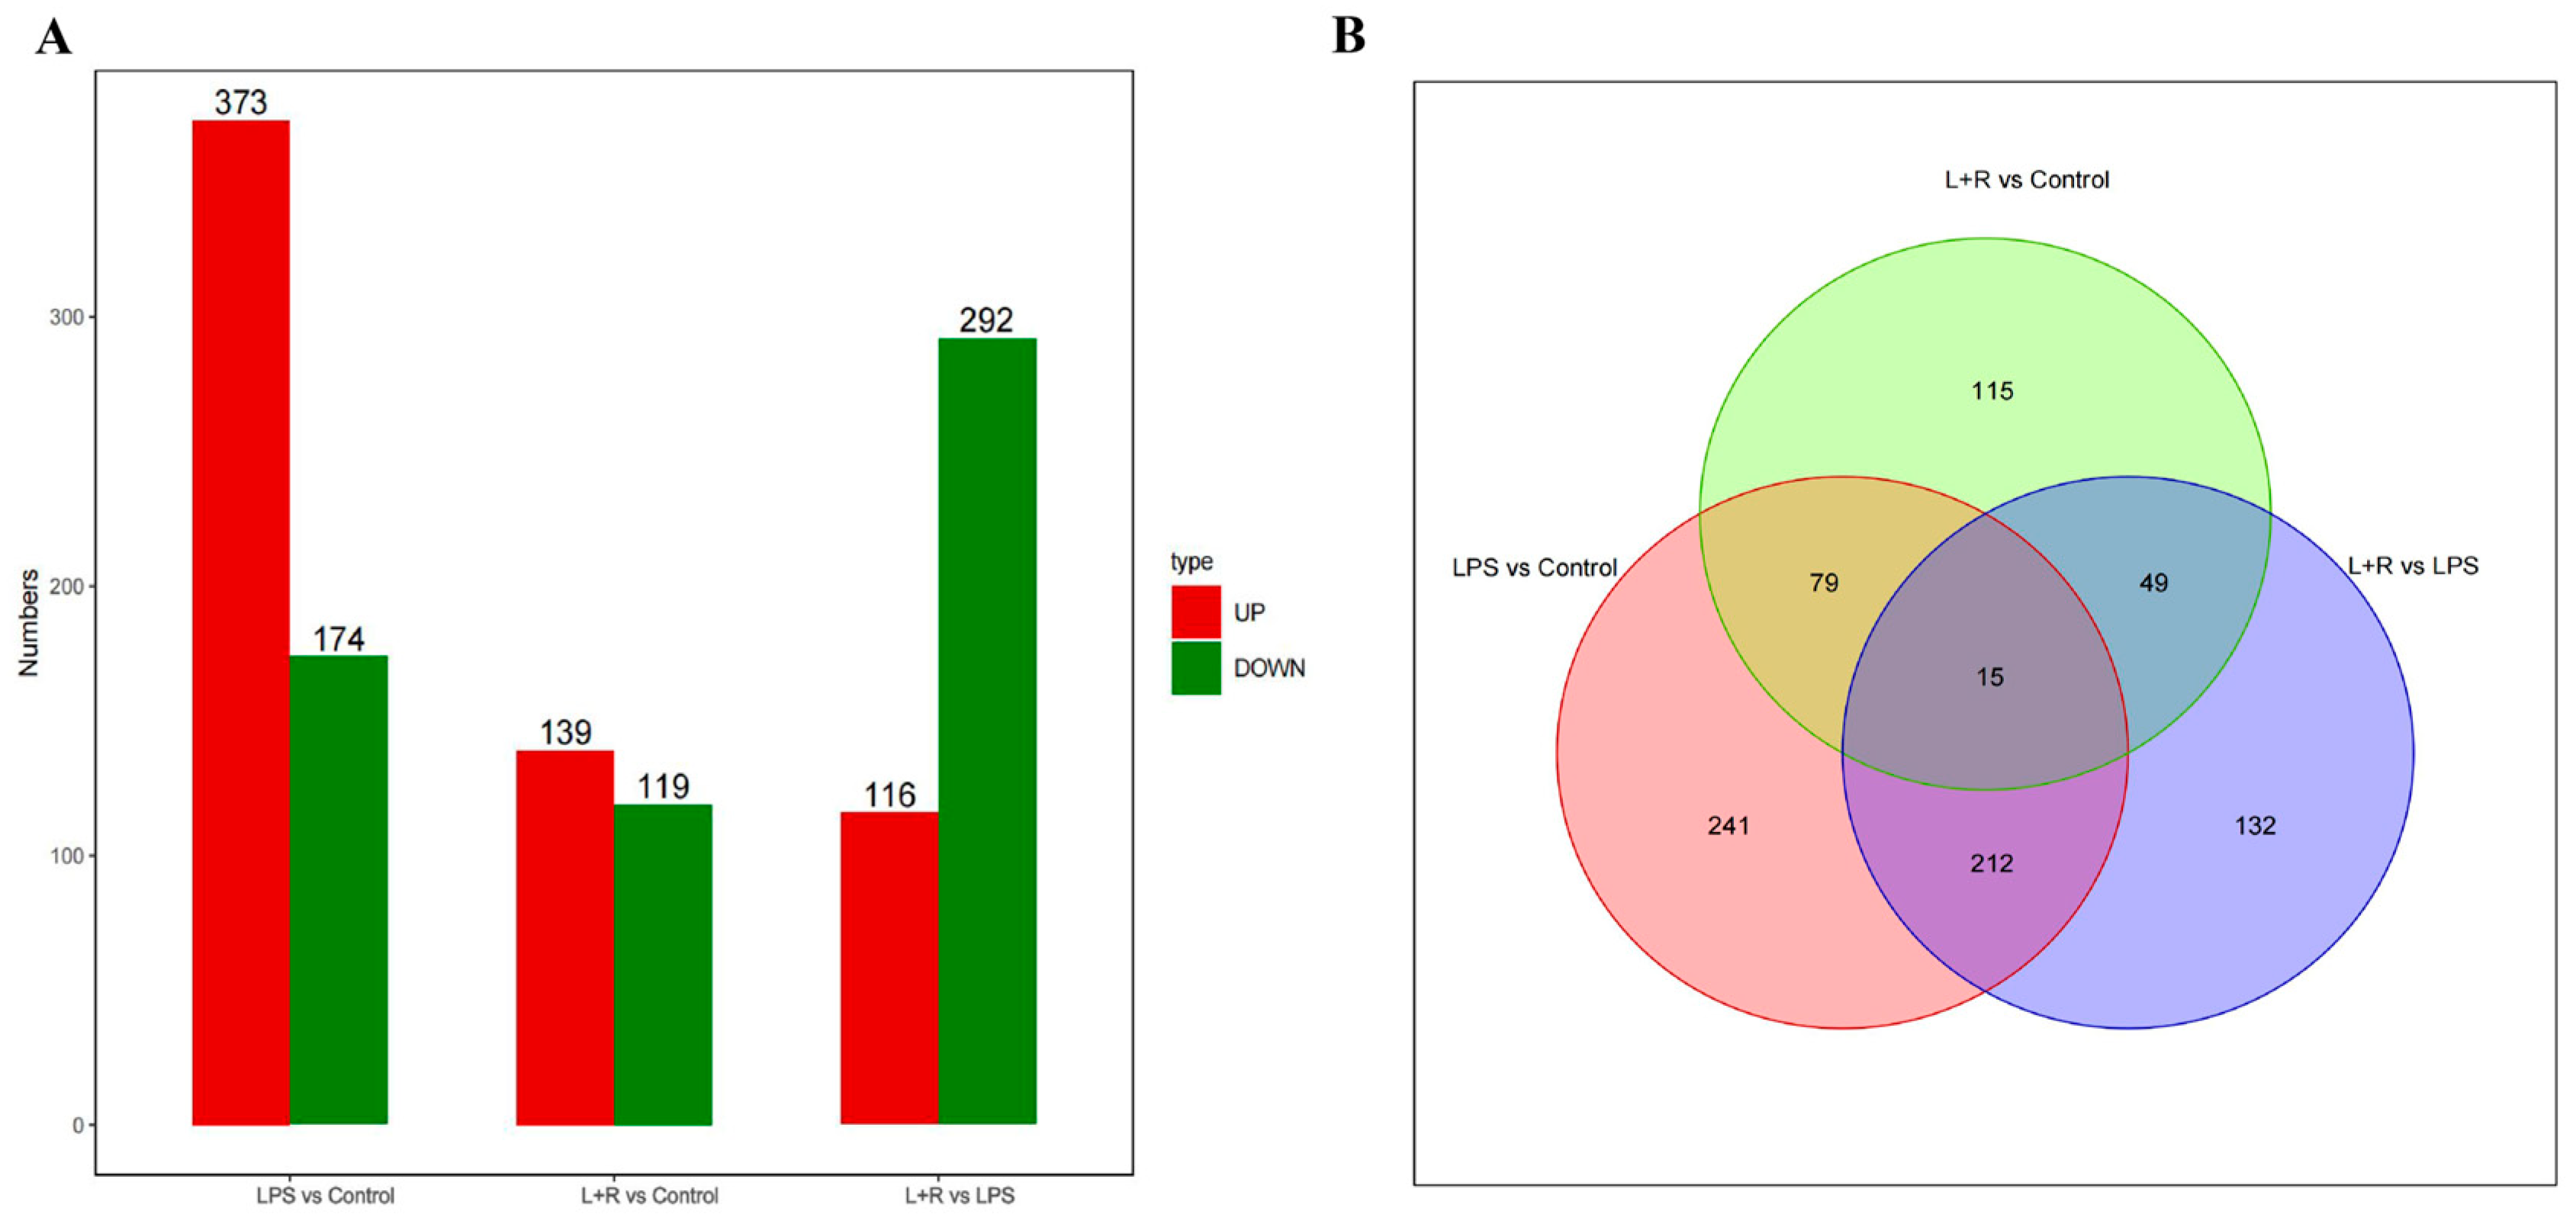
Principal component analysis (PCA) was performed to visualize the gene expression profiles of three sample groups: the control (Control), LPS (LPS), and the LPS+RvD1 (L+R) groups. The PCA revealed distinct clustering patterns among these groups (Supplementary Figure S1). DEGs were subjected to statistical analysis to determine their counts and distribution across the comparison groups. The bar chart below illustrates the distribution of DEGs in each comparison group (Figure 2A). Compared with the control group, 373 DEGs were upregulated, and 174 DEGs were downregulated in the LPS group (Figure 2A). Compared with the control group, 139 DEGs were upregulated, and 119 DEGs were downregulated in the LPS+RvD1 group (Figure 2A). Interestingly, only 116 DEGs were upregulated, and 292 DEGs were downregulated in the LPS+RvD1 group compared with the LPS group (Figure 2A). Overlaps occurred among the three groups of DEGs (Figure 2B). To visualize these shared genes, the top 50 DEGs common to the three groups were plotted in a heatmap (Supplementary Figure S2).
Based on the distribution of DEGs among the three sample groups, the results are as follows: (1) a total of 187 common DEGs were upregulated in the LPS group vs. the Control group but downregulated in the LPS+RvD1 group vs. the LPS group (Figure 2B) (Table 1). (2) 40 common DEGs were downregulated in the LPS group vs. the Control group but upregulated in the LPS+RvD1 group vs. the LPS group (Figure 2B) (Table 1). (3) A total of 309 DEGs were commonly upregulated in the LPS group vs. the Control group but were inhibited by RvD1 treatment in the LPS+RvD1 group vs. the Control group (Figure 2B) (Table 2). (4) Of these 309 DEGs, only two DEGs were downregulated in the LPS+RvD1 group vs. the Control group, while the remaining 307 DEGs exhibited negligible expression in the LPS+RvD1 group vs. the Control group (Figure 2B) (Table 2). The top 20 genes were selected from these common DEGs based on the absolute value of log2 fold change. Through differential GO enrichment and hierarchical clustering analysis, we identified certain DEGs that are associated with inflammation. The expression levels of CREB1 and BCL-2L12 were downregulated by LPS but upregulated by RvD1 (Table 3). Additionally, the expression levels of DEGs such as IL1B, TNFAIP6, CASP3, and NFKB2 were upregulated by LPS but suppressed by RvD1 treatment (Table 3).

3.3. Resolvin D1 Regulates the Monocyte-Mediated Inflammatory Response to LPS: GO and KEGG Pathways Analysis

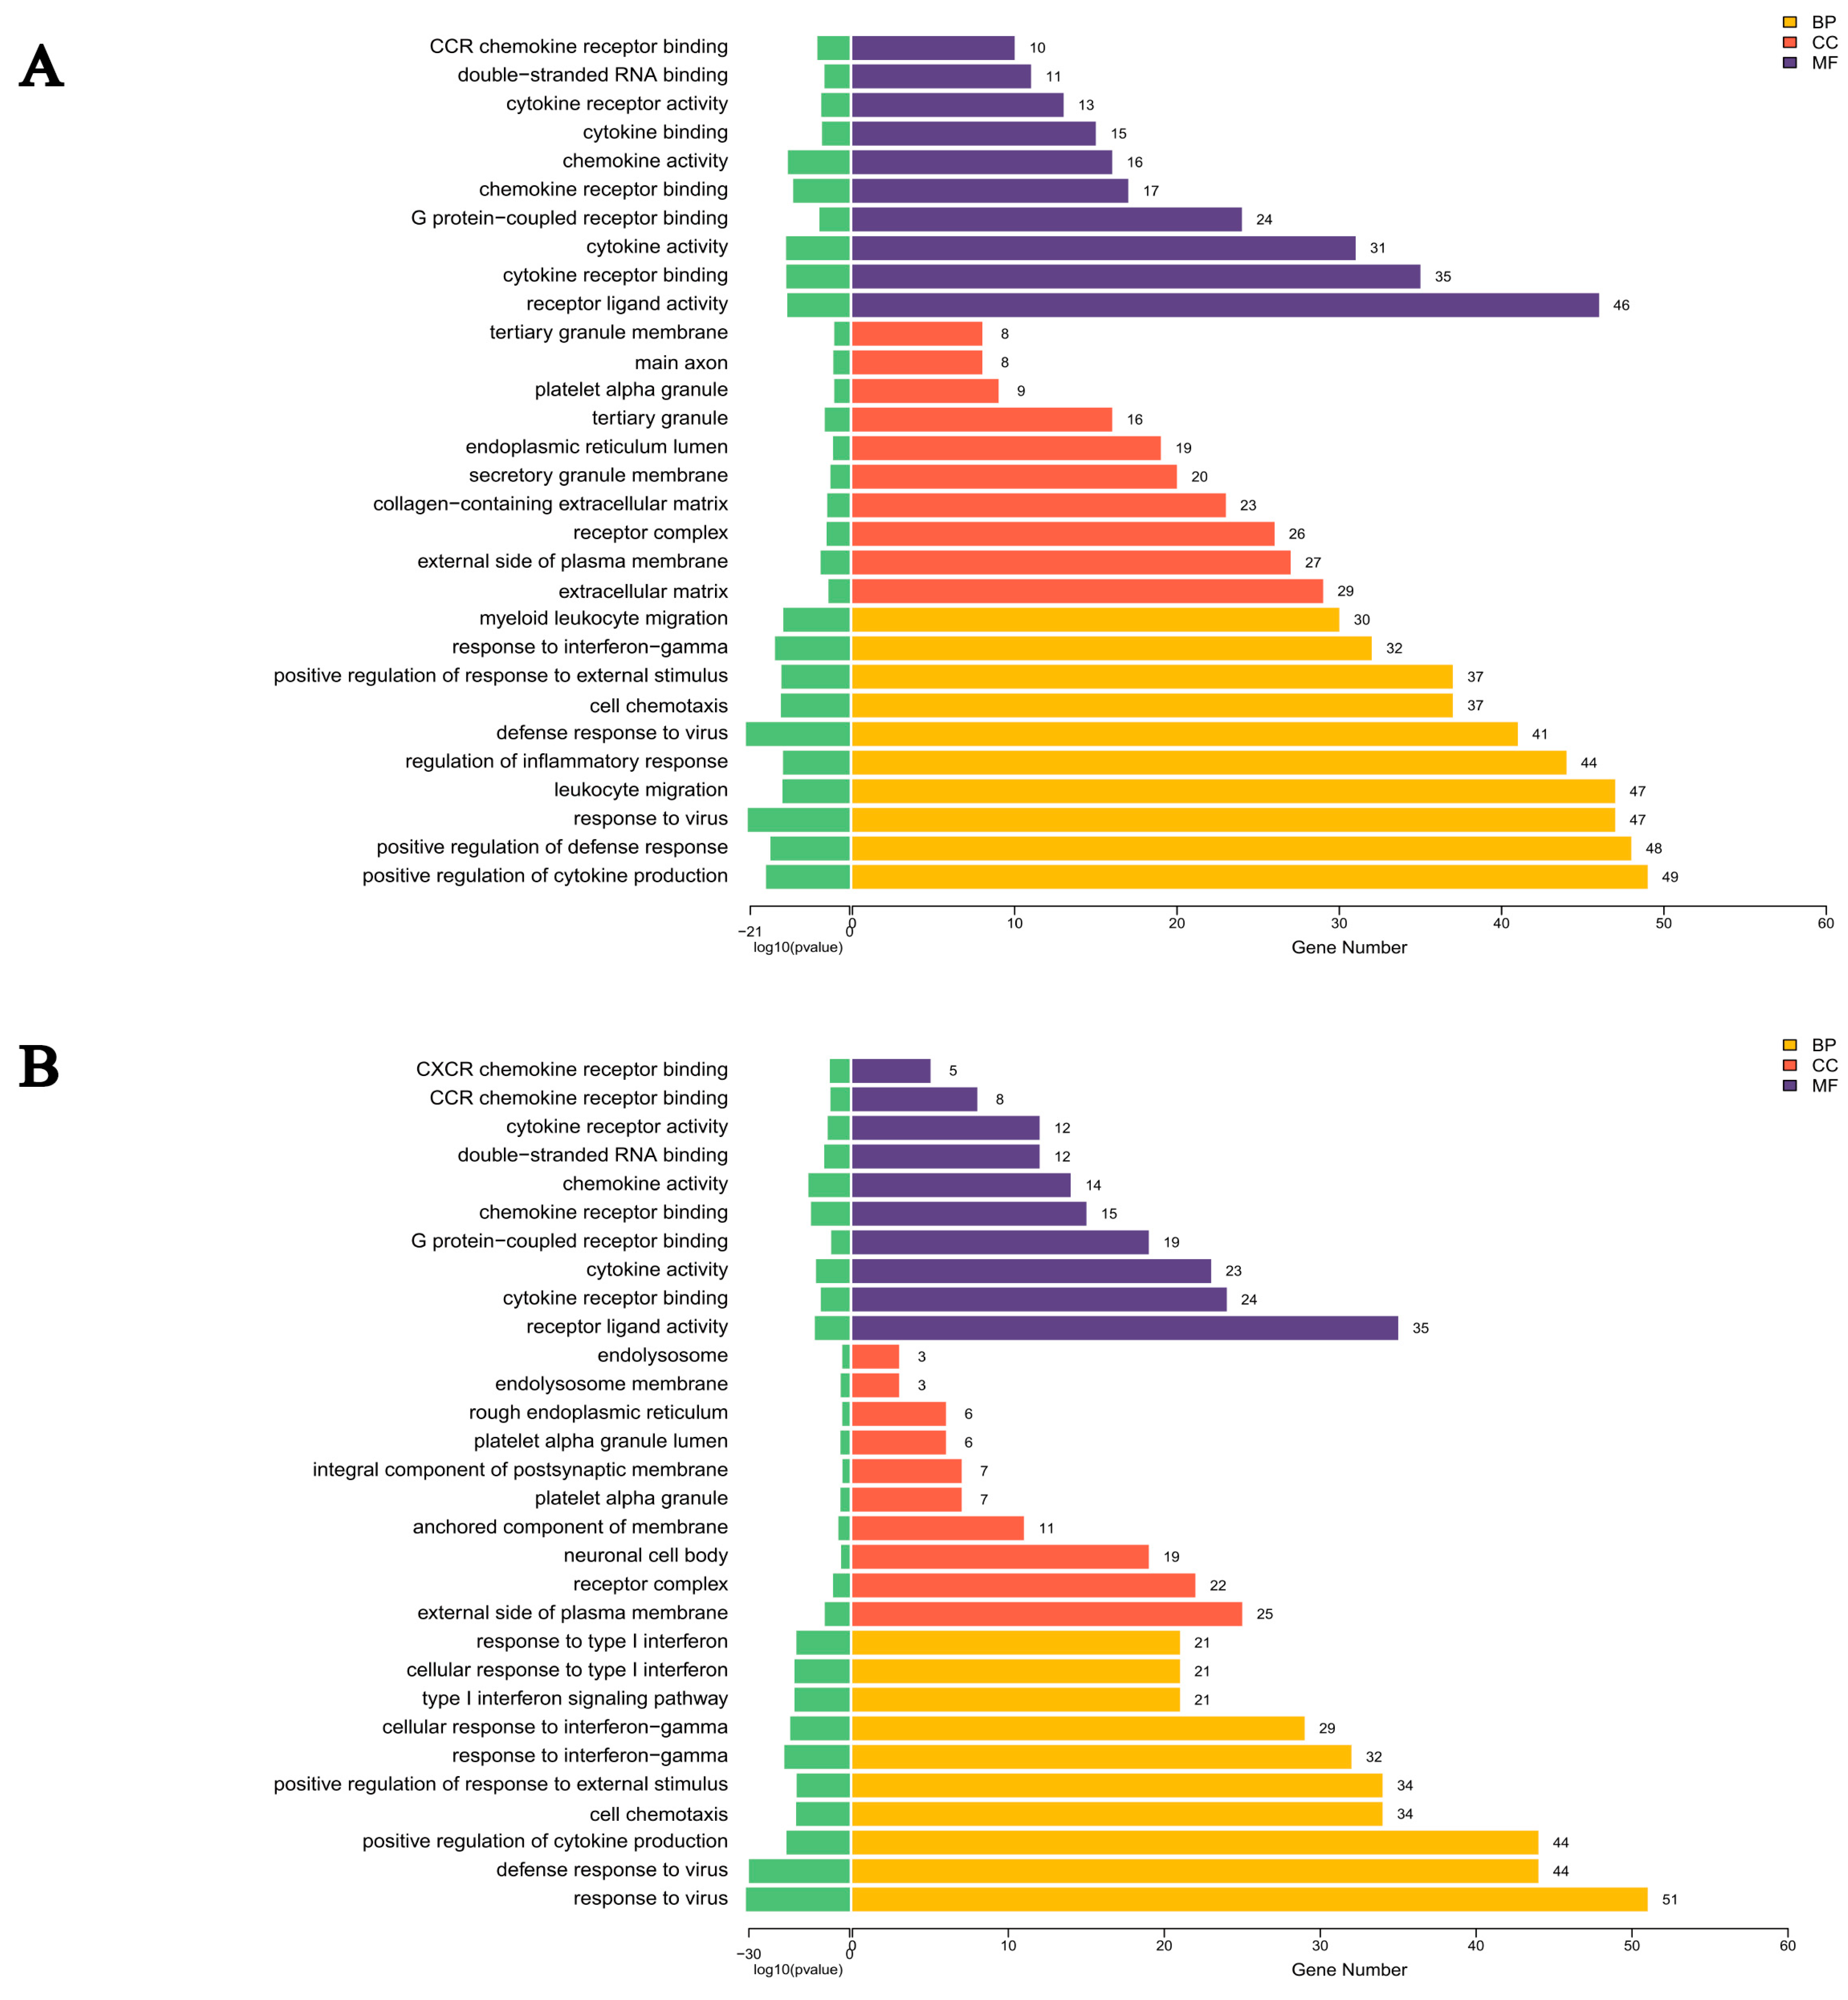
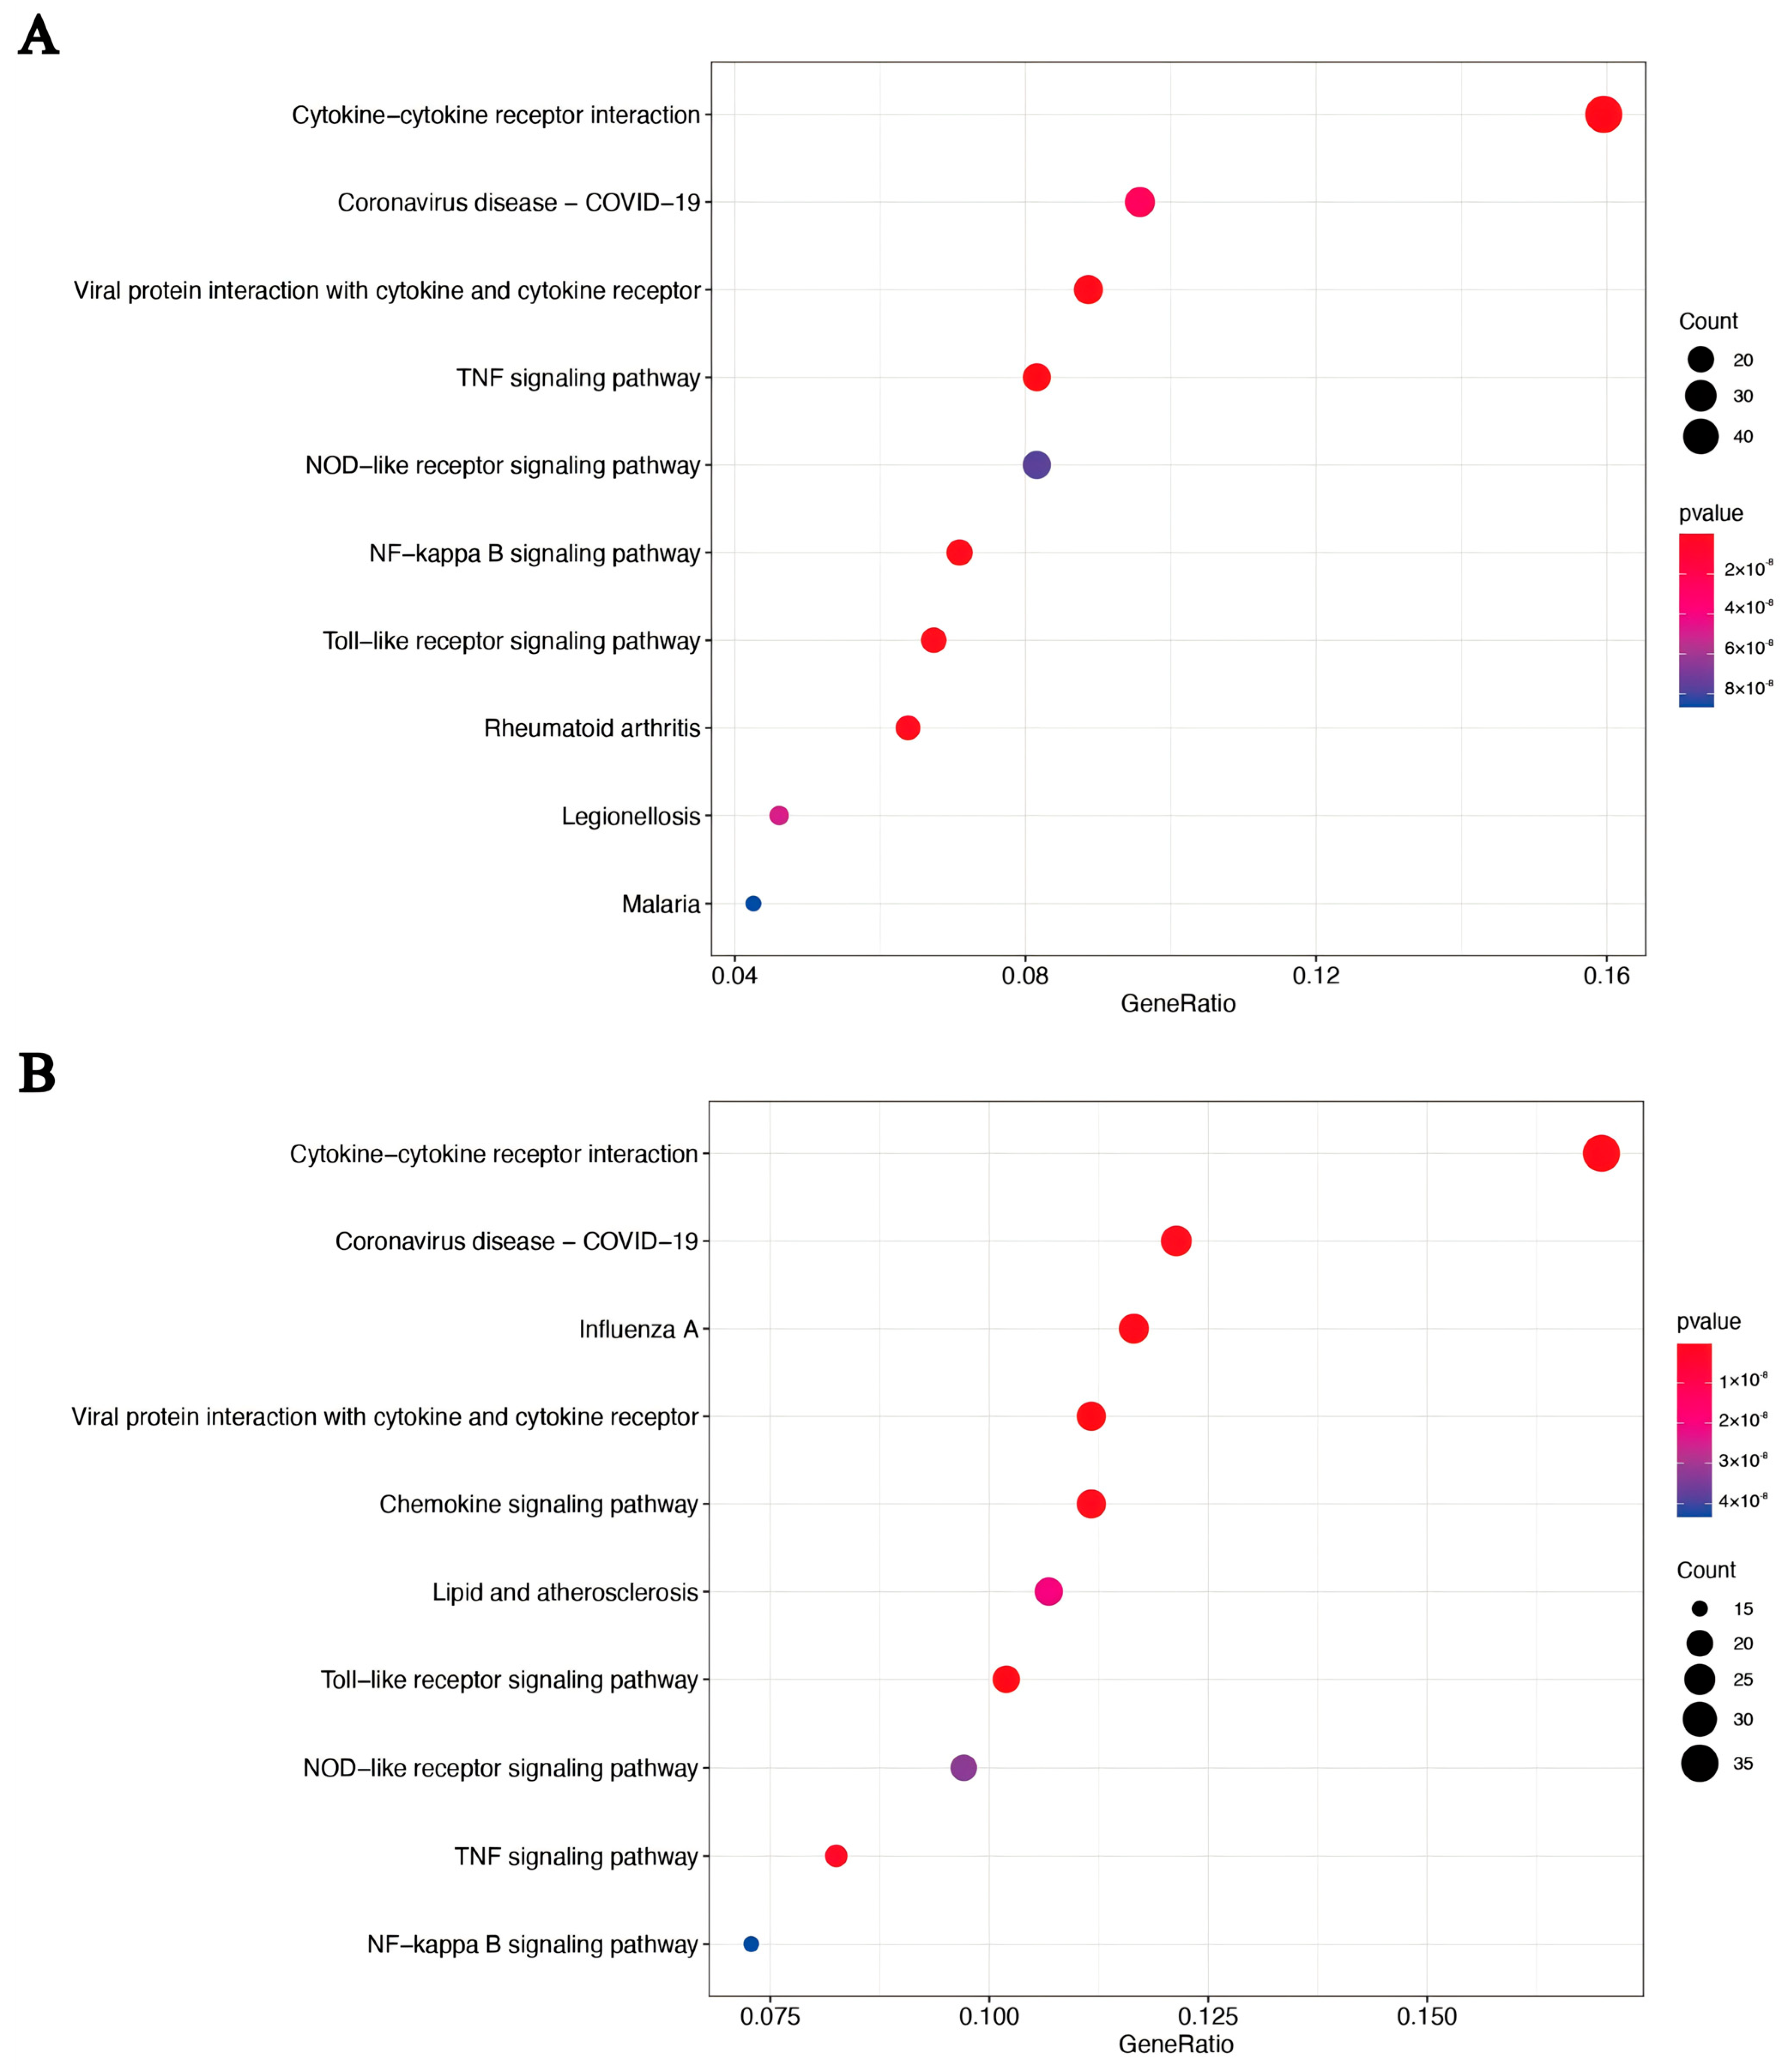
Based on Gene Ontology (GO) functional annotation, the significant DEGs were classified according to biological processes (BP), cellular components (CC), and molecular functions (MF) (Figure 3A,B). KEGG enrichment analysis was conducted to identify the top 10 differentially expressed mRNAs associated with cellular signaling pathways. In both the LPS group and LPS+RvD1 group, the inflammation-related signaling pathways common to both groups included the TNF signaling pathway, NOD-like receptor signaling pathway, NF-κB signaling pathway, and Toll-like receptor signaling pathway (Figure 4A,B). Moreover, transcriptome analysis revealed that the LPS group, compared to the control group, showed upregulation of genes associated with inflammatory signaling pathways, specifically the MAPK and NF-κB p65 signaling pathways (Supplementary Figure S3). Notably, transcriptomic analysis indicated that the treatment groups (LPS group and LPS+RvD1 group) displayed the key genes of the MAPK p38 pathway and its downstream signaling cascades and influenced the expression of apoptosis-related genes.

3.4. Effects of Resolvin D1 on MAPK in LPS-Induced THP-1 Cells

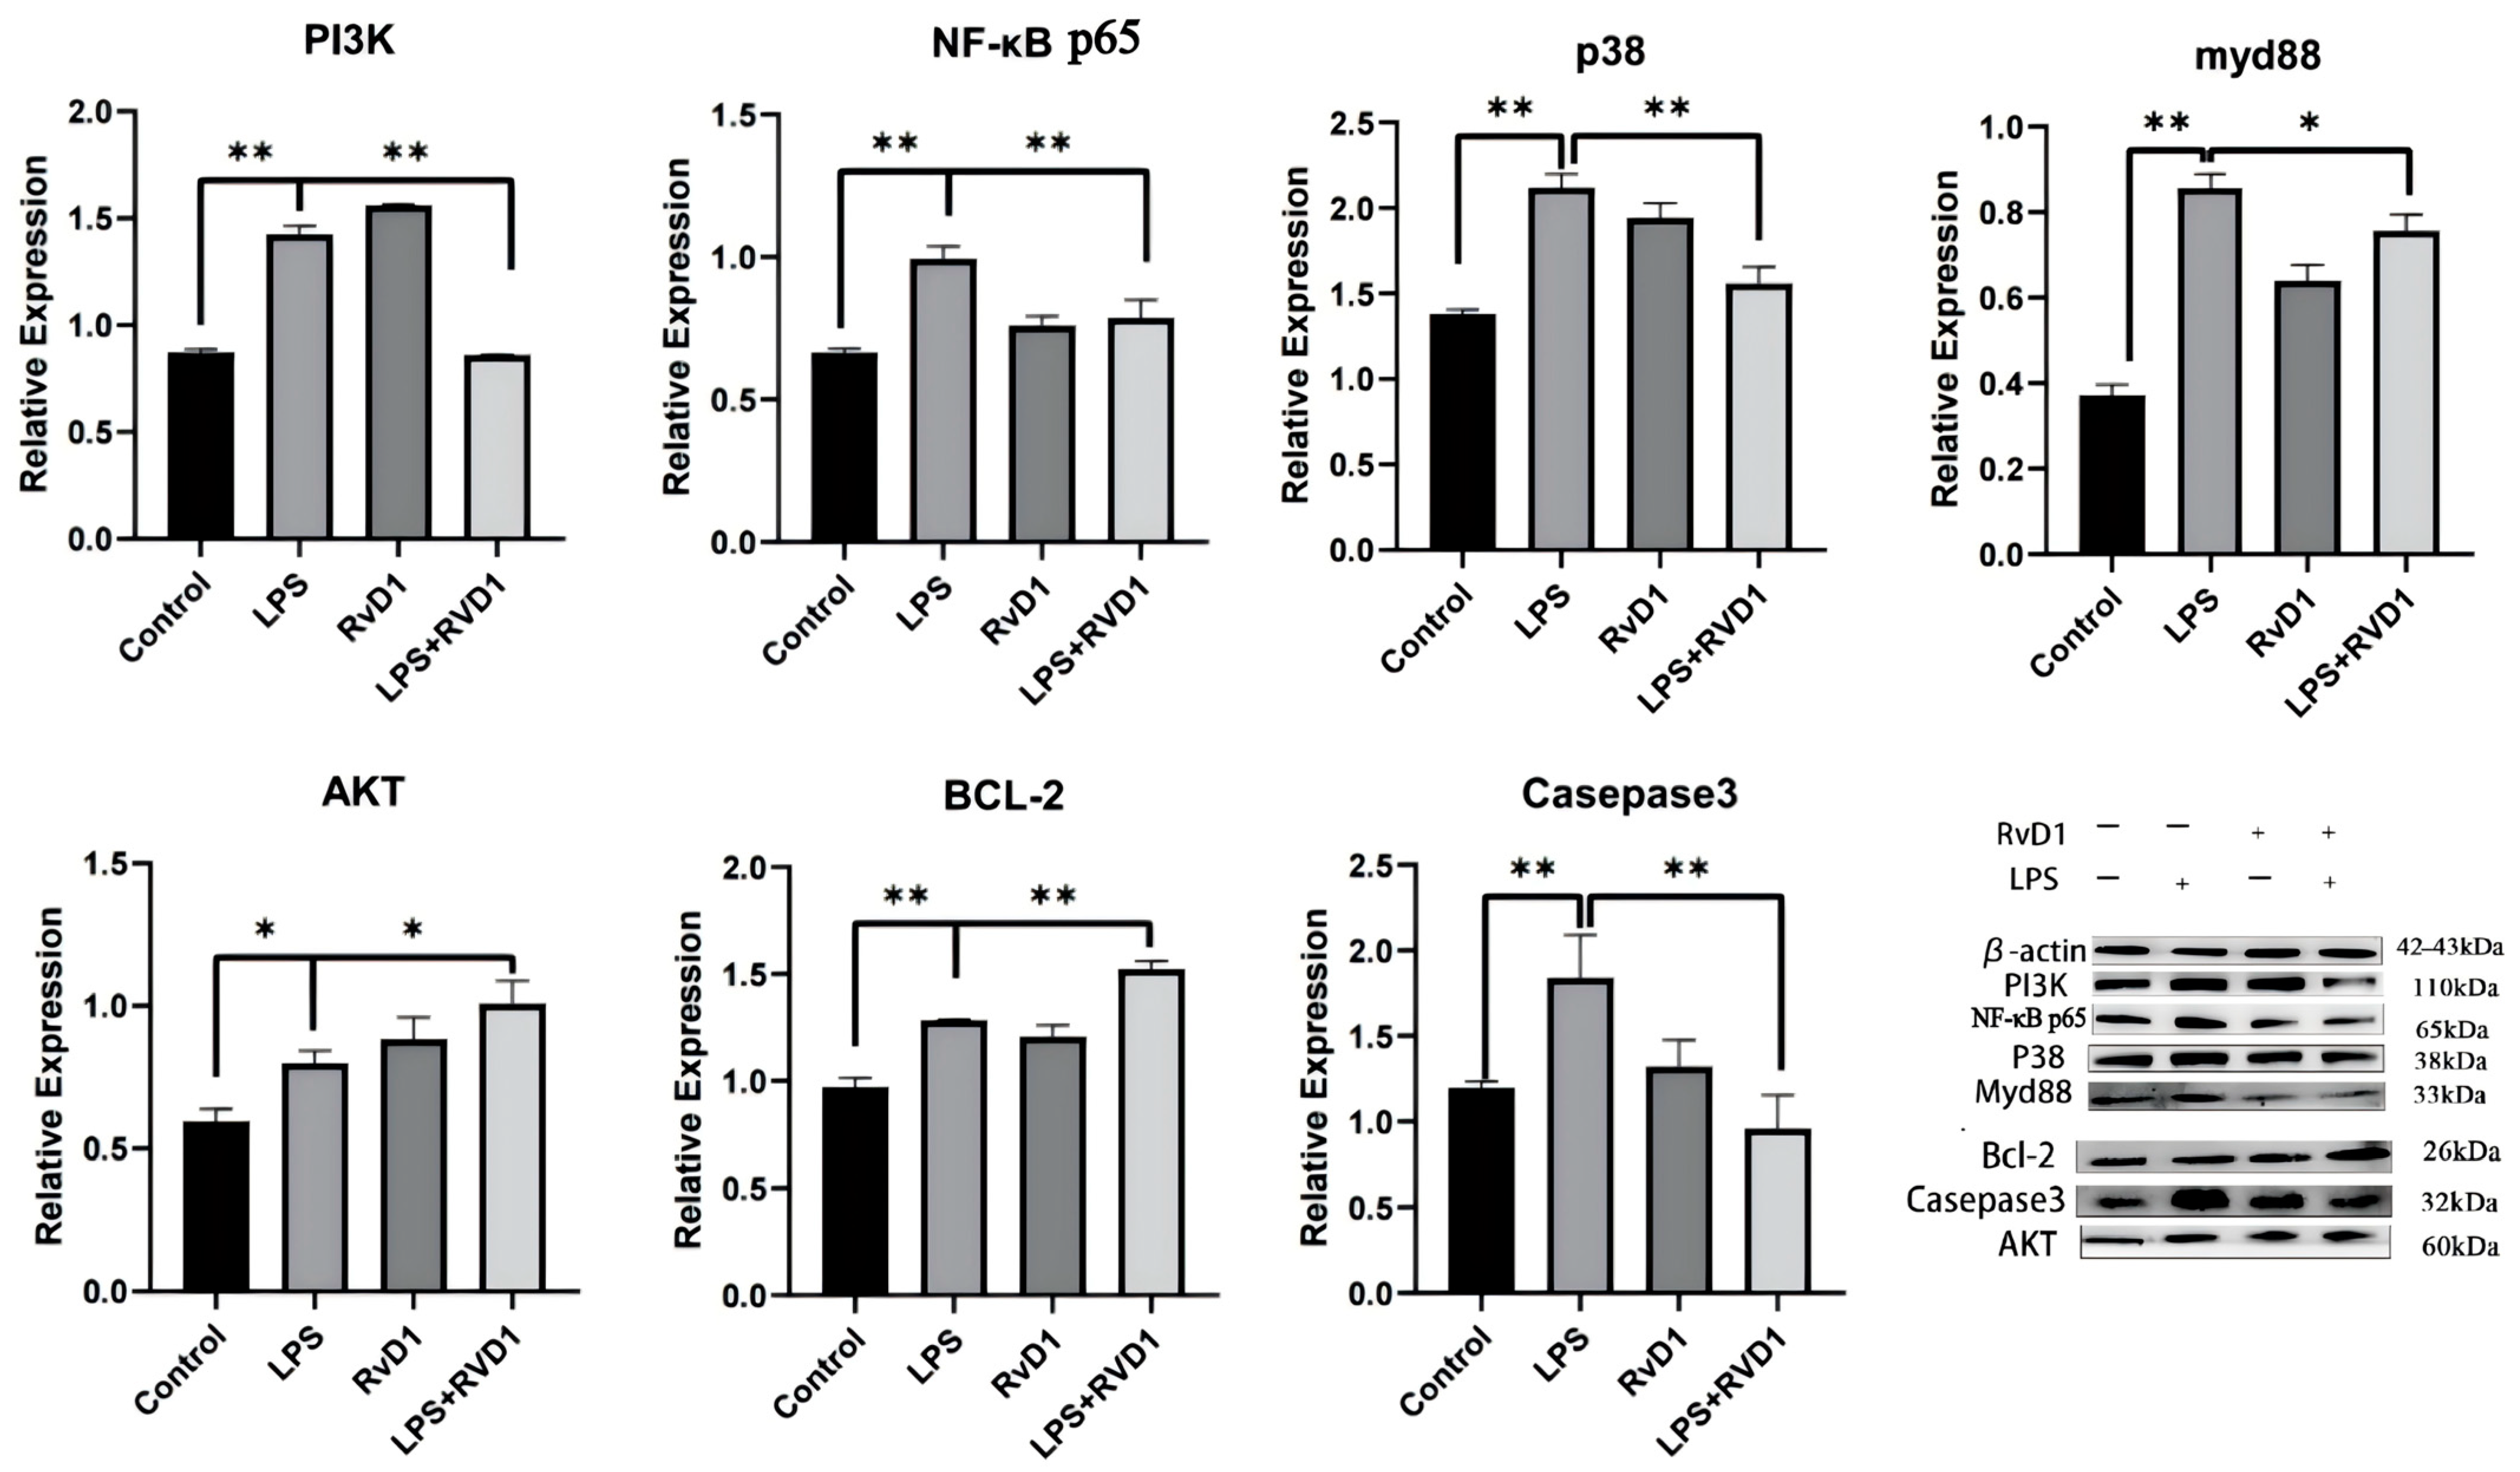
RvD1 attenuated LPS-induced expression of the MAPK p38 signaling pathway. In THP-1 cells, RvD1 suppressed PI3K expression and reduced the levels of NF-κB p65 and MyD88 (Figure 5). RvD1 increased BCL-2 gene and protein expression, as confirmed by WB and RT-PCR. Additionally, the expression of the CASP3 gene and protein was significantly upregulated following RvD1 treatment (Figure 1B and Figure 5).

4. Discussion

Inflammation resolution is recognized as an active biochemical process in which mediators such as cyclooxygenase-2 (COX-2) lead to prostaglandin E2 (PGE2) production, shifting neutrophil lipid mediator biosynthesis from the 5-lipoxygenase (5-LOX) and leukotriene B4 (LTB4) pathways to the pro-resolving lipoxin A4 (LXA4) pathway [26,27,28]. This shift enhances monocyte migration and phagocytosis of apoptotic neutrophils [11]. RvD1 plays a crucial role in this process by modulating immune cell function through the regulation of miRNAs, particularly miR-146b, miR-21, miR-219, and miR-208a, which target pathways such as 5-LOX, reducing LTB4 synthesis and further recruitment of PMNs [15,29,30]. This regulation is time-specific, with significant miRNA expression changes peaking at 24 h [11,15]. Understanding the impact of RvD1 on inflammation at the genetic level through high-throughput mRNA sequencing could advance therapeutic strategies for inflammatory diseases [31,32,33,34].
In this study, we demonstrated that RvD1 effectively inhibits LPS-induced pro-inflammatory cytokine production in human monocytes by regulating gene expression. Using mRNA sequencing, we identified genes that were differentially expressed across the control, LPS, and LPS+RvD1 groups. Our analysis revealed that 187 genes upregulated by LPS were downregulated following RvD1 treatment, whereas 40 genes downregulated by LPS were upregulated in the LPS+RvD1 group (Table 1). These findings suggest targeted modulation by RvD1 at the genetic level, particularly with respect to the regulation of the BCL-2 gene, which was significantly downregulated in the LPS group and upregulated in the LPS+RvD1 group (Figure 1B). Moreover, some DEGs that were upregulated in the LPS group relative to control were suppressed by RvD1 treatment in the LPS+RvD1 group (Table 2). Additionally, we observed that RvD1 treatment attenuated the upregulation of 309 genes induced by LPS, with only 64 of these genes still upregulated in the LPS+RvD1 group, indicating a robust inhibitory effect of RvD1 on LPS-induced gene expression. This gene regulation pattern underscores the potential mechanisms by which RvD1 mediates its anti-inflammatory effects. Further investigations into these specific genetic pathways are warranted to better understand and enhance the therapeutic application of RvD1 under inflammatory conditions.
Through differential GO enrichment and hierarchical clustering analysis, we identified key genes and signaling pathways, including CREB1 and BCL-2L12, which were downregulated by LPS but upregulated by RvD1 (Table 3). Additionally, the expression of genes such as IL1B, TNFAIP6, CASP3, and NFKB2, which were upregulated by LPS, was suppressed by RvD1 treatment. In particular, the BCL-2 gene, known for its role in regulating mitochondrial apoptosis [35] by altering the redox state of mitochondrial sulfhydryl groups and controlling the membrane potential, was significantly upregulated after RvD1 treatment (Figure 5) [36,37]. This finding aligns with previous studies showing that RvD1 modulates anti-inflammatory and anti-apoptotic pathways, notably reducing the activity of the Caspase-3 signaling pathway (Figure 5) [38,39,40]. These results underscore the potential of RvD1 to mitigate LPS-induced inflammatory responses by modulating the Caspase-3 signaling pathway and enhancing BCL-2 expression, thereby offering insights into its therapeutic application for inflammatory conditions [41,42]. This effect was validated at the protein level, revealing that RvD1 treatment markedly inhibited key proteins in the MAPK p38 signaling pathway, including PI3K, MyD88, and NF-κB p65 (Figure 5).
Notably, although the reduced total Caspase-3 observed in this study may suggest a potential anti-apoptotic effect of RvD1, this finding should be interpreted with caution. Cleaved Caspase-3 has been confirmed as a specific marker of apoptosis across different cell types and apoptosis models. A previous study confirmed that RvD1 can upregulate cleaved Caspase-3 in LPS-stimulated bone marrow-derived macrophages (BMDMs), promoting macrophage apoptosis through the Fas/caspase-3 signaling pathway [43]. Therefore, future studies should include apoptosis-specific markers, particularly cleaved Caspase-3, to further clarify the context-dependent effects of RvD1 on apoptotic signaling.
Furthermore, evaluating a range of RvD1 concentrations would help determine its dose-dependent effects on key proteins in the MAPK p38 signaling pathway. To clarify whether NF-κB and MAPK p38 are critical pathways for RvD1 to exert its anti-inflammatory effect, a “forced activation” or “pathway rescue” experimental approach could be utilized [44,45]. For instance, additional groups could be established by supplementing RvD1 treatment with specific activators or inhibitors of NF-κB and p38. Further studies are needed to address the aforementioned issues.
In this study, THP-1 monocytic cells without PMA treatment were chosen as an in vitro cell model for resolvin-mediated inflammation resolution. The viability of THP-1 monocytic cells induced by PMA was reduced, and after treatment with LPS and/or RvD1, the total number of cells was insufficient to meet the minimum requirements for high-throughput RNA sequencing. The 24 h treatment duration was selected based on theoretical predictions and is consistent with Bannenberg’s indication that the optimal duration to promote inflammation resolution should not exceed 48 h [11,15]. Theoretically, prolonged exposure to RvD1 is expected to enhance its effect on promoting inflammation resolution. Therefore, limiting the observation period to 24 h in this study may not fully capture the temporal dynamics of its effect. In Figure 1B, IL-6 gene expression was significantly increased in the LPS group (p = 0.0006), while it was downregulated in the LPS+RvD1 group; however, this reduction was not statistically significant (p = 0.1218). This result may be influenced by the duration of treatment in the LPS+RvD1 group, as extended treatment duration has been shown to diminish the magnitude of IL-6 gene expression downregulation [32]. A possible explanation is that under LPS stimulation, the RvD1 receptor ALX/FPR2 is significantly upregulated at 6 h. Since RvD1 primarily regulates the microRNA expression network through this receptor, it subsequently modulates IL-6 production. Interestingly, compared to the control group, the RvD1 group exhibited a statistically significant upregulation of IL-6 gene expression (p = 0.0003). The RvD1-induced elevation of pro-inflammatory factors may be attributed to early signaling events that occur as this pro-resolving mediator initiates the inflammation resolution program. A previous study showed that a 4 h treatment with RvD1 alone induces a transient upregulation of IL-6 gene expression in mouse peritoneal macrophages [46]. Compared to the LPS group, the gene expression levels of IL-10 were upregulated in the LPS+RvD1 group; however, this difference was not statistically significant. Prolonging the duration of RvD1 treatment to 48 h might detect a more pronounced effect of RvD1 in inducing an upregulation of IL-10 gene expression. Compared to the control group, IL-10 gene expression was significantly increased (p = 0.0004) in the RvD1 group. The mechanisms underlying RvD1-mediated upregulation of IL-10 gene expression are multifaceted, primarily involving the activation of intracellular signaling (such as the cAMP pathway) through ALX/FPR2 and potentially enhancing IL-10 gene transcription by activating transcription factors such as CREB or by upregulating specific microRNAs (e.g., miR-208a). These factors also explain the upward trend of CREB gene expression levels in the RvD1 group compared to the control group.
In Figure 4, compared to the control group, the protein expression level of PI3K in the RvD1 group showed an upward trend. This may be attributed to the cytoprotective mechanism of RvD1, which is mediated by the activation of the PI3K/Akt pathway. Therefore, when RvD1 is administered to monocytes as a single agent, it upregulates PI3K expression through this signaling cascade. Additionally, compared to the control group, the protein expression of AKT in the LPS group showed a statistically significant increase (* p < 0.05). A possible explanation for this finding might be that LPS stimulation did not result in a reduction in substances that subsequently regulate AKT expression, such as Ras kinase, calcium ions, and cytokines. Our mRNA sequencing results suggest that Ras kinase is correlated with the B-Raf serine/threonine kinase (BRAF) gene, which is upregulated after LPS treatment (Supplementary Figure S3). Another possible explanation is that THP-1 monocytes secrete specific cytokines to regulate and increase the expression of AKT under LPS stimulation. The most plausible explanation for this observation is that the duration of LPS treatment is too short to downregulate AKT expression.
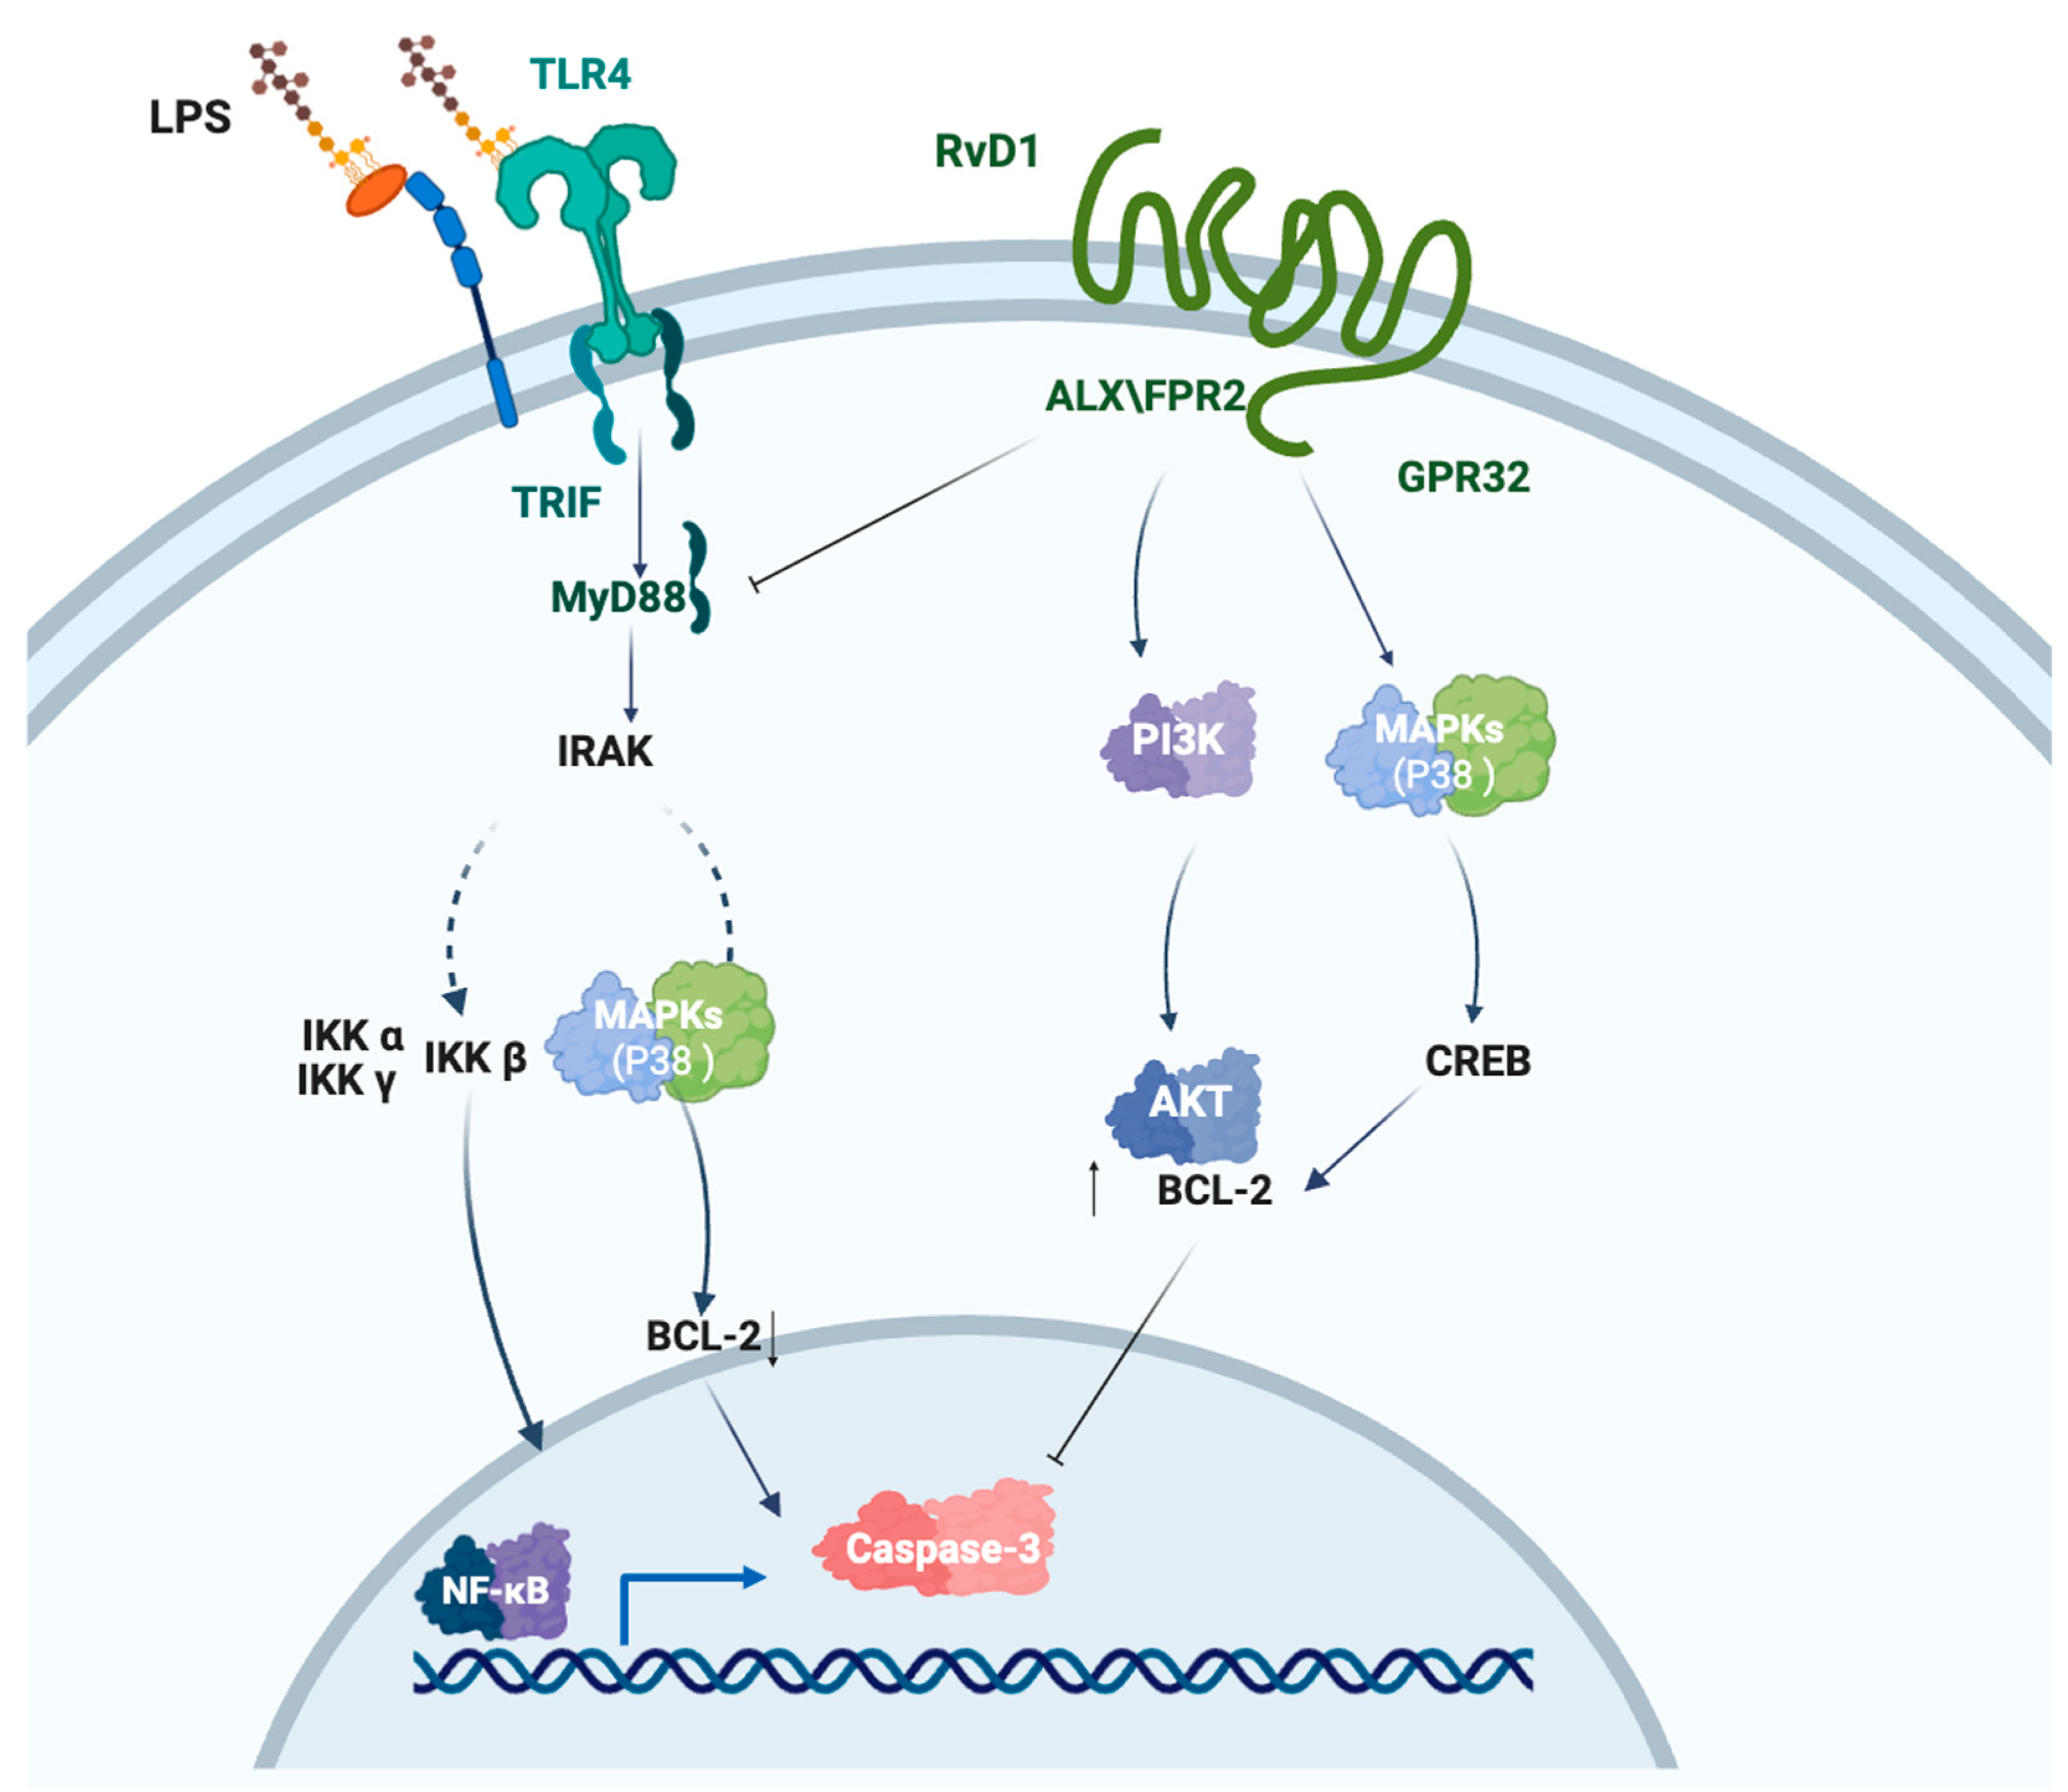
Our previous studies have primarily focused on the therapeutic potential of RvD1 in treating periodontitis, demonstrating its potential efficacy in reducing inflammation and promoting tissue regeneration [22,47,48]. In vitro, RvD1 can reduce the expression of hypoxia-induced pro-inflammatory cytokines in periodontal pockets, as well as reverse the effects of hypoxia on the inflammatory phenotype of human periodontal ligament cells (hPDLCs). Furthermore, RvD1 may promote calcium nodule formation in PDLCs by influencing the MAPK p38 signaling pathway through AKT and HIF-1α [22]. In vivo, the RvD1-loaded Gelatin methacrylate effectively alleviated periodontal inflammation and promoted periodontal tissue regeneration in a rat periodontitis model [47]. A recent study demonstrated that RvD1 suppresses the inflammatory response in hPDLCs via the ALX/FPR2 receptor and the TLR4–MyD88–NF-κB/MAPK signaling pathway [48]. This study underscores the dual role of RvD1 in reducing pro-inflammatory responses and enhancing anti-apoptotic mechanisms, primarily through the regulation of the BCL-2 gene (Figure 6). Upon LPS stimulation, THP-1 cells downregulate MyD88 protein expression levels via the TLR4 signaling pathway. Subsequently, MyD88 serves as a platform to recruit members of the interleukin-1 receptor-associated kinase (IRAK) family, initiating a kinase cascade that leads to NF-κB activation by stimulating the phosphorylation and degradation of the protein IκB. Additionally, with the upregulation of MyD88 protein levels, the activity of the LPS-induced MAPK p38 signaling pathway is enhanced. Furthermore, the downregulation of BCL-2 expression at both gene and protein levels leads to the release of apoptotic execution factors, such as Caspase-3. RvD1, through the ALX/FPR2 receptor, inhibits the LPS-activated MAPK p38 and NF-κB p65 signaling pathways and, by activating the PI3K/Akt signaling pathway, suppresses the expression of Caspase-3 and the downregulation of BCL-2, thereby exerting a negative impact on cell apoptosis. Despite these promising results, this study is limited by the absence of comprehensive high-throughput sequencing and in vivo validation, highlighting the need for further research to elucidate the mechanisms of RvD1 in acute inflammatory responses and its potential therapeutic applications.

5. Conclusions

The present study was designed to determine the ability of RvD1 to mediate resolution in human monocytic THP-1 cells in an LPS-induced inflammatory microenvironment. Our findings are consistent with previous studies reporting that RvD1 effectively reduces CASP3 expression and enhances BCL-2 expression, thereby exerting a negative impact on apoptosis. The findings of this study indicate that RvD1 exerts pro-resolving effects by regulating the anti-apoptotic gene BCL-2 and suppressing the NF-κB p65 and MAPK p38 signaling pathways, and downregulating the gene and protein expression of Caspase-3. These results indicate that RvD1 can attenuate LPS-mediated acute inflammation and demonstrates anti-apoptotic potential. Our study clearly has several limitations. Nevertheless, we believe that our study provides foundational evidence elucidating the mechanism through which RvD1 regulates acute inflammatory responses. Greater efforts are needed in conducting in-depth studies to confirm that RvD1 promotes the resolution of inflammation by regulating apoptosis-related genes.

Supplementary Materials

The following supporting information can be downloaded at: https://www.mdpi.com/article/10.3390/biomedicines14051124/s1, Figure S1: Principal component analysis. Principal component analysis was performed to visualize the gene expression profiles of three sample groups: the Control group, the LPS group, and the LPS+RvD1 group, which revealed distinct clustering patterns. The first two principal components explained approximately 69.47% and 23.81% of the total variance, respectively; Figure S2: Hierarchical clustering. Each of these mRNAs was grouped into distinct clusters based on their relative abundance. Red represents relatively highly expressed DEGs, and green represents relatively lowly expressed DEGs; Figure S3: Effects of Resolvin D1 on MAPK Signaling in LPS-Treated THP-1 Cells. (A) Differentially expressed mRNA enrichment metabolic diagram: MAPK signaling pathway (LPS group vs. Control group). Red boxes represent upregulated genes in the pathway, and blue boxes represent downregulated genes (each box represents a gene or enzyme, and the green boxes represent species-specific genes or enzymes). (B) Differentially expressed mRNA enrichment metabolic diagram: MAPK signaling pathway (LPS+RvD1 group vs. LPS group); Table S1: Sequences of the primer pairs used in this analysis.

Author Contributions

Conceptualization, X.A. and Z.X.; Data curation, Q.Z. and X.H.; Funding acquisition, Z.X.; Investigation, Y.X. (Yaxin Xue) and A.K.; Methodology, J.C., C.G.F. and K.A.F.; Resources, Y.X. (Yaxin Xue); Supervision, Y.X. (Ying Xue) and Z.X.; Validation, C.G.F. and K.A.F.; Visualization, J.C.; Writing—original draft, Q.Z., X.A., X.H. and J.C.; Writing—review and editing, A.K., Z.X. and Y.X. (Ying Xue). All authors have read and agreed to the published version of the manuscript.

Funding

This work was supported by the Natural Science Foundation of Gansu Province (grant number 26JRRA197).

Institutional Review Board Statement

Not applicable.

Informed Consent Statement

Not applicable.

Data Availability Statement

The datasets generated and analyzed in this study are available from the corresponding author. The raw RNA-sequence data supporting the conclusions of this article will be made available by the authors on request.

Acknowledgments

All authors have reviewed and approved the final manuscript. This research was supported by the School of Stomatology at Lanzhou University and UiT the Arctic University of Norway.

Conflicts of Interest

The authors declare no conflicts of interest.

Abbreviations

The following abbreviations are used in this manuscript:
RvD1Resolvin D1
LPSLipopolysaccharide
IL-1βInterleukin-1β
TNF-αTumor necrosis factor
ELISAEnzyme-linked immunosorbent assay
mRNA-seqmRNA sequencing
DEGSDifferentially expressed genes
qPCRQuantitative PCR
WBWestern blotting
IL-6Interleukin-6
ALX/FPR2Formyl peptide receptor 2
PMAPhorbol myristate acetate
PCAPrincipal component analysis
CREBcAMP response element binding protein
NRF2Nuclear Factor Erythroid 2-Related Factor 2
BCL-2B-cell lymphoma-2
MyD88Myeloid differentiation factor 88
NF-κBNuclear factor-κB
AKTProtein kinase B
PI3KPhosphoinositide 3-Kinase
CASP3Cysteine-dependent aspartate-specific protease-3
GOGene Ontology
BPBiological processes
CCCellular component
TNFAIP6TNF receptor-associated factor 6
BRAFB-Raf serine/threonine kinase

References

  1. Halade, G.V.; Kain, V.; Dillion, C.; Beasley, M.; Dudenbostel, T.; Oparil, S.; Limdi, N.A. Race-based and sex-based differences in bioactive lipid mediators after myocardial infarction. ESC Heart Fail. 2020, 7, 1700–1710. [Google Scholar] [CrossRef]
  2. Halade, G.V.; Norris, P.C.; Kain, V.; Serhan, C.N.; Ingle, K.A. Splenic leukocytes define the resolution of inflammation in heart failure. Sci. Signal. 2018, 11, eaao1818. [Google Scholar] [CrossRef] [PubMed]
  3. Newton, K.; Dixit, V.M. Signaling in innate immunity and inflammation. Cold Spring Harb. Perspect. Biol. 2012, 4, a006049. [Google Scholar] [CrossRef]
  4. Boehncke, W.; Schön, M.; Giromolomi, G.; Bos, J.; Thestrup-Pedersen, K.; Cavani, A.; Nestle, F.; Bonish, B.; Campbell, J.; Nickoloff, B. Leukocyte extravasation as a target for anti-inflammatory therapy-Which molecule to choose? Exp. Dermatol. 2005, 14, 70–80. [Google Scholar] [CrossRef]
  5. Liu, J.; Kang, R.; Tang, D. Lipopolysaccharide delivery systems in innate immunity. Trends Immunol. 2024, 45, 274–287. [Google Scholar] [CrossRef]
  6. Sano, M.; Uchida, T.; Igarashi, M.; Matsuoka, T.; Kimura, M.; Koike, J.; Fujisawa, M.; Mizukami, H.; Monma, M.; Teramura, E.; et al. Increase in the Lipopolysaccharide Activity and Accumulation of Gram-Negative Bacteria in the Stomach With Low Acidity. Clin. Transl. Gastroenterol. 2020, 11, e00190. [Google Scholar] [CrossRef] [PubMed]
  7. Chaiwut, R.; Kasinrerk, W. Very low concentration of lipopolysaccharide can induce the production of various cytokines and chemokines in human primary monocytes. BMC Res. Notes 2022, 15, 42. [Google Scholar] [CrossRef]
  8. Yu, C.; York, B.; Wang, S.; Feng, Q.; Xu, J.; O’Malley, B.W. An essential function of the SRC-3 coactivator in suppression of cytokine mRNA. Mol. Cell 2007, 25, 765–778. [Google Scholar] [CrossRef]
  9. Crofford, L.J. COX-1 and COX-2 tissue expression: Implications and predictions. J. Rheumatol. Suppl. 1997, 49, 15–19. [Google Scholar] [PubMed]
  10. Bain, C.C.; Bravo-Blas, A.; Scott, C.L.; Perdiguero, E.G.; Geissmann, F.; Henri, S.; Malissen, B.; Osborne, L.C.; Artis, D.; Mowat, A.M. Constant replenishment from circulating monocytes maintains the macrophage pool in the intestine of adult mice. Nat. Immunol. 2014, 15, 929–937. [Google Scholar] [CrossRef]
  11. Bannenberg, G.L.; Chiang, N.; Ariel, A.; Arita, M.; Tjonahen, E.; Gotlinger, K.H.; Hong, S.; Serhan, C.N. Molecular circuits of resolution: Formation and actions of resolvins and protectins. J. Immunol. 2005, 174, 4345–4355. [Google Scholar] [CrossRef] [PubMed]
  12. Chiang, N.; Fredman, G.; Bäckhed, F.; Oh, S.F.; Vickery, T.; Schmidt, B.A.; Serhan, C.N. Infection regulates pro-resolving mediators that lower antibiotic requirements. Nature 2012, 484, 524–528. [Google Scholar] [CrossRef]
  13. Abdulnour, R.; Sham, H.; Douda, D.; Colas, R.; Dalli, J.; Bai, Y.; Ai, X.; Serhan, C.; Levy, B. Aspirin-triggered resolvin D1 is produced during self-resolving gram-negative bacterial pneumonia and regulates host immune responses for the resolution of lung inflammation. Mucosal Immunol. 2016, 9, 1278–1287. [Google Scholar] [CrossRef] [PubMed]
  14. Rajasagi, N.K.; Bhela, S.; Varanasi, S.K.; Rouse, B.T. Frontline Science: Aspirin-Triggered Resolvin D1 Controls Herpes Simplex Virus-Induced Corneal Immunopathology. J. Leukoc. Biol. 2017, 102, 1159–1171. [Google Scholar] [CrossRef]
  15. Recchiuti, A.; Krishnamoorthy, S.; Fredman, G.; Chiang, N.; Serhan, C.N. MicroRNAs in Resolution of Acute Inflammation: Identification of Novel Resolvin D1-Mirna Circuits. FASEB J. 2011, 25, 544–560. [Google Scholar] [CrossRef] [PubMed]
  16. Blaudez, F.; Ivanovski, S.; Fournier, B.; Vaquette, C. The utilisation of resolvins in medicine and tissue Engineering. Acta Biomater. 2022, 140, 116–135. [Google Scholar] [CrossRef]
  17. Liu, G.J.; Tao, T.; Wang, H.; Zhou, Y.; Gao, X.; Gao, Y.Y.; Hang, C.H.; Li, W. Functions of Resolvin D1-Alx/Fpr2 Receptor Interaction in the Hemoglobin-Induced Microglial Inflammatory Response and Neuronal Injury. J. Neuroinflamm. 2020, 17, 239. [Google Scholar] [CrossRef]
  18. Suzuki, T.; Sato, Y.; Sano, K.; Arashiro, T.; Katano, H.; Nakajima, N.; Shimojima, M.; Kataoka, M.; Takahashi, K.; Wada, Y.; et al. Severe Fever with Thrombocytopenia Syndrome Virus Targets B Cells in Lethal Human Infections. J. Clin. Investig. 2020, 130, 799–812. [Google Scholar] [CrossRef]
  19. Wu, C.; Su, Z.; Lin, M.; Ou, J.; Zhao, W.; Cui, J.; Wang, R.F. NLRP11 attenuates Toll-like receptor signaling by targeting TRAF6 for degradation via the ubiquitin ligase RNF19A. Nat. Commun. 2017, 8, 1977. [Google Scholar] [CrossRef]
  20. Wang, J.G.; Williams, J.C.; Davis, B.K.; Jacobson, K.; Doerschuk, C.M.; Ting, J.P.; Mackman, N. Monocytic microparticles activate endothelial cells in an IL-1β-dependent manner. Blood 2011, 118, 2366–2374. [Google Scholar] [CrossRef]
  21. Croasdell, A.; Sime, P.J.; Phipps, R.P. Resolvin D2 Decreases Tlr4 Expression to Mediate Resolution in Human Monocytes. FASEB J. 2016, 30, 3181–3193. [Google Scholar] [CrossRef]
  22. Cai, J.; Liu, J.; Yan, J.; Lu, X.; Wang, X.; Li, S.; Mustafa, K.; Wang, H.; Xue, Y.; Mustafa, M.; et al. Impact of Resolvin D1 on the inflammatory phenotype of periodontal ligament cell response to hypoxia. J. Periodontal Res. 2022, 57, 1034–1042. [Google Scholar] [CrossRef]
  23. Mustafa, M.; Zarrough, A.; Bolstad, A.I.; Lygre, H.; Mustafa, K.; Hasturk, H.; Serhan, C.; Kantarci, A.; Van Dyke, T.E. Resolvin D1 protects periodontal ligament. Am. J. Physiol.-Cell Physiol. 2013, 305, C673–C679. [Google Scholar] [CrossRef]
  24. Vasconcelos, D.P.; Costa, M.; Amaral, I.F.; Barbosa, M.A.; Águas, A.P.; Barbosa, J.N. Development of an immunomodulatory biomaterial: Using resolvin D1 to modulate inflammation. Biomaterials 2015, 53, 566–573. [Google Scholar] [CrossRef] [PubMed]
  25. Mortazavi, A.; Williams, B.A.; McCue, K.; Schaeffer, L.; Wold, B. Mapping and quantifying mammalian transcriptomes by RNA-Seq. Nat. Methods 2008, 5, 621–628. [Google Scholar] [CrossRef] [PubMed]
  26. Chan, M.M.; Moore, A.R. Resolution of inflammation in murine autoimmune arthritis is disrupted by cyclooxygenase-2 inhibition and restored by prostaglandin E2-mediated lipoxin A4 production. J. Immunol. 2010, 184, 6418–6426. [Google Scholar] [CrossRef]
  27. Buckley, C.D.; Gilroy, D.W.; Serhan, C.N. Proresolving Lipid Mediators and Mechanisms in the Resolution of Acute Inflammation. Immunity 2014, 40, 315–327. [Google Scholar] [CrossRef] [PubMed]
  28. Legler, D.F.; Bruckner, M.; Uetz-von Allmen, E.; Krause, P. Prostaglandin E2 at New Glance: Novel Insights in Functional Diversity Offer Therapeutic Chances. Int. J. Biochem. Cell Biol. 2010, 42, 198–201. [Google Scholar] [CrossRef]
  29. Serhan, C.N.; Chiang, N.; Van Dyke, T.E. Resolving Inflammation: Dual Anti-Inflammatory and Pro-Resolution Lipid Mediators. Nat. Rev. Immunol. 2008, 8, 349–361. [Google Scholar] [CrossRef]
  30. Recchiuti, A. Resolvin D1 and Its Gpcrs in Resolution Circuits of Inflammation. Prostaglandins Other Lipid Mediat. 2013, 107, 64–76. [Google Scholar] [CrossRef]
  31. Mısırlıoglu, N.F.; Ergun, S.; Kucuk, S.H.; Himmetoglu, S.; Ozen, G.D.; Sayili, U.; Uzun, N.; Uzun, H. The Importance of Resolvin D1, LXA4, and LTB4 in Patients with Acute Pancreatitis Due to Gallstones. Medicina 2025, 61, 239. [Google Scholar] [CrossRef] [PubMed]
  32. Rey, C.; Nadjar, A.; Buaud, B.; Vaysse, C.; Aubert, A.; Pallet, V.; Layé, S.; Joffre, C. Resolvin D1 and E1 promote resolution of inflammation in microglial cells in vitro. Brain Behav. Immun. 2016, 55, 249–259. [Google Scholar] [CrossRef]
  33. Wang, Y.; Tang, L. Multiplexed gold nanorod array biochip for multi-sample analysis. Biosens. Bioelectron. 2015, 67, 18–24. [Google Scholar] [CrossRef][Green Version]
  34. Birzele, F.; Schaub, J.; Rust, W.; Clemens, C.; Baum, P.; Kaufmann, H.; Weith, A.; Schulz, T.W.; Hildebrandt, T. Into the unknown: Expression profiling without genome sequence information in CHO by next generation sequencing. Nucleic Acids Res. 2010, 38, 3999–4010. [Google Scholar] [CrossRef]
  35. Hikita, H.; Takehara, T.; Shimizu, S.; Kodama, T.; Li, W.; Miyagi, T.; Hosui, A.; Ishida, H.; Ohkawa, K.; Kanto, T.; et al. Mcl-1 and Bcl-xL cooperatively maintain integrity of hepatocytes in developing and adult murine liver. Hepatology 2009, 50, 1217–1226. [Google Scholar] [CrossRef]
  36. Rahman, M.A.; Amin, A.R.; Wang, D.; Koenig, L.; Nannapaneni, S.; Chen, Z.; Wang, Z.; Sica, G.; Deng, X.; Chen, Z.; et al. RRM2 regulates Bcl-2 in head and neck and lung cancers: A potential target for cancer therapy. Clin. Cancer Res. 2023, 19, 3416–3428. [Google Scholar] [CrossRef]
  37. Manickam, D.S.; Hirata, A.; Putt, D.A.; Lash, L.H.; Hirata, F.; Oupický, D. Overexpression of Bcl-2 as a proxy redox stimulus to enhance activity of non-viral redox-responsive delivery vectors. Biomaterials 2008, 29, 2680–2688. [Google Scholar] [CrossRef] [PubMed]
  38. Papagiannakopoulos, T.; Shapiro, A.; Kosik, K.S. MicroRNA-21 targets a network of key tumor-suppressive pathways in glioblastoma cells. Cancer Res. 2008, 68, 8164–8172. [Google Scholar] [CrossRef]
  39. Benabdoune, H.; Rondon, E.-P.; Shi, Q.; Fernandes, J.; Ranger, P.; Fahmi, H.; Benderdour, M. The role of resolvin D1 in the regulation of inflammatory and catabolic mediators in osteoarthritis. Inflamm. Res. 2016, 65, 635–645. [Google Scholar] [CrossRef] [PubMed]
  40. Nelson, J.W.; Leigh, N.J.; Mellas, R.E.; McCall, A.D.; Aguirre, A.; Baker, O.J. ALX/FPR2 receptor for RvD1 is expressed and functional in salivary glands. Am. J. Physiol.-Cell Physiol. 2014, 306, C178–C185. [Google Scholar] [CrossRef] [PubMed]
  41. Maira, S.M.; Finan, P.; Garcia-Echeverria, C. From the bench to the bed side: PI3K pathway inhibitors in clinical development. In Phosphoinositide 3-Kinase in Health and Disease; Springer: Berlin/Heidelberg, Germany, 2010; pp. 209–239. [Google Scholar] [CrossRef]
  42. Gocher, A.M.; Azabdaftari, G.; Euscher, L.M.; Dai, S.; Karacosta, L.G.; Franke, T.F.; Edelman, A.M. Akt activation by Ca2+/calmodulin-dependent protein kinase 2 (CaMKK2) in ovarian cancer cells. J. Biol. Chem. 2017, 292, 14188–14204. [Google Scholar] [CrossRef]
  43. Xiang, S.-Y.; Ye, Y.; Yang, Q.; Xu, H.R.; Shen, C.-X.; Ma, M.-Q.; Jin, S.-W.; Mei, H.-X.; Zheng, S.-X.; Smith, F.-G.; et al. RvD1 accelerates the resolution of inflammation by promoting apoptosis of the recruited macrophages via the ALX/FasL-FasR/caspase-3 signaling pathway. Cell Death Discov. 2021, 7, 339. [Google Scholar] [CrossRef] [PubMed]
  44. Xu, J.; Duan, X.; Hu, F.; Poorun, D.; Liu, X.; Wang, X.; Zhang, S.; Gan, L.; He, M.; Zhu, K.; et al. Resolvin D1 attenuates imiquimod-induced mice psoriasiform dermatitis through MAPKs and NF-κB pathways. J. Dermatol. Sci. 2018, 89, 127–135. [Google Scholar] [CrossRef] [PubMed]
  45. Li, J.; Deng, X.; Bai, T.; Wang, S.; Jiang, Q.; Xu, K. Resolvin D1 mitigates non-alcoholic steatohepatitis by suppressing the TLR4- MyD88-mediated NF-κB and MAPK pathways and activating the Nrf2 pathway in mice. Int. Immunopharmacol. 2020, 88, 106961. [Google Scholar] [CrossRef]
  46. Kain, V.; Halade, G.V. Immune responsive resolvin D1 programs peritoneal macrophages and cardiac fibroblast phenotypes in diversified metabolic microenvironment. J. Cell. Physiol. 2019, 234, 3910–3920. [Google Scholar] [CrossRef]
  47. Yan, J.; Cai, J.; Pan, X.; Li, S.; Fenton, C.G.; Fenton, K.A.; Kantarci, A.; Xue, Y.; Xue, Y.; Xing, Z. Resolvin D1 Modulates the Inflammatory Processes of Human Periodontal Ligament Cells via NF-κB and MAPK Signaling Pathways. Biomedicines 2025, 13, 3038. [Google Scholar] [CrossRef] [PubMed]
  48. Xing, Z.; Liu, J.; Cai, J.; Jiang, X.; Liang, J.; Fujio, M.; Hadler-Olsen, E.; Wang, J.; Kantarci, A.; Xue, Y. The Application of Resolvin D1-Loaded Gelatin Methacrylate in a Rat Periodontitis Model. Pharmaceutics 2024, 17, 16. [Google Scholar] [CrossRef]
Figure 1. RvD1 modulates pro-inflammatory, anti-inflammatory, and apoptotic cytokine levels. (A) ELISA quantification of TNF-α and IL-1β levels in culture supernatants. (B) qPCR analysis of IL-6, IL-10, CREB, NRF2, BCL-2, and CASP3 mRNA expression. (** p < 0.01; * p < 0.05; ns, not significant).
Biomedicines 14 01124 g001
Figure 2. DEGs across different groups. (A) The number of DEGs in each group. (B) Distribution of DEGs in different groups. Downregulated (n = 174) and upregulated (n = 373) genes in the LPS vs. Control groups. Downregulated (n = 119) and upregulated (n = 139) genes in the L+R vs. Control groups. Downregulated (n = 292) and upregulated (n = 116) genes in the L+R vs. LPS groups.
Biomedicines 14 01124 g002
Figure 3. GO enrichment bar chart: LPS group vs. Control group and the LPS+RvD1 group vs. the LPS group. (A) Differential gene GO enrichment bar chart: LPS group vs. Control group. It reflects the distribution of the number of target genes in the enriched GO function. (B) Differential gene GO enrichment bar chart: LPS+RvD1 group vs. LPS group.
Biomedicines 14 01124 g003
Figure 4. KEGG enrichment scatterplot: LPS group vs. Control group and the LPS+RvD1 group vs. the LPS group. (A) Differential gene KEGG enrichment scatterplot: LPS group vs. Control group. (B) Differential gene KEGG enrichment scatterplot: LPS+RvD1 group vs. LPS group.
Biomedicines 14 01124 g004
Figure 5. Effects of resolvin D1 on MAPK signaling in LPS-treated THP-1 cells. RvD1 decreased the protein expression of PI3K, CASP3, MyD88, NF-κB p65 and MAPK p38 and increased the protein expression of the anti-apoptotic factors BCL-2 and AKT. THP-1 cells were treated with RvD1 (100 ng/mL) and LPS (100 ng/mL) for 24 h (** p < 0.01; * p < 0.05).
Biomedicines 14 01124 g005
Figure 6. LPS activates the NF-κB and MAPK p38 signaling pathways by binding to TLR4 (created in BioRender). This subsequently activates executioner caspases such as Caspase-3. RvD1, through the ALX/FPR2 receptor, inhibited the MyD88 and PI3K–AKT signaling pathways, promoting the expression of the anti-apoptotic factor BCL-2 and suppressing the expression of Caspase-3. RvD1 also promoted phosphorylation of CREB and upregulated BCL-2 expression through the MAPK p38 signaling pathway (https://BioRender.com/ypqu2di, accessed on 5 March 2026).
Biomedicines 14 01124 g006
Table 1. The same DEGs were upregulated in the LPS group versus the Control group but downregulated in the LPS+RvD1 group versus the LPS group.
Top20LPS Group vs. Control GroupTop20LPS+RvD1 Group vs. LPS Group
Gene IDp Valuelog2FoldchangeTypeGene IDp Valuelog2FoldchangeType
DNER0.000068.02551UpTNFRSF180.00041−7.48294Down
IL60.000027.89834UpTBC1D3H0.01602−7.31492Down
EDIL30.000077.66507UpSERPINB70.00207−7.09451Down
TNFRSF180.000217.48558UpIL5RA0.03219−6.94365Down
NEURL30.000527.21900UpCLEC4E0.00308−6.90421Down
SERPINB70.001167.09701UpMAGI10.00797−6.82794Down
EDAR0.015577.07157UpC6orf580.04468−6.74004Down
PLA1A0.001147.03884UpELOA30.00667−6.66787Down
IL5RA0.020596.94563UpFAM83E0.01826−6.47336Down
CLEC4E0.001746.90748UpIDO20.02499−6.21221Down
MAGI10.004966.83227UpIL330.02516−6.17772Down
C6orf580.029686.74201UpTLR30.03483−6.10828Down
ELOA30.004016.67118UpPHEX0.03283−6.07108Down
FAM83E0.012196.47551UpTSPAN70.03788−6.00977Down
IDO20.016956.21482UpXIRP10.04106−5.95996Down
IL330.016986.18084UpDNER0.00648−4.61095Down
TLR30.024516.11061UpGJB20.00401−4.29684Down
PHEX0.022806.07392UpCCL40.00019−4.26361Down
TSPAN70.026716.01252UpNEURL30.02025−4.15949Down
XIRP10.029125.96346UpCOL8A10.01063−3.72313Down
TUBB4A0.00058−7.17259DownTUBB4A0.000207.54860Up
C21orf620.00064−7.07809DownHSFX10.013467.36241Up
MIA0.00322−6.91020DownLEFTY10.000697.25846Up
LEFTY10.00165−6.85777DownPRKCG0.002977.16513Up
SPDYE170.02651−6.75120DownNOS20.001327.09154Up
NOS20.02871−6.66795DownSPDYE170.023087.05991Up
HSFX10.01556−6.57859DownC21orf620.001986.93909Up
TNNI3K0.03981−6.47545DownANKRD70.003076.81678Up
BTBD110.00822−6.35831DownMIA0.003466.79737Up
ANKRD70.00898−6.35807DownBTBD110.009416.49123Up
GRM20.01062−6.35806DownANTXRL0.013596.35301Up
WIPF30.00843−6.34591DownFOXI10.013206.34264Up
ANTXRL0.02645−5.91007DownCCR30.014196.32958Up
SCN11A0.03113−5.84061DownWIPF30.018936.20955Up
CCR30.03135−5.84014DownSCN11A0.031546.01053Up
PRKCG0.03938−5.80499DownSNCAIP0.018414.01271Up
FOXI10.03975−5.74797DownCREB3L30.025173.67301Up
CREB3L30.03453−3.48527DownLDLRAD20.004463.22943Up
SNCAIP0.04818−3.44535DownPLAAT40.007462.25558Up
LDLRAD20.00170−2.96918DownMYH150.038492.24643Up
DESeq2 software (v1.10.1) was used to analyze differentially expressed genes between the experimental and control groups. The type represents the screening result: p ≤ 0.05 and |log2(fold change)| ≥ 1 are DEGs; log2(fold change) ≥ 1 is marked as an upregulated gene (Up), and log2(fold change) ≤ −1 is marked as a downregulated gene (Down); those that do not meet the above conditions are not DEGs.
Table 2. The DEGs whose expression was upregulated in the LPS group versus the Control group and whose expression was blocked by RvD1 treatment in the LPS+RvD1 group versus the Control group.
Top20DEGs Were Blocked by RvD1
Gene IDlog2FoldChangep ValueType
TNFRSF47.764940.00012Up
TNFRSF187.485580.00021Up
MBNL27.403240.00023Up
TBC1D3H7.319390.00941Up
NEURL37.219000.00052Up
CHGB7.119930.00159Up
SERPINB77.097010.00116Up
EDAR7.071570.01557Up
PLA1A7.038840.00114Up
IL5RA6.945630.02059Up
CASP56.922710.00252Up
CLEC4E6.907480.00174Up
MAGI16.832270.00496Up
SGCE6.810890.00265Up
SLC7A96.805320.00280Up
RSPO36.768800.00370Up
C6orf586.742010.02968Up
ELOA36.671180.00401Up
UCHL16.661990.00443Up
MISP36.658910.00427Up
DESeq2 software was used to analyze DEGs between the experimental and control groups. The type represents the screening result: p ≤ 0.05 and |log2(fold change)| ≥ 1 are DEGs; log2(fold change) ≥ 1 is marked as an upregulated gene (top 20), and those that meet the above conditions are DEGs.
Table 3. The DEGs are related to inflammation pathways.
Gene IDMean. In. Control GroupMean. In. LPS GroupMean. In. LPS+RVD1 Groupp ValueType
BCL2L123779.537733343.418353566.698540.00498DEG
CREB18258.9870010,523.924279258.532270.04415DEG
IL1B146.311682788.90937240.563990.00078DEG
TNFAIP610.42838433.6814343.093170.00449DEG
NFKB22357.484806125.461093900.830180.04063DEG
CASP32834.821223345.002473181.675210.03366DEG
Mean. In. represents the average expression level of DEGs in this group.
Disclaimer/Publisher’s Note: The statements, opinions and data contained in all publications are solely those of the individual author(s) and contributor(s) and not of MDPI and/or the editor(s). MDPI and/or the editor(s) disclaim responsibility for any injury to people or property resulting from any ideas, methods, instructions or products referred to in the content.