

Analysis of Tacrolimus Clearance in Patients with Kidney Transplants from Romania

 ,
,
Abstract
1. Introduction
1.1. General Background on Tacrolimus and Pharmacogenetics
1.2. Knowledge Gap in Romanian Kidney Transplant Recipients
2. Materials and Methods
2.1. Study Design and Patient Selection
2.2. Genotyping and Drug Analysis
2.3. Pharmacokinetic Modeling
2.3.1. Covariate Testing
2.3.2. Model Evaluation
2.4. Statistical Analysis
3. Results
3.1. Study Population
3.2. Association of SNP Genotypes with C0, Dose, and C0/Dose Ratio of Tacrolimus
3.3. Tacrolimus Clearance
4. Discussion
4.1. Key Findings
4.2. Comparison with Literature
4.3. Clinical Implications
4.4. Limitations
5. Conclusions
Author Contributions
Funding
Institutional Review Board Statement
Informed Consent Statement
Data Availability Statement
Conflicts of Interest
References
- Hesselink, D.A.; Bouamar, R.; Elens, L.; van Schaik, R.H.N.; van Gelder, T. The Role of Pharmacogenetics in the Disposition of and Response to Tacrolimus in Solid Organ Transplantation. Clin. Pharmacokinet. 2014, 53, 123–139. [Google Scholar] [CrossRef]
- Brunet, M.; van Gelder, T.; Åsberg, A.; Haufroid, V.; Hesselink, D.A.; Langman, L.; Lemaitre, F.; Marquet, P.; Seger, C.; Shipkova, M.; et al. Therapeutic Drug Monitoring of Tacrolimus-Personalized Therapy: Second Consensus Report. Ther. Drug Monit. 2019, 41, 261–307. [Google Scholar] [CrossRef] [PubMed]
- Mendoza Rojas, A.; Hesselink, D.A.; van Besouw, N.M.; Baan, C.C.; van Gelder, T. Impact of Low Tacrolimus Exposure and High Tacrolimus Intra-Patient Variability on the Development of de Novo Anti-HLA Donor-Specific Antibodies in Kidney Transplant Recipients. Expert Rev. Clin. Immunol. 2019, 15, 1323–1331. [Google Scholar] [CrossRef]
- Antignac, M.; Barrou, B.; Farinotti, R.; Lechat, P.; Urien, S. Population Pharmacokinetics and Bioavailability of Tacrolimus in Kidney Transplant Patients. Br. J. Clin. Pharmacol. 2007, 64, 750–757. [Google Scholar] [CrossRef] [PubMed]
- Tang, J.T.; Andrews, L.M.; van Gelder, T.; Shi, Y.Y.; van Schaik, R.H.N.; Wang, L.L.; Hesselink, D.A. Pharmacogenetic Aspects of the Use of Tacrolimus in Renal Transplantation: Recent Developments and Ethnic Considerations. Expert Opin. Drug Metab. Toxicol. 2016, 12, 555–565. [Google Scholar] [CrossRef]
- Yu, M.; Liu, M.; Zhang, W.; Ming, Y. Pharmacokinetics, Pharmacodynamics and Pharmacogenetics of Tacrolimus in Kidney Transplantation. Curr. Drug Metab. 2018, 19, 513–522. [Google Scholar] [CrossRef] [PubMed]
- Lloberas, N.; Vidal-Alabró, A.; Colom, H. Customizing Tacrolimus Dosing in Kidney Transplantation: Focus on Pharmacogenetics. Ther. Drug Monit. 2025, 47, 141–151. [Google Scholar] [CrossRef]
- Shi, W.-L.; Tang, H.-L.; Zhai, S.-D. Effects of the CYP3A4*1B Genetic Polymorphism on the Pharmacokinetics of Tacrolimus in Adult Renal Transplant Recipients: A Meta-Analysis. PLoS ONE 2015, 10, e0127995. [Google Scholar] [CrossRef]
- Tron, C.; Lemaitre, F.; Verstuyft, C.; Petitcollin, A.; Verdier, M.-C.; Bellissant, E. Pharmacogenetics of Membrane Transporters of Tacrolimus in Solid Organ Transplantation. Clin. Pharmacokinet. 2019, 58, 593–613. [Google Scholar] [CrossRef]
- Hippman, C.; Nislow, C. Pharmacogenomic Testing: Clinical Evidence and Implementation Challenges. J. Pers. Med. 2019, 9, 40. [Google Scholar] [CrossRef]
- Caudle, K.E.; Klein, T.E.; Hoffman, J.M.; Müller, D.J.; Whirl-Carrillo, M.; Gong, L.; McDonagh, E.M.; Sangkuhl, K.; Thorn, C.F.; Schwab, M.; et al. Incorporation of Pharmacogenomics into Routine Clinical Practice: The Clinical Pharmacogenetics Implementation Consortium (CPIC) Guideline Development Process. Curr. Drug Metab. 2014, 15, 209–217. [Google Scholar] [CrossRef] [PubMed]
- Qahwaji, R.; Ashankyty, I.; Sannan, N.S.; Hazzazi, M.S.; Basabrain, A.A.; Mobashir, M. Pharmacogenomics: A Genetic Approach to Drug Development and Therapy. Pharmaceuticals 2024, 17, 940. [Google Scholar] [CrossRef] [PubMed]
- Hartshorne, T. TaqMan® Drug Metabolism Genotyping Assays for the Detection of Human Polymorphisms Involved in Drug Metabolism. Methods Mol. Biol. 2013, 1015, 87–96. [Google Scholar] [CrossRef] [PubMed]
- Passey, C.; Birnbaum, A.K.; Brundage, R.C.; Oetting, W.S.; Israni, A.K.; Jacobson, P.A. Dosing Equation for Tacrolimus Using Genetic Variants and Clinical Factors. Br. J. Clin. Pharmacol. 2011, 72, 948–957. [Google Scholar] [CrossRef]
- Andreu, F.; Colom, H.; Elens, L.; van Gelder, T.; van Schaik, R.H.N.; Hesselink, D.A.; Bestard, O.; Torras, J.; Cruzado, J.M.; Grinyó, J.M.; et al. A New CYP3A5*3 and CYP3A4*22 Cluster Influencing Tacrolimus Target Concentrations: A Population Approach. Clin. Pharmacokinet. 2017, 56, 963–975. [Google Scholar] [CrossRef]
- Han, N.; Yun, H.; Hong, J.; Kim, I.-W.; Ji, E.; Hong, S.H.; Kim, Y.S.; Ha, J.; Shin, W.G.; Oh, J.M. Prediction of the Tacrolimus Population Pharmacokinetic Parameters According to CYP3A5 Genotype and Clinical Factors Using NONMEM in Adult Kidney Transplant Recipients. Eur. J. Clin. Pharmacol. 2013, 69, 53–63. [Google Scholar] [CrossRef]
- Alqahtani, S.; Alenazi, M.; Alsultan, A.; Alsarhani, E. Estimation of Tacrolimus Clearance in Saudi Adult Kidney Transplant Recipients. Saudi J. Kidney Dis. Transplant. 2021, 32, 101–110. [Google Scholar] [CrossRef]
- Ling, J.; Dong, L.-L.; Yang, X.-P.; Qian, Q.; Jiang, Y.; Zou, S.-L.; Hu, N. Effects of CYP3A5, ABCB1 and POR*28 Polymorphisms on Pharmacokinetics of Tacrolimus in the Early Period after Renal Transplantation. Xenobiotica 2020, 50, 1501–1509. [Google Scholar] [CrossRef]
- Andrews, L.M.; Hesselink, D.A.; van Schaik, R.H.N.; van Gelder, T.; de Fijter, J.W.; Lloberas, N.; Elens, L.; Moes, D.J.a.R.; de Winter, B.C.M. A Population Pharmacokinetic Model to Predict the Individual Starting Dose of Tacrolimus in Adult Renal Transplant Recipients. Br. J. Clin. Pharmacol. 2019, 85, 601–615. [Google Scholar] [CrossRef]
- Francke, M.I.; Andrews, L.M.; Le, H.L.; van de Wetering, J.; Clahsen-van Groningen, M.C.; van Gelder, T.; van Schaik, R.H.N.; van der Holt, B.; de Winter, B.C.M.; Hesselink, D.A. Avoiding Tacrolimus Underexposure and Overexposure with a Dosing Algorithm for Renal Transplant Recipients: A Single Arm Prospective Intervention Trial. Clin. Pharmacol. Ther. 2021, 110, 169–178. [Google Scholar] [CrossRef]
- Concha, J.; Sangüesa, E.; Ribate, M.P.; García, C.B. CYP3A4*1B but Not CYP3A5*3 as Determinant of Long-Term Tacrolimus Dose Requirements in Spanish Solid Organ Transplant Patients. Int. J. Mol. Sci. 2024, 25, 11327. [Google Scholar] [CrossRef] [PubMed]
- Zhang, X.; Liu, Z.; Zheng, J.; Chen, Z.; Tang, Z.; Chen, J.; Li, L. Influence of CYP3A5 and MDR1 Polymorphisms on Tacrolimus Concentration in the Early Stage after Renal Transplantation. Clin. Transplant. 2005, 19, 638–643. [Google Scholar] [CrossRef] [PubMed]
- Lamba, J.; Hebert, J.M.; Schuetz, E.G.; Klein, T.E.; Altman, R.B. PharmGKB Summary: Very Important Pharmacogene Information for CYP3A5. Pharmacogenet. Genom. 2012, 22, 555–558. [Google Scholar] [CrossRef]
- Maslub, M.G.; Daud, N.A.A.; Radwan, M.A.; Sha’aban, A.; Ibrahim, A.G. CYP3A4*1B and CYP3A5*3 SNPs Significantly Impact the Response of Egyptian Candidates to High-Intensity Statin Therapy to Atorvastatin. Eur. J. Med Res. 2024, 29, 539. [Google Scholar] [CrossRef] [PubMed]

| Patient Parameters | Mean ± Standard Deviation |
|---|---|
| Age | |
| 18–39 years | 29.94 ± 6.41 |
| 40–66 years | 48.04 ± 5.98 |
| Sex (male/female) | 67/39 |
| Weight (kg) | 68.05 ± 14.65 |
| Hematocrit (%) | 35.38 ± 7.32 |
| Albumin (g/dL) | 44.4 ± 0.54 |
| eGFR (mL/min/1.73 m2) | 45.18 ± 18.78 |
| ALT (U/L) | 31.63 ± 25.43 |
| AST (U/L) | 23.21 ± 10.26 |
| Tacrolimus C0 (ng/mL) | 10.08 ± 4.36 |
| Tacrolimus Dose (mg/kg per day) | 0.127 ± 0.889 |
| Tacrolimus C0/Dose (ng/mL/mg/kg per day) | 115.88 ± 97.52 |
| Genotype (n = 106) | wt/wt | wt/m | m/m |
|---|---|---|---|
| CYP3A4*1.001 | 91 (85.8%) | 15 (14.2%) | 0 (0%) |
| CYP3A5*3 | 7 (6.6%) | 18 (17%) | 81 (76.4%) |
| CYP3A4*22 | 24 (22.6%) | 82 (77.4%) | 0 (0%) |
| ABCB1 3435C>T | 23 (21.7%) | 53 (50%) | 30 (28.3%) |
| ABCB1 1236C>T | 22 (20.8%) | 47 (44.3%) | 37 (34.9%) |
| ABCB1 2677G>T/A | 35 (33%) | 40 (37.7%) (G/A) 2 (1.9%) (G/T) | 27 (25.5%) (A/A) 2 (1.9%) (T/A) 0 (0%) (T/T) |
| Genes | SNP/Allele | N | Tacrolimus Concentration (C0) | p-Value | Dose | p-Value | C0/Dose Ratio | p-Value |
|---|---|---|---|---|---|---|---|---|
| CYP3A4*1.001 | *1/*1 | 91 | 10.17 ± 4.42 | 0.041 * | 0.124 ± 0.088 | 0.075 | 120.5 ± 101.6 | 0.047 |
| *1/*1.001 | 15 | 9.46 ± 3.86 | 0.150 ± 0.906 | 86.58 ± 57.93 | ||||
| *1.001/*1.001 | 0 | |||||||
| CYP3A5*3 | *1/*1 | 7 | 9.67 ± 3.58 | 0.002 * | 0.131 ± 0.076 | 0.016 * | 91.14 ± 44.10 | 0.012 * |
| *1/*3 | 18 | 9.31 ± 3.97 | 0.162 ± 0.093 | 79.91 ± 58.61 | ||||
| *3/*3 | 81 | 10.28 ± 4.48 | 0.120 ± 0.087 | 125.7 ± 105.1 | ||||
| CYP3A4*22 | *1/*1 (n = 24) | 24 | 9.72 ± 4.16 | 0.084 | 0.124 ± 0.085 | 0.565 | 116.45 ± 94.30 | 0.728 |
| *1/*22 (n = 82) | 82 | 10.19 ± 4.41 | 0.129 ± 0.089 | 115.70 ± 98.55 | ||||
| *22/*22 (n = 0) | 0 | |||||||
| ABCB1 3435C>T | CC (n = 23) | 23 | 10.06 ± 4.35 | 0.766 | 0.121 ± 0.081 | 0.569 | 122.02 ± 82.48 | 0.419 |
| CT (n = 53) | 53 | 10.11 ± 4.35 | 0.127 ± 0.079 | 111.42 ± 101.08 | ||||
| TT (n = 30) | 30 | 10.02 ± 4.38 | 0.135 ± 0.105 | 118.27 ± 101.89 | ||||
| ABCB1 1236C>T | CC (n = 22) | 22 | 10.24 ± 4.49 | 0.788 | 0.111 ± 0.071 | 0.410 | 126.68 ± 80.93 | 0.318 |
| CT (n = 47) | 47 | 9.94 ± 4.15 | 0.124 ± 0.079 | 116.92 ± 109.18 | ||||
| TT (n = 37) | 37 | 10.14 ± 4.51 | 0.142 ± 0.105 | 108.38 ± 90.75 | ||||
| ABCB1 2677G>T/A | GG (n = 35) | 35 | 10.11 ± 4.56 | 0.710 | 0.132 ± 0.098 | 0.973 | 112.65 ± 92.25 | 0.971 |
| GA (n = 40) | 40 | 10.05 ± 4.22 | 0.123 ± 0.080 | 123.55 ± 115.53 | ||||
| AA (n = 27) | 27 | 10.03 ± 4.32 | 0.120 ± 0.077 | 111.34 ± 77.34 |
| Genes | SNP/Allele | N | Tacrolimus Concentration (C0) | p-Value |
|---|---|---|---|---|
| CYP3A4*1.001 | *1/*1 | 91 | 10.17 ± 4.42 | 0.041 * |
| *1/*1.001 *1.001/*1.001 | 15 | 9.46 ± 3.86 | ||
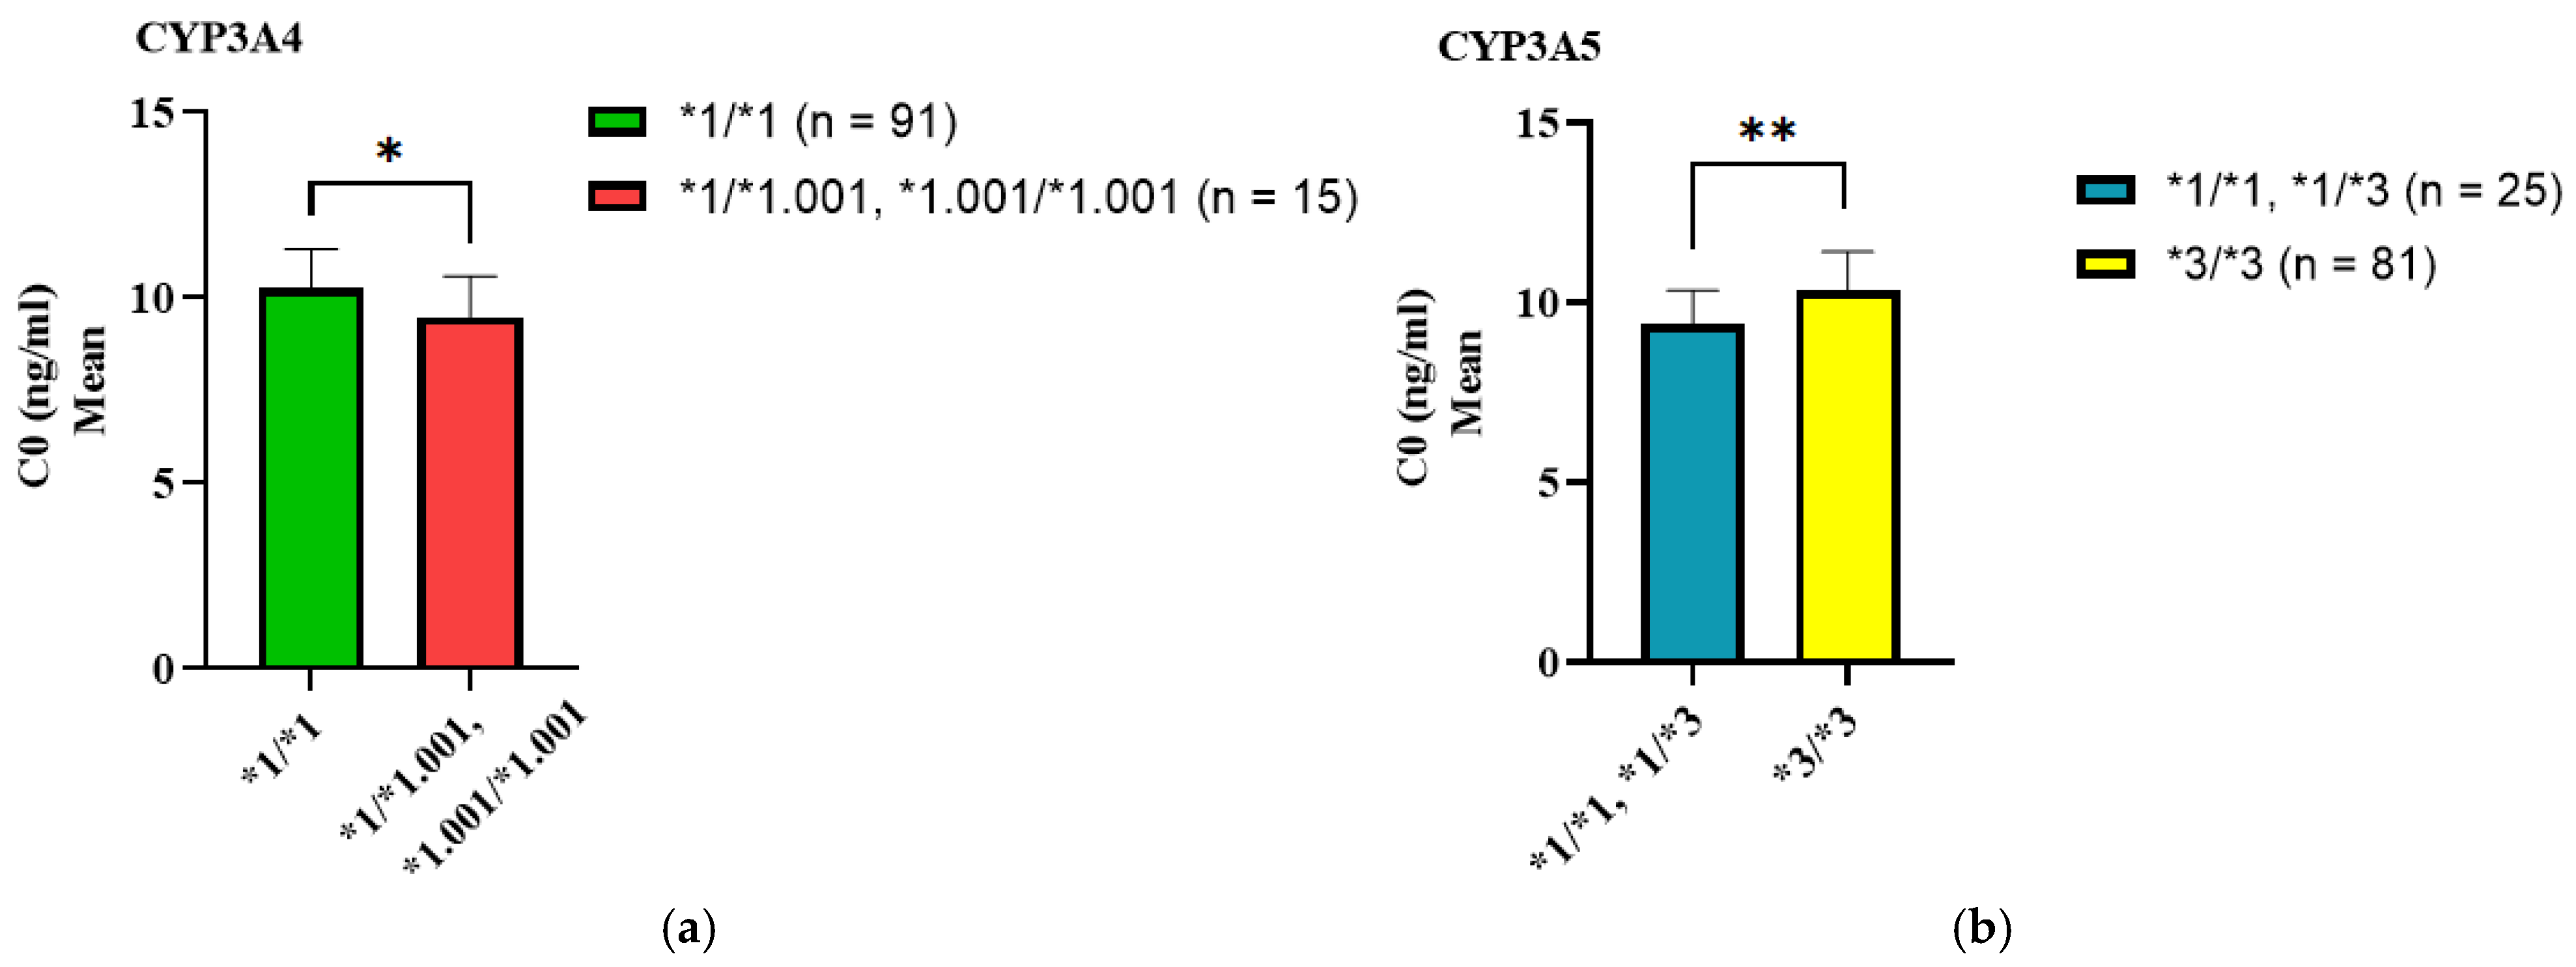
| CYP3A5*3 | *1/*1 *1/*3 | 25 | 9.49 ± 3.77 | 0.0004 * |
| *3/*3 | 81 | 10.28 ± 4.48 |
| Variable | Partial r2 | p-Value |
|---|---|---|
| CYP3A4*1.001 | 0.301 | <0.001 |
| CYP3A5*3 | 0.297 | <0.001 |
| Age | 0.304 | 0.004 |
| Hematocrit | 0.285 | <0.001 |
| Parameter | Base Model | Final Model | ||||
|---|---|---|---|---|---|---|
| Estimate | Standard Error (SE) | Relative Standard Error (RSE%) | Estimate | Standard Error (SE) | Relative Standard Error (RSE%) | |
| Fixed Effects | ||||||
| Tlag (h) | 0.547 | 0.0638 | 11.7 | 0.541 | 0.0512 | 9.46 |
| ka (h−1) | 3.79 | 0.974 | 25.7 | 4.03 | 0.684 | 17 |
| Cl (L/h) | 0.564 | 0.0341 | 6.04 | 0.759 | 0.0559 | 7.36 |
| beta_Cl_CYP3A4*1/*1.001 | - | - | - | −0.259 | 0.0307 | 11.8 |
| V1 (L) | 0.341 | 0.11 | 32.2 | 0.396 | 0.0452 | 11.4 |
| Q (L/h) | 0.72 | 0.0705 | 9.79 | 2.26 | 0.227 | 10 |
| beta_Q_Hematocrit | - | - | - | −0.0382 | 0.00235 | 6.14 |
| V2 (L) | 43.2 | 7.54 | 17.4 | 39.1 | 5.4 | 13.8 |
| Parameter | Base Model | Final Model | ||||
|---|---|---|---|---|---|---|
| Estimate | Standard Error (SE) | Relative Standard Error (RSE%) | Estimate | Standard Error (SE) | Relative Standard Error (RSE%) | |
| Standard Deviation of the Random Effects | ||||||
| omega_Tlag | 0.13 | 0.109 | 84 | 0.239 | 0.0497 | 20.8 |
| omega_ka | 0.256 | 0.121 | 47.4 | 0.557 | 0.375 | 67.4 |
| omega_Cl | 0.395 | 0.0461 | 11.7 | 0.393 | 0.0482 | 12.3 |
| omega_V1 | 1.12 | 0.196 | 17.4 | 0.632 | 0.0511 | 8.09 |
| omega_Q | 0.3 | 0.0599 | 20 | 0.38 | 0.0426 | 11.2 |
| omega_V2 | 1.46 | 0.182 | 12.5 | 1.16 | 0.105 | 9.08 |
| Error Model Parameters | ||||||
| b | 0.306 | 0.0053 | 1.73 | 0.307 | 0.00523 | 1.7 |
| −2 × log-likelihood | 11,859.63 | 11,856.36 | ||||
| AIC | 11,893.63 | 11,882.36 | ||||
| BIC | 11,938.91 | 11,916.99 | ||||
Disclaimer/Publisher’s Note: The statements, opinions and data contained in all publications are solely those of the individual author(s) and contributor(s) and not of MDPI and/or the editor(s). MDPI and/or the editor(s) disclaim responsibility for any injury to people or property resulting from any ideas, methods, instructions or products referred to in the content. |
© 2025 by the authors. Licensee MDPI, Basel, Switzerland. This article is an open access article distributed under the terms and conditions of the Creative Commons Attribution (CC BY) license (https://creativecommons.org/licenses/by/4.0/).
Share and Cite
Rotarescu, C.A.; Maruntelu, I.; Rotarescu, I.; Constantinescu, A.-E.; Constantinescu, I. Analysis of Tacrolimus Clearance in Patients with Kidney Transplants from Romania. Biomedicines 2025, 13, 1501. https://doi.org/10.3390/biomedicines13061501
Rotarescu CA, Maruntelu I, Rotarescu I, Constantinescu A-E, Constantinescu I. Analysis of Tacrolimus Clearance in Patients with Kidney Transplants from Romania. Biomedicines. 2025; 13(6):1501. https://doi.org/10.3390/biomedicines13061501
Chicago/Turabian StyleRotarescu, Corina Andreea, Ion Maruntelu, Ion Rotarescu, Alexandra-Elena Constantinescu, and Ileana Constantinescu. 2025. "Analysis of Tacrolimus Clearance in Patients with Kidney Transplants from Romania" Biomedicines 13, no. 6: 1501. https://doi.org/10.3390/biomedicines13061501
APA StyleRotarescu, C. A., Maruntelu, I., Rotarescu, I., Constantinescu, A.-E., & Constantinescu, I. (2025). Analysis of Tacrolimus Clearance in Patients with Kidney Transplants from Romania. Biomedicines, 13(6), 1501. https://doi.org/10.3390/biomedicines13061501