

Immune System Alterations in the Development of Three Urological Cancers: Insights from Large-Sample Mendelian Randomization
Abstract
1. Introduction
2. Method
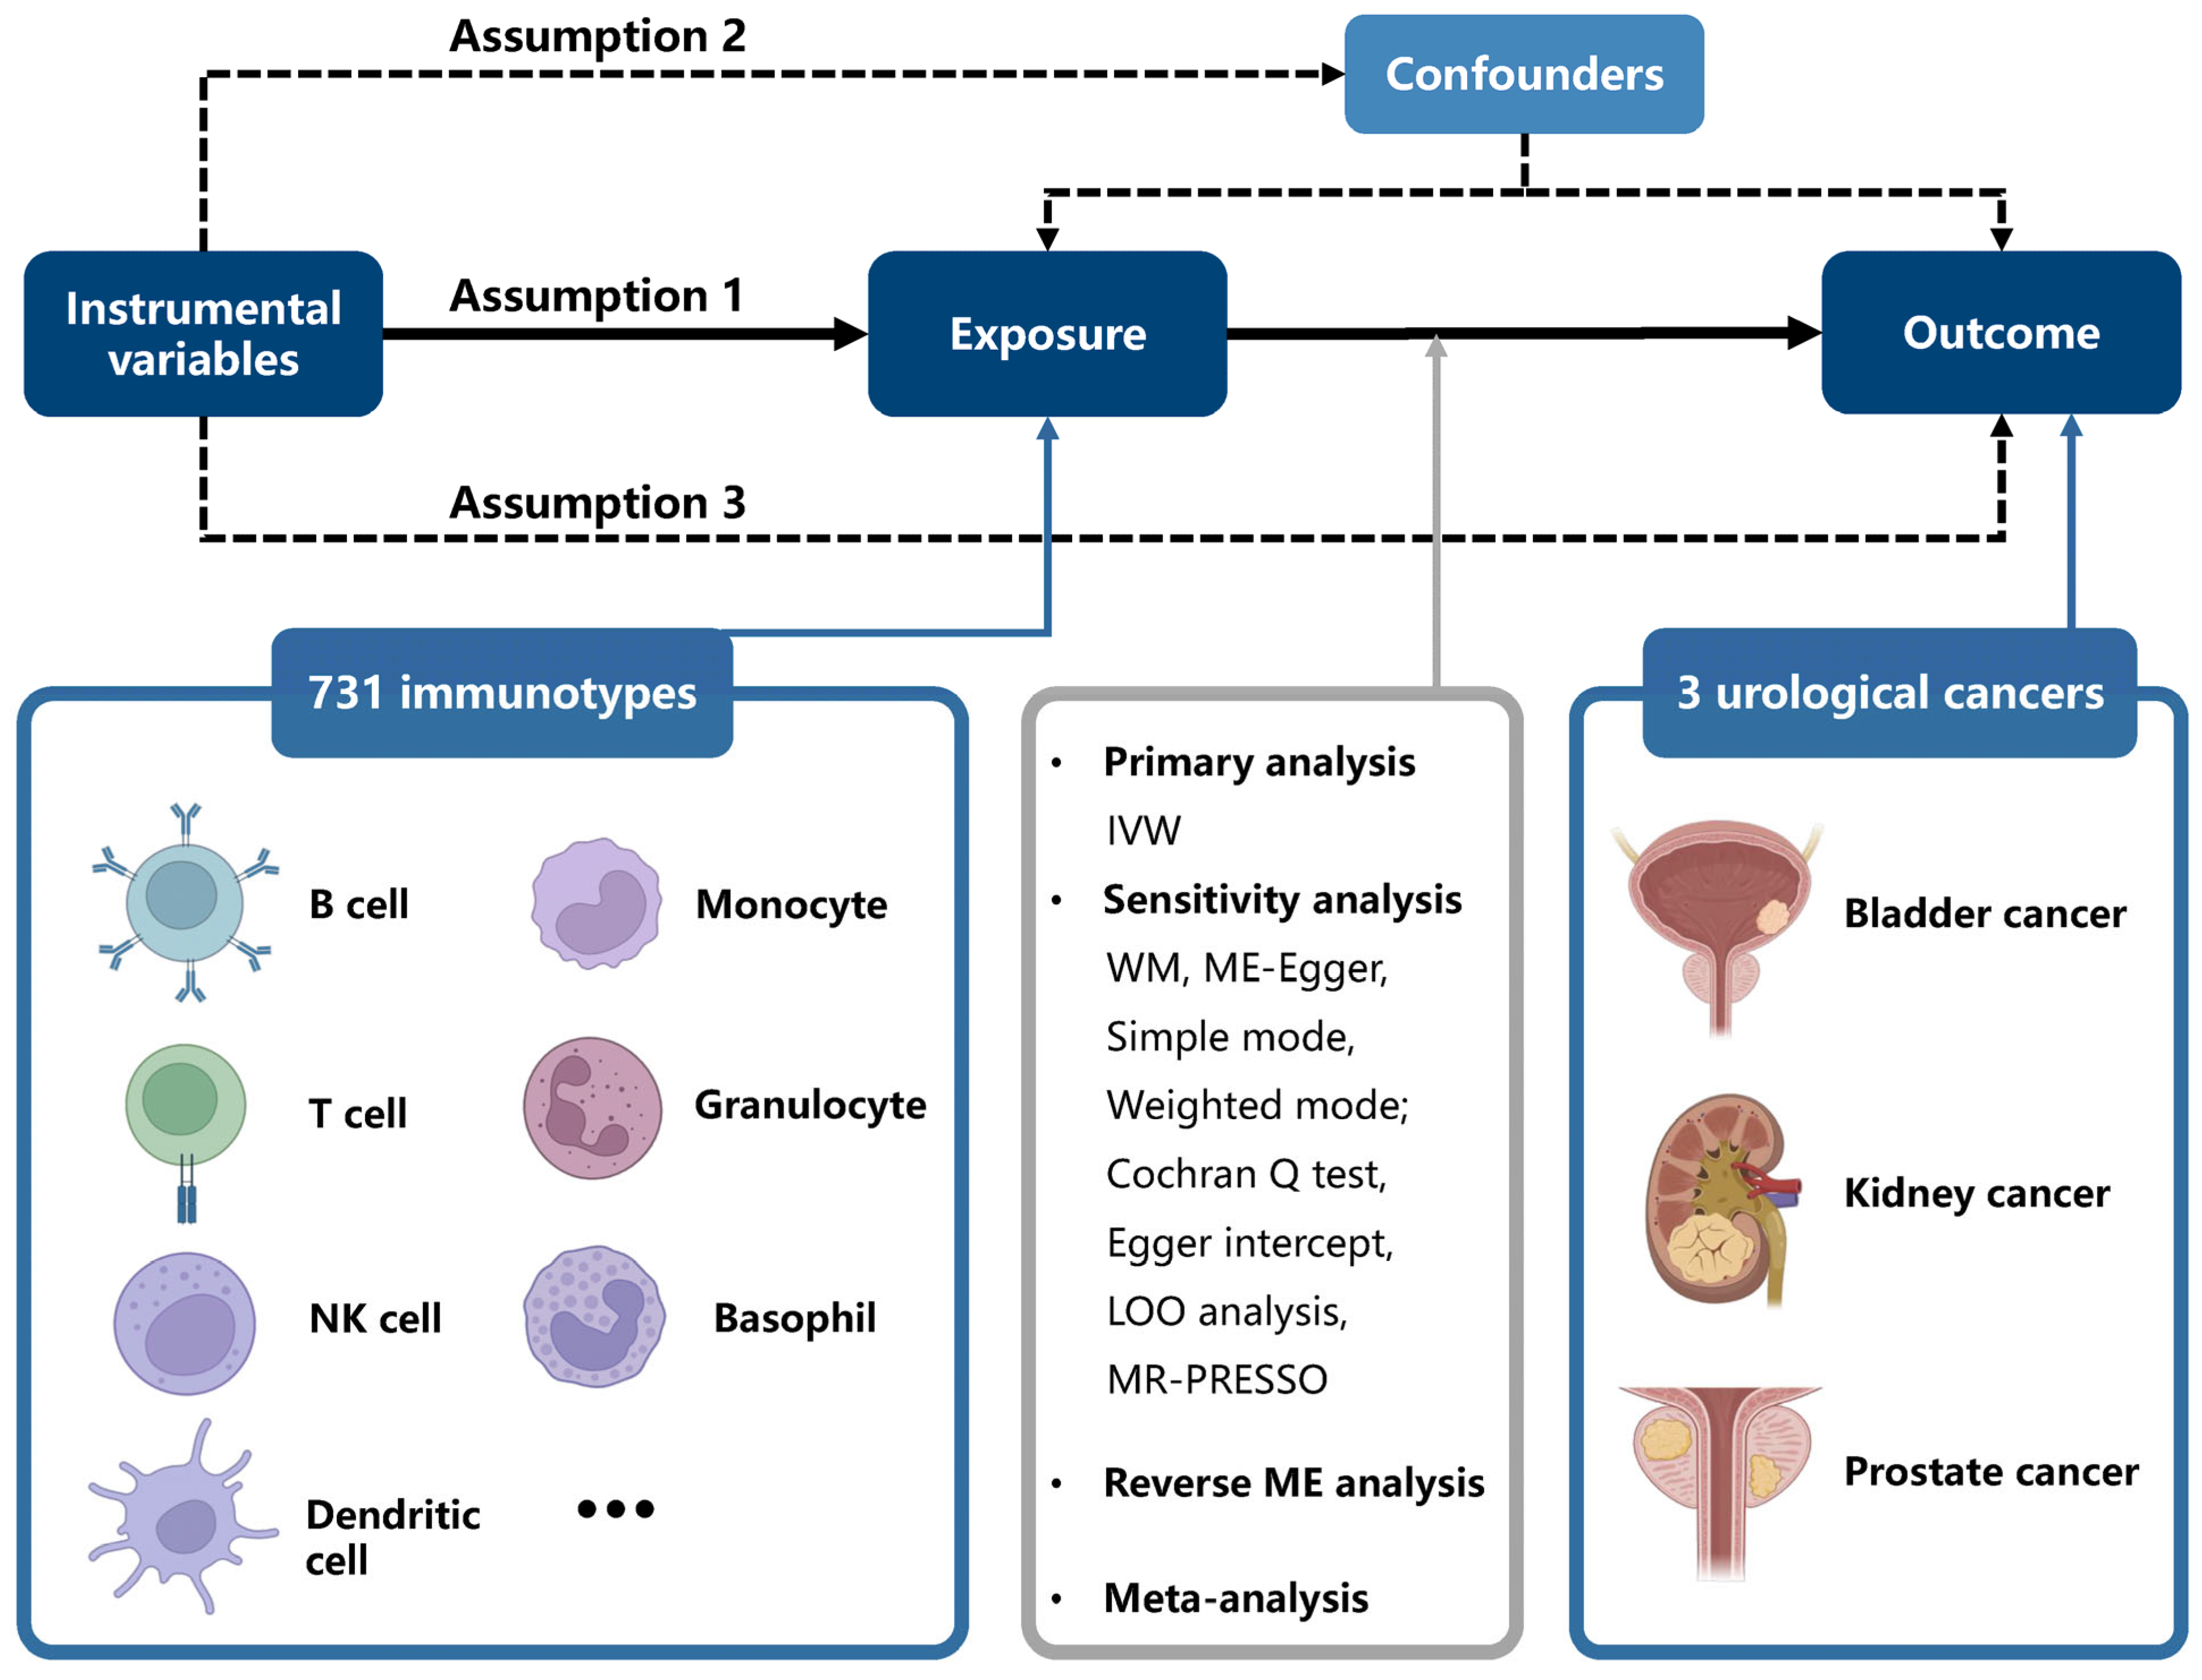
2.1. Study Design
2.2. GWAS Data Sources
2.3. Selection Criteria for Instrumental Variables
2.4. Mendelian Randomization Analysis
2.5. Evaluation of Ancestry-Specific Causal Associations
2.6. Statistical Analysis
3. Results
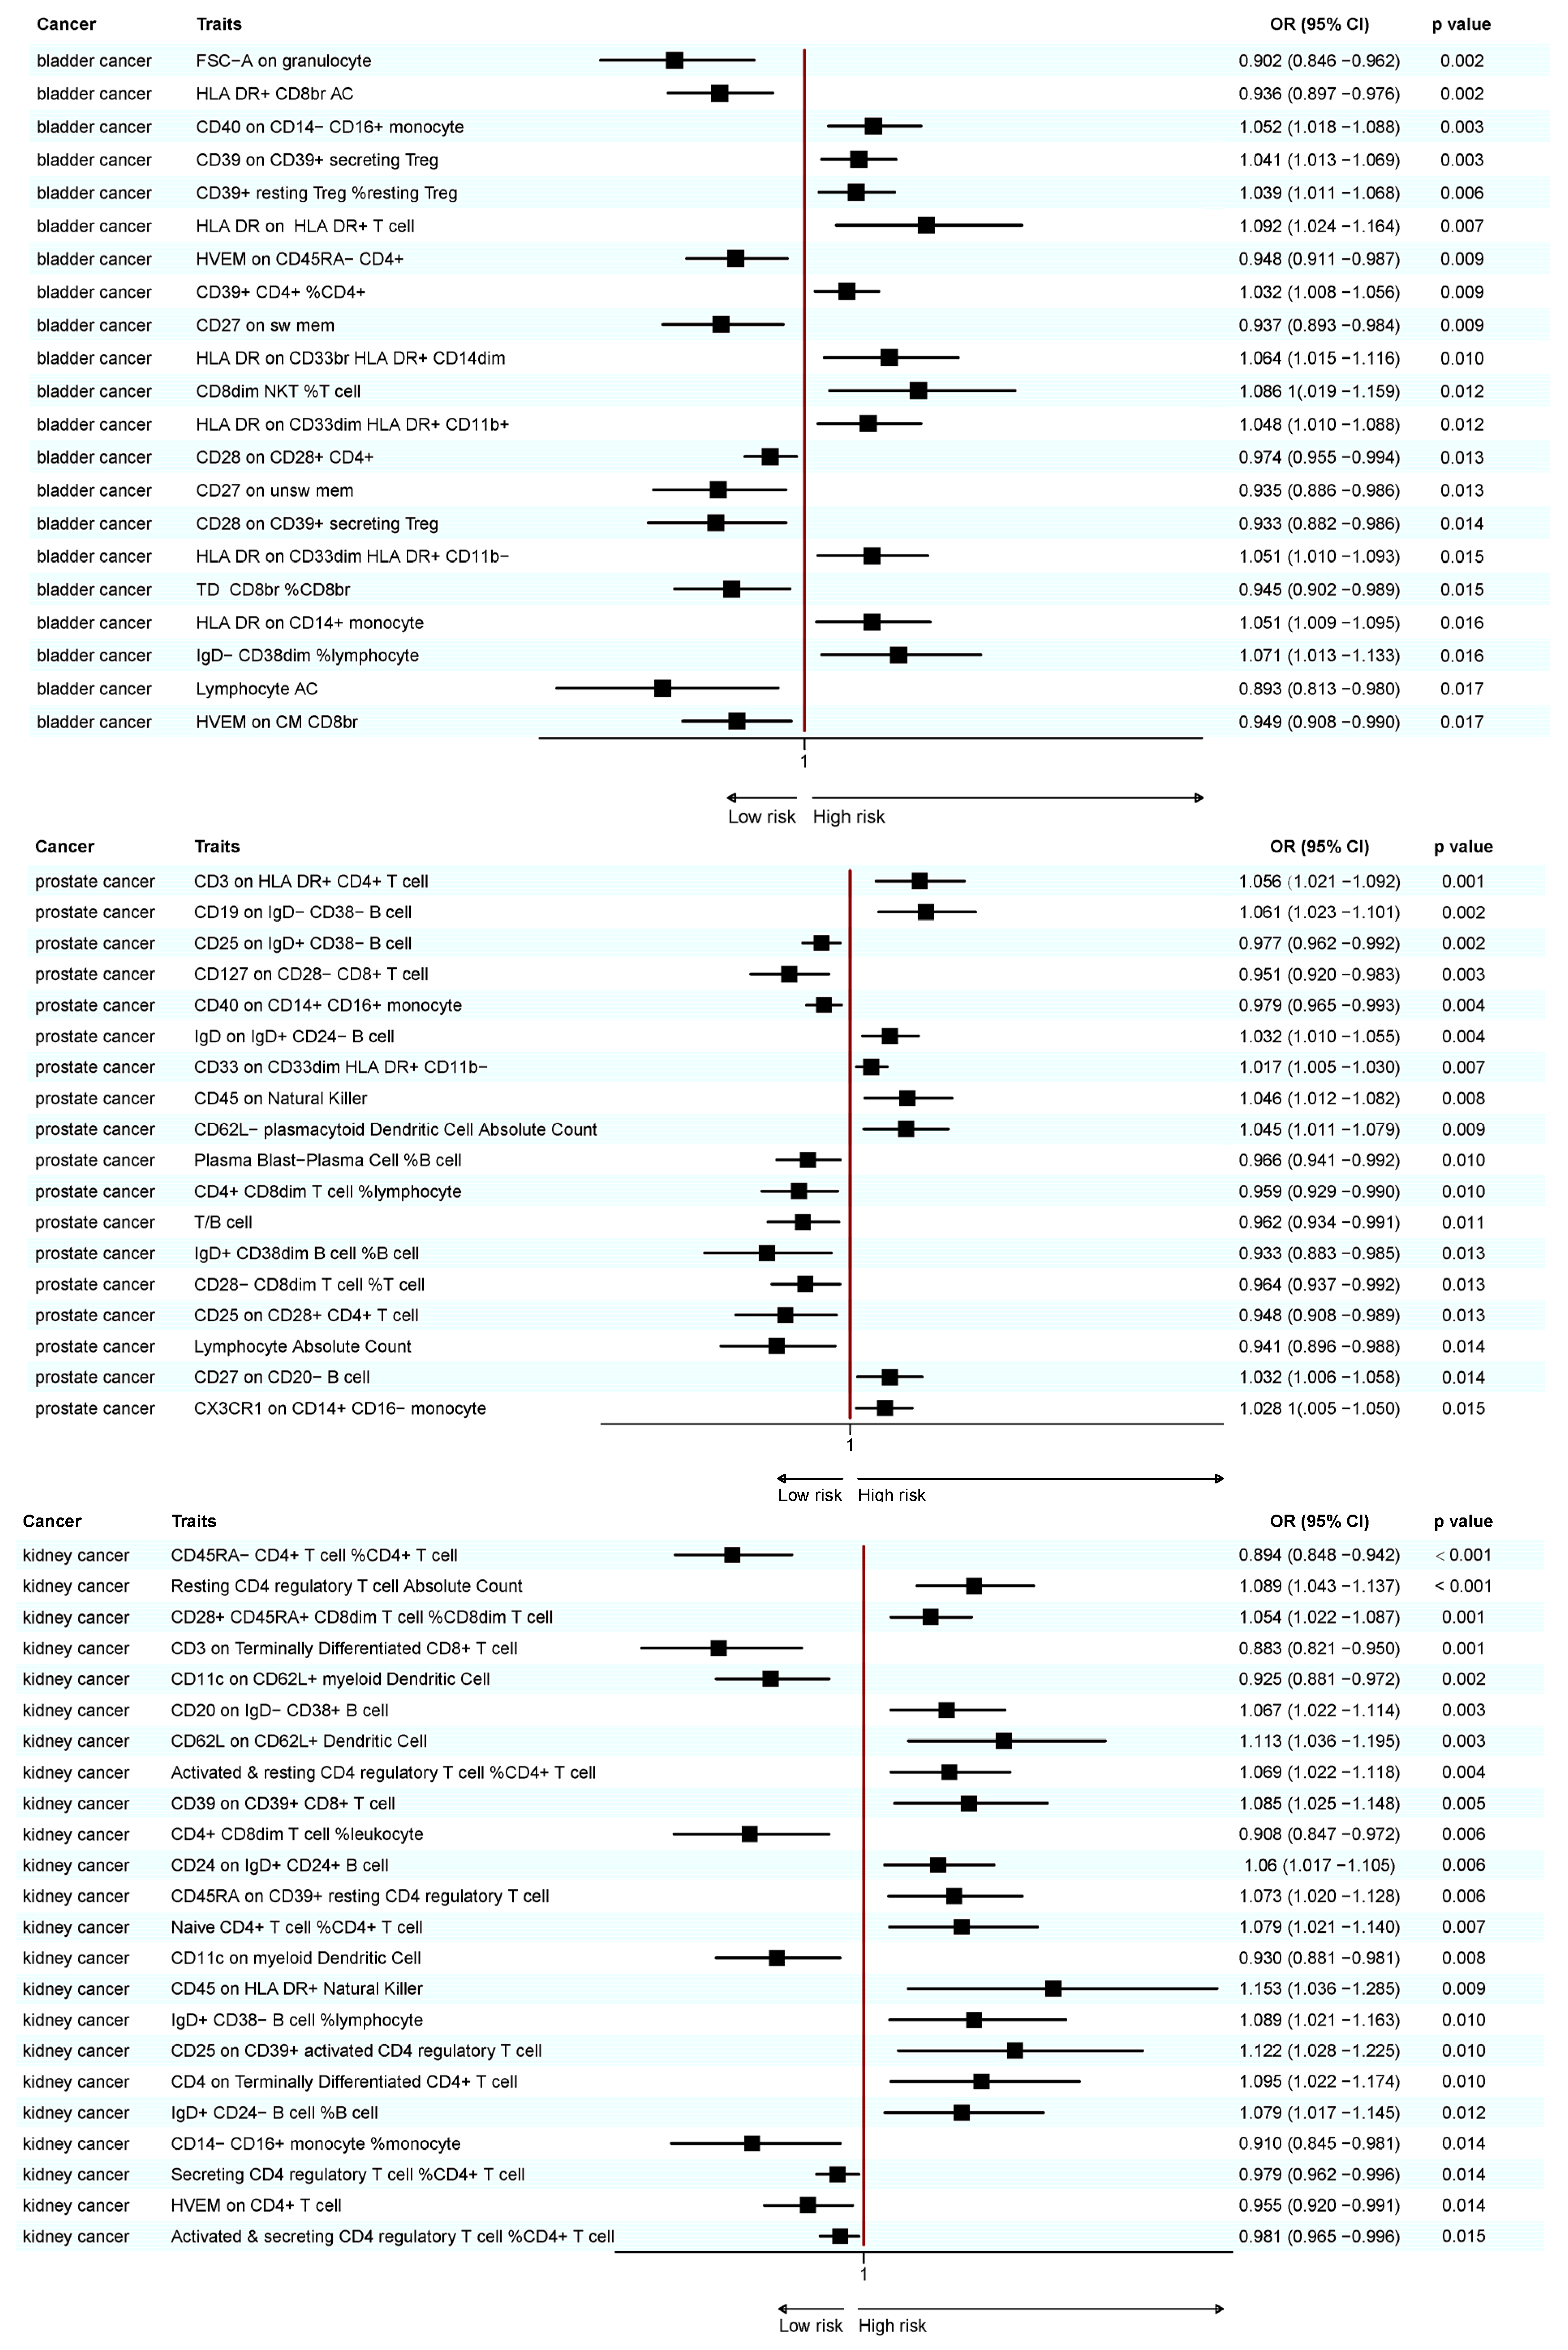
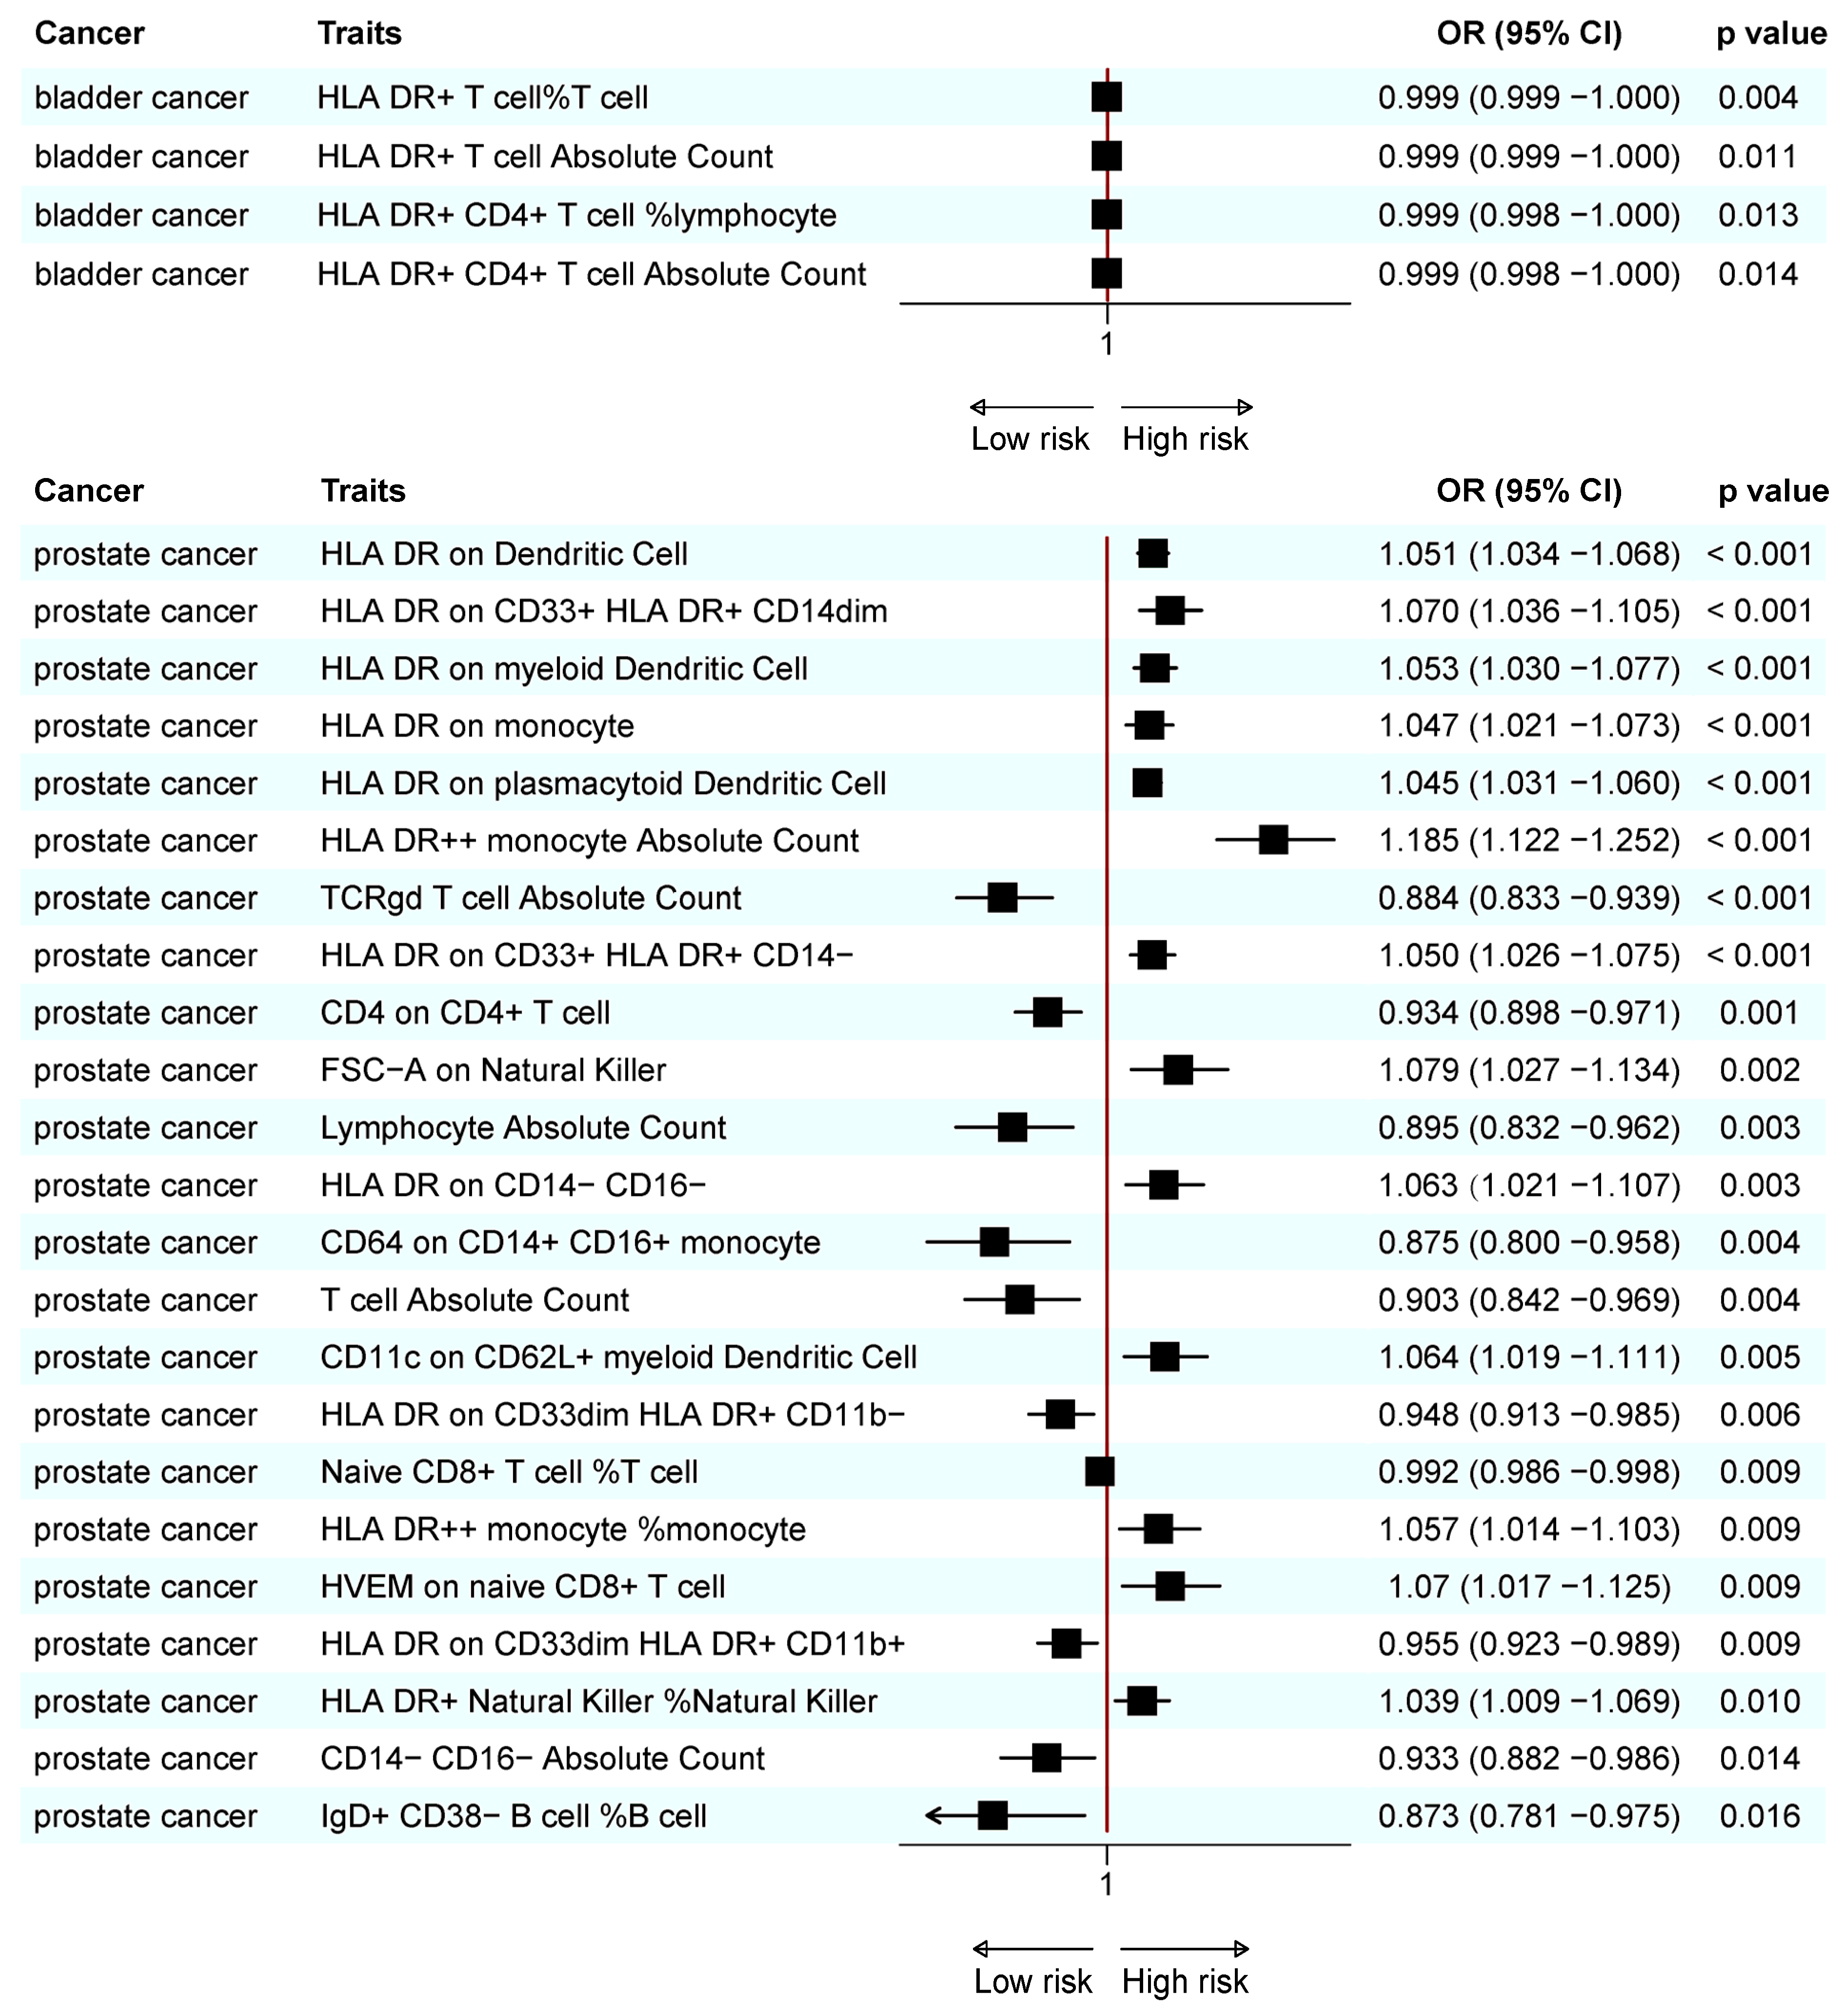
3.1. Causal Relationship Between Immune Cell Traits and BC
3.2. Causal Relationships Between Immune Cell Traits and PC
3.3. Causal Relationship Between Immune Cell Traits and KC
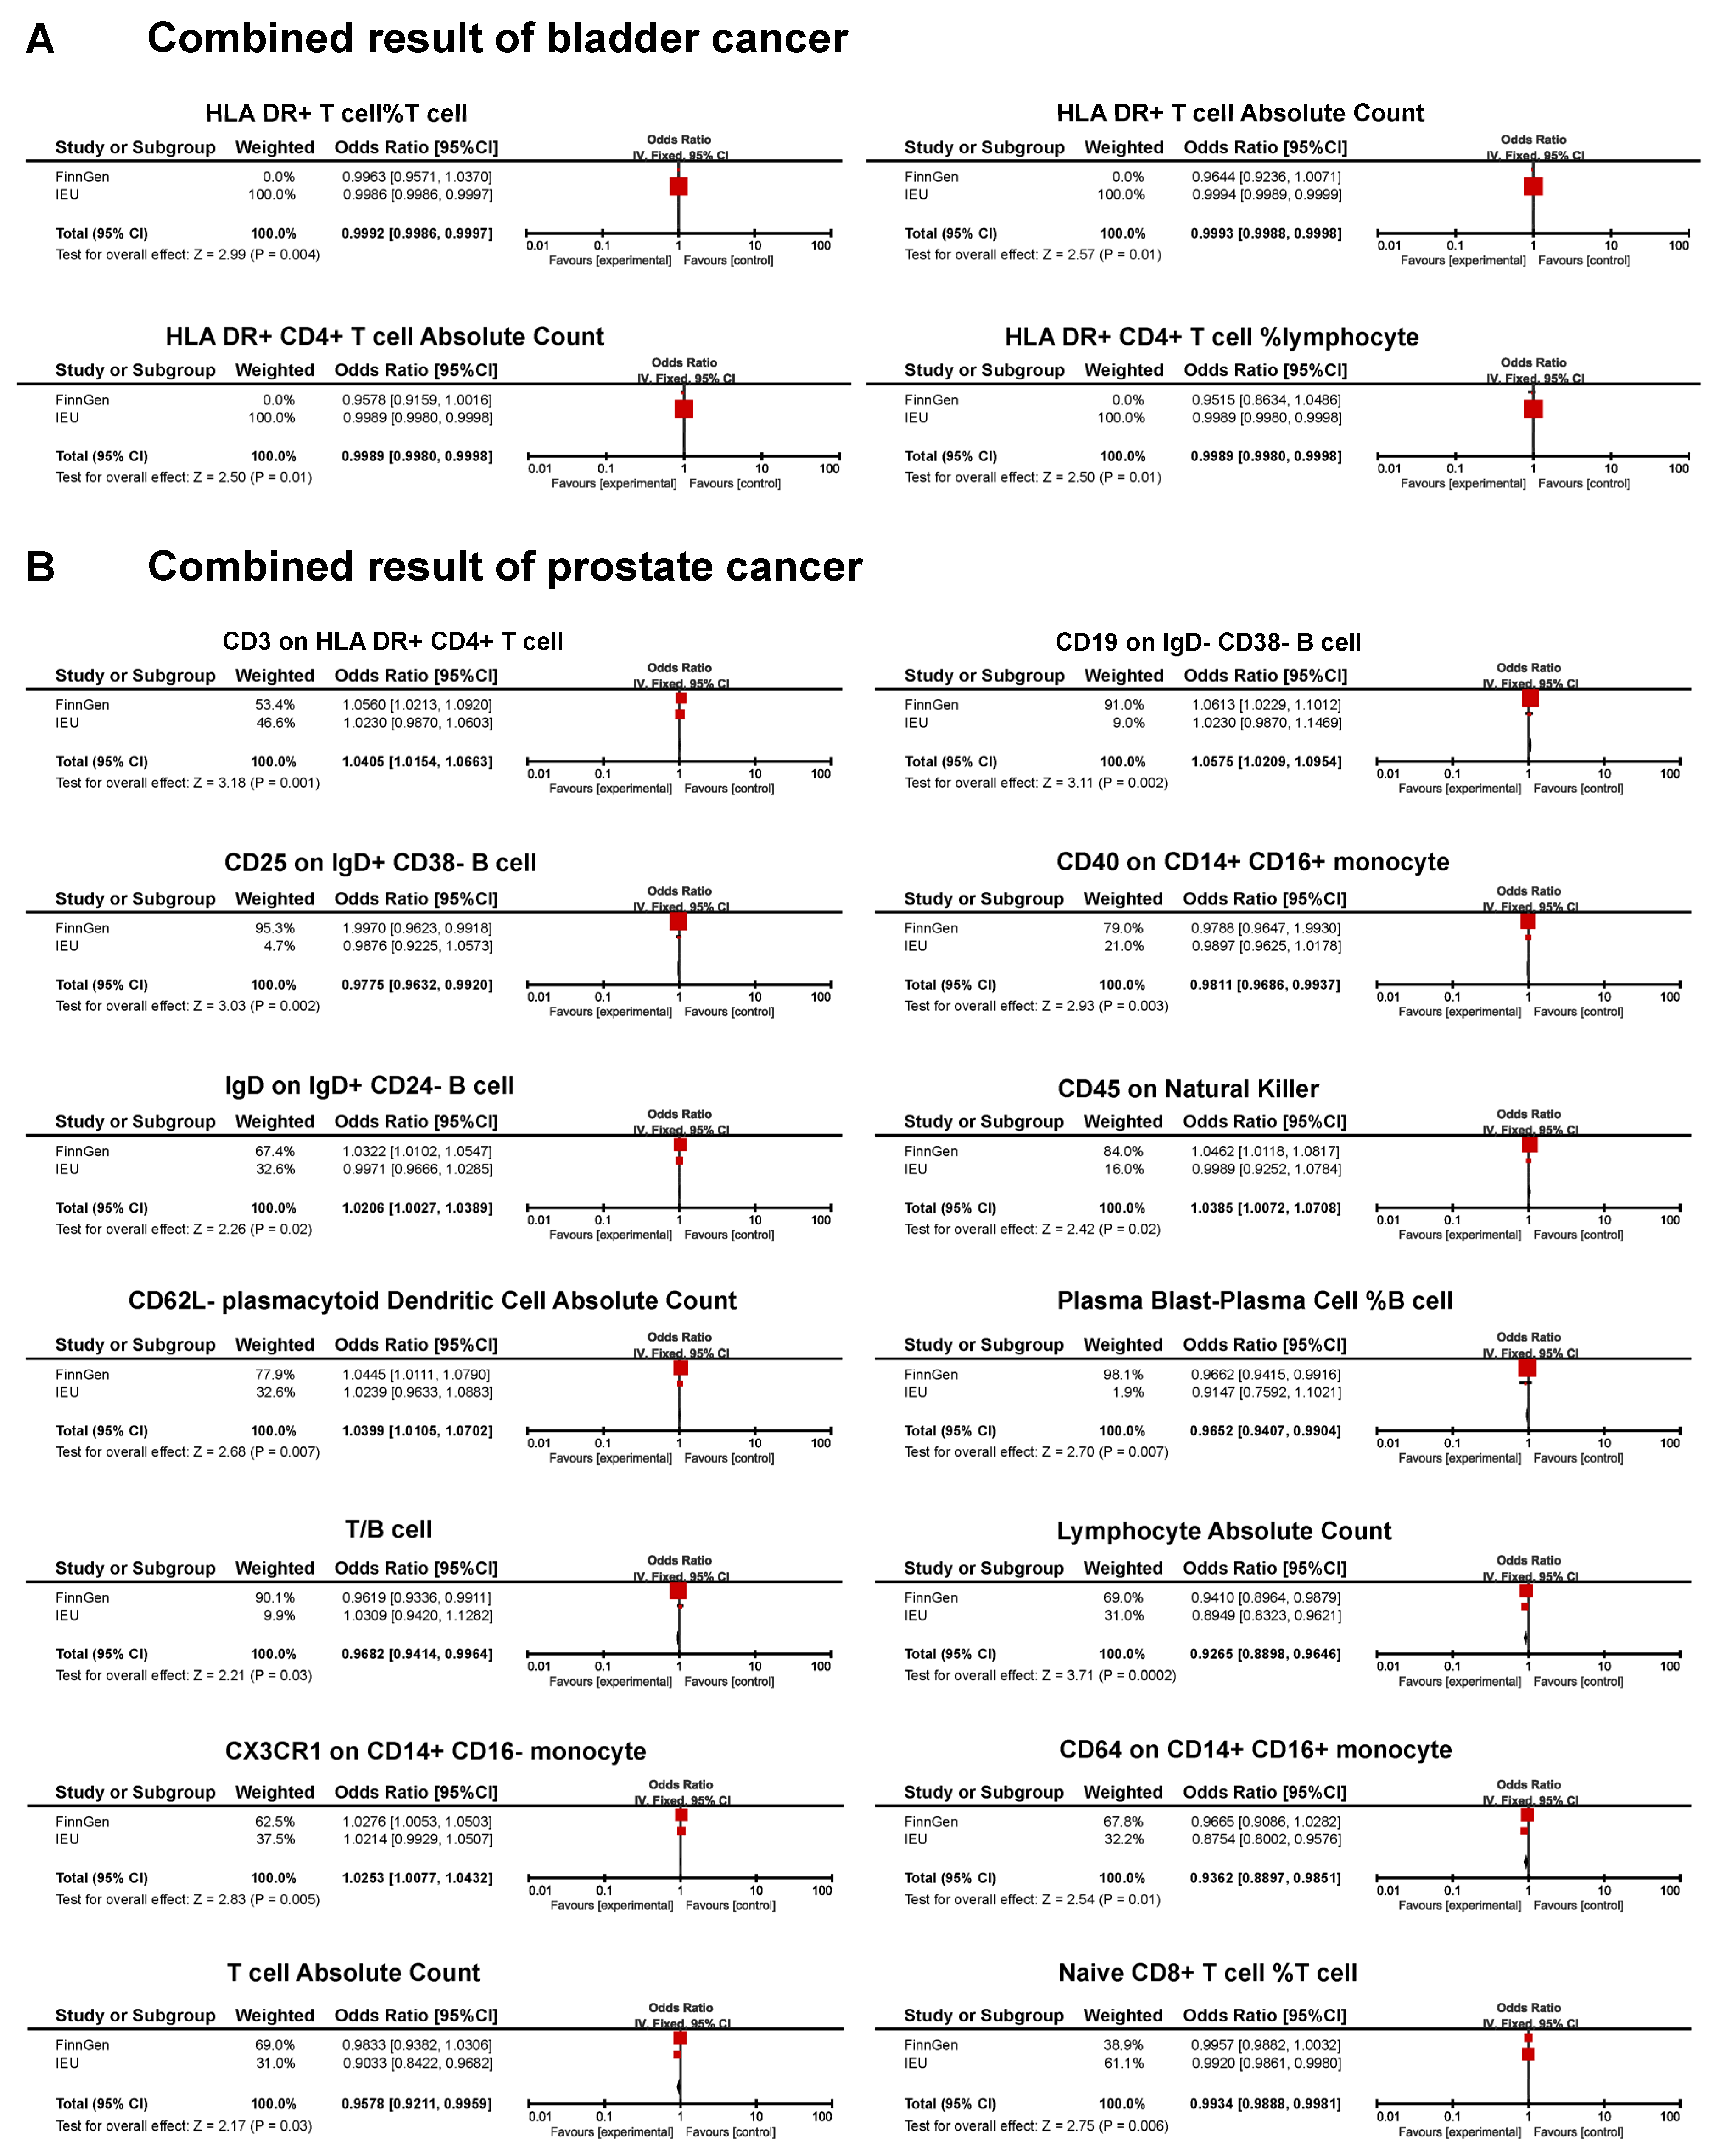
3.4. Combined Results for Urological Cancers from Meta-Analysis and Reverse MR Analysis
3.5. Differences in Causal Relationship Across Ethnic Groups
4. Discussion
5. Conclusions
Supplementary Materials
Author Contributions
Funding
Institutional Review Board Statement
Informed Consent Statement
Data Availability Statement
Conflicts of Interest
References
- Sung, H.; Ferlay, J.; Siegel, R.L.; Laversanne, M.; Soerjomataram, I.; Jemal, A.; Bray, F. Global Cancer Statistics 2020: GLOBOCAN Estimates of Incidence and Mortality Worldwide for 36 Cancers in 185 Countries. CA Cancer J. Clin. 2021, 71, 209–249. [Google Scholar] [CrossRef] [PubMed]
- Dy, G.W.; Gore, J.L.; Forouzanfar, M.H.; Naghavi, M.; Fitzmaurice, C. Global Burden of Urologic Cancers, 1990–2013. Eur. Urol. 2017, 71, 437–446. [Google Scholar] [CrossRef] [PubMed]
- Tran, C.; Ouk, S.; Clegg, N.J.; Chen, Y.; Watson, P.A.; Arora, V.; Sawyers, C.L. Development of a second-generation antiandrogen for treatment of advanced prostate cancer. Science 2009, 324, 787–790. [Google Scholar] [CrossRef]
- World Cancer Research Fund International. Cancer Trends. Available online: https://www.wcrf.org/cancer-trends (accessed on 16 February 2025).
- Znaor, A.; Skakkebaek, N.E.; Rajpert-De Meyts, E.; Kuliš, T.; Laversanne, M.; Gurney, J.; Sarfati, D.; McGlynn, K.A.; Bray, F. Global patterns in testicular cancer incidence and mortality in 2020. Int. J. Cancer 2022, 151, 692–698. [Google Scholar] [CrossRef]
- Pfannstiel, C.; Strissel, P.L.; Chiappinelli, K.B.; Sikic, D.; Wach, S.; Wirtz, R.M.; Wullweber, A.; Taubert, H.; Breyer, J.; Otto, W.; et al. The Tumor Immune Microenvironment Drives a Prognostic Relevance That Correlates with Bladder Cancer Subtypes. Cancer Immunol. Res. 2019, 7, 923–938. [Google Scholar] [CrossRef]
- Chevalier, M.F.; Schneider, A.K.; Cesson, V.; Dartiguenave, F.; Lucca, I.; Jichlinski, P.; Nardelli-Haefliger, D.; Derré, L. Conventional and PD-L1-expressing Regulatory T Cells are Enriched During BCG Therapy and may Limit its Efficacy. Eur. Urol. 2018, 74, 540–544. [Google Scholar] [CrossRef]
- Wang, C.; Zhang, Y.; Gao, W.Q. The evolving role of immune cells in prostate cancer. Cancer Lett. 2022, 525, 9–21. [Google Scholar] [CrossRef]
- Carceles-Cordon, M.; Kelly, W.K.; Gomella, L.; Knudsen, K.E.; Rodriguez-Bravo, V.; Domingo-Domenech, J. Cellular rewiring in lethal prostate cancer: The architect of drug resistance. Nat. Rev. Urol. 2020, 17, 292–307. [Google Scholar] [CrossRef] [PubMed]
- Parker, C.; Sartor, O. Abiraterone and increased survival in metastatic prostate cancer. N. Engl. J. Med. 2011, 365, 767. [Google Scholar]
- Díaz-Montero, C.M.; Rini, B.I.; Finke, J.H. The immunology of renal cell carcinoma. Nat. Rev. Nephrol. 2020, 16, 721–735. [Google Scholar] [CrossRef]
- Chevrier, S.; Levine, J.H.; Zanotelli, V.R.T.; Silina, K.; Schulz, D.; Bacac, M.; Ries, C.H.; Ailles, L.; Jewett, M.A.S.; Moch, H.; et al. An Immune Atlas of Clear Cell Renal Cell Carcinoma. Cell 2017, 169, 736–749.e18. [Google Scholar] [CrossRef] [PubMed]
- Lu, Y.; Yao, Y.; Zhai, S.; Ni, F.; Wang, J.; Chen, F.; Zhang, Y.; Li, H.; Hu, H.; Zhang, H.; et al. The role of immune cell signatures in the pathogenesis of ovarian-related diseases: A causal inference based on Mendelian randomization. Int. J. Surg. 2024, 110, 6541–6550. [Google Scholar] [CrossRef] [PubMed]
- Xu, W.; Zhang, T.; Zhu, Z.; Yang, Y. The association between immune cells and breast cancer: Insights from mendelian randomization and meta-analysis. Int. J. Surg. 2024, 111, 230–241. [Google Scholar] [CrossRef] [PubMed]
- Cerezo, M.; Sollis, E.; Ji, Y.; Lewis, E.; Abid, A.; Bircan, K.O.; Hall, P.; Hayhurst, J.; John, S.; Mosaku, A.; et al. The NHGRI-EBI GWAS Catalog: Standards for reusability, sustainability and diversity. Nucleic Acids Res. 2025, 53, D998–D1005. [Google Scholar] [CrossRef]
- Hemani, G.; Zheng, J.; Elsworth, B.; Wade, K.H.; Haberland, V.; Baird, D.; Laurin, C.; Burgess, S.; Bowden, J.; Langdon, R.; et al. The MR-Base platform supports systematic causal inference across the human phenome. eLife 2018, 7, e34408. [Google Scholar] [CrossRef]
- Orrù, V.; Steri, M.; Sidore, C.; Marongiu, M.; Serra, V.; Olla, S.; Sole, G.; Lai, S.; Dei, M.; Mulas, A.; et al. Complex genetic signatures in immune cells underlie autoimmunity and inform therapy. Nat. Genet. 2020, 52, 1036–1045. [Google Scholar] [CrossRef]
- Mollica, V.; Rizzo, A.; Massari, F. Adjuvant Nivolumab in Muscle-Invasive Urothelial Carcinoma. N. Engl. J. Med. 2021, 385, 956–957. [Google Scholar]
- Li, C.; Lv, C.; Chen, J.; Shang, K.; He, H.; Chen, C. Complex causal association between immune cell phenotypes and bladder cancer: A mendelian randomization and mediation study. Int. J. Surg. 2024, 111, 1568–1570. [Google Scholar] [CrossRef]
- Wang, Y.; Chen, R.; Guo, Z.; Wei, W.; Wang, T.; Ouyang, R.; Yuan, X.; Xing, Y.; Wang, F.; Wu, S.; et al. Immunological profiling for short-term predictive analysis in PD-1/PD-L1 therapy for lung cancer. BMC Cancer 2024, 24, 851. [Google Scholar] [CrossRef]
- Tay, R.E.; Richardson, E.K.; Toh, H.C. Revisiting the role of CD4(+) T cells in cancer immunotherapy-new insights into old paradigms. Cancer Gene Ther. 2021, 28, 5–17. [Google Scholar] [CrossRef]
- Mispelbaum, R.; Hattenhauer, S.T.; Held, S.A.E.; Brossart, P.; Heine, A. Baseline immune signature score of Tregs × HLA-DR+CD4+ T Cells × PD1+CD8+ T Cells Predict Outcome Immunotherapy in Cancer patients. Front. Immunol. 2022, 13, 1054161. [Google Scholar]
- Drake, C.G. Prostate cancer as a model for tumour immunotherapy. Nat. Rev. Immunol. 2010, 10, 580–593. [Google Scholar] [CrossRef]
- Wang, H.; He, Z.; Gao, Y.; Feng, D.; Wei, X.; Huang, Y.; Hou, J.; Li, S.; Zhang, W. Dual-Pronged Attack: pH-Driven Membrane-Anchored NIR Dual-Type Nano-Photosensitizer Excites Immunogenic Pyroptosis and Sequester Immune Checkpoint for Enhanced Prostate Cancer Photo-Immunotherapy. Adv. Sci. 2023, 10, e2302422. [Google Scholar] [CrossRef]
- Zhong, M.; Zhan, X.; Zhong, F.P. Causal role of immune cells in prostate cancer: A bidirectional Mendelian-randomization analyses. Aging 2024, 16, 10477–10488. [Google Scholar] [CrossRef]
- Tsaur, I.; Noack, A.; Makarevic, J.; Oppermann, E.; Waaga-Gasser, A.M.; Gasser, M.; Borgmann, H.; Huesch, T.; Gust, K.M.; Reiter, M.; et al. CCL2 Chemokine as a Potential Biomarker for Prostate Cancer: A Pilot Study. Cancer Res. Treat. 2015, 47, 306–312. [Google Scholar] [CrossRef]
- Swaby, A.; Atallah, A.; Varol, O.; Cristea, A.; Quail, D.F. Lifestyle and host determinants of antitumor immunity and cancer health disparities. Trends Cancer 2023, 9, 1019–1040. [Google Scholar] [CrossRef]
- Bergin, A.R.T.; Salgado, R.; Loi, S. Ethnicity, Immunity, and Outcomes: Biology versus Socioeconomic Status. Cancer Immunol. Res. 2023, 11, 705–706. [Google Scholar] [CrossRef]
- Carrot-Zhang, J.; Chambwe, N.; Damrauer, J.S.; Knijnenburg, T.A.; Robertson, A.G.; Yau, C.; Zhou, W.; Berger, A.C.; Huang, K.L.; Newberg, J.Y.; et al. Comprehensive Analysis of Genetic Ancestry and Its Molecular Correlates in Cancer. Cancer Cell 2020, 37, 639–654.e6. [Google Scholar] [CrossRef]

| Outcomes | Traits | Heterogeneity | Pleiotropy | Outcomes | Traits | Heterogeneity | Pleiotropy | ||||
|---|---|---|---|---|---|---|---|---|---|---|---|
| I2 | p-Value | Egger Intercept | p-Value | I2 | p-Value | Egger Intercept | p-Value | ||||
| Bladder cancer of FinnGen | FSC-A on granulocyte | 0 | 0.946 | 0.001 | 0.965 | Prostate cancer of FinnGen | CD3 on HLA DR+ CD4+ T cells | 0.399 | 0.005 | 0.004 | 0.667 |
| HLA DR+ CD8br AC | 0 | 0.638 | <0.001 | 0.963 | CD19 on IgD- CD38- B cells | 0.076 | 0.355 | 0.006 | 0.288 | ||
| CD40 on CD14- CD16 + monocyte | 0 | 0.516 | 0.012 | 0.161 | CD25 on IgD+ CD38- B cells | 0.275 | 0.058 | 0.005 | 0.302 | ||
| CD39 on CD39 + secreting Treg | 0.087 | 0.188 | 0.001 | 0.870 | CD127 on CD28- CD8+ T cells | 0 | 0.950 | 0.000 | 0.942 | ||
| CD39+ resting Treg %resting Treg | 0.048 | 0.310 | 0.004 | 0.561 | CD40 on CD14+ CD16+ monocytes | 0 | 0.767 | −0.003 | 0.407 | ||
| HLA DR on HLA DR+ T cell | 0 | 0.473 | −0.013 | 0.354 | IgD on IgD+ CD24- B cells | 0.055 | 0.353 | −0.002 | 0.651 | ||
| HVEM on CD45RA- CD4+ | 0.139 | 0.271 | 0.008 | 0.609 | CD33 on CD33dim HLA DR+ CD11b- | 0.099 | 0.219 | 0.001 | 0.785 | ||
| CD39+ CD4+ %CD4+ | 0 | 0.579 | 0.006 | 0.371 | CD45 on natural killer cells | 0.285 | 0.067 | 0.003 | 0.689 | ||
| CD27 on sw mem | 0.203 | 0.053 | 0.013 | 0.377 | CD62L- plasmacytoid dendritic cell absolute count | 0 | 0.891 | −0.002 | 0.753 | ||
| HLA DR on CD33br HLA DR+ CD14dim | 0.412 | <0.001 | −0.006 | 0.731 | Plasma blast-plasma cell %B cell | 0.024 | 0.428 | 0.008 | 0.249 | ||
| CD8dim NKT %T cell | 0.092 | 0.291 | −0.008 | 0.641 | CD4+ CD8dim T cell %lymphocyte | 0.342 | 0.007 | 0.022 | 0.007 | ||
| HLA DR on CD33dim HLA DR+ CD11b+ | 0.334 | 0.002 | <0.001 | 0.986 | T/B cell | 0 | 0.841 | −0.007 | 0.224 | ||
| CD28 on CD28+ CD4+ | 0 | 0.835 | 0.007 | 0.423 | IgD+ CD38dim B cell %B cell | 0.366 | 0.077 | −0.004 | 0.644 | ||
| CD27 on unsw mem | 0.209 | 0.059 | 0.023 | 0.083 | CD28- CD8dim T cell %T cell | 0.200 | 0.150 | −0.002 | 0.745 | ||
| CD28 on CD39+ secreting Treg | 0.048 | 0.382 | 0.002 | 0.892 | CD25 on CD28+ CD4+ T cell | 0.184 | 0.195 | −0.002 | 0.870 | ||
| HLA DR on CD33dim HLA DR+ CD11b- | 0.198 | 0.065 | −0.008 | 0.607 | Lymphocyte absolute count | 0.321 | 0.089 | 0.004 | 0.645 | ||
| TD CD8br %CD8br | 0.000 | 0.476 | 0.016 | 0.153 | CD27 on CD20- B cell | 0 | 0.806 | 0.010 | 0.165 | ||
| HLA DR on CD14+ monocyte | 0.378 | <0.001 | −0.010 | 0.450 | CX3CR1 on CD14+ CD16- monocyte | 0.079 | 0.308 | 0.009 | 0.131 | ||
| IgD- CD38 dim %lymphocyte | 0 | 0.738 | −0.010 | 0.391 | Prostate cancer of IEU | HLA DR on plasmacytoid dendritic cell | 0 | 0.672 | −0.012 | 0.126 | |
| Lymphocyte AC | 0 | 0.471 | −0.003 | 0.867 | HLA DR on dendritic cell | 0 | 0.563 | −0.014 | 0.127 | ||
| HVEM on CM CD8br | 0.221 | 0.187 | 0.003 | 0.873 | HLA DR++ monocyte absolute count | 0 | 0.475 | NA | NA | ||
| Bladder cancer of IEU | HLA DR+ T cell%T cell | 0 | 0.609 | <−0.001 | 0.430 | HLA DR on myeloid dendritic cell | 0.329 | 0.177 | −0.028 | 0.033 | |
| HLA DR+ T cell absolute count | 0.062 | 0.371 | <−0.001 | 0.295 | HLA DR on CD33+ HLA DR+ CD14dim | 0 | 0.985 | 0.003 | 0.946 | ||
| HLA DR+ CD4+ T cell %lymphocyte | 0 | 0.614 | NA | NA | HLA DR on CD33+ HLA DR+ CD14- | 0 | 0.984 | 0.004 | 0.905 | ||
| HLA DR+ CD4+ T cell absolute count | 0 | 0.836 | NA | NA | TCRgd T cell absolute count | 0 | 0.757 | NA | NA | ||
| Kidney cancer of FinnGen | CD45RA- CD4+ T cell %CD4+ T cell | 0 | 0.752 | 0.002 | 0.847 | HLA DR on monocyte | 0 | 0.660 | −0.014 | 0.432 | |
| Resting CD4 regulatory T cell absolute count | 0 | 0.760 | −0.017 | 0.120 | CD4 on CD4+ T cell | 0 | 0.410 | NA | NA | ||
| CD28+ CD45RA+ CD8dim T cell %CD8dim T cell | 0.137 | 0.218 | −0.007 | 0.449 | FSC-A on natural killer cells | 0 | 0.851 | 0.001 | 0.968 | ||
| CD3 on terminally differentiated CD8+ T | 0.128 | 0.261 | −0.038 | 0.053 | Lymphocyte absolute count | 0 | 0.604 | NA | NA | ||
| CD11c on CD62L+ myeloid dendritic cell | 0.175 | 0.158 | −0.001 | 0.947 | HLA DR on CD14- CD16- | 0.713 | 0.008 | −0.009 | 0.740 | ||
| CD20 on IgD- CD38+ B cell | 0 | 0.731 | 0.002 | 0.876 | CD64 on CD14+ CD16+ monocytes | 0 | 0.811 | NA | NA | ||
| CD62L on CD62L+ Dendritic Cell | 0 | 0.472 | −0.027 | 0.093 | T cell absolute count | 0 | 0.549 | NA | NA | ||
| Activated and resting CD4 regulatory T cell %CD4+ T cell | 0.201 | 0.113 | −0.016 | 0.161 | CD11c on CD62L+ myeloid dendritic cells | 0 | 0.976 | NA | NA | ||
| CD39 on CD39+ CD8+ T cell | 0.049 | 0.374 | 0.030 | 0.043 | HLA DR on CD33dim HLA DR+ CD11b- | 0.656 | 0.020 | −0.045 | 0.203 | ||
| CD4+ CD8dim T cell %leukocyte | 0.147 | 0.193 | 0.024 | 0.222 | HVEM on/naïve CD8+ T cell | 0 | 0.621 | NA | NA | ||
| CD24 on IgD+ CD24+ B cell | 0.213 | 0.125 | 0.022 | 0.026 | Naïve CD8+ T cell %T cell | 0 | 0.901 | −0.003 | 0.771 | ||
| CD45RA on CD39+ resting CD4 regulatory T cell | 0.110 | 0.297 | −0.024 | 0.166 | HLA DR on CD33dim HLA DR+ CD11b+ | 0.528 | 0.096 | <0.001 | 0.999 | ||
| Naïve CD4+ T cell %CD4+ T cell | 0.034 | 0.404 | −0.014 | 0.182 | HLA DR++ monocyte %monocyte | 0 | 0.455 | −0.032 | 0.431 | ||
| CD11c on myeloid dendritic cell | 0.292 | 0.031 | 0.015 | 0.171 | HLA DR+ natural killer %natural killer | 0 | 0.464 | 0.006 | 0.403 | ||
| CD45 on HLA DR+ /natural killer | 0 | 0.842 | −0.023 | 0.300 | CD14- CD16- AC | 0 | 0.745 | −0.062 | 0.584 | ||
| IgD+ CD38- B cell %lymphocyte | 0.145 | 0.264 | −0.012 | 0.425 | IgD+ CD38- B cell %B cell | 0 | 0.384 | NA | NA | ||
| CD25 on CD39+ activated CD4 regulatory T cell | 0.101 | 0.342 | −0.004 | 0.815 | |||||||
| CD4 on terminally differentiated CD4+ T cell | 0 | 0.503 | −0.008 | 0.600 | |||||||
| IgD+ CD24- B cell %B cell | 0 | 0.844 | −0.014 | 0.394 | |||||||
| CD14-CD16+ monocyte %monocyte | 0.157 | 0.211 | 0.002 | 0.880 | |||||||
| Secreting CD4 regulatory T cell %CD4+ T cell | 0.060 | 0.355 | −0.007 | 0.436 | |||||||
| HVEM on CD4+ T cell | 0.033 | 0.417 | −0.003 | 0.856 | |||||||
| Activated and secreting CD4 regulatory T cell %CD4+ T cell | 0 | 0.513 | 0.009 | 0.342 | |||||||
| Trait | nSNP | Beta | SE | p-Value | OR (95% CI) |
|---|---|---|---|---|---|
| Bladder cancer | |||||
| HLA DR+ T cell absolute count | 2 | −0.016 | 0.129 | 0.902 | 0.984 (0.764–1.268) |
| HLA DR+ T cell%T cell | 2 | 0.021 | 0.129 | 0.873 | 1.021 (0.792–1.316) |
| HLA DR+ CD4+ T cell absolute count | 2 | 0.012 | 0.196 | 0.950 | 1.012 (0.690–1.486) |
| HLA DR+ CD4+ T cell %lymphocyte | 2 | 0.015 | 0.177 | 0.930 | 1.016 (0.718–1.438) |
| Prostate cancer | |||||
| Plasma blast-plasma cell %B cell | 54 | 0.053 | 0.039 | 0.178 | 1.054 (0.976–1.138) |
| CD62L- plasmacytoid dendritic cell absolute count | 54 | 0.007 | 0.029 | 0.799 | 1.007 (0.952–1.066) |
| Naive CD8+ T cell %T cell | 55 | 0.016 | 0.021 | 0.436 | 1.016 (0.976–1.058) |
| T/B cell | 55 | −0.003 | 0.031 | 0.920 | 0.997 (0.938–1.059) |
| Lymphocyte absolute count | 55 | −0.076 | 0.029 | 0.010 | 0.927 (0.875–0.981) |
| T cell absolute count | 55 | −0.058 | 0.029 | 0.045 | 0.944 (0.892–0.999) |
| CD19 on IgD- CD38- B cell | 54 | 0.026 | 0.029 | 0.384 | 1.026 (0.969–1.086) |
| CD25 on IgD+ CD38- B cell | 54 | −0.016 | 0.032 | 0.613 | 0.984 (0.924–1.048) |
| IgD on IgD+ CD24- B cell | 54 | 0.034 | 0.030 | 0.255 | 1.035 (0.976–1.097) |
| CD3 on HLA DR+ CD4+ T cell | 54 | −0.017 | 0.032 | 0.606 | 0.983 (0.923–1.048) |
| CD45 on natural killer | 54 | −0.029 | 0.032 | 0.361 | 0.971 (0.912–1.034) |
| CD40 on CD14+ CD16+ monocyte | 54 | −0.035 | 0.030 | 0.240 | 0.966 (0.911–1.023) |
| CX3CR1 on CD14+ CD16- monocyte | 54 | −0.083 | 0.030 | 0.006 | 0.920 (0.868–0.976) |
| CD64 on CD14+ CD16+ monocyte | 52 | 0.001 | 0.030 | 0.985 | 1.001 (0.944–1.060) |
Disclaimer/Publisher’s Note: The statements, opinions and data contained in all publications are solely those of the individual author(s) and contributor(s) and not of MDPI and/or the editor(s). MDPI and/or the editor(s) disclaim responsibility for any injury to people or property resulting from any ideas, methods, instructions or products referred to in the content. |
© 2025 by the authors. Licensee MDPI, Basel, Switzerland. This article is an open access article distributed under the terms and conditions of the Creative Commons Attribution (CC BY) license (https://creativecommons.org/licenses/by/4.0/).
Share and Cite
Chen, Z.; Xie, Y.; Chen, X.; Hong, G.; Shen, R.; Lin, H.; Jiang, F.; Wang, Y.; Zhu, M.; Liu, Y.; et al. Immune System Alterations in the Development of Three Urological Cancers: Insights from Large-Sample Mendelian Randomization. Biomedicines 2025, 13, 1480. https://doi.org/10.3390/biomedicines13061480
Chen Z, Xie Y, Chen X, Hong G, Shen R, Lin H, Jiang F, Wang Y, Zhu M, Liu Y, et al. Immune System Alterations in the Development of Three Urological Cancers: Insights from Large-Sample Mendelian Randomization. Biomedicines. 2025; 13(6):1480. https://doi.org/10.3390/biomedicines13061480
Chicago/Turabian StyleChen, Zhijian, Ye Xie, Xiong Chen, Guibin Hong, Runnan Shen, Haishan Lin, Fan Jiang, Yun Wang, Mengyi Zhu, Yixuan Liu, and et al. 2025. "Immune System Alterations in the Development of Three Urological Cancers: Insights from Large-Sample Mendelian Randomization" Biomedicines 13, no. 6: 1480. https://doi.org/10.3390/biomedicines13061480
APA StyleChen, Z., Xie, Y., Chen, X., Hong, G., Shen, R., Lin, H., Jiang, F., Wang, Y., Zhu, M., Liu, Y., Wang, H., Yang, H., Lin, T., & Wu, S. (2025). Immune System Alterations in the Development of Three Urological Cancers: Insights from Large-Sample Mendelian Randomization. Biomedicines, 13(6), 1480. https://doi.org/10.3390/biomedicines13061480