
Targeting Insulin Resistance and Liver Fibrosis: CKD Screening Priorities in MASLD

Abstract
1. Introduction
2. Methods
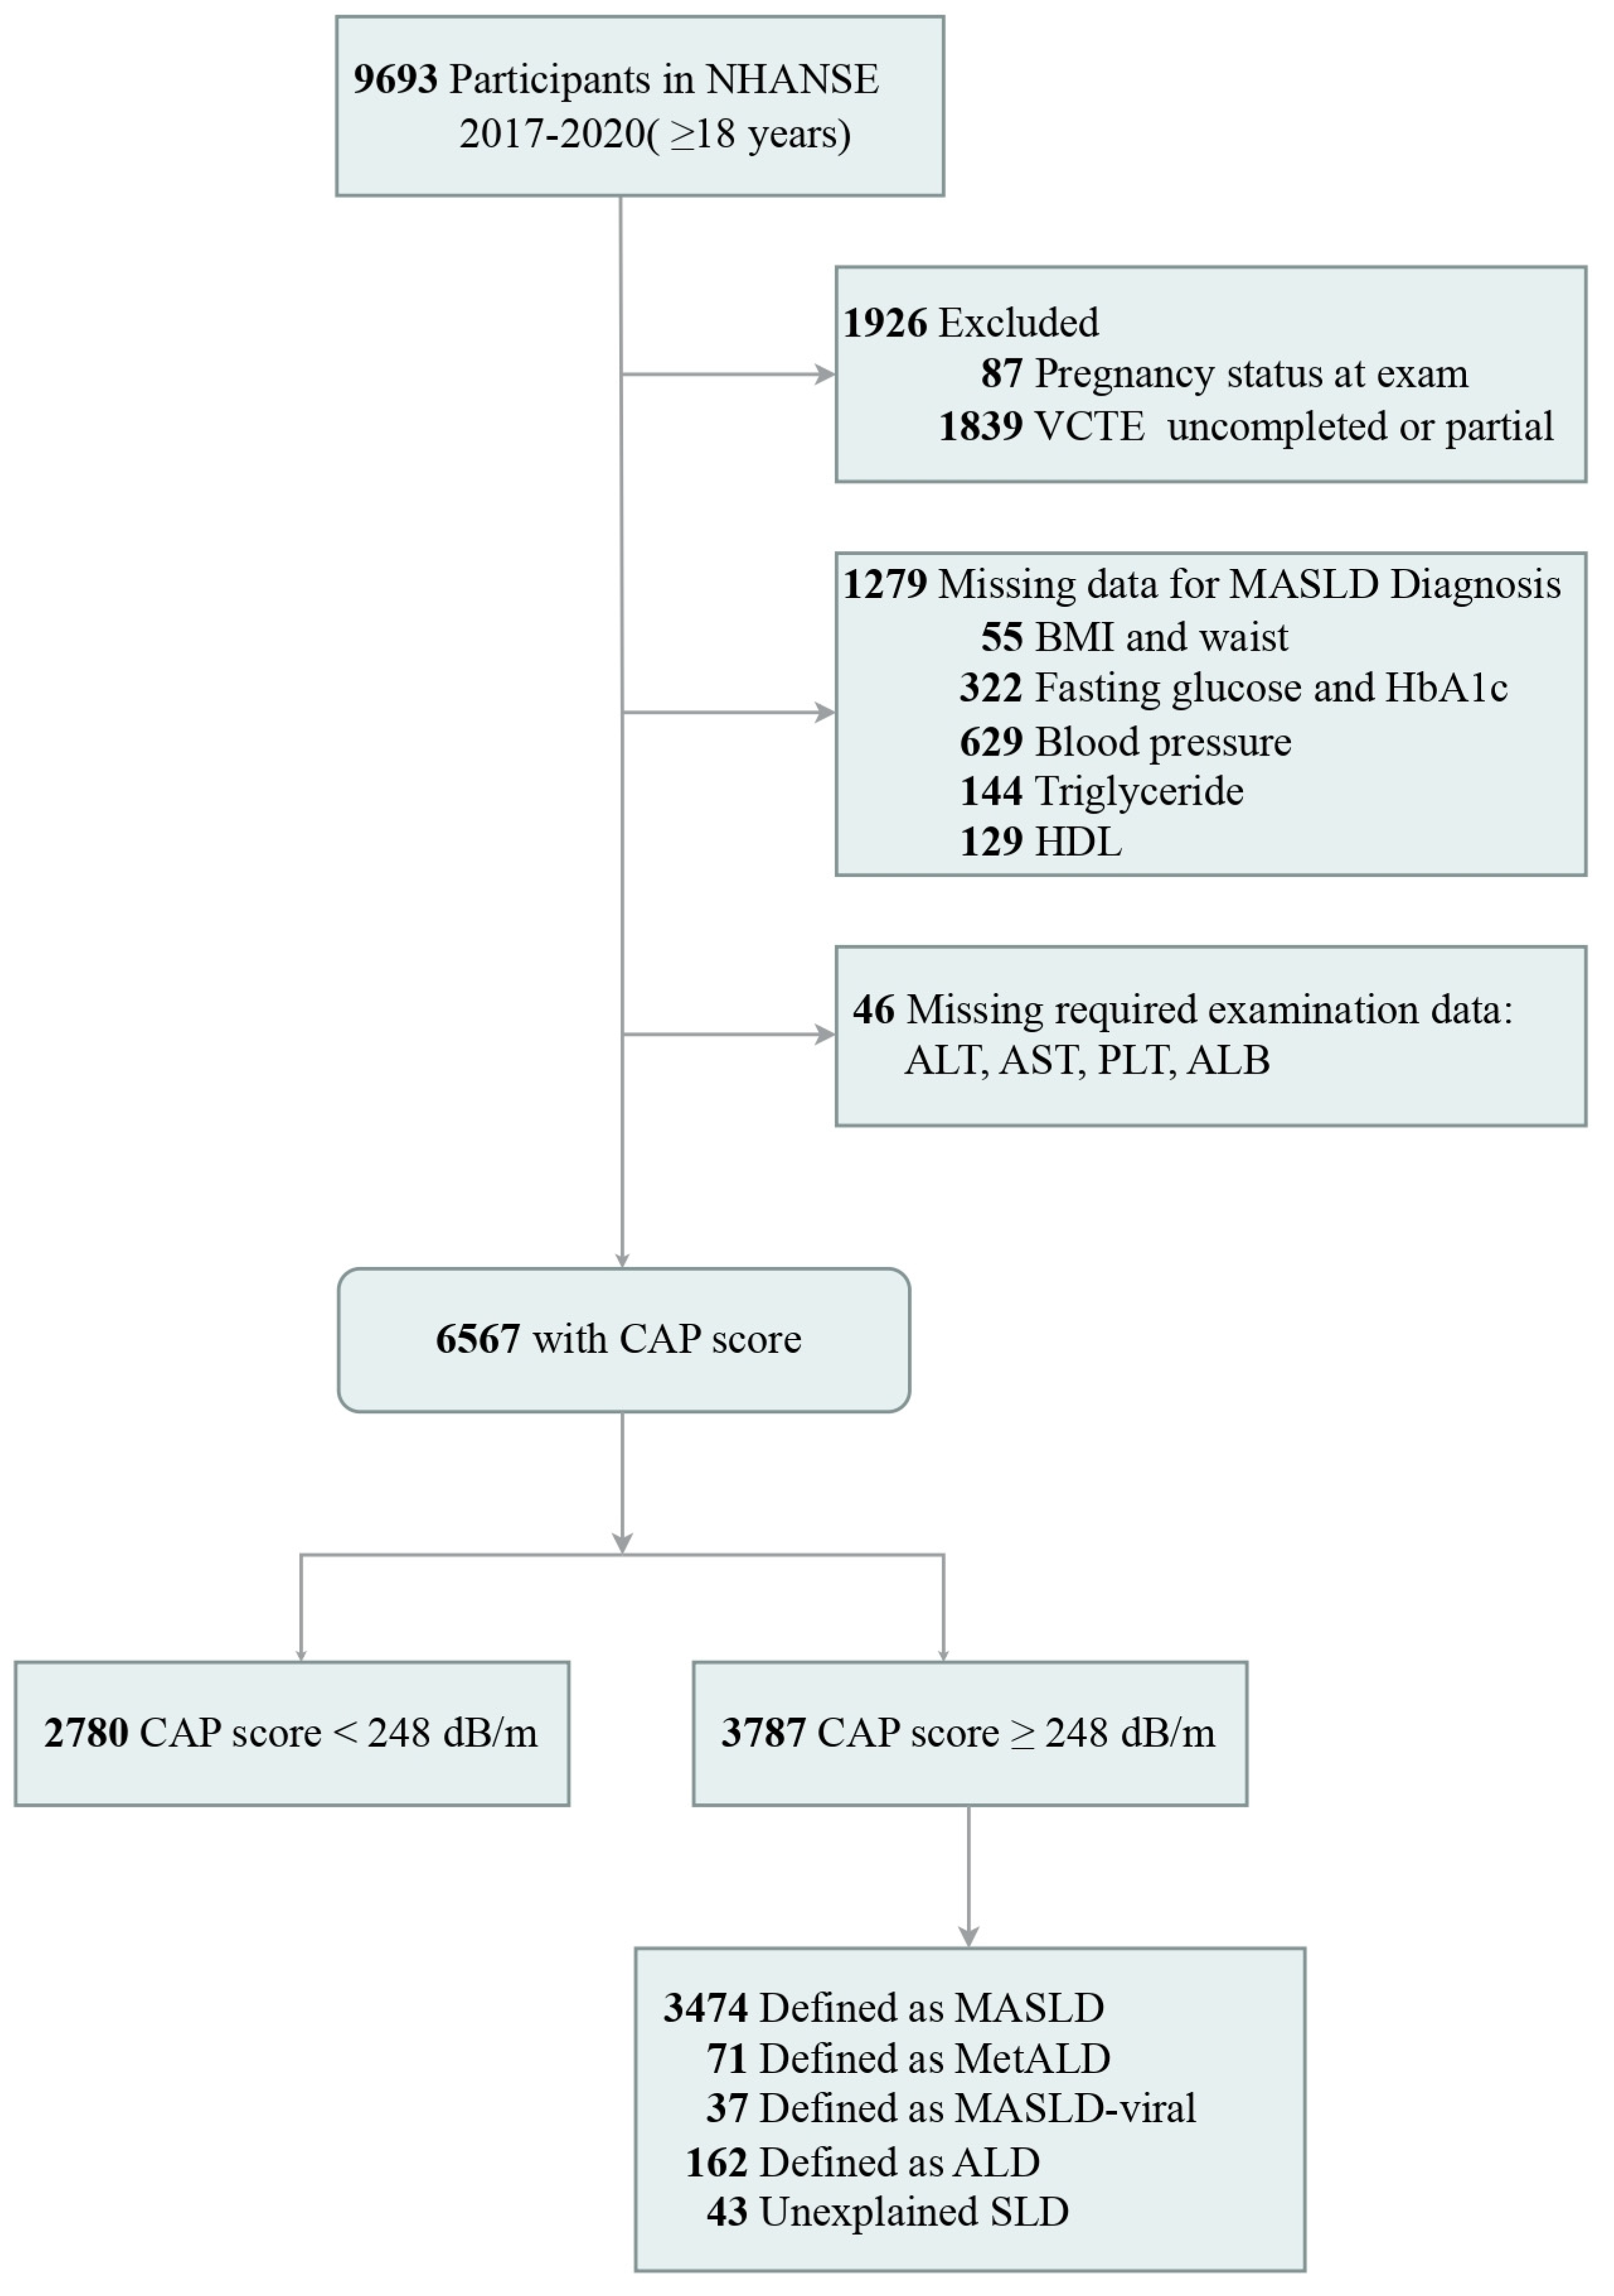
2.1. Study Design
2.2. Data Collection
2.3. Diagnostic Criteria of NAFLD and MASLD
2.4. Assessment of Chronic Kidney Disease
2.5. Statistical Analysis
3. Results
3.1. Baseline Characteristics of Participants
3.2. CKD Weighted Prevalence in MASLD with Combinations of Five Cardiometabolic Risk Factors
3.3. Association of MASLD and Cardiometabolic Risk Factors with CKD
3.4. The Effect of Insulin Resistance on the Relationship Between MASLD and CKD
3.5. Subgroup and Interaction Analysis
3.6. Association of Liver Fibrosis and CKD
4. Discussion
5. Conclusions
Supplementary Materials
Author Contributions
Funding
Institutional Review Board Statement
Informed Consent Statement
Data Availability Statement
Acknowledgments
Conflicts of Interest
Abbreviations
| NAFLD | Non-alcoholic fatty liver disease |
| CKD | Chronic kidney disease |
| MASLD | Metabolic dysfunction-associated steatotic liver disease |
| NHANES | National Health and Nutrition Examination Survey |
| NCHS | National Center for Health Statistics |
| BMI | Body mass index |
| HDL-C | Lipoprotein cholesterol |
| HbA1c | Hemoglobin a1c |
| CAP | Controlled attenuation parameter |
| HOMA-IR | Homeostasis model assessment-estimated insulin resistance |
| SLD | Steatotic liver disease |
| ALD | Alcoholic liver disease |
| MetALD | MASLD with increased alcohol consumption |
| CKD-EPI | Chronic Kidney Disease Epidemiology Collaboration |
| eGFR | Estimated glomerular filtration rate |
| KDIGO | Kidney Disease: Improving Global Outcomes |
| ACR | Albumin-to-creatinine ratio |
| LSM | Liver stiffness measurement |
| OR | Odds ratio |
| CI | Confidence interval |
| FLI | Fatty Liver Index |
| FIB-4 | Fibrosis-4 index |
References
- Li, J.; Zou, B.; Yeo, Y.H.; Feng, Y.; Xie, X.; Lee, D.H.; Fujii, H.; Wu, Y.; Kam, L.Y.; Ji, F.; et al. Prevalence, incidence, and outcome of non-alcoholic fatty liver disease in Asia, 1999–2019: A systematic review and meta-analysis. Lancet Gastroenterol. Hepatol. 2019, 4, 389–398. [Google Scholar]
- Angulo, P.; Kleiner, D.E.; Dam-Larsen, S.; Adams, L.A.; Bjornsson, E.S.; Charatcharoenwitthaya, P.; Mills, P.R.; Keach, J.C.; Lafferty, H.D.; Stahler, A.; et al. Liver Fibrosis, but No Other Histologic Features, Is Associated with Long-term Outcomes of Patients with Nonalcoholic Fatty Liver Disease. Gastroenterology 2015, 149, 389–397.e10. [Google Scholar] [CrossRef]
- Xiao, J.; Ng, C.H.; Chan, K.E.; Fu, C.; Tay, P.; Yong, J.N.; Lim, W.H.; Tan, D.J.H.; Syn, N.; Wong, Z.Y.; et al. Hepatic, Extra-hepatic Outcomes and Causes of Mortality in NAFLD—An Umbrella Overview of Systematic Review of Meta-Analysis. J. Clin. Exp. Hepatol. 2023, 13, 656–665. [Google Scholar]
- Boutari, C.; Athyros, V.G. The Association Between Liver Histology and Cardiovascular Risk: Time to Introduce Steatotic Liver Disease Screening in High-Risk Patient Groups? Angiology 2024, 75, 205–207. [Google Scholar]
- Younossi, Z.M.; Gramlich, T.; Matteoni, C.A.; Boparai, N.; McCullough, A.J. Nonalcoholic fatty liver disease in patients with type 2 diabetes. Clin. Gastroenterol. Hepatol. 2004, 2, 262–265. [Google Scholar] [CrossRef]
- Byrne, C.D.; Targher, G. NAFLD as a driver of chronic kidney disease. J. Hepatol. 2020, 72, 785–801. [Google Scholar]
- Gu, S.; Hu, S.; Wang, S.; Qi, C.; Shi, C.; Fan, G. Bidirectional association between NAFLD and gallstone disease: A systematic review and meta-analysis of observational studies. Expert. Rev. Gastroenterol. Hepatol. 2023, 17, 283–293. [Google Scholar]
- Prasad, G.V.R. Metabolic syndrome and chronic kidney disease: Current status and future directions. World J. Nephrol. 2014, 3, 210–219. [Google Scholar]
- Zou, Z.-Y.; Fan, J.-G. Incidence of chronic kidney disease in patients with non-alcoholic fatty liver disease. J. Hepatol. 2020, 73, 214–216. [Google Scholar]
- Kiapidou, S.; Liava, C.; Kalogirou, M.; Akriviadis, E.; Sinakos, E. Chronic kidney disease in patients with non-alcoholic fatty liver disease: What the Hepatologist should know? Ann. Hepatol. 2020, 19, 134–144. [Google Scholar]
- Mantovani, A.; Petracca, G.; Beatrice, G.; Csermely, A.; Lonardo, A.; Schattenberg, J.M.; Tilg, H.; Byrne, C.D.; Targher, G. Non-alcoholic fatty liver disease and risk of incident chronic kidney disease: An updated meta-analysis. Gut 2022, 71, 156–162. [Google Scholar]
- Bilson, J.; Hydes, T.J.; McDonnell, D.; Buchanan, R.M.; Scorletti, E.; Mantovani, A.; Targher, G.; Byrne, C.D. Impact of Metabolic Syndrome Traits on Kidney Disease Risk in Individuals with MASLD: A UK Biobank Study. Liver Int. 2024, 45, e16159. [Google Scholar] [CrossRef] [PubMed]
- Arase, Y.; Suzuki, F.; Kobayashi, M.; Suzuki, Y.; Kawamura, Y.; Matsumoto, N.; Akuta, N.; Kobayashi, M.; Sezaki, H.; Saito, S.; et al. The development of chronic kidney disease in Japanese patients with non-alcoholic fatty liver disease. Intern. Med. Tokyo Jpn. 2011, 50, 1081–1087. [Google Scholar] [CrossRef]
- Chang, Y.; Ryu, S.; Sung, E.; Woo, H.-Y.; Oh, E.; Cha, K.; Jung, E.; Kim, W.S. Nonalcoholic fatty liver disease predicts chronic kidney disease in nonhypertensive and nondiabetic Korean men. Metabolism 2008, 57, 569–576. [Google Scholar]
- Huh, J.H.; Kim, J.Y.; Choi, E.; Kim, J.S.; Chang, Y.; Sung, K.-C. The fatty liver index as a predictor of incident chronic kidney disease in a 10-year prospective cohort study. PLoS ONE 2017, 12, e0180951. [Google Scholar]
- Rinella, M.E.; Lazarus, J.V.; Ratziu, V.; Francque, S.M.; Sanyal, A.J.; Kanwal, F.; Romero, D.; Abdelmalek, M.F.; Anstee, Q.M.; Arab, J.P.; et al. A multi-society Delphi consensus statement on new fatty liver disease nomenclature. J. Hepatol. 2023, 79, 1542–1556. [Google Scholar]
- Yang, T.; Yin, J.; Li, J.; Wang, Q. The influence of different combinations of cardiometabolic risk factors on the prevalence of MASLD and risk of advanced fibrosis deserves attention. J. Hepatol. 2024, 80, e82–e85. [Google Scholar] [PubMed]
- NHANES Questionnaires, Datasets, and Related Documentation. Available online: https://wwwn.cdc.gov/nchs/nhanes/continuousnhanes/default.aspx?BeginYear=2017 (accessed on 3 February 2024).
- von Elm, E.; Altman, D.G.; Egger, M.; Pocock, S.J.; Gøtzsche, P.C.; Vandenbroucke, J.P. STROBE Initiative. Strengthening the Reporting of Observational Studies in Epidemiology (STROBE) statement: Guidelines for reporting observational studies. BMJ 2007, 335, 806–808. [Google Scholar]
- Ascaso, J.F.; Pardo, S.; Real, J.T.; Lorente, R.I.; Priego, A.; Carmena, R. Diagnosing insulin resistance by simple quantitative methods in subjects with normal glucose metabolism. Diabetes Care 2003, 26, 3320–3325. [Google Scholar] [CrossRef] [PubMed]
- Karlas, T.; Petroff, D.; Sasso, M.; Fan, J.-G.; Mi, Y.-Q.; de Lédinghen, V.; Kumar, M.; Lupsor-Platon, M.; Han, K.H.; Cardoso, A.C.; et al. Individual patient data meta-analysis of controlled attenuation parameter (CAP) technology for assessing steatosis. J. Hepatol. 2017, 66, 1022–1030. [Google Scholar]
- Levey, A.S.; Stevens, L.A.; Schmid, C.H.; Zhang, Y.L.; Castro, A.F.; Feldman, H.I.; Kusek, J.W.; Eggers, P.; Van Lente, F.; Greene, T.; et al. A new equation to estimate glomerular filtration rate. Ann. Intern. Med. 2009, 150, 604–612. [Google Scholar] [PubMed]
- Kidney Disease: Improving Global Outcomes (KDIGO) CKD Work Group. KDIGO 2024 Clinical Practice Guideline for the Evaluation and Management of Chronic Kidney Disease. Kidney Int. 2024, 105, S117–S314. [Google Scholar]
- Younossi, Z.M.; Tampi, R.; Priyadarshini, M.; Nader, F.; Younossi, I.M.; Racila, A. Burden of Illness and Economic Model for Patients with Nonalcoholic Steatohepatitis in the United States. Hepatol. Baltim. Md. 2019, 69, 564–572. [Google Scholar]
- Younossi, Z.M.; Golabi, P.; Paik, J.M.; Henry, A.; Van Dongen, C.; Henry, L. The global epidemiology of nonalcoholic fatty liver disease (NAFLD) and nonalcoholic steatohepatitis (NASH): A systematic review. Hepatol. Baltim. Md. 2023, 77, 1335–1347. [Google Scholar] [CrossRef] [PubMed]
- Ferguson, D.; Finck, B.N. Emerging therapeutic approaches for the treatment of NAFLD and type 2 diabetes mellitus. Nat. Rev. Endocrinol. 2021, 17, 484–495. [Google Scholar]
- Sirota, J.C.; McFann, K.; Targher, G.; Chonchol, M.; Jalal, D.I. Association between nonalcoholic liver disease and chronic kidney disease: An ultrasound analysis from NHANES 1988–1994. Am. J. Nephrol. 2012, 36, 466–471. [Google Scholar]
- Wilechansky, R.M.; Pedley, A.; Massaro, J.M.; Hoffmann, U.; Benjamin, E.J.; Long, M.T. Relations of liver fat with prevalent and incident chronic kidney disease in the Framingham Heart Study: A secondary analysis. Liver Int. 2019, 39, 1535–1544. [Google Scholar]
- Targher, G.; Chonchol, M.; Bertolini, L.; Rodella, S.; Zenari, L.; Lippi, G.; Franchini, M.; Zoppini, G.; Muggeo, M. Increased risk of CKD among type 2 diabetics with nonalcoholic fatty liver disease. J. Am. Soc. Nephrol. 2008, 19, 1564–1570. [Google Scholar]
- Yasui, K.; Sumida, Y.; Mori, Y.; Mitsuyoshi, H.; Minami, M.; Itoh, Y.; Kanemasa, K.; Matsubara, H.; Okanoue, T.; Yoshikawa, T. Nonalcoholic steatohepatitis and increased risk of chronic kidney disease. Metabolism 2011, 60, 735–739. [Google Scholar]
- Machado, M.V.; Gonçalves, S.; Carepa, F.; Coutinho, J.; Costa, A.; Cortez-Pinto, H. Impaired renal function in morbid obese patients with nonalcoholic fatty liver disease. Liver Int. 2012, 32, 241–248. [Google Scholar]
- Sun, D.-Q.; Jin, Y.; Wang, T.-Y.; Zheng, K.I.; Rios, R.S.; Zhang, H.-Y.; Targher, G.; Byrne, C.D.; Yuan, W.J.; Zheng, M.H. MAFLD and risk of CKD. Metabolism 2021, 115, 154433. [Google Scholar] [CrossRef]
- Mori, K.; Tanaka, M.; Sato, T.; Akiyama, Y.; Endo, K.; Ogawa, T.; Suzuki, T.; Aida, H.; Kawaharata, W.; Nakata, K.; et al. Metabolic dysfunction-associated steatotic liver disease (SLD) and alcohol-associated liver disease, but not SLD without metabolic dysfunction, are independently associated with new onset of chronic kidney disease during a 10-year follow-up period. Hepatol. Res. 2024, 55, 34–45. [Google Scholar] [CrossRef] [PubMed]
- Alberti, K.G.M.M.; Eckel, R.H.; Grundy, S.M.; Zimmet, P.Z.; Cleeman, J.I.; Donato, K.A.; Fruchart, J.C.; James, W.P.T.; Loria, C.M.; Smith, S.C., Jr. Harmonizing the metabolic syndrome: A joint interim statement of the International Diabetes Federation Task Force on Epidemiology and Prevention; National Heart, Lung, and Blood Institute; American Heart Association; World Heart Federation; International Atherosclerosis Society; and International Association for the Study of Obesity. Circulation 2009, 120, 1640–1645. [Google Scholar]
- Zhu, L.; Baker, S.S.; Gill, C.; Liu, W.; Alkhouri, R.; Baker, R.D.; Gill, S.R. Characterization of gut microbiomes in nonalcoholic steatohepatitis (NASH) patients: A connection between endogenous alcohol and NASH. Hepatol. Baltim. Md. 2013, 57, 601–609. [Google Scholar] [CrossRef]
- Briskey, D.; Tucker, P.; Johnson, D.W.; Coombes, J.S. The role of the gastrointestinal tract and microbiota on uremic toxins and chronic kidney disease development. Clin. Exp. Nephrol. 2017, 21, 7–15. [Google Scholar] [CrossRef]
- Malehmir, M.; Pfister, D.; Gallage, S.; Szydlowska, M.; Inverso, D.; Kotsiliti, E.; Leone, V.; Peiseler, M.; Surewaard, B.G.; Rath, D.; et al. Platelet GPIbα is a mediator and potential interventional target for NASH and subsequent liver cancer. Nat. Med. 2019, 25, 641–655. [Google Scholar] [CrossRef]
- Yang, K.; Du, C.; Wang, X.; Li, F.; Xu, Y.; Wang, S.; Chen, S.; Chen, F.; Shen, M.; Chen, M.; et al. Indoxyl sulfate induces platelet hyperactivity and contributes to chronic kidney disease-associated thrombosis in mice. Blood 2017, 129, 2667–2679. [Google Scholar] [CrossRef]
- Villarroel, C.; Karim, G.; Sehmbhi, M.; Debroff, J.; Dinani, A.; Weisberg, I. Advanced Fibrosis in Metabolic Dysfunction-Associated Steatotic Liver Disease Is Independently Associated with Reduced Renal Function. Gastro Hep Adv. 2024, 3, 122–127. [Google Scholar] [CrossRef]
- Gao, J.; Li, Y.; Zhang, Y.; Zhan, X.; Tian, X.; Li, J.; Wang, R.; He, Y.; Wang, A.; Wu, S. Severity and Remission of Metabolic Dysfunction-Associated Fatty/Steatotic Liver Disease With Chronic Kidney Disease Occurrence. J. Am. Heart Assoc. 2024, 13, e032604. [Google Scholar] [CrossRef]
- Rinella, M.E.; Neuschwander-Tetri, B.A.; Siddiqui, M.S.; Abdelmalek, M.F.; Caldwell, S.; Barb, D.; Kleiner, D.E.; Loomba, R. AASLD Practice Guidance on the clinical assessment and management of nonalcoholic fatty liver disease. Hepatology 2023, 77, 1797. [Google Scholar]


| Variables | Whole Cohort (n = 6567) | MASLD (n = 3474) | Non-MASLD (n = 3093) | p-Value b | NAFLD (n = 3333) | Non-NAFLD (n = 3234) | p-Value | |||||
|---|---|---|---|---|---|---|---|---|---|---|---|---|
| Demographics | ||||||||||||
| Age, y | 47.27 | ±17.41 | 50.71 | ±16.46 | 43.66 | ±17.66 | <0.001 | 50.76 | ±16.57 | 44.01 | ±17.56 | <0.001 |
| Sex | 0.002 | 0.007 | ||||||||||
| Male, % | 3298 | (50.07) | 1812 | (53.27) | 1486 | (46.71) | 1736 | (53.28) | 1562 | (47.07) | ||
| Female, % | 3269 | (49.93) | 1662 | (46.73) | 1607 | (53.29) | 1597 | (46.72) | 1672 | (52.93) | ||
| Five cardiometabolic risk factors | ||||||||||||
| Overweight or Obesity, % | 5342 | (81.61) | 3328 | (96.57) | 2014 | (65.88) | <0.001 | 3192 | (95.32) | 2150 | (68.76) | <0.001 |
| BMI, kg/m2 | 29.47 | ±6.89 | 32.72 | ±6.84 | 26.05 | ±5.05 | <0.001 | 32.70 | ±6.98 | 26.45 | ±5.26 | <0.001 |
| Waist circumference, cm | 99.92 | ±16.62 | 108.57 | ±14.88 | 90.85 | ±13.16 | <0.001 | 108.35 | ±15.26 | 92.06 | ±13.74 | <0.001 |
| Hypertension, % | 1968 | (24.50) | 1214 | (29.47) | 754 | (19.28) | <0.001 | 1165 | (29.47) | 803 | (19.85) | <0.001 |
| Diastolic blood pressure, mmHg | 73.83 | ±10.74 | 75.72 | ±10.61 | 71.84 | ±10.51 | <0.001 | 75.56 | ± 10.71 | 72.2 | ± 10.50 | <0.001 |
| Systolic blood pressure, mmHg | 121.52 | ±16.97 | 123.67 | ±16.70 | 119.26 | ±16.95 | <0.001 | 123.61 | ±16.80 | 119.57 | ±16.90 | <0.001 |
| Diabetes, % | 1016 | (11.48) | 803 | (18.39) | 213 | (4.22) | <0.001 | 764 | (19.01) | 252 | (44.35) | <0.001 |
| Hypertriglyceridemia, % | 1460 | (23.22) | 1091 | (33.94) | 369 | (11.97) | <0.001 | 1050 | (34.46) | 410 | (12.70) | <0.001 |
| Low HDL-C, % | 3241 | (48.59) | 2165 | (62.68) | 1076 | (33.79) | <0.001 | 2072 | (63.20) | 1169 | (34.91) | <0.001 |
| Lab panel | ||||||||||||
| Total cholesterol, mg/dL | 187.37 | ±40.53 | 189.99 | ±41.21 | 184.61 | ±39.62 | 0.001 | 189.41 | ±41.34 | 185.45 | ±39.66 | 0.03 |
| Triglycerides, mg/dL | 138.00 | (78.00, 162.00) | 164.00 | (95.00, 159.70) | 110.00 | (66.00, 129.00) | <0.001 | 165.00 | (94.00, 159.00) | 112.00 | (67.00, 132.00) | <0.001 |
| HDL-C, mg/dL | 53.62 | ±15.67 | 48.94 | ±13.33 | 58.53 | ±16.43 | <0.001 | 48.62 | ±12.90 | 58.3 | ±16.57 | <0.001 |
| HbA1c, % | 5.64 | ±0.94 | 5.88 | ±1.13 | 5.40 | ±0.59 | <0.001 | 5.89 | ±1.13 | 5.41 | ±0.62 | <0.001 |
| ALT, U/L | 23.00 | (13.00, 27.00) | 25.00 | (15.00, 31.00) | 20.00 | (12.00, 23.00) | <0.001 | 24.00 | (15.00, 30.00) | 21.00 | (13.00, 24.00) | <0.001 |
| AST, U/L | 21.00 | (16.00, 24.00) | 21.00 | (16.00, 24.00) | 21.00 | (16.00, 23.00) | 0.30 | 21.00 | (16.00, 24.00) | 22.00 | (16.00, 23.00) | 0.20 |
| ALP, U/L | 74.96 | ±24.30 | 77.79 | ±23.44 | 71.98 | ±24.83 | <0.001 | 78.14 | ±23.61 | 71.98 | ±24.57 | <0.001 |
| GGT, U/L | 29.00 | (14.00, 31.00) | 32.00 | (16.00, 35.00) | 25.00 | (12.00, 26.00) | <0.001 | 31.00 | (16.00, 34.00) | 26.00 | (12.00, 27.00) | <0.001 |
| Albumin, g/L | 41.23 | ±3.22 | 40.85 | ±3.17 | 41.64 | ±3.22 | <0.001 | 40.80 | ±3.18 | 41.64 | ±3.21 | <0.001 |
| Globulin, g/L | 29.83 | ±4.06 | 30.08 | ±4.00 | 29.56 | ±4.11 | 0.001 | 30.15 | ±4.00 | 29.53 | ±4.09 | 0.001 |
| Platelet, 109/L | 246.60 | ±62.40 | 250.05 | ±63.75 | 242.97 | ±60.74 | 0.03 | 249.99 | ±63.72 | 243.42 | ±60.97 | 0.05 |
| Total bilirubin, umol/L | 8.11 | (5.13, 10.26) | 7.98 | (5.13, 8.55) | 8.24 | (5.13, 10.26) | 0.20 | 7.95 | (5.13, 8.55) | 8.26 | (5.13, 10.26) | 0.20 |
| eGFR, mL/min/1.73 m2 | 93.86 | ±21.34 | 91.47 | ±21.36 | 96.38 | ±21.03 | <0.001 | 91.39 | ±21.55 | 96.17 | ±20.89 | <0.001 |
| Creatinine, mg/dL | 0.88 | ±0.34 | 0.88 | ±0.38 | 0.87 | ±0.28 | 0.02 | 0.89 | ±0.39 | 0.87 | ±0.28 | 0.04 |
| Urinary ACR, mg/g | 7.27 | (4.73, 13.81) | 7.78 | (5.00, 15.32) | 6.75 | (4.51, 12.19) | 0.002 | 7.84 | (5.00, 15.62) | 6.74 | (4.51, 12.18) | 0.003 |
| Noninvasive tests | ||||||||||||
| Steatosis | ||||||||||||
| CAP, dB/m | 263.77 | ±62.31 | 308.32 | ±40.74 | 216.93 | ±44.04 | <0.001 | 307.89 | ±40.99 | 222.45 | ±49.14 | <0.001 |
| CAP ≥ 248 dB/m, % | 3787 | (56.97) | 3474 | (100) | 313 | (11.75) | <0.001 | 3333 | (100) | 454 | (16.68) | <0.001 |
| Fibrosis | ||||||||||||
| LSM, kPa | 5.70 | (4.10, 6.10) | 6.30 | (4.30, 6.60) | 5.00 | (3.80, 5.60) | <0.001 | 6.40 | (4.30, 6.60) | 5.00 | (3.80, 5.60) | <0.001 |
| LSM ≥ 8 kPa, % | 660 | (9.08) | 498 | (13.89) | 162 | (4.03) | <0.001 | 476 | (14.24) | 184 | (4.27) | <0.001 |
| GFR category | ||||||||||||
| G1, % | 318 | (4.84) | 204 | (5.87) | 114 | (3.69) | <0.001 | 198 | (5.94) | 120 | (3.71) | <0.001 |
| G2, % | 281 | (4.29) | 180 | (5.18) | 101 | (3.26) | <0.001 | 175 | (5.25) | 106 | (3.27) | <0.001 |
| ≥G3, % | 352 | (5.36) | 225 | (6.47) | 127 | (4.11) | <0.001 | 219 | (6.57) | 133 | (4.10) | <0.001 |
| (n = 3280) c | (n = 1728) | (n = 1552) | (n = 1657) | (n = 1623) | ||||||||
| Insulin resistance, % | 1594 | (44.62) | 1184 | (63.63) | 410 | (24.26) | <0.001 | 1138 | (64.23) | 456 | (26.18) | <0.001 |
| HOMA-IR | 3.95 | (1.54, 4.61) | 5.53 | (2.38, 6.22) | 2.25 | (1.40, 2.76) | <0.001 | 5.56 | (2.39, 6.21) | 2.43 | (1.17, 2.88) | <0.001 |
| Subgroup | Overweight or Obesity | Low HDL-C | Hypertension | Diabetes | Hypertrigly-Ceridemia | CKD (n = 752) | Non-CKD (n = 2722) | MASLD Weighted Prevalence (95% CI) | |
|---|---|---|---|---|---|---|---|---|---|
| 1 | √ | √ | √ | √ | √ | 66 | 49 | 64.0% | (45.0–83.0%) |
| 2 | √ | √ | √ | 44 | 41 | 55.0% | (38.0–71.9%) | ||
| 3 | √ | √ | √ | √ | 60 | 65 | 48.2% | (34.6–61.8%) | |
| 4 | √ | √ | 2 | 5 | 45.1% | (12.9–77.4%) | |||
| 5 | √ | √ | √ | √ | 9 | 7 | 39.9% | (5.9–73.8%) | |
| 6 | √ | √ | √ | √ | 72 | 94 | 38.8% | (26.8–50.9%) | |
| 7 | √ | √ | 27 | 75 | 28.4% | (12.6–44.2%) | |||
| 8 | √ | √ | √ | 11 | 30 | 25.9% | (3.2–48.7%) | ||
| 9 | √ | √ | √ | 39 | 104 | 22.0% | (14.5–29.4%) | ||
| 10 | √ | √ | 73 | 220 | 18.8% | (13.7–23.9%) | |||
| 11 | √ | √ | √ | √ | 39 | 175 | 15.6% | (9.0–22.2%) | |
| 12 | √ | √ | 13 | 63 | 15.5% | (6.9–24.1%) | |||
| 13 | √ | √ | √ | 59 | 210 | 15.2% | (10.2–20.1%) | ||
| 14 | √ | √ | √ | 61 | 335 | 15.1% | (11.2–19.0%) | ||
| 15 | √ | √ | 74 | 586 | 9.7% | (6.5–13.0%) | |||
| 16 | √ | 70 | 527 | 8.9% | (5.5–12.3%) | ||||
| 17 a | √ | 7 | 17 | 15.4% | (0.0–30.7%) | ||||
| 18 | √ | √ | √ | 7 | 23 | 18.1% | (0.0–36.7%) | ||
| 19 | √ | 5 | 19 | 13.8% | (0.0–30.3%) | ||||
| 20 | √ | √ | 3 | 13 | 18.3% | (0.0–41.8%) | |||
| 21 | √ | √ | √ | 2 | 6 | 20.7% | (0.0–46.2%) | ||
| 22 | √ | √ | √ | 2 | 0 | 100.0% | — | ||
| 23 | √ | √ | 1 | 0 | 100.0% | — | |||
| 24 | √ | √ | √ | √ | 1 | 1 | 5.1% | (0.7–4.3%) | |
| 25 b | 5 | 28 | 11.5% | (0.0–23.7%) | |||||
| 26 | √ | √ | 0 | 13 | — | ||||
| 27 | √ | √ | √ | 0 | 5 | — | |||
| 28 | √ | 0 | 4 | — | |||||
| 29 | √ | 0 | 3 | — | |||||
| 30 | √ | √ | 0 | 3 | — | ||||
| 31 | √ | √ | √ | 0 | 1 | — | |||
| GFR Category ≥ G1 | GFR Category ≥ G3 | ||||||
|---|---|---|---|---|---|---|---|
| Model | Variables | OR (95% CI) | p-Value | OR (95% CI) | p-Value | ||
| Unadjusted model | |||||||
| No MASLD | Reference | Reference | |||||
| MASLD | 1.68 | (1.38–2.04) | <0.001 | 1.84 | (1.36–2.48) | 0.001 | |
| No Overweight or Obesity | Reference | Reference | |||||
| Overweight or Obesity | 1.82 | (1.36–2.44) | 0.001 | 3.12 | (2.15–4.53) | <0.001 | |
| No Hypertension | Reference | Reference | |||||
| Hypertension | 2.59 | (2.11–3.17) | <0.001 | 2.12 | (1.61–2.79) | <0.001 | |
| No Diabetes | Reference | Reference | |||||
| Diabetes | 5.37 | (4.53–6.35) | <0.001 | 3.68 | (2.87–4.72) | <0.001 | |
| No Low HDL-C | Reference | Reference | |||||
| Low HDL-C | 1.27 | (1.07–1.51) | 0.01 | 1.17 | (0.93–1.48) | 0.20 | |
| No Hypertriglyceridemia | Reference | Reference | |||||
| Hypertriglyceridemia | 1.64 | (1.30–1.06) | <0.001 | 1.67 | (1.31–2.15) | <0.001 | |
| Age, y | 1.05 | (1.05–1.06) | <0.001 | 1.12 | (1.10–1.14) | <0.001 | |
| Sex (Male = 1, Female = 2) | 1.29 | (1.05–1.60) | 0.03 | 1.26 | (1.06–1.50) | 0.02 | |
| Systolic blood pressure, mmHg | 1.03 | (1.02–1.03) | <0.001 | 1.03 | (1.02–1.04) | <0.001 | |
| Diastolic blood pressure, mmHg | 1.01 | (0.99–1.01) | 0.32 | 0.97 | (0.96–0.99) | 0.001 | |
| BMI, kg/m2 | 1.03 | (1.02–1.04) | <0.001 | 1.02 | (1.01–1.03) | 0.001 | |
| Waist circumference, cm | 1.02 | (1.01–1.03) | <0.001 | 1.02 | (1.02–1.03) | <0.001 | |
| HbA1c, % | 1.85 | (1.70–2.00) | <0.001 | 1.37 | (1.27–1.48) | <0.001 | |
| CAP, dB/m | 1.00 | (1.00–1.01) | <0.001 | 1.00 | (1.00–1.01) | 0.003 | |
| LSM, kPa | 1.04 | (1.02–1.06) | <0.001 | 1.02 | (1.01–1.03) | <0.001 | |
| Adjustment Model | MASLD | ||||||
| Age and sex | 1.32 | (1.07–1.61) | 0.01 | 1.34 | (0.99–1.82) | 0.06 | |
| Model 1 | 1.29 | (1.05–1.59) | 0.02 | 1.34 | (0.99–1.32) | 0.06 | |
| Model 2 | 1.30 | (1.02–1.65) | 0.04 | 1.22 | (0.88–1.70) | 0.22 | |
| Model 3 | 1.19 | (0.98–1.45) | 0.07 | 1.18 | (0.86–1.61) | 0.29 | |
| Model 4 | 1.15 | (0.93–1.42) | 0.20 | 1.15 | (0.84–1.58) | 0.37 | |
| Model 5 | 1.06 | (0.86–1.31) | 0.54 | 1.23 | (0.89–1.70) | 0.20 | |
| Model 6 | 1.32 | (1.03–1.69) | 0.03 | 1.01 | (0.72–1.43) | 0.94 | |
| Model 7 | 0.94 | (0.65–1.47) | 0.74 | 0.97 | (0.68–1.39) | 0.86 | |
| Model 8 | 0.87 | (0.46–1.63) | 0.64 | 0.85 | (0.40–1.82) | 0.65 | |
| Model | Variables | OR (95% CI) | p-Value | Adjusted-p | |
|---|---|---|---|---|---|
| Unadjusted model | |||||
| No Insulin resistance | Reference | ||||
| Insulin resistance | 2.12 | (1.74–2.58) | <0.001 | ||
| HOMA-IR | 1.06 | (1.02–1.09) | 0.002 | ||
| Adjustment Model | |||||
| Model 9 | No MASLD | Reference | |||
| MASLD | 1.00 | (0.73–1.38) | 0.98 | ||
| No Insulin resistance | Reference | ||||
| Insulin resistance | 1.91 | (1.48–2.46) | <0.001 | ||
| Model 9 + Insulin resistance × MASLD a | No MASLD | Reference | |||
| MASLD | 0.71 | (0.43–1.16) | 0.16 | ||
| No Insulin resistance | Reference | ||||
| Insulin resistance | 1.26 | (0.77–2.05) | 0.33 | ||
| MASLD × Insulin resistance | 2.02 | (1.05–3.89) | 0.04 | 0.09 b | |
Disclaimer/Publisher’s Note: The statements, opinions and data contained in all publications are solely those of the individual author(s) and contributor(s) and not of MDPI and/or the editor(s). MDPI and/or the editor(s) disclaim responsibility for any injury to people or property resulting from any ideas, methods, instructions or products referred to in the content. |
© 2025 by the authors. Licensee MDPI, Basel, Switzerland. This article is an open access article distributed under the terms and conditions of the Creative Commons Attribution (CC BY) license (https://creativecommons.org/licenses/by/4.0/).
Share and Cite
Yang, T.; Yang, B.; Yin, J.; Hou, C.; Wang, Q. Targeting Insulin Resistance and Liver Fibrosis: CKD Screening Priorities in MASLD. Biomedicines 2025, 13, 842. https://doi.org/10.3390/biomedicines13040842
Yang T, Yang B, Yin J, Hou C, Wang Q. Targeting Insulin Resistance and Liver Fibrosis: CKD Screening Priorities in MASLD. Biomedicines. 2025; 13(4):842. https://doi.org/10.3390/biomedicines13040842
Chicago/Turabian StyleYang, Tianyuan, Bingqing Yang, Jingya Yin, Chenxue Hou, and Qi Wang. 2025. "Targeting Insulin Resistance and Liver Fibrosis: CKD Screening Priorities in MASLD" Biomedicines 13, no. 4: 842. https://doi.org/10.3390/biomedicines13040842
APA StyleYang, T., Yang, B., Yin, J., Hou, C., & Wang, Q. (2025). Targeting Insulin Resistance and Liver Fibrosis: CKD Screening Priorities in MASLD. Biomedicines, 13(4), 842. https://doi.org/10.3390/biomedicines13040842