
The Relationship between Time, Race, and Estrogen Receptor Alpha in Estradiol-Induced Dermal Fibrosis

Abstract
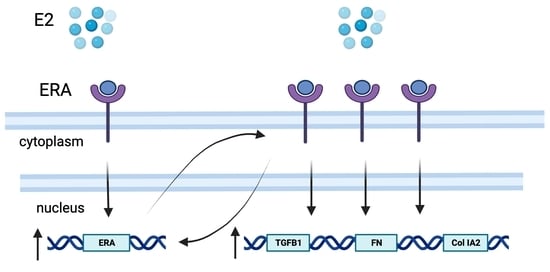
1. Introduction
2. Materials and Methods
2.1. Ex Vivo Human Skin Organ Culture Model
2.2. Measurement of Steady-State Transcript Levels Using Quantitative PCR
2.3. Statistical Analysis
3. Results
3.1. Demographics
3.2. Variability in Steady-State Proinflammatory and Profibrotic Transcript Levels in Vehicle- and Estradiol-Treated Dermal Tissue
3.3. Variability in Steady-State ERA Transcript Levels in Vehicle and Estradiol-Treated Dermal Tissue
3.4. Correlation between ERA Steady-State Transcript Levels and Race/Ethnicity and Donors’ Age in Estradiol-Treated Dermal Tissue
3.5. Correlations between Estradiol-Induced Profibrotic Mediators and Baseline ERA Steady-State Transcript Levels
3.6. Correlations between E2-Induced Profibrotic Mediators and E2-Induced ERA Steady-State Transcript Levels
3.7. Correlations between Estradiol-Induced Profibrotic Mediator Steady-State Transcript Levels
3.8. Correlations between Vehicle-Treated and Estradiol-Treated Profibrotic Mediator Steady-State Transcript Levels
4. Discussion
Author Contributions
Funding
Institutional Review Board Statement
Data Availability Statement
Acknowledgments
Conflicts of Interest
References
- Fuentes, N.; Silveyra, P. Estrogen receptor signaling mechanisms. Adv. Protein Chem. Struct. Biol. 2019, 116, 135–170. [Google Scholar] [CrossRef]
- Soldano, S.; Montagna, P.; Brizzolara, R.; Sulli, A.; Parodi, A.; Seriolo, B.; Paolino, S.; Villaggio, B.; Cutolo, M. Effects of estrogens on extracellular matrix synthesis in cultures of human normal and scleroderma skin fibroblasts. Ann. N. Y. Acad. Sci. 2010, 1193, 25–29. [Google Scholar] [CrossRef]
- Aida-Yasuoka, K.; Peoples, C.; Yasuoka, H.; Hershberger, P.; Thiel, K.; Cauley, J.A.; Medsger, T.A., Jr.; Feghali-Bostwick, C.A. Estradiol promotes the development of a fibrotic phenotype and is increased in the serum of patients with systemic sclerosis. Arthritis Res. Ther. 2013, 15, R10. [Google Scholar] [CrossRef]
- Baker Frost, D.; Savchenko, A.; Ogunleye, A.; Armstrong, M.; Feghali-Bostwick, C. Elucidating the cellular mechanism for E2-induced dermal fibrosis. Arthritis Res. Ther. 2021, 23, 68. [Google Scholar] [CrossRef]
- Rzepecki, A.K.; Murase, J.E.; Juran, R.; Fabi, S.G.; McLellan, B.N. Estrogen-deficient skin: The role of topical therapy. Int. J. Womens Dermatol. 2019, 5, 85–90. [Google Scholar] [CrossRef]
- Son, E.D.; Lee, J.Y.; Lee, S.; Kim, M.S.; Lee, B.G.; Chang, I.S.; Chung, J.H. Topical application of 17β-estradiol increases extracellular matrix protein synthesis by stimulating tgf-Beta signaling in aged human skin in vivo. J. Investig. Dermatol. 2005, 124, 1149–1161. [Google Scholar] [CrossRef]
- Che, Q.; Liu, B.Y.; Liao, Y.; Zhang, H.J.; Yang, T.T.; He, Y.Y.; Xia, Y.H.; Lu, W.; He, X.Y.; Chen, Z.; et al. Activation of a positive feedback loop involving IL-6 and aromatase promotes intratumoral 17β-estradiol biosynthesis in endometrial carcinoma microenvironment. Int. J. Cancer 2014, 135, 282–294. [Google Scholar] [CrossRef]
- Lichtman, M.K.; Otero-Vinas, M.; Falanga, V. Transforming growth factor beta (TGF-β) isoforms in wound healing and fibrosis. Wound Repair Regen. Off. Publ. Wound Heal. Soc. Eur. Tissue Repair Soc. 2016, 24, 215–222. [Google Scholar] [CrossRef]
- Johnson, B.Z.; Stevenson, A.W.; Prêle, C.M.; Fear, M.W.; Wood, F.M. The Role of IL-6 in Skin Fibrosis and Cutaneous Wound Healing. Biomedicines 2020, 8, 101. [Google Scholar] [CrossRef]
- Zhou, L.; Zhang, X.; Paus, R.; Lu, Z. The renaissance of human skin organ culture: A critical reappraisal. Differentiation 2018, 104, 22–35. [Google Scholar] [CrossRef]
- Garrett, S.M.; Zhao, Q.; Feghali-Bostwick, C. Induction of a Th17 Phenotype in Human Skin-A Mimic of Dermal Inflammatory Diseases. Methods Protoc. 2019, 2, 45. [Google Scholar] [CrossRef]
- Moniz, T.; Costa Lima, S.A.; Reis, S. Human skin models: From healthy to disease-mimetic systems; characteristics and applications. Br. J. Pharmacol. 2020, 177, 4314–4329. [Google Scholar] [CrossRef]
- Mouawad, J.E.; Heywood, J.; Armstrong, M.B.; Ogunleye, A.; Feghali-Bostwick, C. Low Baseline Expression of Fibrotic Genes in an Ex Vivo Human Skin Model is a Potential Indicator of Excessive Skin Scarring. Plast. Reconstr. Surg. Glob. Open 2022, 10, e4626. [Google Scholar] [CrossRef]
- Simpson, E.R. Sources of estrogen and their importance. J. Steroid Biochem. Mol. Biol. 2003, 86, 225–230. [Google Scholar] [CrossRef]
- Hall, G.; Phillips, T.J. Estrogen and skin: The effects of estrogen. menopause, and hormone replacement therapy on the skin. J. Am. Acad. Dermatol. 2005, 53, 555–568, quiz 569–572. [Google Scholar] [CrossRef]
- Wolff, E.; Pal, L.; Altun, T.; Madankumar, R.; Freeman, R.; Amin, H.; Harman, M.; Santoro, N.; Taylor, H.S. Skin wrinkles and rigidity in early postmenopausal women vary by race/ethnicity: Baseline characteristics of the skin ancillary study of the KEEPS trial. Fertil. Steril. 2011, 95, 658–662.e3. [Google Scholar] [CrossRef]
- Owen, C.M.; Pal, L.; Mumford, S.L.; Freeman, R.; Isaac, B.; McDonald, L.; Santoro, N.; Taylor, H.S.; Wolff, E.F. Effects of hormones on skin wrinkles and rigidity vary by race/ethnicity: Four-year follow-up from the ancillary skin study of the Kronos Early Estrogen Prevention Study. Fertil. Steril. 2016, 106, 1170–1175.e3. [Google Scholar] [CrossRef]
- Vrtacnik, P.; Ostanek, B.; Mencej-Bedrac, S.; Marc, J. The many faces of estrogen signaling. Biochem. Medica 2014, 24, 329–342. [Google Scholar] [CrossRef]
- Haczynski, J.; Tarkowski, R.; Jarzabek, K.; Slomczynska, M.; Wolczynski, S.; Magoffin, D.A.; Jakowicki, J.A.; Jakimiuk, A.J. Human cultured skin fibroblasts express estrogen receptor alpha and beta. Int. J. Mol. Med. 2002, 10, 149–153. [Google Scholar]
- Markiewicz, M.; Znoyko, S.; Stawski, L.; Ghatnekar, A.; Gilkeson, G.; Trojanowska, M. A role for estrogen receptor-alpha and estrogen receptor-beta in collagen biosynthesis in mouse skin. J. Investig. Dermatol. 2013, 133, 120–127. [Google Scholar] [CrossRef]
- Piperigkou, Z.; Karamanos, N.K. Estrogen receptor-mediated targeting of the extracellular matrix network in cancer. Semin. Cancer Biol. 2020, 62, 116–124. [Google Scholar] [CrossRef]
- Osborne, C.K.; Wakeling, A.; Nicholson, R.I. Fulvestrant: An oestrogen receptor antagonist with a novel mechanism of action. Br. J. Cancer 2004, 90 (Suppl. 1), S2–S6. [Google Scholar] [CrossRef]
- Yasuoka, H.; Larregina, A.T.; Yamaguchi, Y.; Feghali-Bostwick, C.A. Human skin culture as an ex vivo model for assessing the fibrotic effects of insulin-like growth factor binding proteins. Open Rheumatol. J. 2008, 2, 17–22. [Google Scholar] [CrossRef]
- Yamaguchi, Y.; Takihara, T.; Chambers, R.A.; Veraldi, K.L.; Larregina, A.T.; Feghali-Bostwick, C.A. A peptide derived from endostatin ameliorates organ fibrosis. Sci. Transl. Med. 2012, 4, 136ra71. [Google Scholar] [CrossRef]
- Nakagawa, S.; Schielzeth, H. A general and simple method for obtaining R2 from generalized linear mixed-effects models. Methods Ecol. Evol. 2013, 4, 133–142. [Google Scholar] [CrossRef]
- Li, M.; Li, X.; Liu, B.; Lv, L.; Wang, W.; Gao, D.; Zhang, Q.; Jiang, J.; Chai, M.; Yun, Z.; et al. Time-Resolved Extracellular Matrix Atlas of the Developing Human Skin Dermis. Front. Cell Dev. Biol. 2021, 9, 783456. [Google Scholar] [CrossRef]
- Ruiz, X.D.; Mlakar, L.R.; Yamaguchi, Y.; Su, Y.; Larregina, A.T.; Pilewski, J.M.; Feghali-Bostwick, C.A. Syndecan-2 is a novel target of insulin-like growth factor binding protein-3 and is over-expressed in fibrosis. PLoS ONE 2012, 7, e43049. [Google Scholar] [CrossRef]
- Watanabe, T.; Nishimoto, T.; Mlakar, L.; Heywood, J.; Malaab, M.; Hoffman, S.; Feghali-Bostwick, C. Optimization of a murine and human tissue model to recapitulate dermal and pulmonary features of systemic sclerosis. PLoS ONE 2017, 12, e0179917. [Google Scholar] [CrossRef]
- Watanabe, T.; Baker Frost, D.A.; Mlakar, L.; Heywood, J.; da Silveira, W.A.; Hardiman, G.; Feghali-Bostwick, C. A Human Skin Model Recapitulates Systemic Sclerosis Dermal Fibrosis and Identifies COL22A1 as a TGFbeta Early Response Gene that Mediates Fibroblast to Myofibroblast Transition. Genes 2019, 10, 75. [Google Scholar] [CrossRef]
- Juhl, P.; Bondesen, S.; Hawkins, C.L.; Karsdal, M.A.; Bay-Jensen, A.C.; Davies, M.J.; Siebuhr, A.S. Dermal fibroblasts have different extracellular matrix profiles induced by TGF-β. PDGF and IL-6 in a model for skin fibrosis. Sci. Rep. 2020, 10, 17300. [Google Scholar] [CrossRef]
- Ihionkhan, C.E.; Chambliss, K.L.; Gibson, L.L.; Hahner, L.D.; Mendelsohn, M.E.; Shaul, P.W. Estrogen causes dynamic alterations in endothelial estrogen receptor expression. Circ. Res. 2002, 91, 814–820. [Google Scholar] [CrossRef]
- Park, Y.M.; Erickson, C.; Bessesen, D.; Van Pelt, R.E.; Cox-York, K. Age- and menopause-related differences in subcutaneous adipose tissue estrogen receptor mRNA expression. Steroids 2017, 121, 17–21. [Google Scholar] [CrossRef]
- Fuermetz, A.; Schoenfeld, M.; Ennemoser, S.; Muetzel, E.; Jeschke, U.; Jundt, K. Change of steroid receptor expression in the posterior vaginal wall after local estrogen therapy. Eur. J. Obs. Gynecol. Reprod. Biol. 2015, 187, 45–50. [Google Scholar] [CrossRef]
- Goedecke, J.H.; Tootla, M.; Keswell, D. Ethnic differences in regional adipose tissue oestrogen receptor gene expression. Endocr. Connect. 2019, 8, 32–38. [Google Scholar] [CrossRef]
- Walker, J.M.; Garcet, S.; Aleman, J.O.; Mason, C.E.; Danko, D.; Butler, D.; Zuffa, S.; Swann, J.R.; Krueger, J.; Breslow, J.L.; et al. Obesity and ethnicity alter gene expression in skin. Sci. Rep. 2020, 10, 14079. [Google Scholar] [CrossRef]
- Al-Hendy, A.; Salama, S.A. Ethnic distribution of estrogen receptor-alpha polymorphism is associated with a higher prevalence of uterine leiomyomas in black Americans. Fertil. Steril. 2006, 86, 686–693. [Google Scholar] [CrossRef]
- Gallagher, C.J.; Keene, K.L.; Mychaleckyj, J.C.; Langefeld, C.D.; Hirschhorn, J.N.; Henderson, B.E.; Gordon, C.J.; Freedman, B.I.; Rich, S.S.; Bowden, D.W.; et al. Investigation of the estrogen receptor-alpha gene with type 2 diabetes and/or nephropathy in African-American and European-American populations. Diabetes 2007, 56, 675–684. [Google Scholar] [CrossRef][Green Version]
- Gallagher, C.J.; Langefeld, C.D.; Gordon, C.J.; Campbell, J.K.; Mychaleckyj, J.C.; Bryer-Ash, M.; Rich, S.S.; Bowden, D.W.; Sale, M.M. Association of the estrogen receptor-alpha gene with the metabolic syndrome and its component traits in African-American families: The Insulin Resistance Atherosclerosis Family Study. Diabetes 2007, 56, 2135–2141. [Google Scholar] [CrossRef]
- Gilliver, S.C.; Emmerson, E.; Campbell, L.; Chambon, P.; Hardman, M.J.; Ashcroft, G.S. 17beta-estradiol inhibits wound healing in male mice via estrogen receptor-alpha. Am. J. Pathol. 2010, 176, 2707–2721. [Google Scholar] [CrossRef]
- Moverare, S.; Lindberg, M.K.; Faergemann, J.; Gustafsson, J.A.; Ohlsson, C. Estrogen receptor alpha. but not estrogen receptor beta, is involved in the regulation of the hair follicle cycling as well as the thickness of epidermis in male mice. J. Investig. Dermatol. 2002, 119, 1053–1058. [Google Scholar] [CrossRef]
- Elliot, S.; Periera-Simon, S.; Xia, X.; Catanuto, P.; Rubio, G.; Shahzeidi, S.; El Salem, F.; Shapiro, J.; Briegel, K.; Korach, K.S.; et al. MicroRNA let-7 Downregulates Ligand-Independent Estrogen Receptor-mediated Male-Predominant Pulmonary Fibrosis. Am. J. Respir. Crit. Care Med. 2019, 200, 1246–1257. [Google Scholar] [CrossRef] [PubMed]
- Parker, M.W.; Rossi, D.; Peterson, M.; Smith, K.; Sikström, K.; White, E.S.; Connett, J.E.; Henke, C.A.; Larsson, O.; Bitterman, P.B. Fibrotic extracellular matrix activates a profibrotic positive feedback loop. J. Clin. Investig. 2014, 124, 1622–1635. [Google Scholar] [CrossRef]
- Lephart, E.D.; Naftolin, F. Menopause and the Skin: Old Favorites and New Innovations in Cosmeceuticals for Estrogen-Deficient Skin. Dermatol. Ther. 2021, 11, 53–69. [Google Scholar] [CrossRef]


| Donor Characteristics | All | AA | Caucasian | Hispanic | Cambodian |
|---|---|---|---|---|---|
| Race/Ethnicity, n (%) | 34 (100) | 9 (26.5) | 23 (67.7) | 1 (2.9) | 1 (2.9) |
| Age, mean (SD) + | 44.8 (10.1) | 46.0 (8.05) | 44.2 (11.2) | 47 * | 41 * |
| Sex, Female, n (%) | 33 (97.1) | 9 (100) | 22 (95.7) | 1 (100) | 1 (100) |
| Time (h) | TGFB1 | TGFB2 | Col IA2 | FN | IL-6 | Col IIIA1 | ERA |
|---|---|---|---|---|---|---|---|
| 24 | 0.09029 (0.05) | 0.0006016 (0.0006) | 0.002437 (0.004) | 0.0008681 (0.0007) | 0.01541 (0.02) | 0.01746 (0.02) | 0.0001013 (0.0001) |
| 48 | 0.05296 (0.05) | 0.0004174 (0.0005) | 0.002102 (0.003) | 0.001085 (0.001) | 0.01116 (0.02) | 0.02533 (0.03) | 0.00005607 (0.00005) |
| 72 | 0.08273 (0.08) | 0.0004377 (0.0008) | 0.002385 (0.004) | 0.001063 (0.001) | 0.02205 (0.04) | 0.01289 (0.01) | 0.00006435 (0.0001) |
| Time (h) | TGFB1 | TGFB2 | Col IA2 | FN | IL-6 | Col IIIA1 | ERA |
|---|---|---|---|---|---|---|---|
| 24 | 1.098 (0.4) | 0.9472 (0.6) | 0.7869 (0.4) | 0.8938 (0.6) | 1.061 (1.2) | 0.8973 (0.4) | 0.764 (1.0) |
| 48 | 1.247 (0.7) | 1.078 (0.8) | 1.269 (0.9) | 1.079 (0.7) | 1.207 (1.1) | 1.081 (0.7) | 1.51 (1.4) |
| 72 | 1.134 (0.7) | 0.9632 (0.6) | 1.087 (0.8) | 0.9078 (0.9) | 1.2 (0.9) | 1.053 (0.8) | 0.8473 (0.9) |
| TGFB1 | TGFB2 | IL-6 | Col IA2 | Col IIIA1 | ERA | Baseline ERA | |
|---|---|---|---|---|---|---|---|
| FN | 0.55 | 0.273 | 0.280 | 0.678 | 0.499 | 0.347 | 0.305 |
| p | <0.001 | 0.006 | 0.004 | <0.001 | <0.001 | <0.001 | 0.003 |
| adj p | <0.001 | 0.168 | 0.125 | <0.001 | <0.001 | 0.011 | 0.094 |
| TGFB1 | 0.29 | 0.084 | 0.471 | 0.175 | 0.315 | 0.155 | |
| p | 0.003 | 0.399 | <0.001 | 0.076 | 0.001 | 0.144 | |
| adj p | 0.096 | 1 | <0.001 | 1 | 0.037 | 1 | |
| TGFB2 | 0.151 | 0.278 | 0.017 | 0.257 | 0.015 | ||
| p | 0.128 | 0.004 | 0.865 | 0.009 | 0.889 | ||
| adj p | 1 | 0.105 | 1 | 0.252 | 1.000 | ||
| IL-6 | 0.205 | 0.031 | 0.035 | 0.151 | |||
| p | 0.033 | 0.752 | 0.726 | 0.155 | |||
| adj p | 0.929 | 1 | 1 | 1 | |||
| Col IA2 | 0.439 | 0.382 | 0.127 | ||||
| p | <0.001 | <0.001 | 0.201 | ||||
| adj p | <0.001 | 0.003 | 1.000 | ||||
| Col IIIA1 | 0.073 | 0.074 | |||||
| p | 0.462 | 0.468 | |||||
| adj p | 1 | 1 | |||||
| ERA | −0.457 | ||||||
| p | <0001 | ||||||
| adj p | <0.001 |
| Genes | Correlation (r) | p-Value |
|---|---|---|
| FN | 0.219 | 0.045 |
| TGFB1 | 0.279 | 0.011 |
| TGFB2 | 0.163 | 0.135 |
| IL-6 | 0.250 | 0.021 |
| Col IA2 | 0.189 | 0.058 |
| Col IIIA1 | 0.208 | 0.043 |
Disclaimer/Publisher’s Note: The statements, opinions and data contained in all publications are solely those of the individual author(s) and contributor(s) and not of MDPI and/or the editor(s). MDPI and/or the editor(s) disclaim responsibility for any injury to people or property resulting from any ideas, methods, instructions or products referred to in the content. |
© 2024 by the authors. Licensee MDPI, Basel, Switzerland. This article is an open access article distributed under the terms and conditions of the Creative Commons Attribution (CC BY) license (https://creativecommons.org/licenses/by/4.0/).
Share and Cite
Baker Frost, D.; Savchenko, A.; Feghali-Bostwick, C.; Wolf, B. The Relationship between Time, Race, and Estrogen Receptor Alpha in Estradiol-Induced Dermal Fibrosis. Biomedicines 2024, 12, 182. https://doi.org/10.3390/biomedicines12010182
Baker Frost D, Savchenko A, Feghali-Bostwick C, Wolf B. The Relationship between Time, Race, and Estrogen Receptor Alpha in Estradiol-Induced Dermal Fibrosis. Biomedicines. 2024; 12(1):182. https://doi.org/10.3390/biomedicines12010182
Chicago/Turabian StyleBaker Frost, DeAnna, Alisa Savchenko, Carol Feghali-Bostwick, and Bethany Wolf. 2024. "The Relationship between Time, Race, and Estrogen Receptor Alpha in Estradiol-Induced Dermal Fibrosis" Biomedicines 12, no. 1: 182. https://doi.org/10.3390/biomedicines12010182
APA StyleBaker Frost, D., Savchenko, A., Feghali-Bostwick, C., & Wolf, B. (2024). The Relationship between Time, Race, and Estrogen Receptor Alpha in Estradiol-Induced Dermal Fibrosis. Biomedicines, 12(1), 182. https://doi.org/10.3390/biomedicines12010182