

The Current State of Adult Glial Tumor Patients’ Care in Kazakhstan: Challenges in Diagnosis and Patterns in Survival Outcomes

 , ,
, ,
Abstract
1. Introduction
2. Materials and Methods
2.1. Study Design and Population
2.2. Covariates
2.3. Statistical Analysis
3. Results
4. Discussion
5. Conclusions
Author Contributions
Funding
Institutional Review Board Statement
Informed Consent Statement
Data Availability Statement
Conflicts of Interest
References
- Brain Tumor—Statistics. Available online: https://www.cancer.net/cancer-types/brain-tumor/statistics (accessed on 13 September 2022).
- Buckner, J.C. Factors Influencing Survival in High-Grade Gliomas. Semin. Oncol. 2003, 30, 10–14. [Google Scholar] [CrossRef] [PubMed]
- Miller, K.D.; Ostrom, Q.T.; Kruchko, C.; Patil, N.; Tihan, T.; Cioffi, G.; Fuchs, H.E.; Waite, K.A.; Jemal, A.; Siegel, R.L.; et al. Brain and Other Central Nervous System Tumor Statistics, 2021. CA Cancer J. Clin. 2021, 71, 381–406. [Google Scholar] [CrossRef]
- Igissinov, N.; Akshulakov, S.; Igissinov, S.; Moore, M.; Adilbekov, Y.; Gaitova, K.; Kissaev, Y.; Mustafina, M. Malignant Tumours of the Central Nervous System in Kazakhstan—Incidence Trends from 2004–2011. Asian Pac. J. Cancer Prev. APJCP 2013, 14, 4181–4186. [Google Scholar] [CrossRef]
- Hong, J.B.; Roh, T.H.; Ahn, S.S.; Kim, J.Y.; Kang, S.-G.; Chang, J.H.; Kim, S.H. Predicting Survival Using the 2016 World Health Organization Classification for Anaplastic Glioma. Clin. Neuropathol. 2020, 39, 188–195. [Google Scholar] [CrossRef] [PubMed]
- Garton, A.L.A.; Kinslow, C.J.; Rae, A.I.; Mehta, A.; Pannullo, S.C.; Magge, R.S.; Ramakrishna, R.; McKhann, G.M.; Sisti, M.B.; Bruce, J.N.; et al. Extent of Resection, Molecular Signature, and Survival in 1p19q-Codeleted Gliomas. J. Neurosurg. 2020, 134, 1357–1367. [Google Scholar] [CrossRef]
- Omuro, A.; DeAngelis, L.M. Glioblastoma and Other Malignant Gliomas: A Clinical Review. JAMA 2013, 310, 1842–1850. [Google Scholar] [CrossRef]
- Yang, P.; Wang, Y.; Peng, X.; You, G.; Zhang, W.; Yan, W.; Bao, Z.; Wang, Y.; Qiu, X.; Jiang, T. Management and Survival Rates in Patients with Glioma in China (2004–2010): A Retrospective Study from a Single-Institution. J. Neurooncol. 2013, 113, 259–266. [Google Scholar] [CrossRef]
- Tseng, J.-H.; Merchant, E.; Tseng, M.-Y. Effects of Socioeconomic and Geographic Variations on Survival for Adult Glioma in England and Wales. Surg. Neurol. 2006, 66, 258–263. [Google Scholar] [CrossRef]
- Kim, S.U.; Ahn, S.; Lee, J.E.; Han, K.D.; Park, S.H.; Yang, S.H. Epidemiological Study of Malignant Gliomas in Korea Using Nationwide Dataset from 2007 to 2017. J. Korean Med. Sci. 2021, 36, e68. [Google Scholar] [CrossRef]
- Mathiesen, T.; Peredo, I.; Lönn, S. Two-Year Survival of Low-Grade and High-Grade Glioma Patients Using Data from the Swedish Cancer Registry. Acta Neurochir. 2011, 153, 467–471. [Google Scholar] [CrossRef]
- Akshulakov, S.; Igissinov, N.; Aldiyarova, N.; Akhmetzhanova, Z.; Ryskeldiyev, N.; Auezova, R.; Zhukov, Y. One-Year Survival Rate of Patients with Primary Malignant Central Nervous System Tumors after Surgery in Kazakhstan. Asian Pac. J. Cancer Prev. APJCP 2014, 15, 6973–6976. [Google Scholar] [CrossRef] [PubMed]
- Louis, D.N.; Ohgaki, H.; Wiestler, O.D.; Cavenee, W.K.; Burger, P.C.; Jouvet, A.; Scheithauer, B.W.; Kleihues, P. The 2007 WHO Classification of Tumours of the Central Nervous System. Acta Neuropathol. 2007, 114, 97–109. [Google Scholar] [CrossRef] [PubMed]
- Louis, D.N.; Perry, A.; Reifenberger, G.; von Deimling, A.; Figarella-Branger, D.; Cavenee, W.K.; Ohgaki, H.; Wiestler, O.D.; Kleihues, P.; Ellison, D.W. The 2016 World Health Organization Classification of Tumors of the Central Nervous System: A Summary. Acta Neuropathol. 2016, 131, 803–820. [Google Scholar] [CrossRef]
- Ostrom, Q.T.; Gittleman, H.; Liao, P.; Vecchione-Koval, T.; Wolinsky, Y.; Kruchko, C.; Barnholtz-Sloan, J.S. CBTRUS Statistical Report: Primary Brain and Other Central Nervous System Tumors Diagnosed in the United States in 2010–2014. Neuro-Oncol. 2017, 19, v1–v88. [Google Scholar] [CrossRef] [PubMed]
- Khan, S.; Kambris, M.E.K.; AlShamsi, E.T. Epidemiology of Brain Tumors in the United Arab Emirates: A National Registry Cross-Sectional Study. BMC Neurol. 2020, 20, 301. [Google Scholar] [CrossRef]
- World Population Dashboard—United States of America. Available online: https://www.unfpa.org/data/world-population/US (accessed on 6 September 2022).
- World Population Dashboard—Kazakhstan. Available online: https://www.unfpa.org/data/world-population/KZ (accessed on 6 September 2022).
- World Population Dashboard—United Arab Emirates. Available online: https://www.unfpa.org/data/world-population/AE (accessed on 6 September 2022).
- Lapointe, S.; Perry, A.; Butowski, N.A. Primary Brain Tumours in Adults. Lancet 2018, 392, 432–446. [Google Scholar] [CrossRef]
- Sant, M.; Minicozzi, P.; Lagorio, S.; Børge Johannesen, T.; Marcos-Gragera, R.; Francisci, S. EUROCARE Working Group Survival of European Patients with Central Nervous System Tumors. Int. J. Cancer 2012, 131, 173–185. [Google Scholar] [CrossRef]
- Girardi, F.; Rous, B.; Stiller, C.A.; Gatta, G.; Fersht, N.; Storm, H.H.; Rodrigues, J.R.; Herrmann, C.; Marcos-Gragera, R.; Peris-Bonet, R.; et al. The Histology of Brain Tumors for 67 331 Children and 671 085 Adults Diagnosed in 60 Countries during 2000–2014: A Global, Population-Based Study (CONCORD-3). Neuro-Oncol. 2021, 23, 1765–1776. [Google Scholar] [CrossRef]
- Bauchet, L.; Mathieu-Daudé, H.; Fabbro-Peray, P.; Rigau, V.; Fabbro, M.; Chinot, O.; Pallusseau, L.; Carnin, C.; Lainé, K.; Schlama, A.; et al. Oncological Patterns of Care and Outcome for 952 Patients with Newly Diagnosed Glioblastoma in 2004. Neuro-Oncol. 2010, 12, 725–735. [Google Scholar] [CrossRef]
- Hartmann, C.; Hentschel, B.; Wick, W.; Capper, D.; Felsberg, J.; Simon, M.; Westphal, M.; Schackert, G.; Meyermann, R.; Pietsch, T.; et al. Patients with IDH1 Wild Type Anaplastic Astrocytomas Exhibit Worse Prognosis than IDH1-Mutated Glioblastomas, and IDH1 Mutation Status Accounts for the Unfavorable Prognostic Effect of Higher Age: Implications for Classification of Gliomas. Acta Neuropathol. 2010, 120, 707–718. [Google Scholar] [CrossRef]
- Brandbook Population Census 2021. Available online: https://stat.gov.kz/for_users/national/2020 (accessed on 9 September 2022).
- Ostrom, Q.T.; Cote, D.J.; Ascha, M.; Kruchko, C.; Barnholtz-Sloan, J.S. Adult Glioma Incidence and Survival by Race or Ethnicity in the United States From 2000 to 2014. JAMA Oncol. 2018, 4, 1254–1262. [Google Scholar] [CrossRef]
- Raj, R.; Seppä, K.; Luostarinen, T.; Malila, N.; Seppälä, M.; Pitkäniemi, J.; Korja, M. Disparities in Glioblastoma Survival by Case Volume: A Nationwide Observational Study. J. Neurooncol. 2020, 147, 361–370. [Google Scholar] [CrossRef]
- Ob Utverzhdenii Pravil i Metodiki Formirovaniya Tarifov Na Meditsinskiye Uslugi, Okazyvayemyye v Ramkakh Garantirovannogo Ob"yema Besplatnoy Meditsinskoy Pomoshchi i (Ili) v Sisteme Obyazatel’nogo Sotsial’nogo Meditsinskogo Strakhovaniya. Available online: https://adilet.zan.kz/rus/docs/V2000021858 (accessed on 16 September 2022).
- Tosoni, A.; Gatto, L.; Franceschi, E.; Di Nunno, V.; Lodi, R.; Mura, A.; di Battista, M.; Bartolini, S.; Brandes, A.A. Association between Socioeconomic Status and Survival in Glioblastoma: An Italian Single-Centre Prospective Observational Study. Eur. J. Cancer 2021, 145, 171–178. [Google Scholar] [CrossRef]
- De Witt Hamer, P.C.; Ho, V.K.Y.; Zwinderman, A.H.; Ackermans, L.; Ardon, H.; Boomstra, S.; Bouwknegt, W.; van den Brink, W.A.; Dirven, C.M.; van der Gaag, N.A.; et al. Between-Hospital Variation in Mortality and Survival after Glioblastoma Surgery in the Dutch Quality Registry for Neuro Surgery. J. Neurooncol. 2019, 144, 313–323. [Google Scholar] [CrossRef] [PubMed]
- Turkoglu, E.; Gurer, B.; Sanli, A.M.; Dolgun, H.; Gurses, L.; Oral, N.A.; Donmez, T.; Sekerci, Z. Clinical Outcome of Surgically Treated Low-Grade Gliomas: A Retrospective Analysis of a Single Institute. Clin. Neurol. Neurosurg. 2013, 115, 2508–2513. [Google Scholar] [CrossRef] [PubMed]
- Stupp, R.; Hegi, M.E.; Mason, W.P.; van den Bent, M.J.; Taphoorn, M.J.B.; Janzer, R.C.; Ludwin, S.K.; Allgeier, A.; Fisher, B.; Belanger, K.; et al. Effects of Radiotherapy with Concomitant and Adjuvant Temozolomide versus Radiotherapy Alone on Survival in Glioblastoma in a Randomised Phase III Study: 5-Year Analysis of the EORTC-NCIC Trial. Lancet Oncol. 2009, 10, 459–466. [Google Scholar] [CrossRef]
- Louis, D.N.; Perry, A.; Wesseling, P.; Brat, D.J.; Cree, I.A.; Figarella-Branger, D.; Hawkins, C.; Ng, H.K.; Pfister, S.M.; Reifenberger, G.; et al. The 2021 WHO Classification of Tumors of the Central Nervous System: A Summary. Neuro-Oncol. 2021, 23, 1231–1251. [Google Scholar] [CrossRef]


| WHO Grade | Histological Diagnosis | n | % Within Grade | % Total |
|---|---|---|---|---|
| 1 | desmoplastic infantile astrocytoma and ganglioglioma | 1 | 4 | 0.30 |
| ganglioglioma | 1 | 4 | 0.30 | |
| pilocytic astrocytoma | 23 | 98 | 6.87 | |
| 2 | diffuse astrocytoma | 53 | 73.61 | 15.82 |
| oligoastrocytoma | 12 | 16.67 | 3.58 | |
| oligodendroglioma | 5 | 6.94 | 1.49 | |
| pleomorphic xanthastrocytoma | 2 | 2.78 | 0.60 | |
| 3 | anaplastic astrocytoma | 38 | 40.86 | 11.34 |
| anaplastic ganglioglioma | 1 | 1.08 | 0.30 | |
| anaplastic oligoastrocytoma | 23 | 24.73 | 6.87 | |
| anaplastic oligodendroglioma | 28 | 30.11 | 8.36 | |
| anaplastic pleomorphic xanthastrocytoma | 3 | 3.23 | 0.90 | |
| 4 | glioblastoma | 145 | 100 | 43.28 |
| Total | 335 | 100 |
| Variable | N (%) | 1 Year OS (95% CI) | 2 Years OS (95% CI) | 5 Years OS (95% CI) | |
|---|---|---|---|---|---|
| Total | 335 (100) | 79.1 (74.35–83.08) | 63.53 (58.09–68.46) | 45.93 (39.67–51.95) | |
| Age (Me—41, mean—42.68 ± 13.49) | 18–30 | 78 (23.28) | 89.74 (80.54–94.73) | 83.19 (72.82–89.88) | 69.28 (56.42–70.03) |
| 31–40 | 81 (24.18) | 88.89 (79.74–94.06) | 73.97 (62.93–82.18) | 56.23 (41.49–68.61) | |
| 41–54 | 98 (29.25) | 77.55 (67.94–84.60) | 58.43 (47.90–67.55) | 36.77 (25.72–47.83) | |
| ≥55 | 78 (23.28) | 60.26 (48.53–70.12) | 39.30 (28.45–49.96) | 21.83 (12.39–32.99) | |
| Nationality | Kazakh | 230 (69.07) | 80.43 (74.69–85) | 66.21 (59.67–71.95) | 47.45 (39.68–54.82) |
| Russian | 54 (16.22) | 81.48 (68.32–89.58) | 64.43 (50.05–75.64) | 45.1 (30.22–58.87) | |
| Other | 49 (14.71) | 69.39 (54.45–80.28) | 50.75 (36.05–63.7) | 40.84 (26.64–54.55) | |
| Sex | Male | 189 (56.42) | 70.81 (65.51–75.45) | 51.8 (46.17–57.12) | 37.73 (31.87–43.56) |
| Female | 148 (43.66) | 71.73 (65.58–76.97) | 57.55 (51–63.56) | 39.14 (32–46.19) | |
| Change of diagnosis | Yes | 27 (8.06) | 96.30 (76.49–99.47) | 81.19 (60.56–91.71) | 56.95 (34.12–74.47) |
| No | 308 (91.94) | 77.60 (72.52–81.86) | 61.98 (56.27–67.17) | 45.55 (39.12–51.75) | |
| City type | Rural | 112 (33.43) | 76.79 (67.81–83.56) | 62.25 (52.54–70.52) | 38.16 (26.53–49.69) |
| Urban | 223 (66.57) | 80.27 (74.41–84.92) | 64.17 (57.45–70.11) | 49.27 (41.89–56.22) | |
| Region | Central | 68 (20.42) | 69.12 (56.67–78.64) | 49.37 (36.94–60.63) | 33.79 (21.97–46) |
| East | 19 (5.71) | 78.95 (53.19–91.53) | 73.68 (47.89–88.1) | 46.68 (21.68–68.41) | |
| North | 85 (25.53) | 78.82 (68.52–86.09) | 68.07 (56.99–76.87) | 56.61 (44.91–66.73) | |
| South | 95 (28.53) | 80 (70.46–86.74) | 64 (53.45–72.77) | 44.65 (31.77–56.71) | |
| West | 66 (19.82) | 87.88 (77.22–93.75) | 67.29 (54.35–77.31) | 47.28 (32.64–60.58) | |
| Treatment method | Only surgery | 86 (25.67) | 54.65 (43.56–64.45) | 46.33 (35.53–56.45) | 46.33 (35.53–56.45) |
| Chemotherapy | 20 (5.97) | 75.00 (49.99–88.75) | 35.00 (15.66–55.19) | 35.00 (15.66–55.19) | |
| Radiotherapy | 84 (25.07) | 85.71 (76.22–91.62) | 75.85 (65.09–83.69) | 46.96 (33.03–59.71) | |
| Radio chemotherapy | 32 (9.55) | 78.13 (59.52–88.92) | 56.25 (37.59–71.30) | 44.74 (26.51–61.44) | |
| Radio chemotherapy and adjuvant chemotherapy | 53 (15.82) | 92.45 (81.13–97.10) | 70.81 (56.31–81.27) | 43.74 (27.17–59.17) | |
| Radiotherapy and adjuvant chemotherapy | 60 (17.91) | 95.00 (85.29–98.36) | 78.19 (65.41–86.70) | 52.20 (38.18–64.97) | |
| Comorbidity | Yes | 89 (26.57) | 69.66 (58.97–78.08) | 54.69 (43.74–64.39) | 41.28 (30.18–52.03) |
| No | 246 (73.43) | 82.52 (77.17–86.73) | 66.72 (60.41–72.26) | 47.77 (40.31–54.83) | |
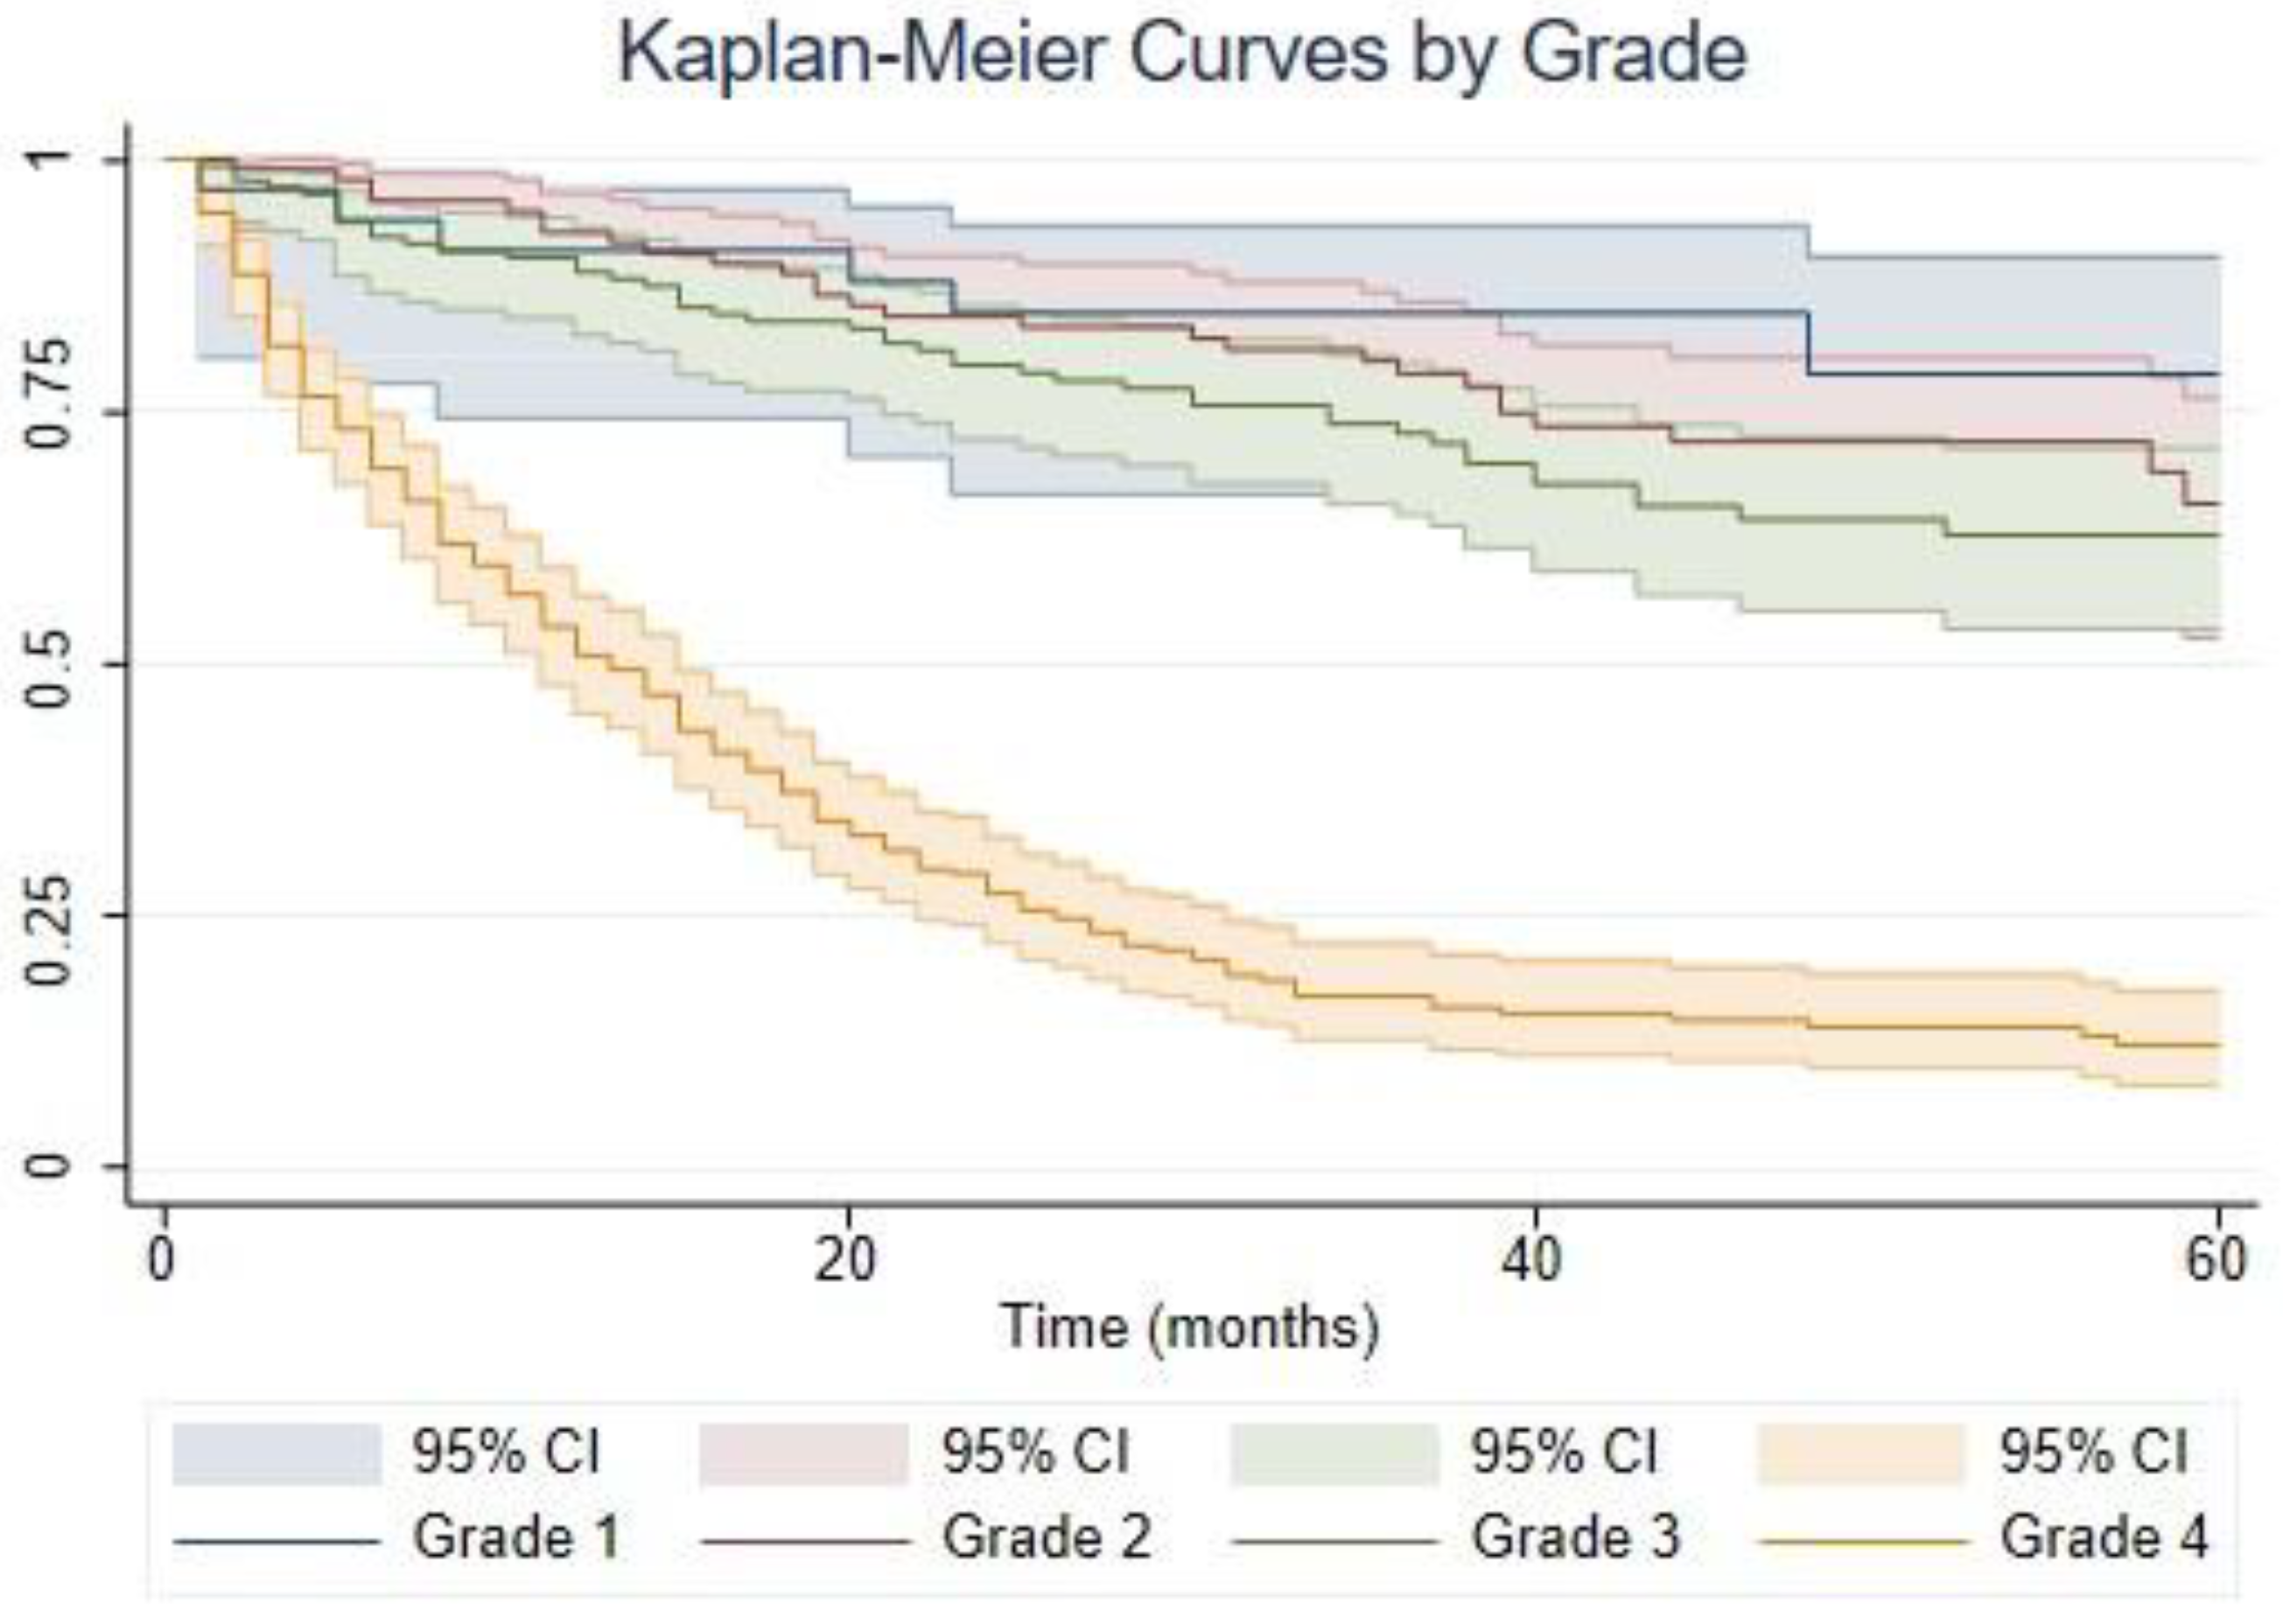
| Grade | 1 | 25 (7.46) | 88.00 (67.26–95.96) | 80.00 (58.44–91.15) | 68.57 (37.51–86.49) |
| 2 | 72 (21.49) | 93.06 (84.12–97.05) | 86.06 (75.64–92.24) | 73.92 (61.12–83.07) | |
| 3 | 93 (27.76) | 92.47 (84.86–96.34) | 86.94 (78.14–92.36) | 63.97 (50.72–74.52) | |
| 4 | 145 (43.28) | 62.07 (53.65–69.40) | 34.24 (26.56–42.06) | 15.64 (9.34–23.41) |
| Variable | N (%) | 1 Year OS (95% CI) | 2 Years OS (95% CI) | 5 Years OS (95% CI) | |
|---|---|---|---|---|---|
| Total | 145 (100) | 57.9 (50.4–66.6) | 33.4 (26.5–42.1) | 15.9 (10.1–25.0) | |
| Age | 18–30 | 19 (13.10) | 73.7 (56.3–96.4) | 52.1 (33.7–80.5) | 24.4 (10.0–59.7) |
| 31–40 | 21 (14.48) | 81.0 (65.8–99.6) | 42.9 (26.2–70.2) | 30.0 (14.7–61.0) | |
| 41–54 | 49 (33.79) | 53.1 (40.8–69.0) | 34.7 (23.6–50.9) | 13.3 (4.6–38.4) | |
| ≥55 | 56 (38.62) | 48.2 (36.8–63.2) | 23.0 (14.2–37.2) | 6.4 (1.9–22.3) | |
| Nationality | Kazakh | 96 (66.21) | 63.5 (54.6–73.9) | 37.1 (28.6–48.3) | 16.6 (9.5–29.0) |
| Russian | 25 (17.24) | 56.0 (39.6–79.3) | 32.0 (18.1–56.7) | 16.0 (6.0–42.8) | |
| Other | 24 (16.55) | 37.5 (22.4–62.9) | 20.0 (8.8–45.4) | 15.0 (5.5–40.6) | |
| Sex | Male | 86 (59.31) | 52.3 (42.8–64.0) | 27.9 (19.9–39.2) | 16.3 (9.4–28.4) |
| Female | 59 (40.69) | 66.1 (55.1–79.4) | 40.9 (29.8–56.1) | 12.8 (5.2–31.5) | |
| Change of diagnosis | Yes | 16 (11.03) | 87.5 (72.7–100.0) | 61.9 (41.9–91.4) | 45.1 (25.0–81.4) |
| No | 129 (88.97) | 54.3 (46.3–63.6) | 29.8 (22.9–39.0) | 12.4 (7.0–21.9) | |
| City type | Rural | 46 (31.72) | 56.5 (43.9–72.8) | 33.8 (22.3–51.0) | 8.4 (1.7–41.2) |
| Urban | 99 (68.28) | 58.6 (49.6–69.1) | 33.1 (25.0–43.9) | 18.1 (11.4–28.8) | |
| Region | Central | 36 (24.83) | 50.0 (36.1–69.3) | 24.7 (13.9–43.9) | 12.3 (5.0–30.4) |
| East | 4 (2.76) | 25.0 (4.6–1.0) | - | - | |
| North | 39 (26.90) | 59.0 (45.4–76.6) | 35.5 (23.2–54.4) | 25.4 (13.5–47.8) | |
| South | 38 (26.21) | 65.8 (52.3–82.7) | 38.8 (25.9–58.2) | 15.6 (6.3–38.4) | |
| West | 28 (19.31) | 60.7 (45.1–81.8) | 35.7 (21.7–58.7) | 12.3 (3.9–39.1) | |
| Treatment method | Only surgery | 41 (28.28) | 24.4 (14.2–41.8) | 17.1 (8.7–33.5) | 17.1 (8.7–33.5) |
| Chemotherapy | 13 (8.97) | 53.9 (32.6–89.6) | 7.7 (1.2–50.6) | - | |
| Radiotherapy | 21 (14.48) | 47.6 (30.4–74.6) | 37.5 (21.4–65.6) | 11.3 (2.2–59.0) | |
| Radio chemotherapy | 18 (12.41) | 61.1 (42.3–88.3) | 38.9 (21.8–69.4) | 33.3 (17.3–64.1) | |
| Radio chemotherapy and adjuvant chemotherapy | 30 (20.69) | 86.7 (75.3–99.7) | 41.5 (26.7–64.5) | 5.8 (0.9–36.6) | |
| Radiotherapy and adjuvant chemotherapy | 22 (15.17) | 90.9 (79.7–100.0) | 59.1 (41.7–83.7) | 25.8 (11.9–56.1) | |
| Comorbidity | Yes | 43 (29.66) | 46.5 (33.8–64.1) | 25.1 (14.9–42.4) | 14.4 (6.3–32.8) |
| No | 102 (70.34) | 62.7 (54.0–72.9) | 36.9 (28.6–47.7) | 16.4 (9.4–28.5) |
| Treatment | Grade 1, n (%) | Grade 2, n (%) | Grade 3, n (%) | Grade 4, n (%) | Total, n (%) |
|---|---|---|---|---|---|
| Only surgery | 15 (60) | 16 (22.22) | 14 (15.05) | 41 (28.28) | 86 (25.67) |
| Chemotherapy | 1 (4) | - | 6 (6.45) | 13 (8.97) | 20 (5.97) |
| Radiotherapy | 7 (28) | 24 (33.33) | 32 (34.41) | 21 (14.48) | 84 (25.07) |
| Radio chemotherapy | - | 7 (9.72) | 7 (7.53) | 18 (12.41) | 32 (9.55) |
| Radio chemotherapy and adjuvant chemotherapy | - | 7 (9.72) | 16 (17.2) | 30 (20.69) | 53 (15.82) |
| Radiotherapy and adjuvant chemotherapy | 2 (8) | 18 (25) | 18 (19.36) | 22 (15.17) | 60 (17.91) |
| Total | 25 (100) | 72 (100) | 93 (100) | 145 (100) | 335 (100) |
| Low Grade | Grade 3 | Grade 4 | ||||||
|---|---|---|---|---|---|---|---|---|
| Variable | CHR (95% CI) | p-Value | CHR (95% CI) | p-Value | CHR (95% CI) | p-Value | AHR (95% CI) * | p-Value |
| Age | 1.06 (1.03–1.1) | <0.001 | 1.02 (0.99–1.05) | 0.24 | 1.03 (1.01–1.04) | <0.001 | 1.02 (1.01–1.04) | 0.005 |
| Sex | ||||||||
| Male | Ref | Ref | Ref | Ref | ||||
| Female | 0.89 (0.39–2.04) | 0.79 | 0.57 (0.25–1.28) | 0.17 | 0.81 (0.56–1.18) | 0.28 | 0.52 (0.33–0.81) | 0.004 |
| Nationality | ||||||||
| Kazakh | Ref | Ref | Ref | - | - | |||
| Russian | - | - | 2.89 (1.17–7.14) | 0.02 | 1.22 (0.75–1.98) | 0.43 | - | - |
| Other | 1.18 (0.44–3.17) | 0.75 | 2.21 (0.64–7.66) | 0.21 | 1.57 (0.95–2.57) | 0.08 | ||
| Comorbidity | ||||||||
| No | Ref | Ref | Ref | - | - | |||
| Yes | 0.96 (0.36–2.58) | 0.93 | 1.61 (0.72–3.62) | 0.25 | 1.35 (0.91–2.01) | 0.14 | - | - |
| City type | ||||||||
| Rural | Ref | Ref | Ref | - | - | |||
| Urban | 1.35 (0.56–3.29) | 0.67 | 0.27 (0.12–0.59) | 0.001 | 0.97 (0.65–1.43) | 0.86 | - | - |
| Treatment method | ||||||||
| Only surgery | Ref | Ref | Ref | - | - | |||
| Chemotherapy | - | - | 0.43 (0.05–3.66) | 0.44 | 0.78 (0.4–1.53) | 0.47 | - | - |
| Radiotherapy | 1.14 (0.41–3.15) | 0.8 | 0.71 (0.25–2.06) | 0.53 | 0.53 (0.29–0.96) | 0.035 | - | - |
| Radio chemotherapy | 1.13 (0.23–5.44) | 0.88 | 1.5 (0.35–6.32) | 0.58 | 0.39 (0.2–0.75) | 0.005 | - | - |
| Radio chemotherapy and adjuvant chemotherapy | 0.6 (0.07–4.91) | 0.64 | - | - | 0.41 (0.24–0.7) | 0.001 | - | - |
| Radiotherapy and adjuvant chemotherapy | 1.01 (0.32–3.17) | 0.99 | 0.7 (0.21–2.3) | 0.56 | 0.33 (0.18–0.6) | <0.001 | - | - |
Disclaimer/Publisher’s Note: The statements, opinions and data contained in all publications are solely those of the individual author(s) and contributor(s) and not of MDPI and/or the editor(s). MDPI and/or the editor(s) disclaim responsibility for any injury to people or property resulting from any ideas, methods, instructions or products referred to in the content. |
© 2023 by the authors. Licensee MDPI, Basel, Switzerland. This article is an open access article distributed under the terms and conditions of the Creative Commons Attribution (CC BY) license (https://creativecommons.org/licenses/by/4.0/).
Share and Cite
Babi, A.; Menlibayeva, K.; Bex, T.; Kuandykova, S.; Akshulakov, S. The Current State of Adult Glial Tumor Patients’ Care in Kazakhstan: Challenges in Diagnosis and Patterns in Survival Outcomes. Biomedicines 2023, 11, 886. https://doi.org/10.3390/biomedicines11030886
Babi A, Menlibayeva K, Bex T, Kuandykova S, Akshulakov S. The Current State of Adult Glial Tumor Patients’ Care in Kazakhstan: Challenges in Diagnosis and Patterns in Survival Outcomes. Biomedicines. 2023; 11(3):886. https://doi.org/10.3390/biomedicines11030886
Chicago/Turabian StyleBabi, Aisha, Karashash Menlibayeva, Torekhan Bex, Shynar Kuandykova, and Serik Akshulakov. 2023. "The Current State of Adult Glial Tumor Patients’ Care in Kazakhstan: Challenges in Diagnosis and Patterns in Survival Outcomes" Biomedicines 11, no. 3: 886. https://doi.org/10.3390/biomedicines11030886
APA StyleBabi, A., Menlibayeva, K., Bex, T., Kuandykova, S., & Akshulakov, S. (2023). The Current State of Adult Glial Tumor Patients’ Care in Kazakhstan: Challenges in Diagnosis and Patterns in Survival Outcomes. Biomedicines, 11(3), 886. https://doi.org/10.3390/biomedicines11030886