Changes in the Fecal Metabolome Accompany an Increase in Aberrant Crypt Foci in the Colon of C57BL/6 Mice Fed with a High-Fat Diet
Abstract
1. Introduction
2. Results
2.1. Effect of AOM Treatment on the Abundance of Fecal Metabolites
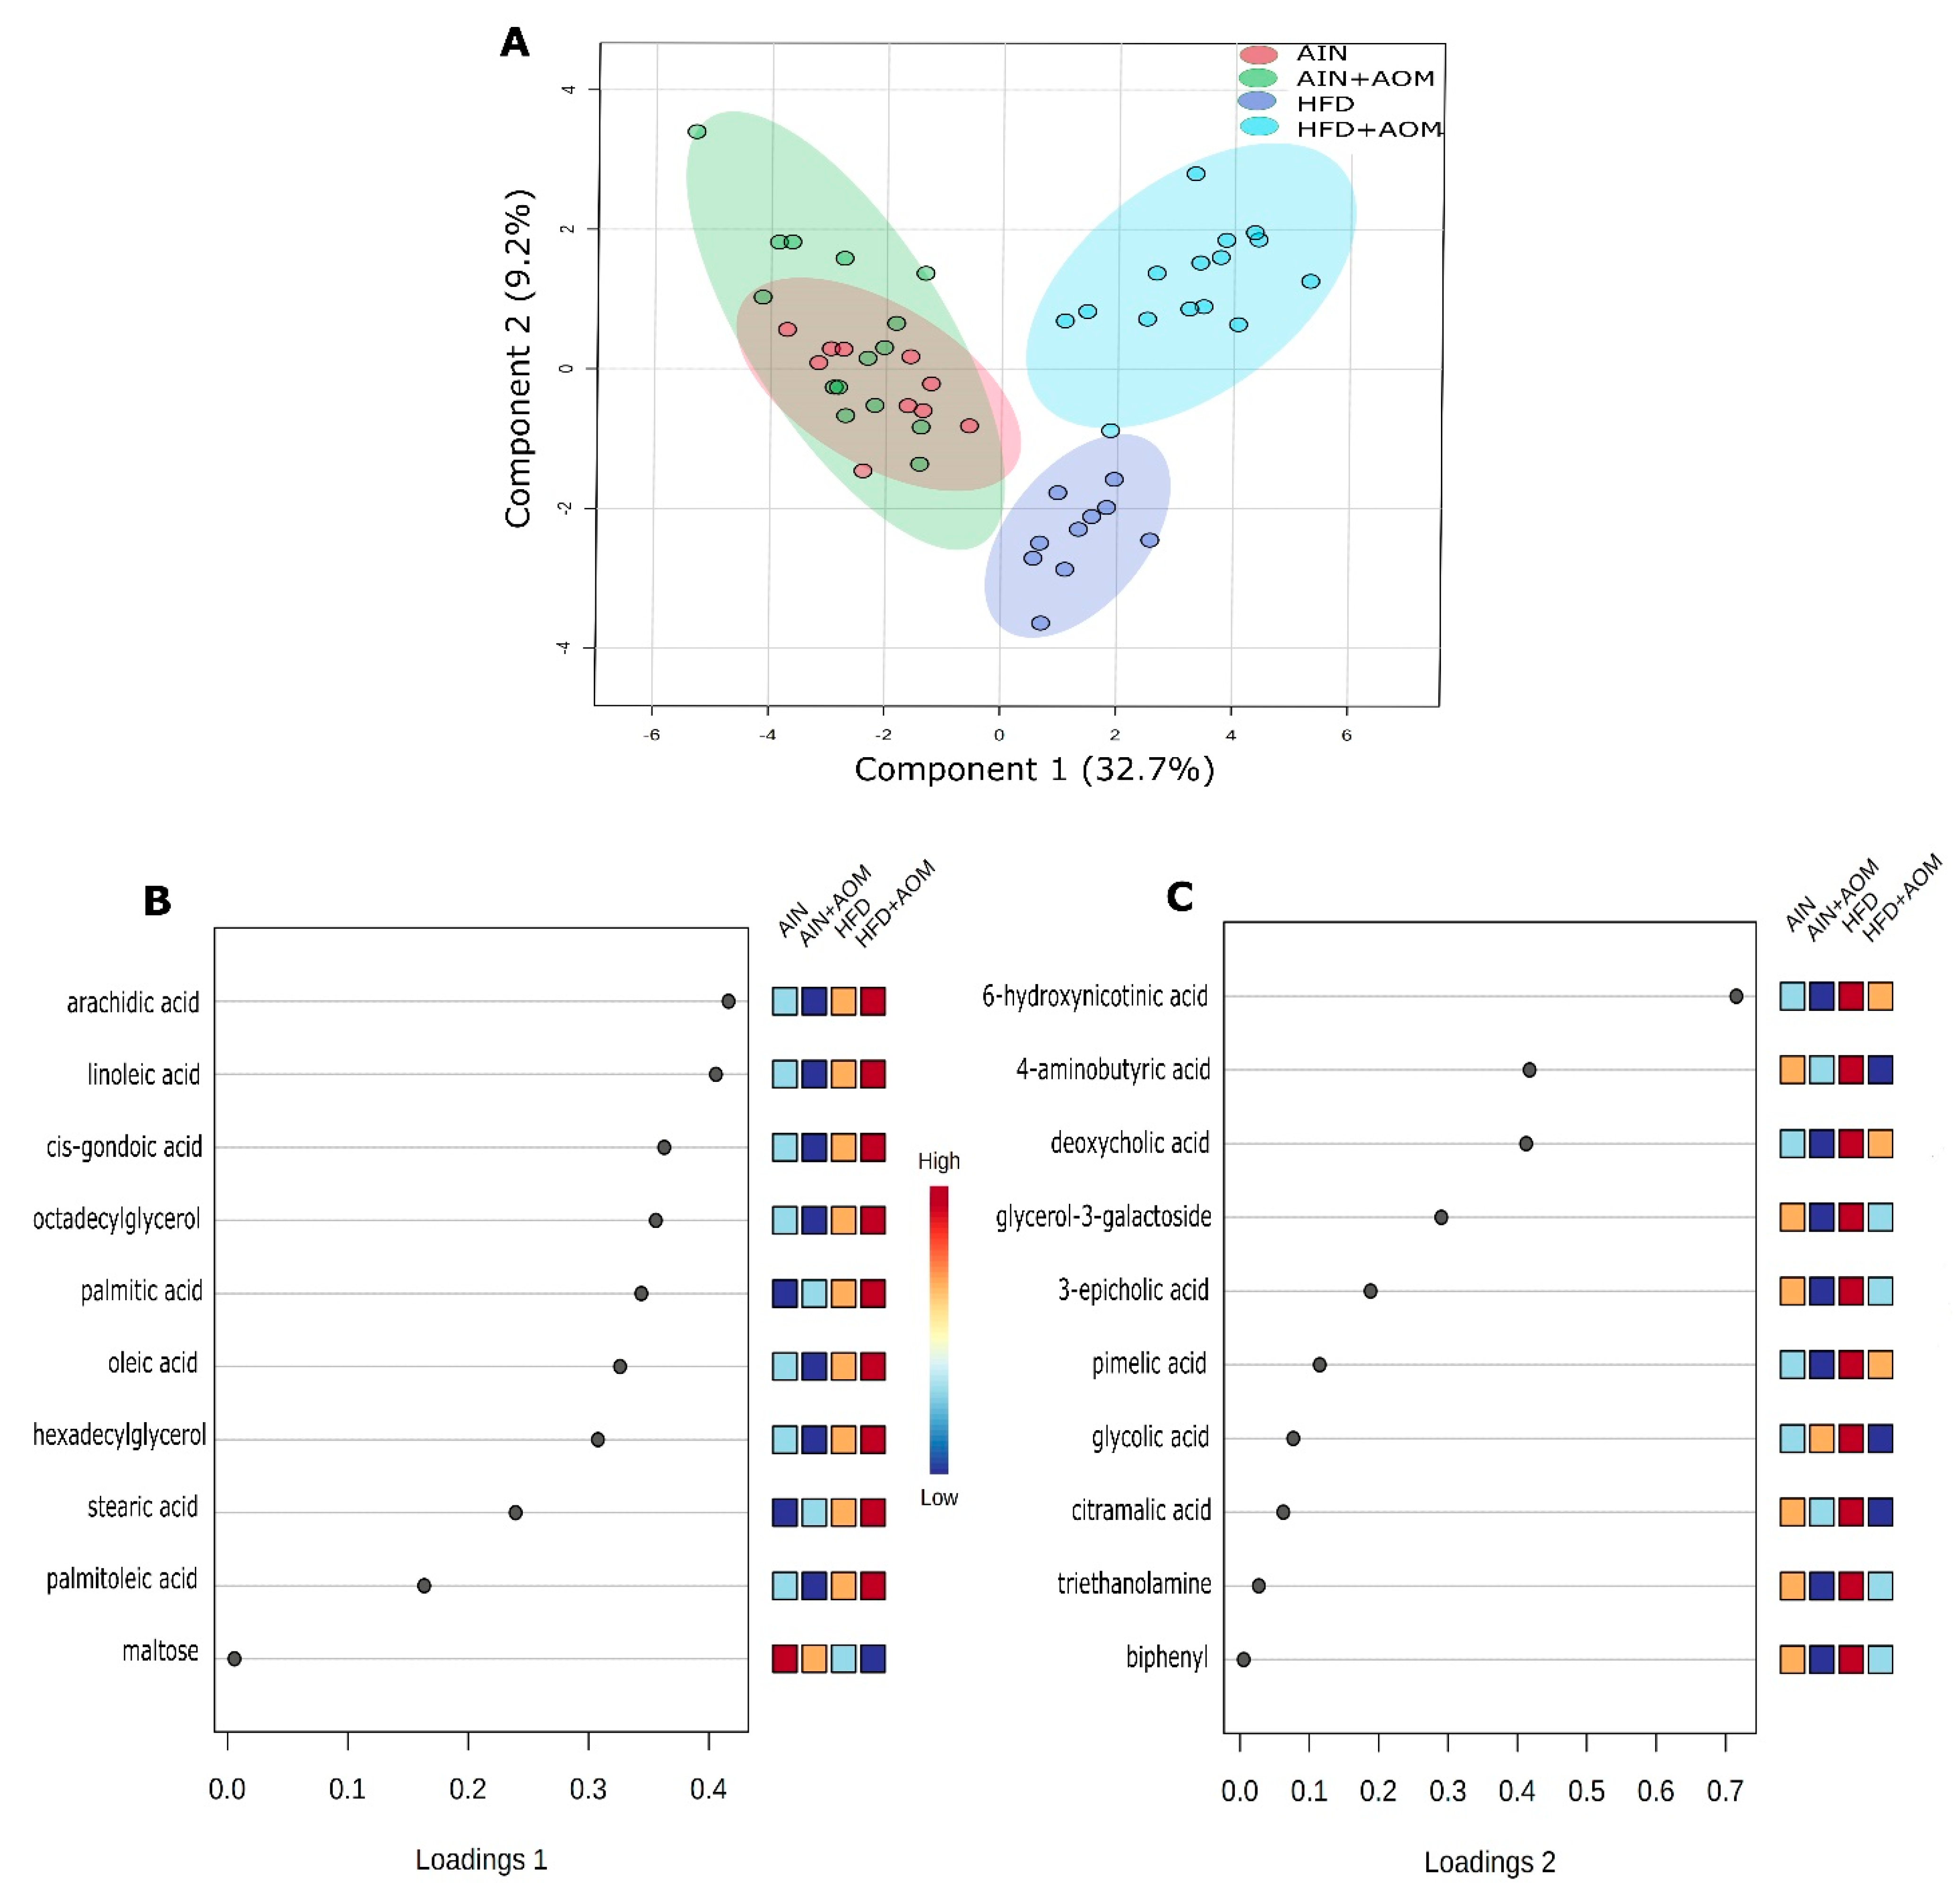
2.2. Effect of Diet and AOM Treatment on Overall Fecal Metabolome
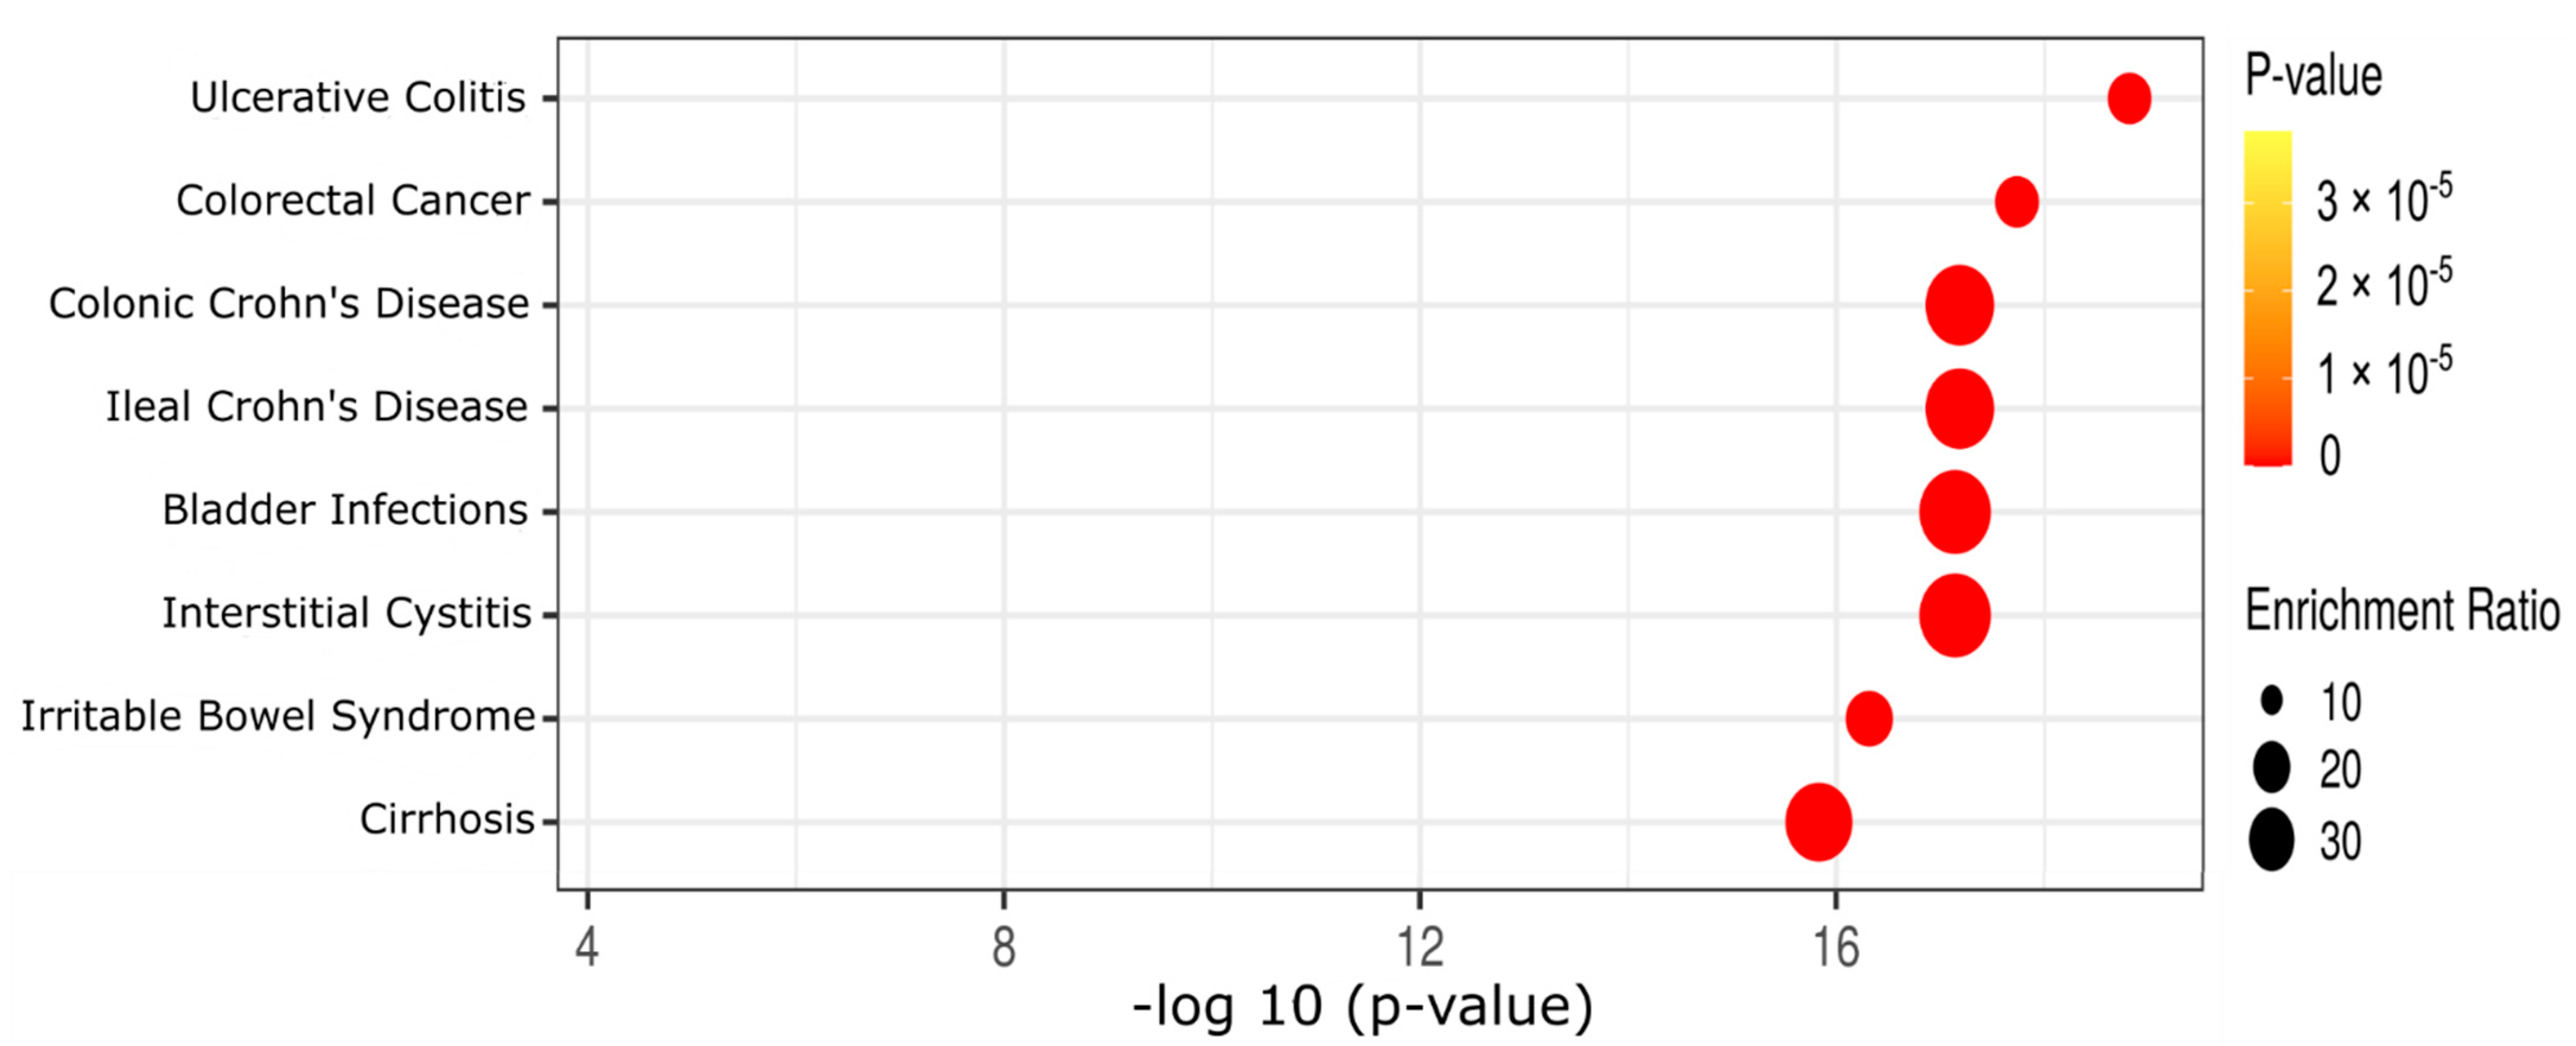
2.3. Effect of Diet and AOM Treatment on Metabolic Pathways and Potential Disease Aspects
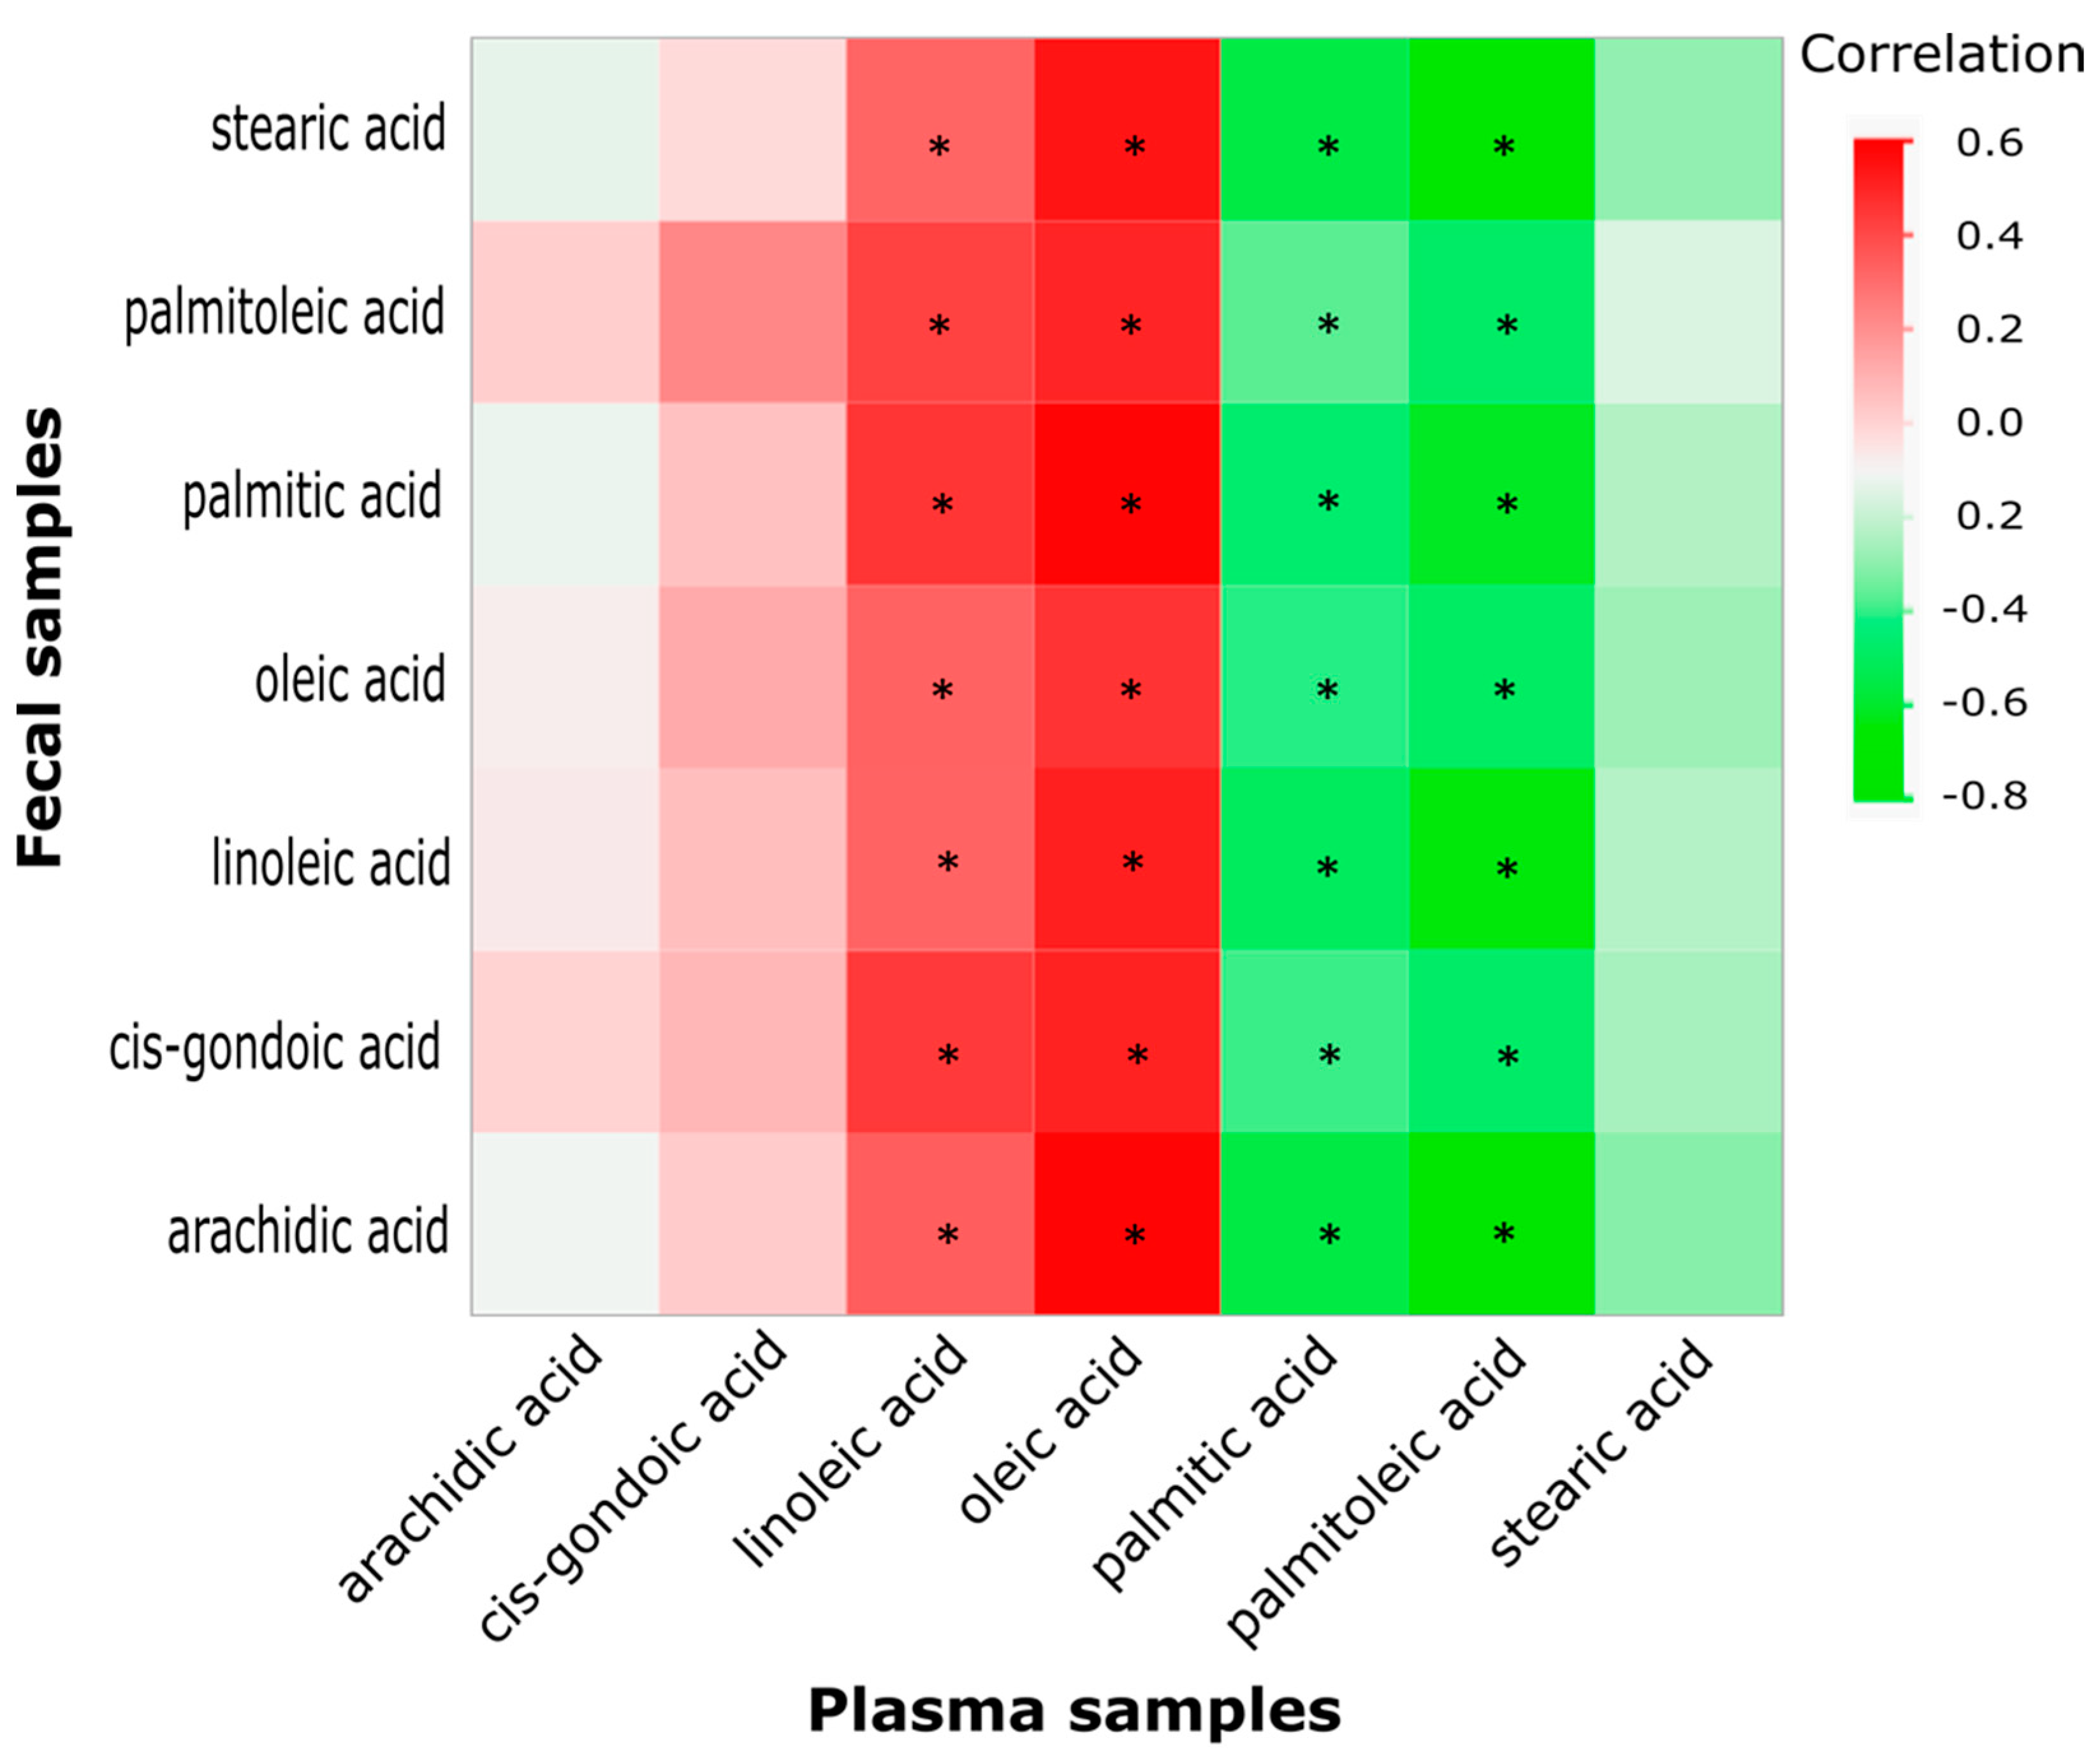
2.4. Correlation between Key Fecal and Plasma Fatty Acids
2.5. Correlation between Fecal Metabolites (or Plasma Counterpart Metabolites), AC, ACF, iNOS, Ki67, and Colonic Bacteria
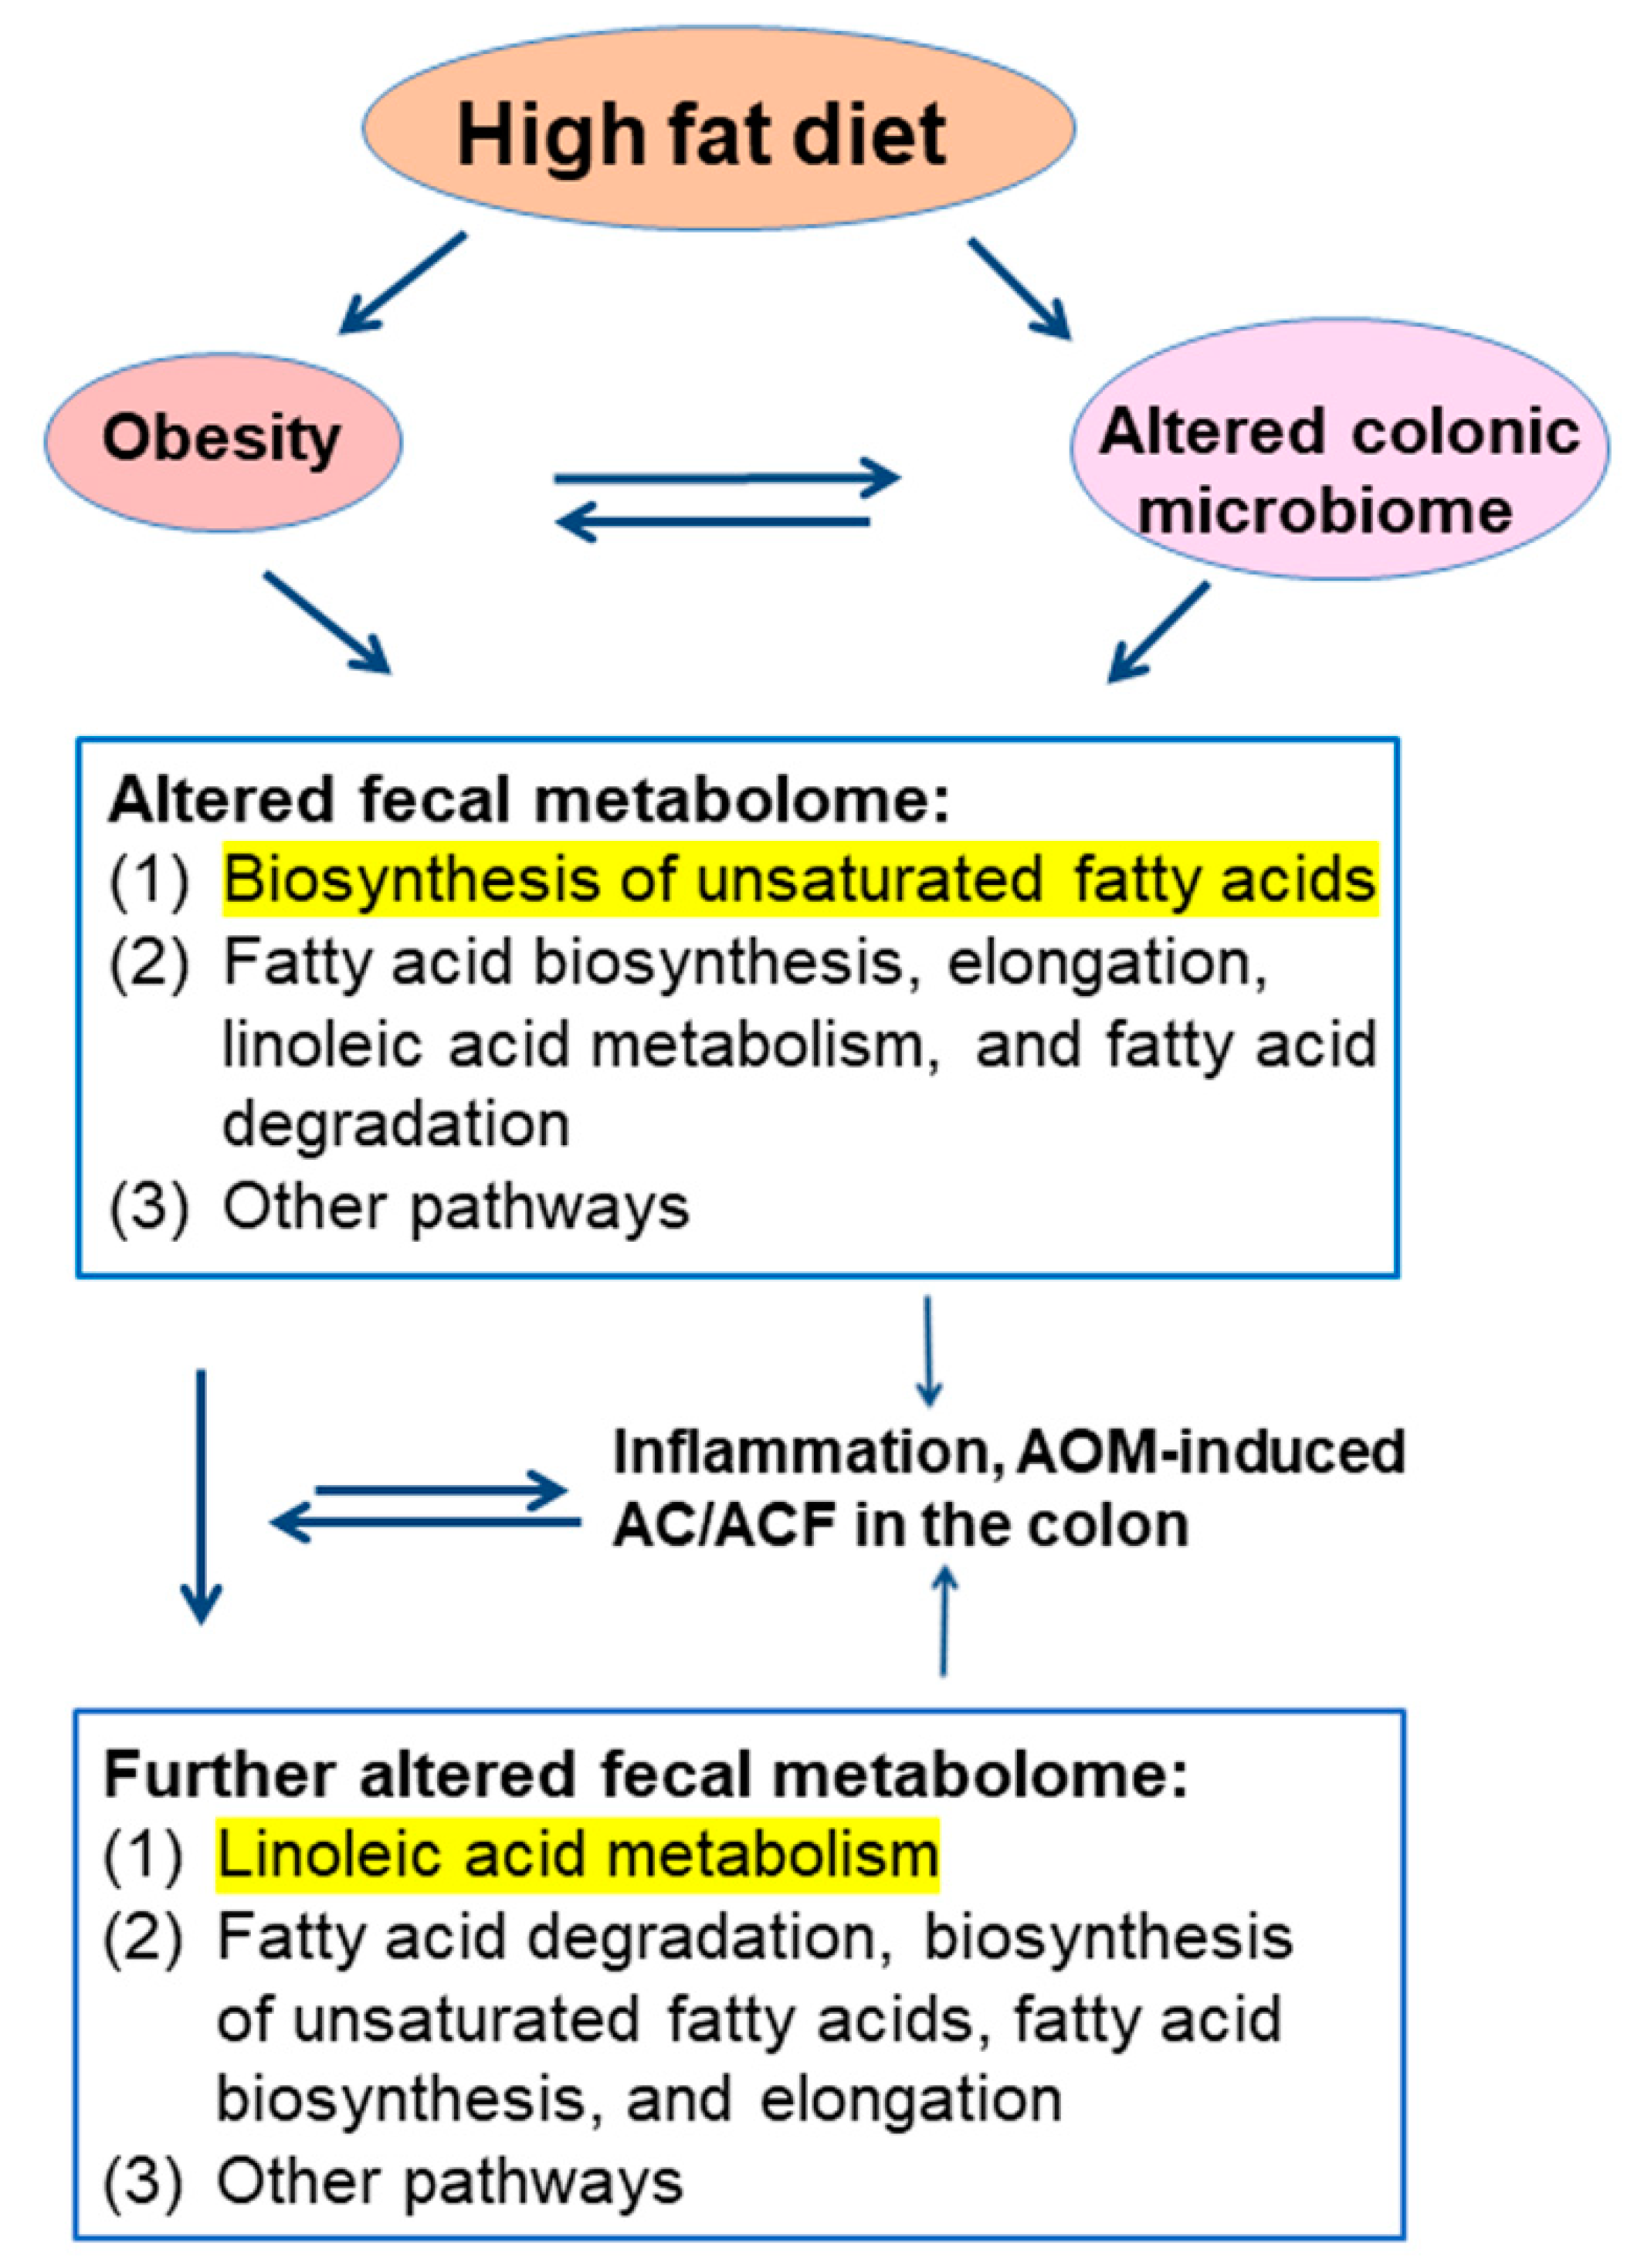
3. Discussion
4. Materials and Methods
4.1. Animals, Diets, and AOM Treatment
4.2. Fecal Metabolomics
4.3. Statistical and Bioinformatic Analysis
5. Conclusions
Supplementary Materials
Author Contributions
Funding
Institutional Review Board Statement
Informed Consent Statement
Data Availability Statement
Acknowledgments
Conflicts of Interest
Abbreviations
References
- Inoue, Y.; Qin, B.; Poti, J.; Sokol, R.; Gordon-Larsen, P. Epidemiology of obesity in adults: Latest trends. Curr. Obes. Rep. 2018, 7, 276–288. [Google Scholar] [CrossRef] [PubMed]
- Ao, L. The risk of colonic adenomas and colonic cancer in obesity. Best Pract. Res. Clin. Gastroenterol. 2014, 28, 655–663. [Google Scholar]
- Kim, D.S.; Scherer, P.E. Obesity, diabetes, and increased cancer progression. Diabetes Metab. J. 2021, 45, 799–812. [Google Scholar] [CrossRef] [PubMed]
- van Kruijsdijk, R.C.; van der Wall, E.; Visseren, F.L. Obesity and cancer: The role of dysfunctional adipose tissue. Cancer Epidemiol. Biomarkers Prev. 2009, 18, 2569–2578. [Google Scholar] [CrossRef] [PubMed]
- Bardou, M.; Barkun, A.N.; Martel, M. Obesity and colorectal cancer. Gut 2013, 62, 933–947. [Google Scholar] [CrossRef] [PubMed]
- Bardou, M.; Rouland, A.; Martel, M.; Loffroy, R.; Barkun, A.N.; Chapelle, N. Review article: Obesity and colorectal cancer. Alimen. Pharmacol. Ther. 2022, 56, 407–418. [Google Scholar] [CrossRef]
- Guo, C.; Kim, S.J.; Frederick, A.M.; Li, J.; Jin, Y.; Zeng, H.; Mason, J.B.; Liu, Z. Genetic ablation of tumor necrosis factor-alpha attenuates the promoted colonic Wnt signaling in high fat diet-induced obese mice. J. Nutr. Biochem. 2020, 77, 108302. [Google Scholar] [CrossRef]
- Zeng, H.; Ishaq, S.L.; Liu, Z.; Bukowski, M.R. Colonic aberrant crypt formation accompanies an increase of opportunistic pathogenic bacteria in C57BL/6 mice fed a high-fat diet. J. Nutr. Biochem. 2018, 54, 18–27. [Google Scholar] [CrossRef]
- Chen, H.H.; Tseng, Y.J.; Wang, S.Y.; Tsai, Y.S.; Chang, C.S.; Kuo, T.C.; Yao, W.J.; Shieh, C.C.; Wu, C.H.; Kuo, P.H. The metabolome profiling and pathway analysis in metabolic healthy and abnormal obesity. Int. J. Obes. 2015, 39, 1241–1248. [Google Scholar] [CrossRef]
- Gonzalez-Covarrubias, V.; Martínez-Martínez, E.; Del Bosque-Plata, L. The Potential of Metabolomics in Biomedical Applications. Metabolites 2022, 12, 194. [Google Scholar] [CrossRef]
- Yang, J.; Wei, H.; Zhou, Y.; Szeto, C.H.; Li, C.; Lin, Y.; Coker, O.O.; Lau, H.C.H.; Chan, A.W.H.; Sung, J.J.Y.; et al. High-fat diet promotes colorectal tumorigenesis through modulating gut microbiota and metabolites. Gastroenterology 2022, 162, 135–149. [Google Scholar] [CrossRef]
- Grady, W.M. Epigenetic alterations in the gastrointestinal tract: Current and emerging use for biomarkers of cancer. Adv. Cancer Res. 2021, 151, 425–468. [Google Scholar]
- Zeng, H.; Umar, S.; Liu, Z.; Bukowski, M.R. Azoxymethane alters the plasma metabolome to a greater extent in mice fed a high-fat diet compared to an AIN-93 Diet. Metabolites 2021, 11, 448. [Google Scholar] [CrossRef]
- Weisburger, J.H. Colon carcinogens: Their metabolism and mode of action. Cancer 1971, 28, 60–70. [Google Scholar] [CrossRef]
- Takada, H.; Hirooka, T.; Hiramatsu, Y.; Yamamoto, M. Effect of beta-glucuronidase inhibitor on azoxymethane-induced colonic carcinogenesis in rats. Cancer Res. 1982, 42, 331–334. [Google Scholar]
- Reynolds, C.J.; Koszewski, N.J.; Horst, R.L.; Beitz, D.C.; Goff, J.P. Role of glucuronidated 25-hydroxyvitamin D on colon gene expression in mice. Am. J. Physiol. Gastrointest. Liver Physiol. 2020, 319, G253–G260. [Google Scholar] [CrossRef]
- Mallett, A.K.; Rowland, I.R.; Wise, A. Dietary fat and cecal microbial activity in the rat. Nutr. Cancer 1984, 6, 86–91. [Google Scholar] [CrossRef]
- Hambly, R.J.; Rumney, C.J.; Fletcher, J.M.; Rijken, P.J.; Rowland, I.R. Effects of high- and low-risk diets on gut microflora-associated biomarkers of colon cancer in human flora-associated rats. Nutr. Cancer 1997, 27, 250–255. [Google Scholar] [CrossRef]
- Beadle, J.B.; Just, D.E.; Morgan, R.E.; Reiners, R.A. Composition of corn oil. J. Am. Oil Chem. Soc. 1965, 42, 90–95. [Google Scholar] [CrossRef]
- Yu, B.; Peng, X.H.; Wang, L.Y.; Wang, A.B.; Su, Y.Y.; Chen, J.H.; Zhang, X.W.; Zhao, D.Z.; Wang, H.; Pang, D.X.; et al. Abnormality of intestinal cholesterol absorption in Apc(Min/+) mice with colon cancer cachexia. Int. J. Clin. Exp. Pathol. 2019, 12, 759–767. [Google Scholar]
- Hamada, K.; Umemoto, A.; Kajikawa, A.; Tanaka, M.; Seraj, M.J.; Nakayama, M.; Kubota, A.; Monden, Y. Mucosa-specific DNA adducts in human small intestine: A comparison with the colon. Carcinogenesis 1994, 15, 2677–2680. [Google Scholar] [CrossRef] [PubMed]
- Chung, Y.W.; Han, D.S.; Park, Y.K.; Son, B.K.; Paik, C.H.; Lee, H.L.; Jeon, Y.C.; Sohn, J.H. Association of obesity, serum glucose and lipids with the risk of advanced colorectal adenoma and cancer: A case-control study in Korea. Dig. Liver Dis. 2006, 38, 668–672. [Google Scholar] [CrossRef] [PubMed]
- O’Keefe, S.J. Diet, microorganisms and their metabolites, and colon cancer. Nat. Rev. Gastroenterol. Hepatol. 2016, 13, 691–706. [Google Scholar] [CrossRef] [PubMed]
- Ohmori, H.; Luo, Y.; Fujii, K.; Sasahira, T.; Shimomoto, T.; Denda, A.; Kuniyasu, H. Dietary linoleic acid and glucose enhances azoxymethane-induced colon cancer and metastases via the expression of high-mobility group box 1. Pathobiology 2010, 77, 210–217. [Google Scholar] [CrossRef] [PubMed]
- Burns, J.L.; Nakamura, M.T.; Ma, D.W.L. Differentiating the biological effects of linoleic acid from arachidonic acid in health and disease. Prostaglandins Leuko. Essent. Fatty Acids 2018, 135, 1–4. [Google Scholar] [CrossRef]
- Zhang, Y.; Wang, D.; Lv, B.; Hou, X.; Liu, Q.; Liao, C.; Xu, R.; Zhang, Y.; Xu, F.; Zhang, P. Oleic Acid and Insulin as Key Characteristics of T2D Promote Colorectal Cancer Deterioration in Xenograft Mice Revealed by Functional Metabolomics. Front. Oncol. 2021, 11, 685059. [Google Scholar] [CrossRef]
- Iftikhar, R.; Penrose, H.M.; King, A.N.; Samudre, J.S.; Collins, M.E.; Hartono, A.B.; Lee, S.B.; Lau, F.; Baddoo, M.; Flemington, E.F.; et al. Elevated ATGL in colon cancer cells and cancer stem cells promotes metabolic and tumorigenic reprogramming reinforced by obesity. Oncogenesis 2021, 10, 82. [Google Scholar] [CrossRef]
- Kishino, S.; Ogawa, J.; Yokozeki, K.; Shimizu, S. Linoleic acid isomerase in Lactobacillus plantarum AKU1009a proved to be a multi-component enzyme system requiring oxidoreduction cofactors. Biosci. Biotechnol. Biochem. 2011, 75, 318–322. [Google Scholar] [CrossRef]
- Kishino, S.; Park, S.B.; Takeuchi, M.; Yokozeki, K.; Shimizu, S.; Ogawa, J. Novel multi-component enzyme machinery in lactic acid bacteria catalyzing C=C double bond migration useful for conjugated fatty acid synthesis. Biochem. Biophys. Res. Commun. 2011, 416, 188–193. [Google Scholar] [CrossRef]
- Padidar, S.; Farquharson, A.J.; Williams, L.M.; Kearney, R.; Arthur, J.R.; Drew, J.E. High-fat diet alters gene expression in the liver and colon: Links to increased development of aberrant crypt foci. Dig. Dis. Sci. 2012, 57, 1866–1874. [Google Scholar] [CrossRef]
- Fiehn, O.; Garvey, W.T.; Newman, J.W.; Lok, K.H.; Hoppel, C.L.; Adams, S.H. Plasma metabolomic profiles reflective of glucose homeostasis in non-diabetic and type 2 diabetic obese African-American women. PLoS ONE 2010, 5, e15234. [Google Scholar] [CrossRef]
- Piccolo, B.D.; Keim, N.L.; Fiehn, O.; Adams, S.H.; Van Loan, M.D.; Newman, J.W. Habitual physical activity and plasma metabolomic patterns distinguish individuals with low vs. high weight loss during controlled energy restriction. J. Nutr. 2015, 145, 681–690. [Google Scholar] [CrossRef]
- Lai, Z.; Tsugawa, H.; Wohlgemuth, G.; Mehta, S.; Mueller, M.; Zheng, Y.; Ogiwara, A.; Meissen, J.; Showalter, M.; Takeuchi, K.; et al. Identifying metabolites by integrating metabolome databases with mass spectrometry cheminformatics. Nat. Methods 2018, 15, 53–56. [Google Scholar] [CrossRef]
- Chong, J.; Wishart, D.S.; Xia, J. Using MetaboAnalyst 4.0 for Comprehensive and Integrative Metabolomics Data Analysis. Curr. Protoc. Bioinform. 2019, 68, e86. [Google Scholar] [CrossRef]
- van den Berg, R.A.; Hoefsloot, H.C.; Westerhuis, J.A.; Smilde, A.K.; van der Werf, M.J. Centering, scaling, and transformations: Improving the biological information content of metabolomics data. BMC Genom. 2006, 7, 142. [Google Scholar] [CrossRef]


| Metabolites | AIN | AIN + AOM | HFD | HFD + AOM |
|---|---|---|---|---|
| Adenine | 1.00 ± 0.19 a | 1.02 ± 0.29 a | 0.89 ± 0.26 ab | 0.64 ± 0.27 b |
| Adenosine-5-monophosphate | 1.00 ± 0.18 a | 0.88 ± 0.37 ab | 0.58 ± 0.25 bc | 0.51 ± 0.26 c |
| Alanine | 1.00 ± 0.20 ab | 1.34 ± 0.76 a | 0.84 ± 0.20 b | 0.70 ± 0.25 b |
| Alanine-alanine | 1.00 ± 0.47 ab | 1.19 ± 0.57 a | 0.73 ± 0.24 ab | 0.62 ± 0.33 b |
| Arachidic acid | 1.00 ± 0.36 c | 0.77 ± 0.27 c | 3.55 ± 0.76 b | 4.72 ± 1.13 a |
| Aspartic acid | 1.00 ± 0.57 ab | 1.48 ± 0.87 a | 0.51 ± 0.25 bc | 0.34 ± 0.24 c |
| Azelaic acid | 1.00 ± 0.50 c | 1.23 ± 0.55 bc | 1.80 ± 0.78 ab | 2.02 ± 0.40 a |
| Benzoic acid | 1.00 ± 0.22 b | 0.98 ± 0.27 b | 1.46 ± 0.28 a | 1.17 ± 0.34 ab |
| Beta-alanine | 1.00 ± 0.24 a | 0.86 ± 0.28 ab | 0.64 ± 0.19 bc | 0.62 ± 0.17 c |
| Beta-glutamic acid | 1.00 ± 0.66 a | 0.94 ± 0.37 a | 0.63 ± 0.20 ab | 0.54 ± 0.23 b |
| Biphenyl | 1.00 ± 0.46 ab | 0.88 ± 0.39 b | 1.37 ± 0.28 a | 0.88 ± 0.31 b |
| Cellobiose | 1.00 ± 0.77 a | 0.71 ± 0.33 ab | 0.26 ± 0.10 b | 0.32 ± 0.29 b |
| Cholesterol | 1.00 ± 0.30 c | 1.09 ± 0.47 c | 1.58 ± 0.34 b | 2.24 ± 0.56 a |
| Cis-gondoic acid | 1.00 ± 0.48 b | 0.62 ± 0.26 b | 3.62 ± 1.56 b | 10.57 ± 6.68 a |
| Citramalic acid | 1.00 ± 0.19 ab | 0.88 ± 0.21 ab | 1.09 ± 0.28 a | 0.78 ± 0.18 b |
| Citric acid | 1.00 ± 0.55 a | 0.96 ± 0.45 a | 0.56 ± 0.31 ab | 0.36 ± 0.13 b |
| Creatinine | 1.00 ± 0.65 a | 0.45 ± 0.33 b | 0.30 ± 0.16 b | 0.45 ± 0.44 b |
| Deoxycholic acid | 1.00 ± 0.38 c | 0.72 ± 0.41 c | 4.64 ± 1.14 a | 1.90 ± 0.58 b |
| Ethanolamine | 1.00 ± 0.80 a | 0.73 ± 0.52 ab | 0.38 ± 0.19 b | 0.45 ± 0.31 b |
| Fructose | 1.00 ± 0.79 a | 0.58 ± 0.38 ab | 0.29 ± 0.14 b | 0.36 ± 0.31 b |
| Glucose | 1.00 ± 0.86 a | 0.56 ± 0.36 ab | 0.23 ± 0.24 b | 0.14 ± 0.12 b |
| Glyceric acid | 1.00 ± 0.37 ab | 1.23 ± 0.32 a | 0.89 ± 0.20 bc | 0.59 ± 0.24 c |
| Glycerol-3-galactoside | 1.00 ± 0.46 ab | 0.68 ± 0.23 c | 1.18 ± 0.28 a | 0.71 ± 0.20 bc |
| Glycerol-alpha-phosphate | 1.00 ± 0.31 ab | 1.17 ± 0.37 a | 0.79 ± 0.24 b | 0.78 ± 0.26 b |
| Glycolic acid | 1.00 ± 0.24 b | 0.99 ± 0.34 b | 1.48 ± 0.44 a | 0.87 ± 0.30 b |
| Heptadecanoic acid | 1.00 ± 0.42 b | 0.94 ± 0.34 ab | 1.37 ± 0.37 a | 1.36 ± 0.40 a |
| Hexadecylglycerol | 1.00 ± 0.71 b | 0.57 ± 0.31 b | 2.94 ± 1.31 b | 7.83 ± 5.34 a |
| Isomaltose | 1.00 ± 0.97 a | 0.47 ± 0.47 ab | 0.16 ± 0.03 b | 0.19 ± 0.05 b |
| Isothreonic acid | 1.00 ± 0.70 a | 0.56 ± 0.58 ab | 0.37 ± 0.34 b | 0.36 ± 0.40 b |
| Linoleic acid | 1.00 ± 0.40 c | 0.95 ± 0.41 c | 3.26 ± 0.76 b | 6.64 ± 2.38 a |
| Lysine | 1.00 ± 0.40 ab | 0.90 ± 0.36 b | 1.66 ± 0.76 a | 1.32 ± 0.67 ab |
| Maltose | 1.00 ± 0.53 a | 0.56 ± 0.26 b | 0.16 ± 0.07 c | 0.20 ± 0.25 c |
| N-acetylglutamate | 1.00 ± 0.65 a | 1.96 ± 0.92 b | 0.47 ± 0.31 b | 0.56 ± 0.26 b |
| Nicotinic acid | 1.00 ± 0.42 ab | 1.19 ± 0.33 a | 0.79 ± 0.19 b | 0.69 ± 0.17 b |
| Octadecanol | 1.00 ± 0.55 b | 0.81 ± 0.31 b | 1.16 ± 0.41 ab | 1.91 ± 1.35 a |
| Octadecylglycerol | 1.00 ± 0.53 b | 0.66 ± 0.31 b | 2.93 ± 0.98 b | 7.08 ± 4.28 a |
| Oleic acid | 1.00 ± 0.25 b | 0.92 ± 0.40 b | 2.71 ± 1.17 b | 8.47 ± 5.08 a |
| Palmitic acid | 1.00 ± 0.26 c | 1.00 ±0.26 c | 2.12 ± 0.29 b | 3.44 ± 1.01 a |
| Palmitoleic acid | 1.00 ± 0.53 b | 0.81 ± 0.37 b | 2.24 ± 1.03 b | 4.07 ± 2.17 a |
| Phenylacetic acid | 1.00 ± 0.37 c | 1.29 ± 0.56 bc | 1.74 ± 0.61 ab | 1.95 ± 0.66 a |
| Pimelic acid | 1.00 ± 0.26 b | 0.88 ± 0.29 b | 1.35 ± 0.29 a | 1.00 ± 0.21 b |
| p-tolyl glucuronide | 1.00 ± 0.73 b | 0.83 ± 0.95 b | 1.01 ± 0.72 b | 2.33 ± 1.79 a |
| Putrescine | 1.00 ± 0.38 b | 0.56 ± 0.29 b | 4.71 ± 5.34 a | 2.58 ± 2.18 ab |
| Sophorose | 1.00 ± 1.20 a | 0.31 ± 0.35 b | 0.09 ± 0.05 b | 0.08 ± 0.05 b |
| Stearic acid | 1.00 ± 0.24 c | 1.12 ± 0.42 c | 2.45 ± 0.63 b | 3.15 ± 0.89 a |
| Stigmasterol | 1.00 ± 0.33 b | 0.87 ± 0.42 b | 1.90 ± 0.99 a | 1.13 ± 0.86 b |
| Tartaric acid | 1.00 ± 1.20 a | 0.58 ± 0.74 ab | 0.10 ± 0.05 b | 0.10 ± 0.10 b |
| Threonic acid | 1.00 ± 0.67 a | 0.40 ± 0.31 b | 0.49 ± 0.37 b | 0.38 ± 0.31 b |
| Thymine | 1.00 ± 0.25 ab | 1.13 ± 0.30 a | 0.59 ± 0.30 c | 0.70 ± 0.26 bc |
| Tocopherol beta | 1.00 ± 0.29 c | 1.07 ± 0.47 c | 5.44 ± 2.24 a | 3.64 ± 1.80 b |
| Triethanolamine | 1.00 ± 0.28 ab | 0.86 ± 0.32 b | 1.28 ± 0.54 a | 0.85 ± 0.24 b |
| Tyramine | 1.00 ± 0.66 b | 1.77 ± 1.16 ab | 2.82 ± 1.56 a | 1.79 ± 1.16 ab |
| UDP-N-acetylglucosamine | 1.00 ± 0.39 b | 1.47 ± 0.50 a | 1.06 ± 0.36 ab | 0.88 ± 0.38 b |
| Uracil | 1.00 ± 0.32 ab | 1.14 ± 0.30 a | 0.71 ± 0.22 b | 0.78 ± 0.23 b |
| Urocanic acid | 1.00 ± 0.28 a | 0.86 ± 0.23 ab | 0.81 ± 0.25 ab | 0.70 ± 0.13 b |
| 1,3-Diaminopropane | 1.00 ± 0.42 bc | 0.68 ± 0.21 c | 3.20 ± 2.42 a | 1.99 ± 1.28 ab |
| 1-Hexadecanol | 1.00 ± 0.72 b | 1.04 ± 0.82 b | 1.15 ± 0.82 ab | 2.71 ± 2.46 a |
| 1-Monoolein | 1.00 ± 0.57 a | 0.71 ± 0.38 ab | 0.39 ± 0.12 b | 0.40 ± 0.16 b |
| 2-Hydroxyvaleric acid | 1.00 ± 0.20 b | 1.11 ± 0.40 ab | 1.45 ± 0.34 a | 1.25 ± 0.27 ab |
| 2-Methylglyceric acid | 1.00 ± 0.27 b | 1.01 ± 0.37 b | 1.43 ± 0.31 a | 1.08 ± 0.27 b |
| 3-Epicholic acid | 1.00 ± 1.32 ab | 0.53 ± 0.55 b | 2.20 ± 2.41 a | 0.47 ± 0.36 b |
| 3-Hydroxy-3-methyglutaric acid | 1.00 ± 0.26 ab | 0.89 ± 0.46 b | 1.45 ± 0.57 a | 1.02 ± 0.36 ab |
| 3-Phenyllactic acid | 1.00 ± 0.35 ab | 0.98 ± 0.60 a | 0.55 ± 0.23 bc | 0.48 ± 0.18 c |
| 4-Aminobutyric acid | 1.00 ± 0.26 b | 0.89 ± 0.22 b | 1.63 ± 1.00 a | 0.83 ± 0.25 b |
| 6-Hydroxynicotinic acid | 1.00 ± 0.30 b | 0.96 ± 0.40 b | 2.34 ± 0.40 a | 1.14 ± 0.38 b |
| A | ||||
| KEGG Pathway | Total Compounds | Hits | FDR p | Impact *** |
| Biosynthesis of unsaturated fatty acids | 36 | 5 | 2.10 × 10⁻⁸ | 0.00 |
| Fatty acid biosynthesis | 47 | 1 | 1.46 × 10⁻⁶ | 0.01 |
| Fatty acid elongation | 39 | 1 | 1.46 × 10⁻⁶ | 0.00 |
| Linoleic acid metabolism | 5 | 1 | 1.46 × 10⁻⁶ | 1.00 |
| Fatty acid degradation | 39 | 2 | 4.93 × 10⁻⁵ | 0.00 |
| Beta-alanine metabolism | 21 | 4 | 3.54 × 10⁻⁴ | 0.40 |
| Primary bile acid biosynthesis | 46 | 1 | 2.54 × 10⁻³ | 0.03 |
| Steroid biosynthesis | 42 | 1 | 2.54 × 10⁻³ | 0.03 |
| B | ||||
| KEGG Pathway | Total Compounds | Hits | FDR p | Impact *** |
| Linoleic acid metabolism | 5 | 1 | 2.48 × 10⁻⁴ | 1.00 |
| Fatty acid degradation | 39 | 2 | 3.75 × 10⁻⁴ | 0.00 |
| Biosynthesis of unsaturated fatty acids | 36 | 5 | 3.75 × 10⁻⁴ | 0.00 |
| Fatty acid biosynthesis | 47 | 1 | 5.73 × 10⁻³ | 0.01 |
| Fatty acid elongation | 39 | 1 | 5.73 × 10⁻³ | 0.00 |
| Butanoate metabolism | 15 | 1 | 7.03 × 10⁻³ | 0.03 |
| Alanine, aspartate, and glutamate metabolism | 28 | 4 | 7.13 × 10⁻³ | 0.31 |
| Glyoxylate and dicarboxylate metabolism | 32 | 2 | 7.13 × 10⁻³ | 0.11 |
Publisher’s Note: MDPI stays neutral with regard to jurisdictional claims in published maps and institutional affiliations. |
© 2022 by the authors. Licensee MDPI, Basel, Switzerland. This article is an open access article distributed under the terms and conditions of the Creative Commons Attribution (CC BY) license (https://creativecommons.org/licenses/by/4.0/).
Share and Cite
Zeng, H.; Safratowich, B.D.; Cheng, W.-H.; Magnuson, A.D.; Picklo, M.J. Changes in the Fecal Metabolome Accompany an Increase in Aberrant Crypt Foci in the Colon of C57BL/6 Mice Fed with a High-Fat Diet. Biomedicines 2022, 10, 2891. https://doi.org/10.3390/biomedicines10112891
Zeng H, Safratowich BD, Cheng W-H, Magnuson AD, Picklo MJ. Changes in the Fecal Metabolome Accompany an Increase in Aberrant Crypt Foci in the Colon of C57BL/6 Mice Fed with a High-Fat Diet. Biomedicines. 2022; 10(11):2891. https://doi.org/10.3390/biomedicines10112891
Chicago/Turabian StyleZeng, Huawei, Bryan D. Safratowich, Wen-Hsing Cheng, Andrew D. Magnuson, and Matthew J. Picklo. 2022. "Changes in the Fecal Metabolome Accompany an Increase in Aberrant Crypt Foci in the Colon of C57BL/6 Mice Fed with a High-Fat Diet" Biomedicines 10, no. 11: 2891. https://doi.org/10.3390/biomedicines10112891
APA StyleZeng, H., Safratowich, B. D., Cheng, W.-H., Magnuson, A. D., & Picklo, M. J. (2022). Changes in the Fecal Metabolome Accompany an Increase in Aberrant Crypt Foci in the Colon of C57BL/6 Mice Fed with a High-Fat Diet. Biomedicines, 10(11), 2891. https://doi.org/10.3390/biomedicines10112891


