
Plasma Fatty Acid Composition Is Associated with Histological Findings of Nonalcoholic Steatohepatitis
 ,
,  , , , and
Abstract
1. Introduction
2. Materials and Methods
2.1. Patients
2.2. Measurements
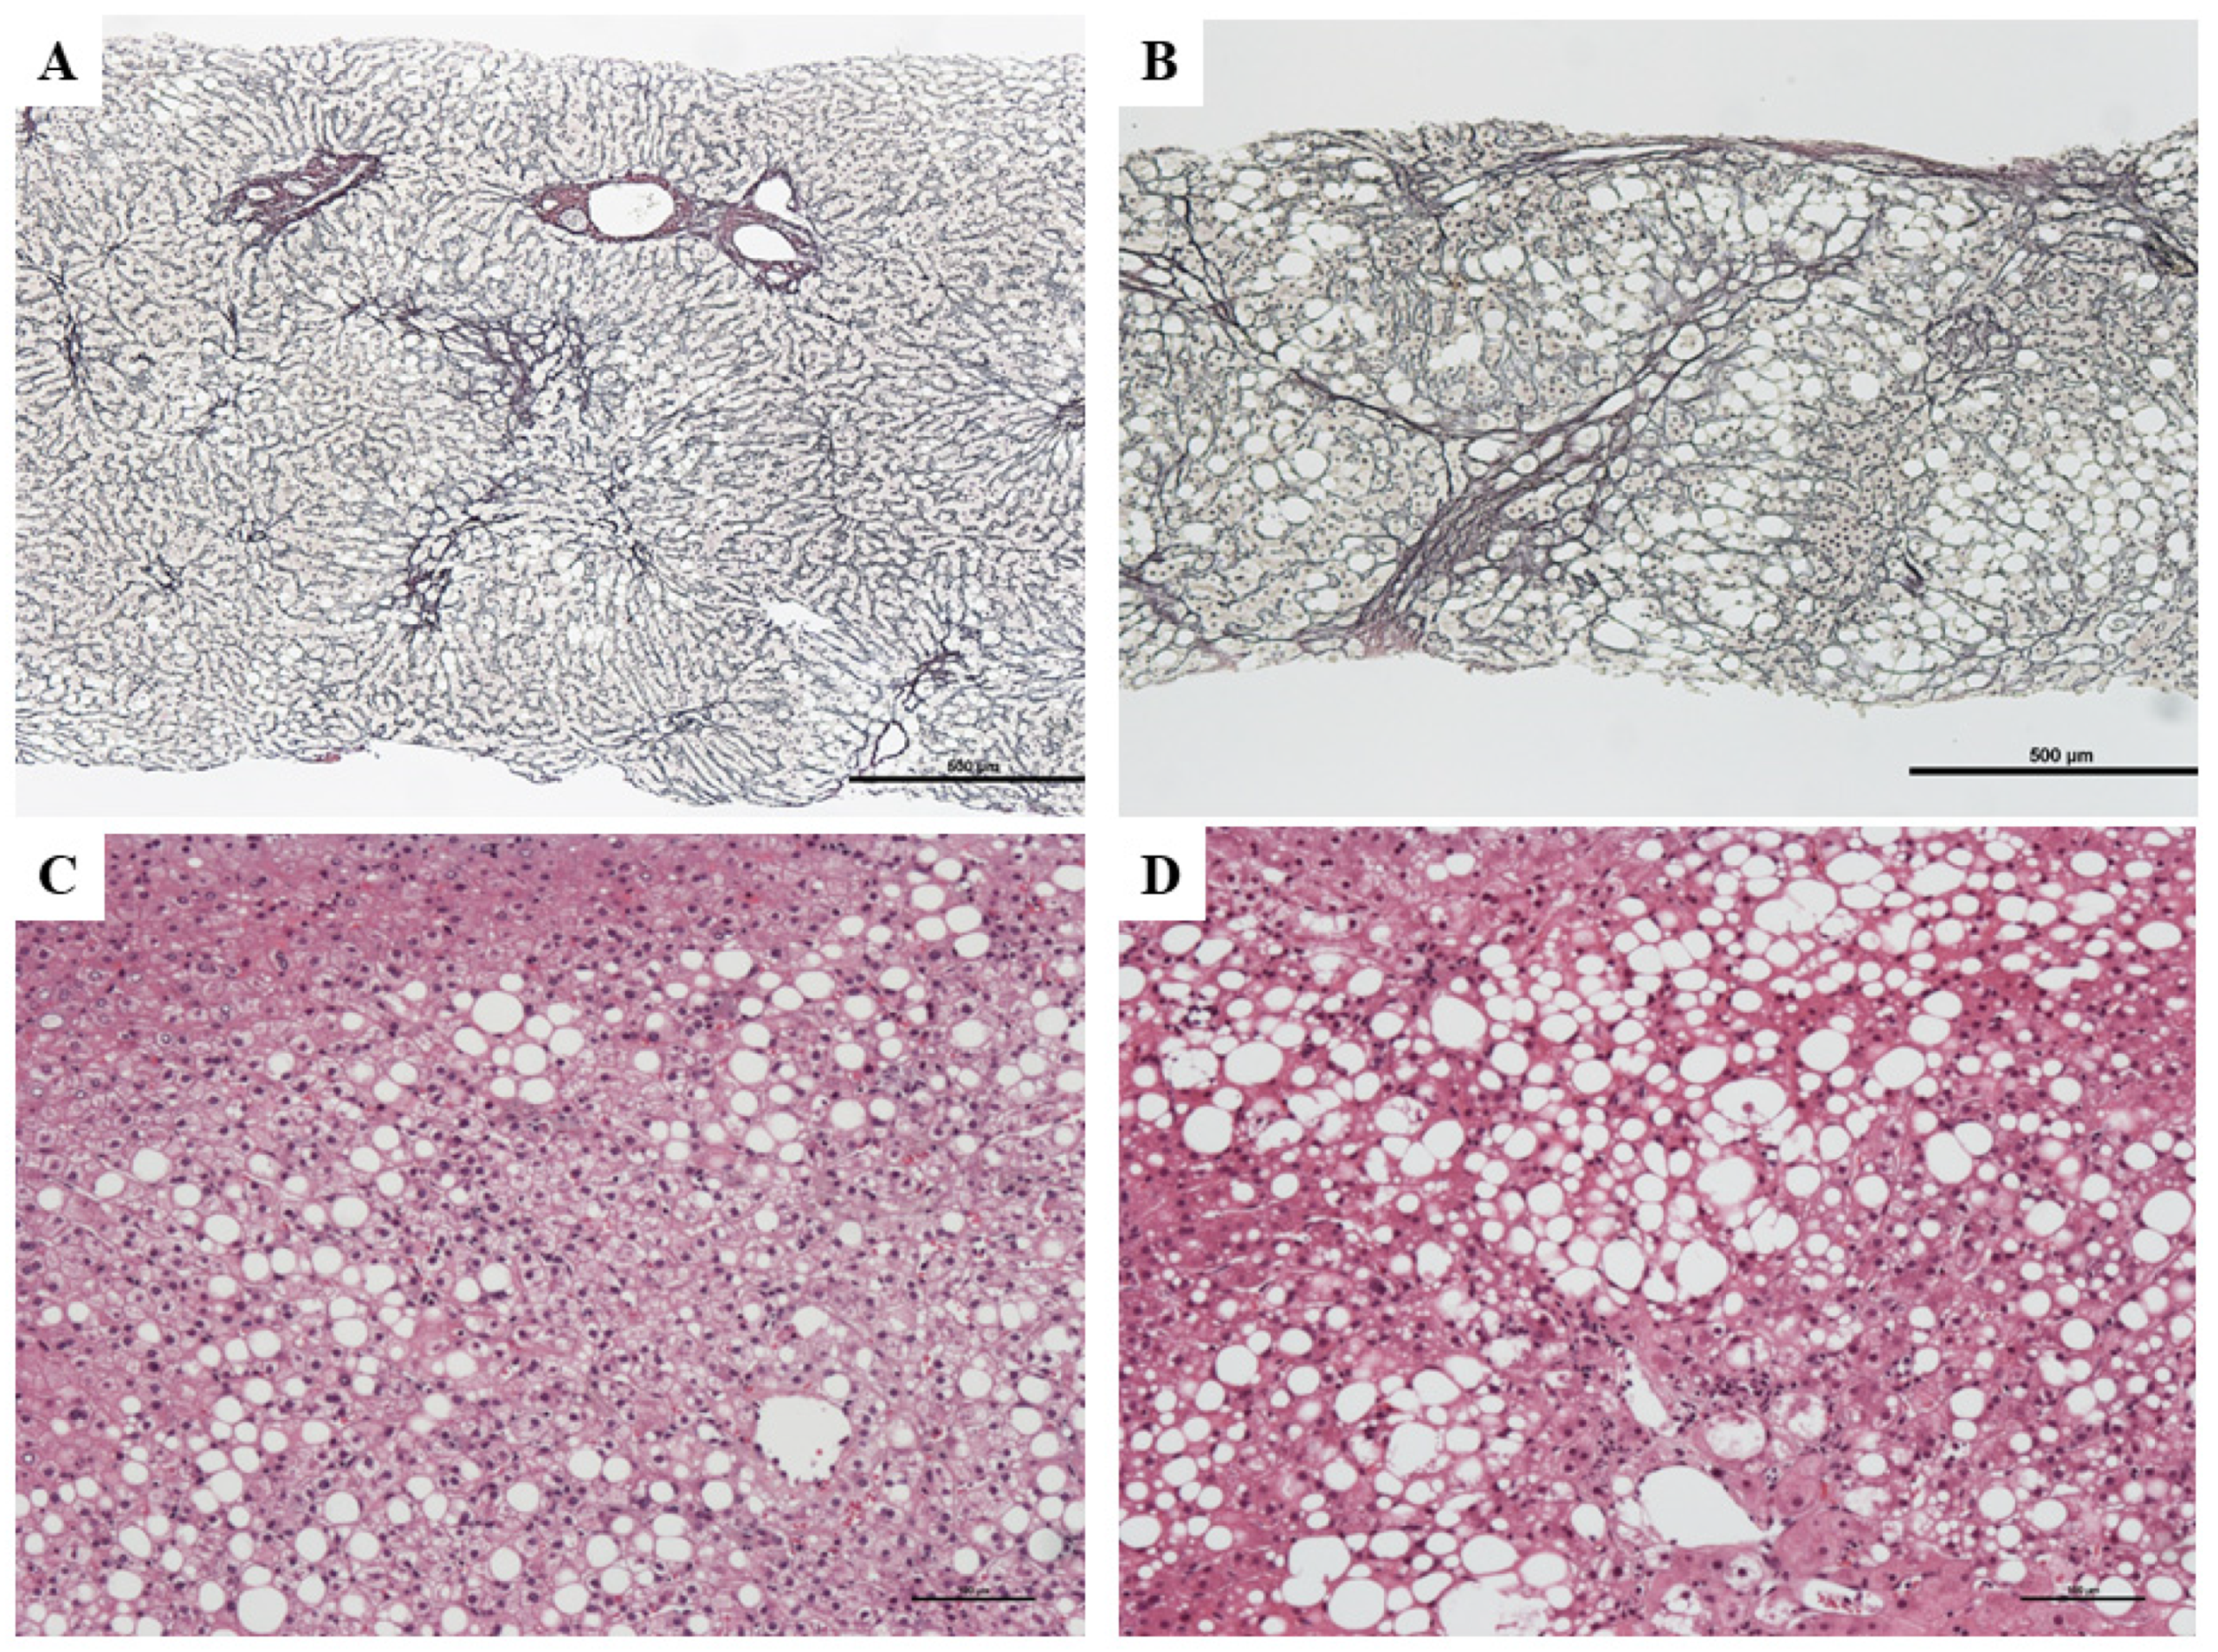
2.3. Histological Evaluation
2.4. Statistical Analysis
3. Results
3.1. Patient Characteristics
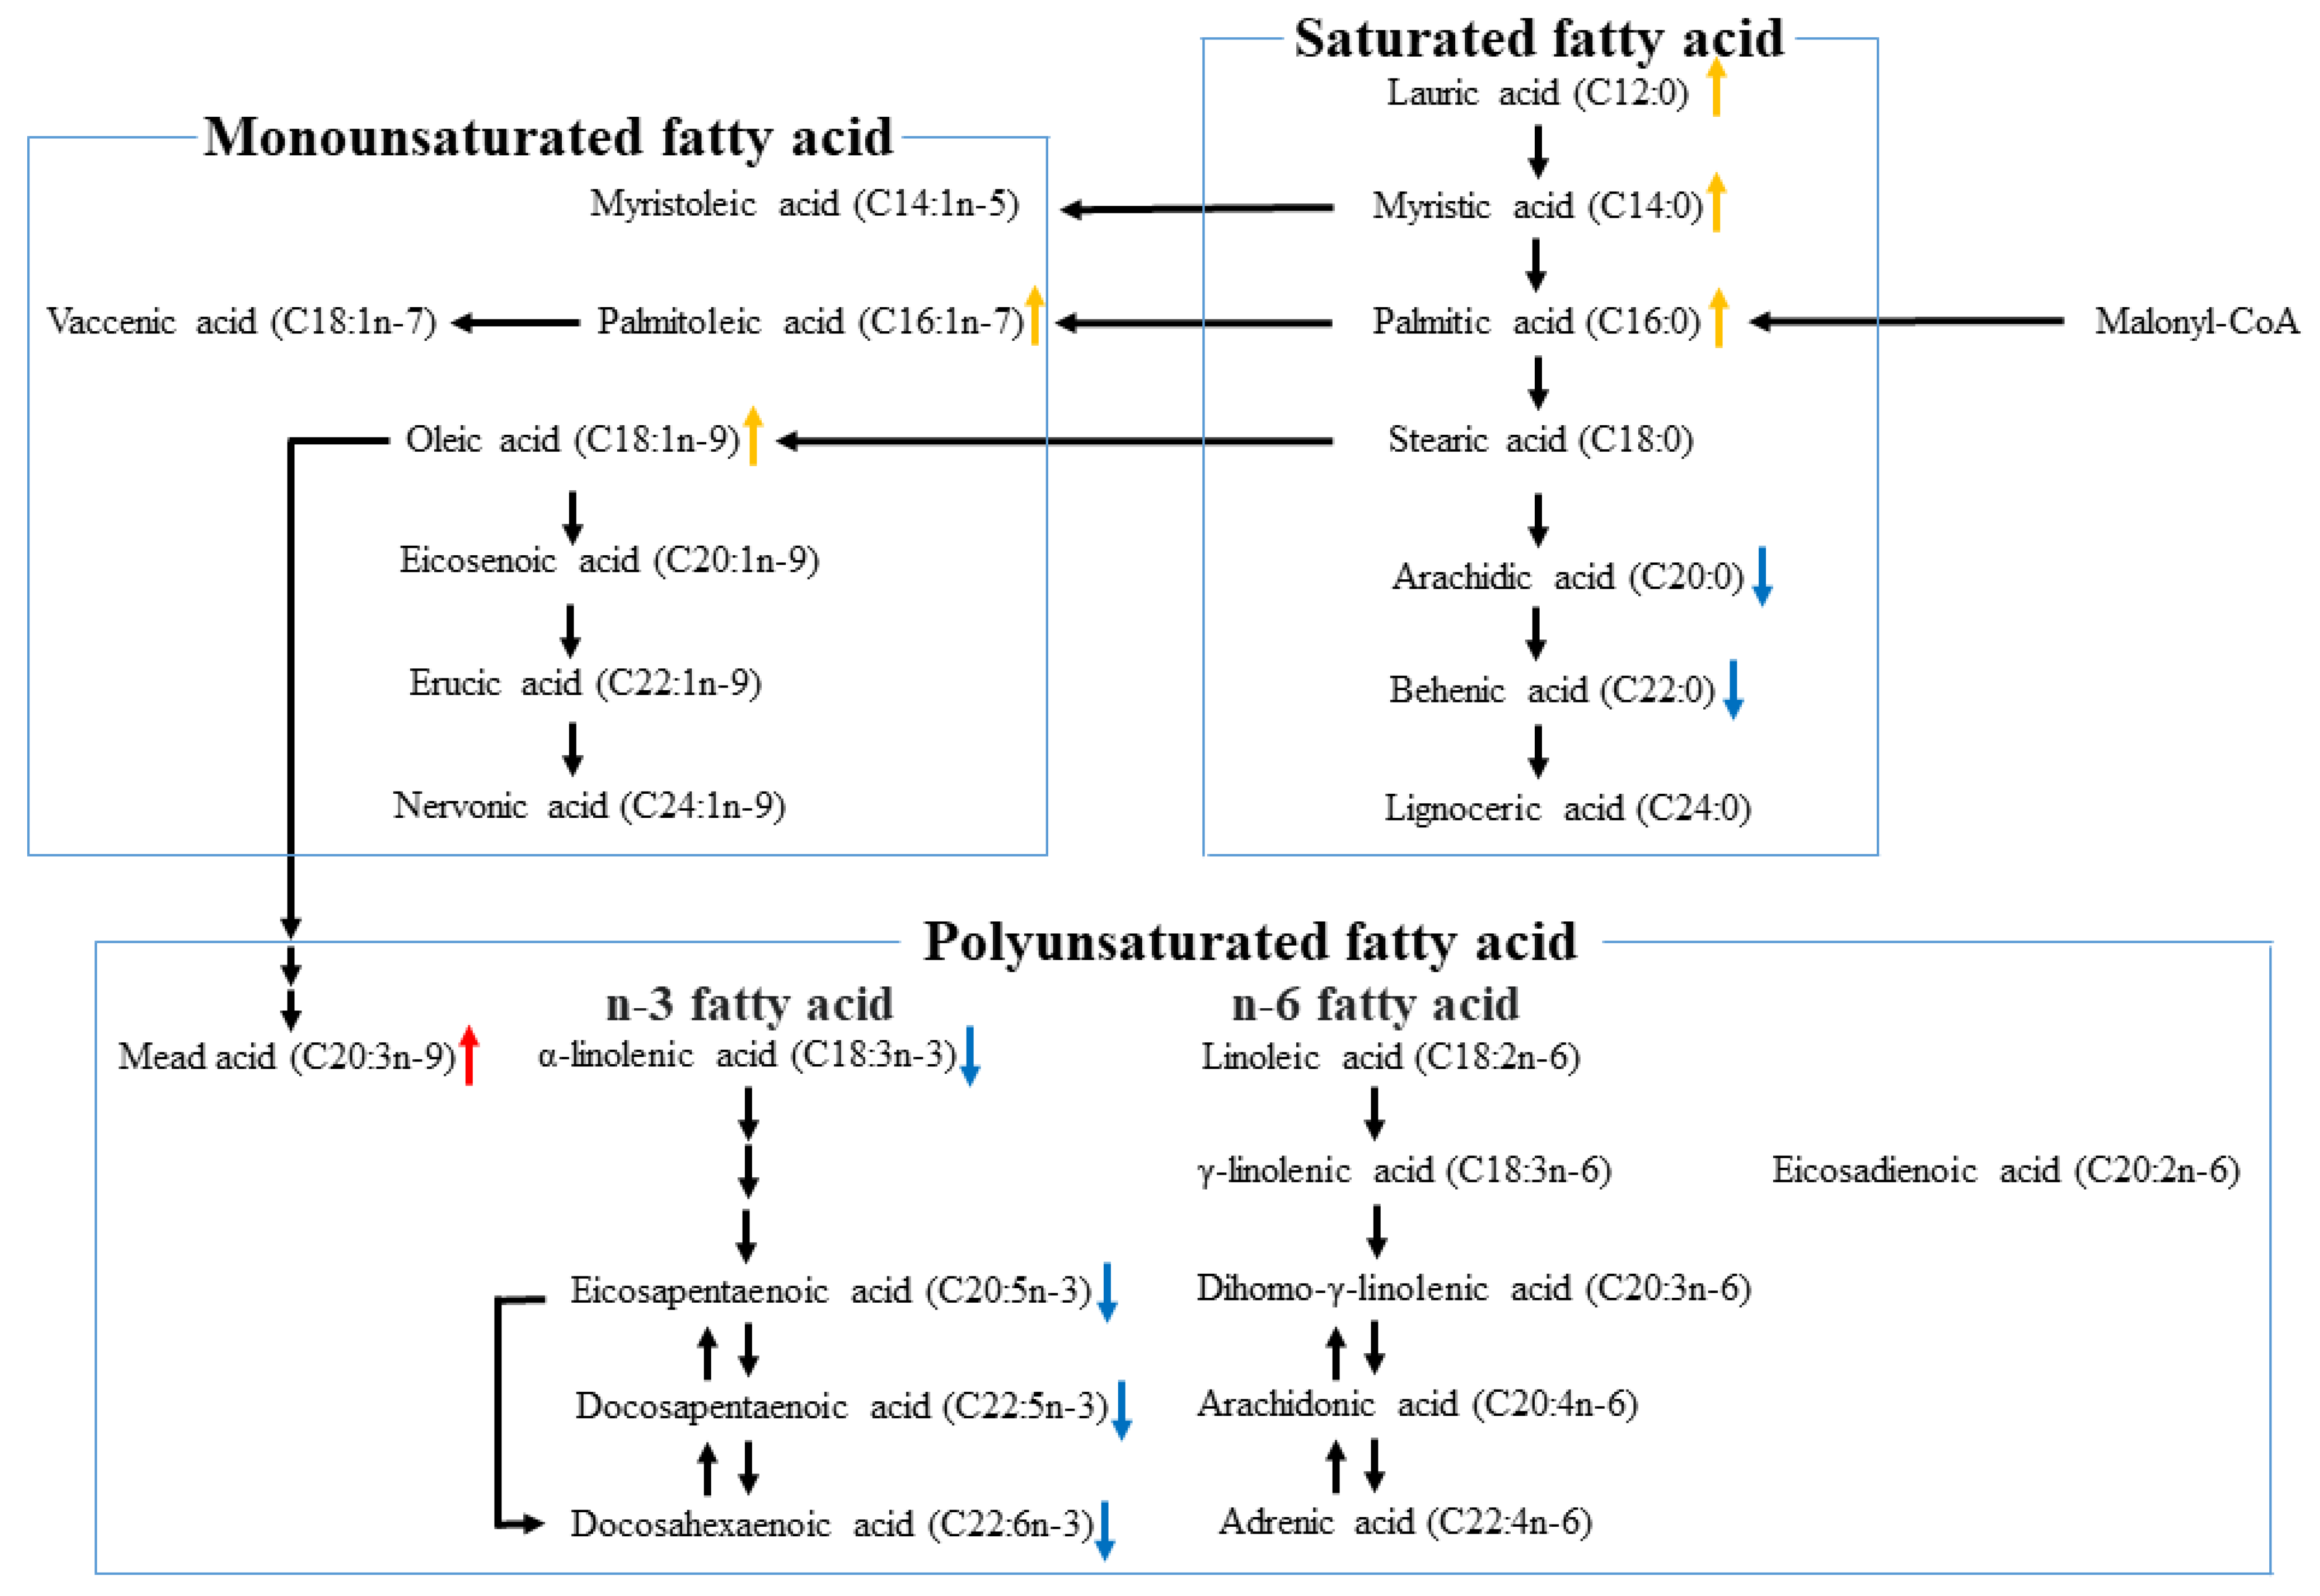
3.2. Plasma Fatty Acid Compositions in NAFLD
3.3. Relationship between Fatty Acid Levels and Histological Findings
4. Discussion
Author Contributions
Funding
Institutional Review Board Statement
Informed Consent Statement
Data Availability Statement
Conflicts of Interest
References
- Jepsen, P.; Grønbæk, H. Prognosis and staging of non-alcoholic fatty liver disease. BMJ 2011, 343, d7302. [Google Scholar] [CrossRef] [PubMed]
- Marchesini, G.; Bugianesi, E.; Forlani, G.; Cerrelli, F.; Lenzi, M.; Manini, R.; Natale, S.; Vanni, E.; Villanova, N.; Melchionda, N.; et al. Nonalcoholic fatty liver, steatohepatitis, and the metabolic syndrome. Hepatology 2003, 37, 917–923. [Google Scholar] [CrossRef]
- Marchesini, G.; Brizi, M.; Bianchi, G.; Tomassetti, S.; Bugianesi, E.; Lenzi, M.; McCullough, A.J.; Natale, S.; Forlani, G.; Melchionda, N. Nonalcoholic fatty liver disease: A feature of the metabolic syndrome. Diabetes 2001, 50, 1844–1850. [Google Scholar] [CrossRef] [PubMed]
- Sanyal, A.J. American Gastroenterological Association. AGA technical review on nonalcoholic fatty liver disease. Gastroenterology 2002, 123, 1705–1725. [Google Scholar] [CrossRef] [PubMed]
- Yoshioka, Y.; Hashimoto, E.; Yatsuji, S.; Kaneda, H.; Taniai, M.; Tokushige, K.; Shiratori, K. Nonalcoholic steatohepatitis: Cirrhosis, hepatocellular carcinoma, and burnt-out NASH. J. Gastroenterol. 2004, 39, 1215–1218. [Google Scholar] [CrossRef]
- Shimada, M.; Hashimoto, E.; Taniai, M.; Hasegawa, K.; Okuda, H.; Hayashi, N.; Takasaki, K.; Ludwig, J. Hepatocellular carcinoma in patients with non-alcoholic steatohepatitis. J. Hepatol. 2002, 37, 154–160. [Google Scholar] [CrossRef]
- Wang, L.; Folsom, A.R.; Zheng, Z.J.; Pankow, J.S.; Eckfeldt, J.H.; ARIC Study Investigators. Plasma fatty acid composition and incidence of diabetes in middle-aged adults: The Atherosclerosis Risk in Communities (ARIC) Study. Am. J. Clin. Nutr. 2003, 78, 91–98. [Google Scholar] [CrossRef]
- Patel, P.S.; Sharp, S.J.; Jansen, E.; Luben, R.N.; Khaw, K.T.; Wareham, N.J.; Forouhi, N.G. Fatty acids measured in plasma and erythrocyte-membrane phospholipids and derived by food-frequency questionnaire and the risk of new-onset type 2 diabetes: A pilot study in the European Prospective Investigation into Cancer and Nutrition (EPIC)-Norfolk cohort. Am. J. Clin. Nutr. 2010, 92, 1214–1222. [Google Scholar] [CrossRef] [PubMed]
- Hodge, A.M.; English, D.R.; O’Dea, K.; Sinclair, A.J.; Makrides, M.; Gibson, R.A.; Giles, G.G. Plasma phospholipid and dietary fatty acids as predictors of type 2 diabetes: Interpreting the role of linoleic acid. Am. J. Clin. Nutr. 2007, 86, 189–197. [Google Scholar] [CrossRef] [PubMed]
- Lemaitre, R.N.; Fretts, A.M.; Sitlani, C.M.; Biggs, M.L.; Mukamal, K.; King, I.B.; Song, X.; Djoussé, L.; Siscovick, D.S.; McKnight, B.; et al. Plasma phospholipid very-long-chain saturated fatty acids and incident diabetes in older adults: The Cardiovascular Health Study. Am. J. Clin. Nutr. 2015, 101, 1047–1054. [Google Scholar] [CrossRef] [PubMed]
- Fretts, A.M.; Imamura, F.; Marklund, M.; Micha, R.; Wu, J.H.; Murphy, R.A.; Chien, K.L.; McKnight, B.; Tintle, N.; Forouhi, N.G.; et al. Associations of circulating very-long-chain saturated fatty acids and incident type 2 diabetes: A pooled analysis of prospective cohort studies. Am. J. Clin. Nutr. 2019, 109, 1216–1223. [Google Scholar] [CrossRef]
- Liu, M.; Zuo, L.S.; Sun, T.Y.; Wu, Y.Y.; Liu, Y.P.; Zeng, F.F.; Chen, Y.M. Circulating very-long-chain saturated fatty acids were inversely associated with cardiovascular health: A prospective cohort study and meta-analysis. Nutrients 2020, 12, 2709. [Google Scholar] [CrossRef] [PubMed]
- Jiang, H.; Wang, L.; Wang, D.; Yan, N.; Li, C.; Wu, M.; Wang, F.; Mi, B.; Chen, F.; Jia, W.; et al. Omega-3 polyunsaturated fatty acid biomarkers and risk of type 2 diabetes, cardiovascular disease, cancer, and mortality. Clin. Nutr. 2022, 41, 1798–1807. [Google Scholar] [CrossRef]
- Wang, Z.H.; Zheng, K.I.; Wang, X.D.; Qiao, J.; Li, Y.Y.; Zhang, L.; Zheng, M.H.; Wu, J. LC-MS-based lipidomic analysis in distinguishing patients with nonalcoholic steatohepatitis from nonalcoholic fatty liver. Hepatobiliary Pancreat. Dis. Int. 2021, 20, 452–459. [Google Scholar] [CrossRef] [PubMed]
- Yamada, K.; Mizukoshi, E.; Sunagozaka, H.; Arai, K.; Yamashita, T.; Takeshita, Y.; Misu, H.; Takamura, T.; Kitamura, S.; Zen, Y.; et al. Characteristics of hepatic fatty acid compositions in patients with nonalcoholic steatohepatitis. Liver Int. 2015, 35, 582–590. [Google Scholar] [CrossRef] [PubMed]
- Rosqvist, F.; Fridén, M.; Vessby, J.; Hockings, P.; Hulthe, J.; Gummesson, A.; Niessen, H.G.; Schultheis, C.; Wanders, A.; Ahlström, H.; et al. Fatty acids in multiple circulating lipid fractions reflects the composition of liver triglycerides in humans. Clin. Nutr. 2022, 41, 805–809. [Google Scholar] [CrossRef]
- Fridén, M.; Rosqvist, F.; Ahlström, H.; Niessen, H.G.; Schultheis, C.; Hockings, P.; Hulthe, J.; Gummesson, A.; Wanders, A.; Rorsman, F.; et al. Hepatic unsaturated fatty acids are linked to lower degree of fibrosis in non-alcoholic fatty liver disease. Front. Med. 2022, 8, 814951. [Google Scholar] [CrossRef]
- Kleiner, D.E.; Brunt, E.M.; Van Natta, M.; Behling, C.; Contos, M.J.; Cummings, O.W.; Ferrell, L.D.; Liu, Y.C.; Torbenson, M.S.; Unalp-Arida, A.; et al. Design and validation of a histological scoring system for nonalcoholic fatty liver disease. Hepatology 2005, 41, 1313–1321. [Google Scholar] [CrossRef]
- Konishi, K.; Miyake, T.; Furukawa, S.; Senba, H.; Kanzaki, S.; Nakaguchi, H.; Yukimoto, A.; Nakamura, Y.; Watanabe, T.; Koizumi, Y.; et al. Advanced fibrosis of non-alcoholic steatohepatitis affects the significance of lipoprotein(a) as a cardiovascular risk factor. Atherosclerosis 2020, 299, 32–37. [Google Scholar] [CrossRef] [PubMed]
- Decsi, T.; Boehm, G.; Tjoonk, H.M.; Molnár, S.; Dijck-Brouwer, D.A.; Hadders-Algra, M.; Martini, I.A.; Muskiet, F.A.; Boersma, E.R. Trans isomeric octadecenoic acids are related inversely to arachidonic acid and DHA and positively related to mead acid in umbilical vessel wall lipids. Lipids 2002, 37, 959–965. [Google Scholar] [CrossRef] [PubMed]
- Araya, J.; Rodrigo, R.; Videla, L.A.; Thielemann, L.; Orellana, M.; Pettinelli, P.; Poniachik, J. Increase in long-chain polyunsaturated fatty acid n-6/n-3 ratio in relation to hepatic steatosis in patients with non-alcoholic fatty liver disease. Clin. Sci. 2004, 106, 635–643. [Google Scholar] [CrossRef] [PubMed]
- Puri, P.; Baillie, R.A.; Wiest, M.M.; Mirshahi, F.; Choudhury, J.; Cheung, O.; Sargeant, C.; Contos, M.J.; Sanyal, A.J. A lipidomic analysis of nonalcoholic fatty liver disease. Hepatology 2007, 46, 1081–1090. [Google Scholar] [CrossRef] [PubMed]
- Allard, J.P.; Aghdassi, E.; Mohammed, S.; Raman, M.; Avand, G.; Arendt, B.M.; Jalali, P.; Kandasamy, T.; Prayitno, N.; Sherman, M.; et al. Nutritional assessment and hepatic fatty acid composition in non-alcoholic fatty liver disease (NAFLD): A cross-sectional study. J. Hepatol. 2008, 48, 300–307. [Google Scholar] [CrossRef] [PubMed]
- Roumans, K.H.M.; Lindeboom, L.; Veeraiah, P.; Remie, C.M.; Phielix, E.; Havekes, B.; Bruls, Y.M.; Brouwers, M.C.; Ståhlman, M.; Alssema, M.; et al. Hepatic saturated fatty acid fraction is associated with de novo lipogenesis and hepatic insulin resistance. Nat. Commun. 2020, 11, 1891. [Google Scholar] [CrossRef]
- Lauritzen, L.; Hellgren, L.I. Plasma phospholipid very-long-chain saturated fatty acids: A sensitive marker of metabolic dysfunction or an indicator of specific healthy dietary components? Am. J. Clin. Nutr. 2015, 101, 901–902. [Google Scholar] [CrossRef]
- Kotronen, A.; Seppänen-Laakso, T.; Westerbacka, J.; Kiviluoto, T.; Arola, J.; Ruskeepaa, A.L.; Oresic, M.; Yki-Jarvinen, H. Hepatic stearoyl-CoA desaturase (SCD)-1 activity and diacylglycerol but not ceramide concentrations are increased in the nonalcoholic human fatty liver. Diabetes 2009, 58, 203–208. [Google Scholar] [CrossRef]
- Xu, J.; Nakamura, M.T.; Cho, H.P.; Clarke, S.D. Sterol regulatory element binding protein-1 expression is suppressed by dietary polyunsaturated fatty acids. A mechanism for the coordinate suppression of lipogenic genes by polyunsaturated fats. J. Biol. Chem. 1999, 274, 23577–23583. [Google Scholar] [CrossRef]
- Ntambi, J.M.; Sessler, A.M.; Takova, T. A model cell line to study regulation of stearoyl-CoA desaturase gene 1 expression by insulin and polyunsaturated fatty acids. Biochem. Biophys. Res. Commun. 1996, 220, 990–995. [Google Scholar] [CrossRef]
- Nakamura, M.T.; Nara, T.Y. Structure, function, and dietary regulation of delta6, delta5, and delta9 desaturases. Annu. Rev. Nutr. 2004, 24, 345–376. [Google Scholar] [CrossRef]


| Age, Year | 59 (46–67) |
| Sex, N (Men/Women) | 101/134 |
| BMI, kg/m2 | 27.4 (24.1–30.3) |
| ALT, U/L | 63 (37–102) |
| GGT, U/L | 62 (37–113) |
| Cre, mg/dL | 0.68 (0.57–0.85) |
| HbA1c, % | 6.2 (5.7–7.2) |
| TC, mg/dL | 194 (168–220) |
| TG, mg/dL | 130 (92–173) |
| Stage (0/1a,1b,1c/2/3/4), N | (52/55/33/35/60) |
| NAS (0/1/2/3/4/5/6/7/8), N | (0/18/19/35/40/47/35/29/12) |
| Antidiabetic agents, N | |
| Biguanide | 46 |
| Dipeptidyl peptidase-4 inhibitor | 36 |
| Sulfonylurea | 21 |
| Alpha-glucosidase inhibitor | 8 |
| Pioglitazone | 4 |
| Glinide | 5 |
| Glucagon like peptide-1receptor agonist | 6 |
| Sodium-glucose transport protein 2 inhibitor | 6 |
| Insulin | 19 |
| Lipid-lowering agents, N | |
| Statin | 55 |
| Ezetimibe | 3 |
| Colestilan | 0 |
| Fibrate | 6 |
| Eicosapentaenoic acid ethyl ester | 7 |
| Saturated fatty acid, μg/mL | |
| Lauric acid (12:0) | 1.7 (1.1–2.7) |
| Myristic acid (14:0) | 25.3 (19–34.9) |
| Palmitic acid (16:0) | 767.7 (654.2–914) |
| Stearic acid (18:0) | 225.6 (192.6–258.2) |
| Arachidic acid (20:0) | 7.8 (6.6–8.9) |
| Behenic acid (22:0) | 19.2 (16.5–21.9) |
| Lignoceric acid (24:0) | 16.5 (14.2–19.3) |
| Monounsaturated fatty acid, μg/mL | |
| Myristoleic acid (14:1n5) | 1.1 (0.1–1.8) |
| Palmitoleic acid (16:1n7) | 77.8 (59.2–106.9) |
| Oleic acid (18:1n9) | 714.8 (599.5–887.8) |
| Eicosenoic acid (20:1n9) | 5.0 (4.1–6.4) |
| Erucic acid (22:1n9) | 1.2 (1.0–1.6) |
| Nervonic acid (24:1n9) | 36.1 (31.5–41.3) |
| Polyunsaturated fatty acid, μg/mL | |
| Linoleic acid (18:2n6) | 814.9 (697.6–950.7) |
| γ-linolenic acid (18:3n6) | 10.3 (7.4–14.4) |
| α-linolenic acid (18:3n3) | 21.7 (17.2–28.6) |
| Eicosadienoic acid (20:2n6) | 6.5 (5.5–7.8) |
| Mead acid (20:3n9) | 2.6 (1.7–3.9) |
| Dihomo-γ-linolenic acid (20:3n6) | 48.4 (36.9–60.2) |
| Arachidonic acid (20:4n6) | 196.4 (168.4–234.0) |
| Eicosapentaenoic acid (20:5n3) | 47.8 (29.4–70.0) |
| Adrenic acid (22:4n6) | 5.7 (4.5–7.2) |
| Docosapentaenoic acid (22:5n3) | 19.8 (16.2–24.8) |
| Docosahexaenoic acid (22:6n3) | 138.5 (112.1–171.9) |
| Stage 0–2 (n = 140) | Stage 3–4 (n = 95) | p-Value | |
|---|---|---|---|
| Age, year | 54 (40.3–64) | 62 (55–69) | <0.01 |
| Sex, N (Men/Women) | 66/74 | 35/60 | 0.12 |
| BMI, kg/m2 | 26.4 (23.8–29.7) | 28.7 (25.0–31.4) | 0.01 |
| ALT, U/L | 60.5 (36.3–102) | 65 (37–103) | 0.64 |
| GGT, U/L | 51 (30.3–111.8) | 78 (49–118) | <0.01 |
| Cre, mg/dL | 0.71 (0.56–0.85) | 0.66 (0.59–0.85) | 0.49 |
| HbA1c, % | 6.0 (5.6–6.8) | 6.6 (6.0–7.7) | <0.01 |
| TC, mg/dL | 196 (173.3–223) | 191 (161–211) | <0.01 |
| TG, mg/dL | 132.5 (97.5–172.8) | 126 (88–178) | 0.26 |
| NAS 1–4 (n = 112) | NAS 5–8 (n = 123) | p-Value | |
|---|---|---|---|
| Age, year | 60 (46–69) | 58 (46–65) | 0.49 |
| Sex, N (Men/Women) | 56/56 | 45/78 | 0.04 |
| BMI, kg/m2 | 25.6 (23.1–29.3) | 28.3 (25.2–31.4) | 0.78 |
| ALT, U/L | 38 (29–62.5) | 88 (61–124) | 0.68 |
| GGT, U/L | 45 (28–108) | 73 (48–118) | <0.01 |
| Cre, mg/dL | 0.74 (0.6–0.86) | 0.65 (0.55–0.84) | 0.10 |
| HbA1c, % | 6.1 (5.6–6.8) | 6.4 (5.9–7.6) | <0.01 |
| TC, mg/dL | 189 (164–212) | 198 (177–220) | 0.06 |
| TG, mg/dL | 122 (85–153) | 144 (101–192) | <0.01 |
| ALT r | p-Value | GGT r | p-Value | TC r | p-Value | TG r | p-Value | |
|---|---|---|---|---|---|---|---|---|
| Saturated fatty acid | ||||||||
| Lauric acid (12:0) | 0.16 | 0.01 | 0.14 | 0.03 | 0.20 | <0.01 | 0.62 | <0.01 |
| Myristic acid (14:0) | 0.27 | <0.01 | 0.28 | <0.01 | 0.33 | <0.01 | 0.84 | <0.01 |
| Palmitic acid (16:0) | 0.33 | <0.01 | 0.28 | <0.01 | 0.46 | <0.01 | 0.87 | <0.01 |
| Stearic acid (18:0) | 0.37 | <0.01 | 0.34 | <0.01 | 0.56 | <0.01 | 0.76 | <0.01 |
| Arachidic acid (20:0) | 0.23 | <0.01 | 0.09 | 0.18 | 0.66 | <0.01 | 0.27 | <0.01 |
| Behenic acid (22:0) | 0.20 | <0.01 | 0.08 | 0.21 | 0.74 | <0.01 | 0.21 | <0.01 |
| Lignoceric acid (24:0) | 0.13 | 0.045 | 0.06 | 0.39 | 0.71 | <0.01 | 0.13 | 0.04 |
| Monounsaturated fatty acid | ||||||||
| Myristoleic acid (14:1n5) | 0.07 | 0.31 | 0.15 | 0.02 | 0.04 | 0.53 | 0.37 | <0.01 |
| Palmitoleic acid (16:1n7) | 0.22 | <0.01 | 0.23 | <0.01 | 0,29 | <0.01 | 0.64 | <0.01 |
| Oleic acid (18:1n9) | 0.29 | <0.01 | 0.25 | <0.01 | 0.35 | <0.01 | 0.92 | <0.01 |
| Eicosenoic acid (20:1n9) | 0.12 | 0.08 | 0.14 | 0.03 | 0.17 | 0.01 | 0.64 | <0.01 |
| Erucic acid (22:1n9) | 0.01 | 0.85 | 0.02 | 0.75 | 0.30 | <0.01 | 0.21 | <0.01 |
| Nervonic acid (24:1n9) | 0.05 | 0.43 | −0.02 | 0.75 | 0.58 | <0.01 | −0.14 | 0.04 |
| Polyunsaturated fatty acid | ||||||||
| Linoleic acid (18:2n6) | 0.21 | <0.01 | 0.11 | 0.11 | 0.65 | <0.01 | 0.58 | <0.01 |
| γ-linolenic acid (18:3n6) | 0.14 | 0.04 | 0.24 | <0.01 | 0.33 | <0.01 | 0.50 | <0.01 |
| α-linolenic acid (18:3n3) | 0.14 | 0.04 | 0.14 | 0.04 | 0.33 | <0.01 | 0.76 | <0.01 |
| Eicosadienoic acid (20:2n6) | 0.20 | <0.01 | 0.25 | <0.01 | 0.40 | <0.01 | 0.65 | <0.01 |
| Mead acid (20:3n9) | 0.20 | <0.01 | 0.30 | <0.01 | 0.18 | <0.01 | 0.53 | <0.01 |
| Dihomo-γ-linolenic acid (20:3n6) | 0.40 | <0.01 | 0.29 | <0.01 | 0.49 | <0.01 | 0.55 | <0.01 |
| Arachidonic acid (20:4n6) | 0.23 | <0.01 | 0.21 | <0.01 | 0.44 | <0.01 | 0.37 | <0.01 |
| Eicosapentaenoic acid (20:5n3) | −0.09 | 0.17 | 0.001 | 0.99 | 0.19 | <0.01 | 0.08 | 0.23 |
| Adrenic acid (22:4n6) | 0.28 | <0.01 | 0.28 | <0.01 | 0.31 | <0.01 | 0.63 | <0.01 |
| Docosapentaenoic acid (22:5n3) | 0.16 | 0.01 | 0.20 | <0.01 | 0.37 | <0.01 | 0.53 | <0.01 |
| Docosahexaenoic acid (22:6n3) | 0.04 | 0.51 | 0.04 | 0.57 | 0.30 | <0.01 | 0.30 | <0.01 |
| Stage 0–2 (n = 140) | Stage 3–4 (n = 95) | p-Value | |
|---|---|---|---|
| Saturated fatty acid | |||
| Lauric acid (12:0) | 1.5 (1.1–2.5) | 2.0 (1.2–2.8) | 0.03 |
| Myristic acid (14:0) | 25.4 (19.1–34.5) | 24.8 (18.1–35.3) | 0.78 |
| Palmitic acid (16:0) | 767.4 (660.7–930.9) | 767.7 (650.4–891.5) | 0.68 |
| Stearic acid (18:0) | 223.3 (191.6–268.8) | 227.7 (193.0–251.4) | 0.50 |
| Arachidic acid (20:0) | 8.3 (7.0–9.3) | 7.4 (6.3–8.2) | <0.01 |
| Behenic acid (22:0) | 19.8 (17.2–22.5) | 18.3 (15.1–20.7) | <0.01 |
| Lignoceric acid (24:0) | 16.9 (14.8–19.5) | 15.6 (13.1–18.6) | <0.01 |
| Monounsaturated fatty acid | |||
| Myristoleic acid (14:1n5) | 0.9 (0.1–1.7) | 1.2 (0.1–2.0) | 0.07 |
| Palmitoleic acid (16:1n7) | 78.1 (56.2–102.5) | 77.2 (61.3–117.4) | 0.21 |
| Oleic acid (18:1n9) | 718.4 (609.1–875.6) | 705.4 (572.4–896.4) | 0.74 |
| Eicosenoic acid (20:1n9) | 4.9 (4.0–6.2) | 5.1 (4.3–6.5) | 0.47 |
| Erucic acid (22:1n9) | 1.2 (1.0–1.6) | 1.1 (1.0–1.5) | 0.24 |
| Nervonic acid (24:1n9) | 37.2 (32.0–41.7) | 34.2 (30.4–40.4) | 0.05 |
| Polyunsaturated fatty acid | |||
| Linoleic acid (18:2n6) | 828.4 (723.9–974.2) | 781.0 (667.9–876.5) | 0.02 |
| γ-linolenic acid (18:3n6) | 10.6 (7.5–15.3) | 9.7 (7.2–13.4) | 0.12 |
| α-linolenic acid (18:3n3) | 22.3 (18.6–29.5) | 20.1 (15.7–27.5) | 0.02 |
| Eicosadienoic acid (20:2n6) | 6.4 (5.4–7.7) | 6.6 (5.5–7.9) | 0.88 |
| Mead acid (20:3n9) | 2.5 (1.7–3.5) | 3 (1.7–4.3) | 0.04 |
| Dihomo-γ-linolenic acid (20:3n6) | 48.2 (38.1–60.1) | 49 (34.5–60.3) | 0.91 |
| Arachidonic acid (20:4n6) | 206.7 (176.7–241.1) | 186.8 (152.9–221.9) | <0.01 |
| Eicosapentaenoic acid (20:5n3) | 56.1 (35.2–75.1) | 40.5 (26.6–58.2) | <0.01 |
| Adrenic acid (22:4n6) | 5.6 (4.5–7.1) | 5.8 (4.6–7.5) | 0.40 |
| Docosapentaenoic acid (22:5n3) | 20.6 (17.0–25.1) | 18.6 (15.4–23.5) | 0.02 |
| Docosahexaenoic acid (22:6n3) | 150.1 (119.4–187.9) | 123.2 (102.4–150.7) | <0.01 |
| NAS 1–4 (n = 112) | NAS 5–8 (n = 123) | p-Value | |
|---|---|---|---|
| Saturated fatty acid | |||
| Lauric acid (12:0) | 1.3 (0.9–2.1) | 2.2 (1.3–3.1) | <0.01 |
| Myristic acid (14:0) | 20.5 (16.1–27.8) | 29.8 (21.9–37.6) | <0.01 |
| Palmitic acid (16:0) | 705.0 (595.5–795.0) | 842.3 (719.2–1002.9) | <0.01 |
| Stearic acid (18:0) | 208.6 (179.4–240.3) | 241.4 (212.3–268.9) | <0.01 |
| Arachidic acid (20:0) | 7.6 (6.3–8.8) | 7.9 (6.9–8.9) | 0.05 |
| Behenic acid (22:0) | 18.6 (16.0–21.8) | 19.8 (17.0–22.4) | 0.04 |
| Lignoceric acid (24:0) | 16.5 (14.4–19.1) | 16.6 (14.1–19.4) | 0.22 |
| Monounsaturated fatty acid | |||
| Myristoleic acid (14:1n5) | 0.8 (0.1–1.5) | 1.4 (0.1–2.2) | <0.01 |
| Palmitoleic acid (16:1n7) | 64.9 (51.3–87.9) | 90.1 (71.1–123.1) | <0.01 |
| Oleic acid (18:1n9) | 653.1 (543.4–785.6) | 776.1 (662.0–963.3) | <0.01 |
| Eicosenoic acid (20:1n9) | 5.5 (4.6–6.5) | 4.6 (3.8–6.0) | <0.01 |
| Erucic acid (22:1n9) | 1.1 (1.0–1.6) | 1.3 (1.0–1.6) | 0.03 |
| Nervonic acid (24:1n9) | 36.4 (31.2–41.1) | 35.7 (31.7–41.7) | 0.88 |
| Polyunsaturated fatty acid | |||
| Linoleic acid (18:2n6) | 782.5 (672.4–882.8) | 831.2 (728.6–994.1) | <0.01 |
| γ-linolenic acid (18:3n6) | 9.8 (6.6–13.9) | 10.5 (8.2–15.3) | 0.06 |
| α-linolenic acid (18:3n3) | 20.3 (15.8–25.9) | 22.4 (18.5–29.8) | 0.01 |
| Eicosadienoic acid (20:2n6) | 6.2 (5.1–7.4) | 6.7 (5.7–8.1) | <0.01 |
| Mead acid (20:3n9) | 2.3 (1.4–3.3) | 2.9 (2–4.2) | <0.01 |
| Dihomo-γ-linolenic acid (20:3n6) | 42.3 (33.2–50.6) | 53.4 (44.5–64.8) | <0.01 |
| Arachidonic acid (20:4n6) | 186.8 (148.7–223.2) | 211.1 (176.5–240.5) | 0.01 |
| Eicosapentaenoic acid (20:5n3) | 48.0 (30.1–72.5) | 47.8 (29.0–66.9) | 0.76 |
| Adrenic acid (22:4n6) | 5.2 (4.0–6.4) | 6.3 (4.9–7.8) | <0.01 |
| Docosapentaenoic acid (22:5n3) | 18.8 (15.1–23.2) | 20.7 (17.7–26.1) | <0.01 |
| Docosahexaenoic acid (22:6n3) | 129.0 (108.7–170.4) | 146.0 (114.7–176.9) | 0.10 |
| Steatosis Grade | <33% (n = 88) | 33–66% (n = 78) | >66% (n = 69) | p-Value |
|---|---|---|---|---|
| Saturated fatty acid | ||||
| Lauric acid (12:0) | 1.4 (0.9–2.25) | 1.7 (1.1–2.8) | 2.2 (1.4–3.1) | <0.05 † |
| Myristic acid (14:0) | 21.0 (17.2–27.5) | 25.5 (18.3–37.7) | 31.3 (23.5–39.9 | <0.05 † |
| Palmitic acid (16:0) | 702.1 (607.7–783.3) | 765.4 (635.2–933.4) | 882.9 (757.8–1030.6) | <0.05 *,†,‡ |
| Stearic acid (18:0) | 208.2 (179.4–241.3) | 220.5 (192.9–252.8) | 249.5 (219.9–278.0) | <0.05 †,‡ |
| Arachidic acid (20:0) | 7.3 (6.1–8.4) | 7.8 (6.7–8.8) | 8.6 (7.3–9.5) | <0.05 *,† |
| Behenic acid (22:0) | 18.1 (14.6–20.5) | 19.1 (16.4–21.9) | 21.2 (18.3–23.8) | <0.05 †,‡ |
| Lignoceric acid (24:0) | 16.0 (12.8–18.2) | 15.9 (14.6–18.9) | 18.6 (15.2–20.6) | <0.05 † |
| Monounsaturated fatty acid | ||||
| Myristoleic acid (14:1n5) | 0.8 (0.1–1.5) | 1.3 (0.1–1.8) | 1.4 (0.1–2.3) | <0.05 † |
| Palmitoleic acid (16:1n7) | 65.8 (53.6–91.6) | 75.9 (56.2–111.9) | 90.1 (76.6–127.9) | <0.05 †,‡ |
| Oleic acid (18:1n9) | 654.0 (556.1–757.9) | 714.0 (588.9–885.4) | 807.1 (686.9–993.6) | <0.05 †,‡ |
| Eicosenoic acid (20:1n9) | 4.7 (3.8–5.9) | 5.4 (4.4–6.4) | 5.5 (4.6–6.6) | <0.05 † |
| Erucic acid (22:1n9) | 1.1 (1.0–1.6) | 1.1 (1.0–1.6) | 1.3 (1.0–1.6) | |
| Nervonic acid (24:1n9) | 35.9 (31.2–41.3) | 35.2 (31.1–39.9) | 37.4 (32.3–42.1) | |
| Polyunsaturated fatty acid | ||||
| Linoleic acid (18:2n6) | 755.2 (670.4–869.5) | 782.8 (672.4–910.1) | 871.4 (772.7–1020.1) | <0.05 †,‡ |
| γ-linolenic acid (18:3n6) | 8.7 (6.3–13.0) | 10.8 (7.5–14.6) | 11.2 (9.3–18.3) | <0.05 † |
| α-linolenic acid (18:3n3) | 20.2 (16.1–25.6) | 21.7 (17.0–29.3) | 25.5 (19.5–32.6) | <0.05 † |
| Eicosadienoic acid (20:2n6) | 6.4 (5.2–7.5) | 6.5 (5.4–7.9) | 6.9 (5.9–8.2) | <0.05 † |
| Mead acid (20:3n9) | 2.3 (1.4–3.2) | 2.9 (1.7–4.2) | 32.9 (2.1–4.2) | <0.05 † |
| Dihomo-γ-linolenic acid (20:3n6) | 40.5 (33.5–49.7) | 48.9 (37.8–58.2) | 59.8 (46.8–67.8) | <0.05 *,†,‡ |
| Arachidonic acid (20:4n6) | 183.0 (142.8–220.0) | 209.7 (162.5–241.0) | 209.2 (183.2–240.6) | <0.05 † |
| Eicosapentaenoic acid (20:5n3) | 43.4 (30.1–72.1) | 45.6 (28.0–64.4) | 50.4 (37.0–71.4) | |
| Adrenic acid (22:4n6) | 5.2 (4.0–6.2) | 5.7 (4.6–7.6) | 6.3 (4.7–7.9) | <0.05 † |
| Docosapentaenoic acid (22:5n3) | 19.3 (15.9–22.4) | 19.7 (15.5–25.0) | 22.2 (17.8–27.7) | <0.05 † |
| Docosahexaenoic acid (22:6n3) | 130.5 (108.8–172.1) | 130.3 (111.2–163.4) | 149.8 (126.6–187.5) | <0.05 † |
| Lobular Inflammation (per 200× Field) | <2 Foci (n = 106) | 2–4 Foci (n = 93) | ≥5 Foci (n = 36) | p-Value |
|---|---|---|---|---|
| Saturated fatty acid | ||||
| Lauric acid (12:0) | 1.4 (0.9–2.3) | 1.9 (1.2–2.8) | 2.2 (1.5–3.4) | <0.05 *,† |
| Myristic acid (14:0) | 21.1 (17.1–32.3) | 26.1 (20.1–34.9) | 30.0 (24.3–37.9) | <0.05 *,† |
| Palmitic acid (16:0) | 724.2 (637.8–859.4) | 779.9 (662.8–940.2) | 843.4 (712.4–1006.7) | <0.05 † |
| Stearic acid (18:0) | 218 (187.4–255.7) | 230.1 (193.0–262.7) | 228.5 (213.2–257.9) | |
| Arachidic acid (20:0) | 8.2 (6.6–9.0) | 7.8 (6.4–8.9) | 7.5 (6.8–8.5) | |
| Behenic acid (22:0) | 19.5 (17.1–22.0) | 19.0 (15.4–21.9) | 19.3 (16.9–21.4) | |
| Lignoceric acid (24:0) | 17.0 (14.9–19.3) | 15.6 (13.4–19.2) | 16.3 (13.9–18.8) | |
| Monounsaturated fatty acid | ||||
| Myristoleic acid (14:1n5) | 0.8 (0.1–1.7) | 1.1 (0.1–1.8) | 1.5 (0.1–2.7) | |
| Palmitoleic acid (16:1n7) | 71.6 (51.7–95.8) | 77.6 (60.9–113.9) | 96.6 (72.2–126.7) | <0.05 † |
| Oleic acid (18:1n9) | 673.0 (563.7–823.5) | 728.3 (610.0–884.5) | 783.7 (663.2–963.8) | <0.05 † |
| Eicosenoic acid (20:1n9) | 4.7 (3.9–6.3) | 5.3 (4.5–6.3) | 5.6 (4.5–6.5) | |
| Erucic acid (22:1n9) | 1.0 (1.2–1.6) | 1.2 (1.0–1.6) | 1.2 (1.0–1.5) | |
| Nervonic acid (24:1n9) | 36.9 (32.3–41.9) | 35.4 (31.5–40.5) | 35.8 (29.1–42.5) | |
| Polyunsaturated fatty acid | ||||
| Linoleic acid (18:2n6) | 799.8 (682.2–938.1) | 812.4 (705.2–969.7) | 825.9 (728.7–978.6) | |
| γ-linolenic acid (18:3n6) | 10.5 (7.3–15.1) | 9.9 (7.0–13.4) | 11.1 (8.7–16.4) | |
| α-linolenic acid (18:3n3) | 21.5 (16.2–26.7) | 21.8 (17.2–29.8) | 25.1 (19.5–32.7) | |
| Eicosadienoic acid (20:2n6) | 6.3 (5.1–7.5) | 6.6 (5.5–8.1) | 6.8 (6.1–7.9) | <0.05 † |
| Mead acid (20:3n9) | 2.6 (1.5–4.0) | 2.5 (1.8–3.4) | 3.1 (2.2–4.3) | |
| Dihomo-γ-linolenic acid (20:3n6) | 45.3 (34.3–54.7) | 48.4 (36.1–63.5) | 53.8 (46.9–64.7) | <0.05 † |
| Arachidonic acid (20:4n6) | 199.5 (160.6–244.1) | 192.8 (162.6–228.0) | 199.8 (176.9–235.1) | |
| Eicosapentaenoic acid (20:5n3) | 52.1 (33.4–74.0) | 43.1 (28.5–66.6) | 47.8 (27.6–63.2) | |
| Adrenic acid (22:4n6) | 5.5 (4.3–7.2) | 5.4 (4.5–6.9) | 6.9 (5.4–7.9) | <0.05 †,‡ |
| Docosapentaenoic acid (22:5n3) | 19.7 (15.8–24.4) | 19.2 (16.0–24.8) | 21.0 (18.2–26.5) | |
| Docosahexaenoic acid (22:6n3) | 142.2 (115.5–179.7) | 134.9 (111.7–171.0) | 143.2 (108.8–166.6) |
| None (n = 66) | Few Balloon Cells (n = 87) | Many Cells/Prominent Ballooning (n = 82) | p-Value | |
|---|---|---|---|---|
| Saturated fatty acid | ||||
| Lauric acid (12:0) | 1.4 (0.9–2.0) | 1.7 (1.1–2.5) | 2.2 (1.4–3.2) | <0.05 *,† |
| Myristic acid (14:0) | 20.7 (16.0–31.2) | 22.7 (18.1–31.3) | 31.1 (23.5–38.9) | <0.05 *,† |
| Palmitic acid (16:0) | 714.9 (627.1–801.7) | 748.5 (633.0–883.6) | 843.4 (727.6–1011.3) | <0.05 *,† |
| Stearic acid (18:0) | 213.4 (187.0–255.8) | 224.3 (187.4–258.1) | 232.5 (208.3–263.6) | <0.05 † |
| Arachidic acid (20:0) | 8.0 (6.6–9.1) | 7.8 (6.6–8.9) | 7.9 (6.6–8.7) | |
| Behenic acid (22:0) | 19.7 (16.7–22.6) | 19.5 (16.8–21.9) | 18.6 (15.9–21.3) | |
| Lignoceric acid (24:0) | 16.8 (15.1–20.1) | 16.3 (14.4–19.3) | 16.0 (13.3–18.9) | |
| Monounsaturated fatty acid | ||||
| Myristoleic acid (14:1n5) | 0.8 (0.1–1.5) | 1.0 (0.1–1.7) | 1.5 (0.1–2.6) | <0.05 *,† |
| Palmitoleic acid (16:1n7) | 65.3 (48.8–89.9) | 72.1 (56.6–90.3) | 95.7 (71.7–128.6) | <0.05 *,† |
| Oleic acid (18:1n9) | 654.0 (569.2–828.4) | 679.3 (574.1–810.2) | 775.2 (662.2–979.9) | <0.05 *,† |
| Eicosenoic acid (20:1n9) | 4.7 (3.8–6.4) | 5.1 (4.4–5.9) | 5.2 (4.4–6.6) | |
| Erucic acid (22:1n9) | 1.1 (1.0–1.5) | 1.2 (1.0–1.7) | 1.2 (1.0–1.5) | |
| Nervonic acid (24:1n9) | 37.2 (31.7–42.4) | 36.4 (31.8–40.2) | 34.0 (31.2–41.8) | |
| Polyunsaturated fatty acid | ||||
| Linoleic acid (18:2n6) | 799.8 (718.0–918.1) | 809.3 (683.2–959.0) | 824.3 (720.2–953.3) | |
| γ-linolenic acid (18:3n6) | 11.0 (6.7–15.9) | 9.7 (7.3–12.5) | 10.9 (8.0–15.4) | |
| α-linolenic acid (18:3n3) | 21.9 (17.6–27.2) | 20.1 (16.4–27.8) | 22.7 (18.2–29.8) | |
| Eicosadienoic acid (20:2n6) | 6.2 (5.0–7.3) | 6.4 (5.4–7.5) | 6.9 (6.0–8.2) | <0.05 *,† |
| Mead acid (20:3n9) | 2.3 (1.5–3.7) | 2.4 (1.7–3.4) | 3.1 (2.0–4.5) | <0.05 *,† |
| Dihomo-γ-linolenic acid (20:3n6) | 44.6 (32.8–57.3) | 44.6 (35.4–57.9) | 52.6 (44.1–63.9) | <0.05 *,† |
| Arachidonic acid (20:4n6) | 199.5 (175.0–247.1) | 186.8 (157.9–230.1) | 207.2 (167.7–235.4) | |
| Eicosapentaenoic acid (20:5n3) | 47.4 (33.4–67.0) | 50.0 (29.4–70.7) | 43.2 (27.6–70.2) | |
| Adrenic acid (22:4n6) | 5.3 (4.5–7.0) | 5.4 (4.2–6.7) | 6.3 (5–7.7) | <0.05 † |
| Docosapentaenoic acid (22:5n3) | 19.6 (15.2–24.5) | 19.3 (15.6–24.3) | 20.5 (17.8–26.5) | |
| Docosahexaenoic acid (22:6n3) | 133.3 (110.5–170.9) | 140.1 (116.4–176.9) | 139.6 (107.4–168.8) |
| Crude HR (95% CI) | p-Value | Adjusted HR a (95% CI) | p-Value | |
|---|---|---|---|---|
| Saturated fatty acid | ||||
| Lauric acid (12:0) | 1.11 (0.95–1.32) | 0.21 | ||
| Myristic acid (14:0) | 1.003 (0.98–1.02) | 0.74 | ||
| Palmitic acid (16:0) | 0.99999 (0.999–1.001) | 0.99 | ||
| Stearic acid (18:0) | 1.25 (1.0002–1.58) | 0.0498 | 1.001 (0.990–1.013) | 0.84 |
| Arachidic acid (20:0) | 0.69 (0.58–0.82) | <0.01 | 0.60 (0.45–0.79) | <0.01 |
| Behenic acid (22:0) | 0.88 (0.82–0.94) | <0.01 | 0.86 (0.76–0.97) | 0.01 |
| Lignoceric acid (24:0) | 0.90 (0.83–0.96) | <0.01 | 0.91 (0.80–1.03) | 0.12 |
| Monounsaturated fatty acid | ||||
| Myristoleic acid (14:1n5) | 1.25 (1.0002–1.58) | 0.0498 | 0.40 (0.04–3.95) | 0.46 |
| Palmitoleic acid (16:1n7) | 1.006 (0.9998–1.0126) | 0.06 | ||
| Oleic acid (18:1n9) | 1.00003 (0.999–1.001) | 0.95 | ||
| Eicosenoic acid (20:1n9) | 1.01 (0.89–1.13) | 0.92 | ||
| Erucic acid (22:1n9) | 0.66 (0.33–1.27) | 0.22 | ||
| Nervonic acid (24:1n9) | 0.97 (0.94–1.01) | 0.11 | ||
| Polyunsaturated fatty acid | ||||
| Linoleic acid (18:2n6) | 0.998 (0.997–0.9998) | 0.02 | 0.39 (0.04–3.93) | 0.91 |
| γ-linolenic acid (18:3n6) | 0.97 (0.92–1.01) | 0.17 | ||
| α-linolenic acid (18:3n3) | 0.97 (0.94–0.99) | 0.01 | 0.92 (0.87–0.97) | <0.01 |
| Eicosadienoic acid (20:2n6) | 0.98 (0.84–1.12) | 0.74 | ||
| Mead acid (20:3n9) | 1.16 (1.01–1.34) | 0.04 | 1.34 (1.10–1.65) | <0.01 |
| Dihomo-γ-linolenic acid (20:3n6) | 0.998 (0.98–1.01) | 0.79 | ||
| Arachidonic acid (20:4n6) | 0.994 (0.988–0.998) | <0.01 | 0.994 (0.988–1.001) | 0.11 |
| Eicosapentaenoic acid (20:5n3) | 0.987 (0.977–0.996) | <0.01 | 0.97 (0.96–0.98) | <0.01 |
| Adrenic acid (22:4n6) | 1.03 (0.92–1.15) | 0.60 | ||
| Docosapentaenoic acid (22:5n3) | 0.96 (0.92–0.99) | 0.01 | 0/89 (0.83–0.95) | <0.01 |
| Docosahexaenoic acid (22:6n3) | 0.989 (0.982–0.994) | < 0.01 | 0.98 (0.97–0.99) | <0.01 |
| Crude HR (95% CI) | p-Value | Adjusted HR a (95% CI) | p-Value | |
|---|---|---|---|---|
| Saturated fatty acid | ||||
| Lauric acid (12:0) | 1.56 (1.25–1.99) | <0.01 | 1.23 (0.91–1.70) | <0.01 |
| Myristic acid (14:0) | 1.07 (1.04–1.10) | <0.01 | 1.07 (1.01–1.13) | 0.01 |
| Palmitic acid (16:0) | 1.004 (1.003–1.006) | <0.01 | 1.007 (1.003–1.013) | <0.01 |
| Stearic acid (18:0) | 1.013 (1.008–1.020) | <0.01 | 1.01 (0.99–1.02) | 0.36 |
| Arachidic acid (20:0) | 1.22 (1.04–1.43) | 0.01 | 1.10 (0.82–1.49) | 0.52 |
| Behenic acid (22:0) | 1.06 (0.99–1.12) | 0.08 | ||
| Lignoceric acid (24:0) | 1.03 (0.96–1.10) | 0.44 | ||
| Monounsaturated fatty acid | ||||
| Myristoleic acid (14:1n5) | 1.49 (1.18–1.93) | <0.01 | 1.30 (0.89–1.91) | 0.17 |
| Palmitoleic acid (16:1n7) | 1.024 (1.016–1.035) | <0.01 | 1.015 (1.003–1.030) | 0.02 |
| Oleic acid (18:1n9) | 1.004 (1.002–1.005) | <0.01 | 1.006 (1.001–1.012) | 0.01 |
| Eicosenoic acid (20:1n9) | 1.14 (1.01–1.31) | 0.03 | 0.93 (0.75–1.14) | 0.49 |
| Erucic acid (22:1n9) | 1.57 (0.84–3.04) | 0.16 | ||
| Nervonic acid (24:1n9) | 1.01 (0.98–1.05) | 0.54 | ||
| Polyunsaturated fatty acid | ||||
| Linoleic acid (18:2n6) | 1.002 (1.001–1.003) | <0.01 | 1.001 (0.998–1.004) | 0.37 |
| γ-linolenic acid (18:3n6) | 1.041 (0.995–1.090) | 0.08 | ||
| α-linolenic acid (18:3n3) | 1.03 (1.01–1.07) | 0.01 | 1.0005 (0.9424–1.0628) | 0.99 |
| Eicosadienoic acid (20:2n6) | 1.30 (1.12–1.54) | <0.01 | 1.05 (0.81–1.35) | 0.73 |
| Mead acid (20:3n9) | 1.32 (1.13–1.57) | <0.01 | 1.09 (0.86–1.39) | 0.50 |
| Dihomo-γ-linolenic acid (20:3n6) | 1.05 (1.03–1.07) | <0.07 | 1.02 (0.99–1.06) | 0.13 |
| Arachidonic acid (20:4n6) | 1.006 (1.001–1.011) | <0.01 | 1.001 (0.993–1.009) | 0.75 |
| Eicosapentaenoic acid (20:5n3) | 0.996 (0.989–1.004) | 0.35 | ||
| Adrenic acid (22:4n6) | 1.31 (1.14–1.52) | <0.01 | 1.21 (0.95–1.56) | 0.12 |
| Docosapentaenoic acid (22:5n3) | 1.05 (1.01–1.09) | <0.01 | 1.01 (0.95–1.08) | 0.66 |
| Docosahexaenoic acid (22:6n3) | 1.003 (0.998–1.008) | 0.24 |
Publisher’s Note: MDPI stays neutral with regard to jurisdictional claims in published maps and institutional affiliations. |
© 2022 by the authors. Licensee MDPI, Basel, Switzerland. This article is an open access article distributed under the terms and conditions of the Creative Commons Attribution (CC BY) license (https://creativecommons.org/licenses/by/4.0/).
Share and Cite
Miyake, T.; Furukawa, S.; Matsuura, B.; Yoshida, O.; Miyazaki, M.; Shiomi, A.; Kanzaki, S.; Nakaguchi, H.; Sunago, K.; Nakamura, Y.; et al. Plasma Fatty Acid Composition Is Associated with Histological Findings of Nonalcoholic Steatohepatitis. Biomedicines 2022, 10, 2540. https://doi.org/10.3390/biomedicines10102540
Miyake T, Furukawa S, Matsuura B, Yoshida O, Miyazaki M, Shiomi A, Kanzaki S, Nakaguchi H, Sunago K, Nakamura Y, et al. Plasma Fatty Acid Composition Is Associated with Histological Findings of Nonalcoholic Steatohepatitis. Biomedicines. 2022; 10(10):2540. https://doi.org/10.3390/biomedicines10102540
Chicago/Turabian StyleMiyake, Teruki, Shinya Furukawa, Bunzo Matsuura, Osamu Yoshida, Masumi Miyazaki, Akihito Shiomi, Sayaka Kanzaki, Hironobu Nakaguchi, Kotaro Sunago, Yoshiko Nakamura, and et al. 2022. "Plasma Fatty Acid Composition Is Associated with Histological Findings of Nonalcoholic Steatohepatitis" Biomedicines 10, no. 10: 2540. https://doi.org/10.3390/biomedicines10102540
APA StyleMiyake, T., Furukawa, S., Matsuura, B., Yoshida, O., Miyazaki, M., Shiomi, A., Kanzaki, S., Nakaguchi, H., Sunago, K., Nakamura, Y., Imai, Y., Watanabe, T., Yamamoto, Y., Koizumi, Y., Tokumoto, Y., Hirooka, M., Kumagi, T., Abe, M., & Hiasa, Y. (2022). Plasma Fatty Acid Composition Is Associated with Histological Findings of Nonalcoholic Steatohepatitis. Biomedicines, 10(10), 2540. https://doi.org/10.3390/biomedicines10102540