

Electric Fields Induced in the Brain by Transcranial Electric Stimulation: A Review of In Vivo Recordings
 , ,
, ,  ,
,  ,
,  and
and 
Abstract
1. Introduction
2. In Vivo Recordings


| Study | Model | Recording Area (tES Stimulation, Max E-Field Recorded) |
|---|---|---|
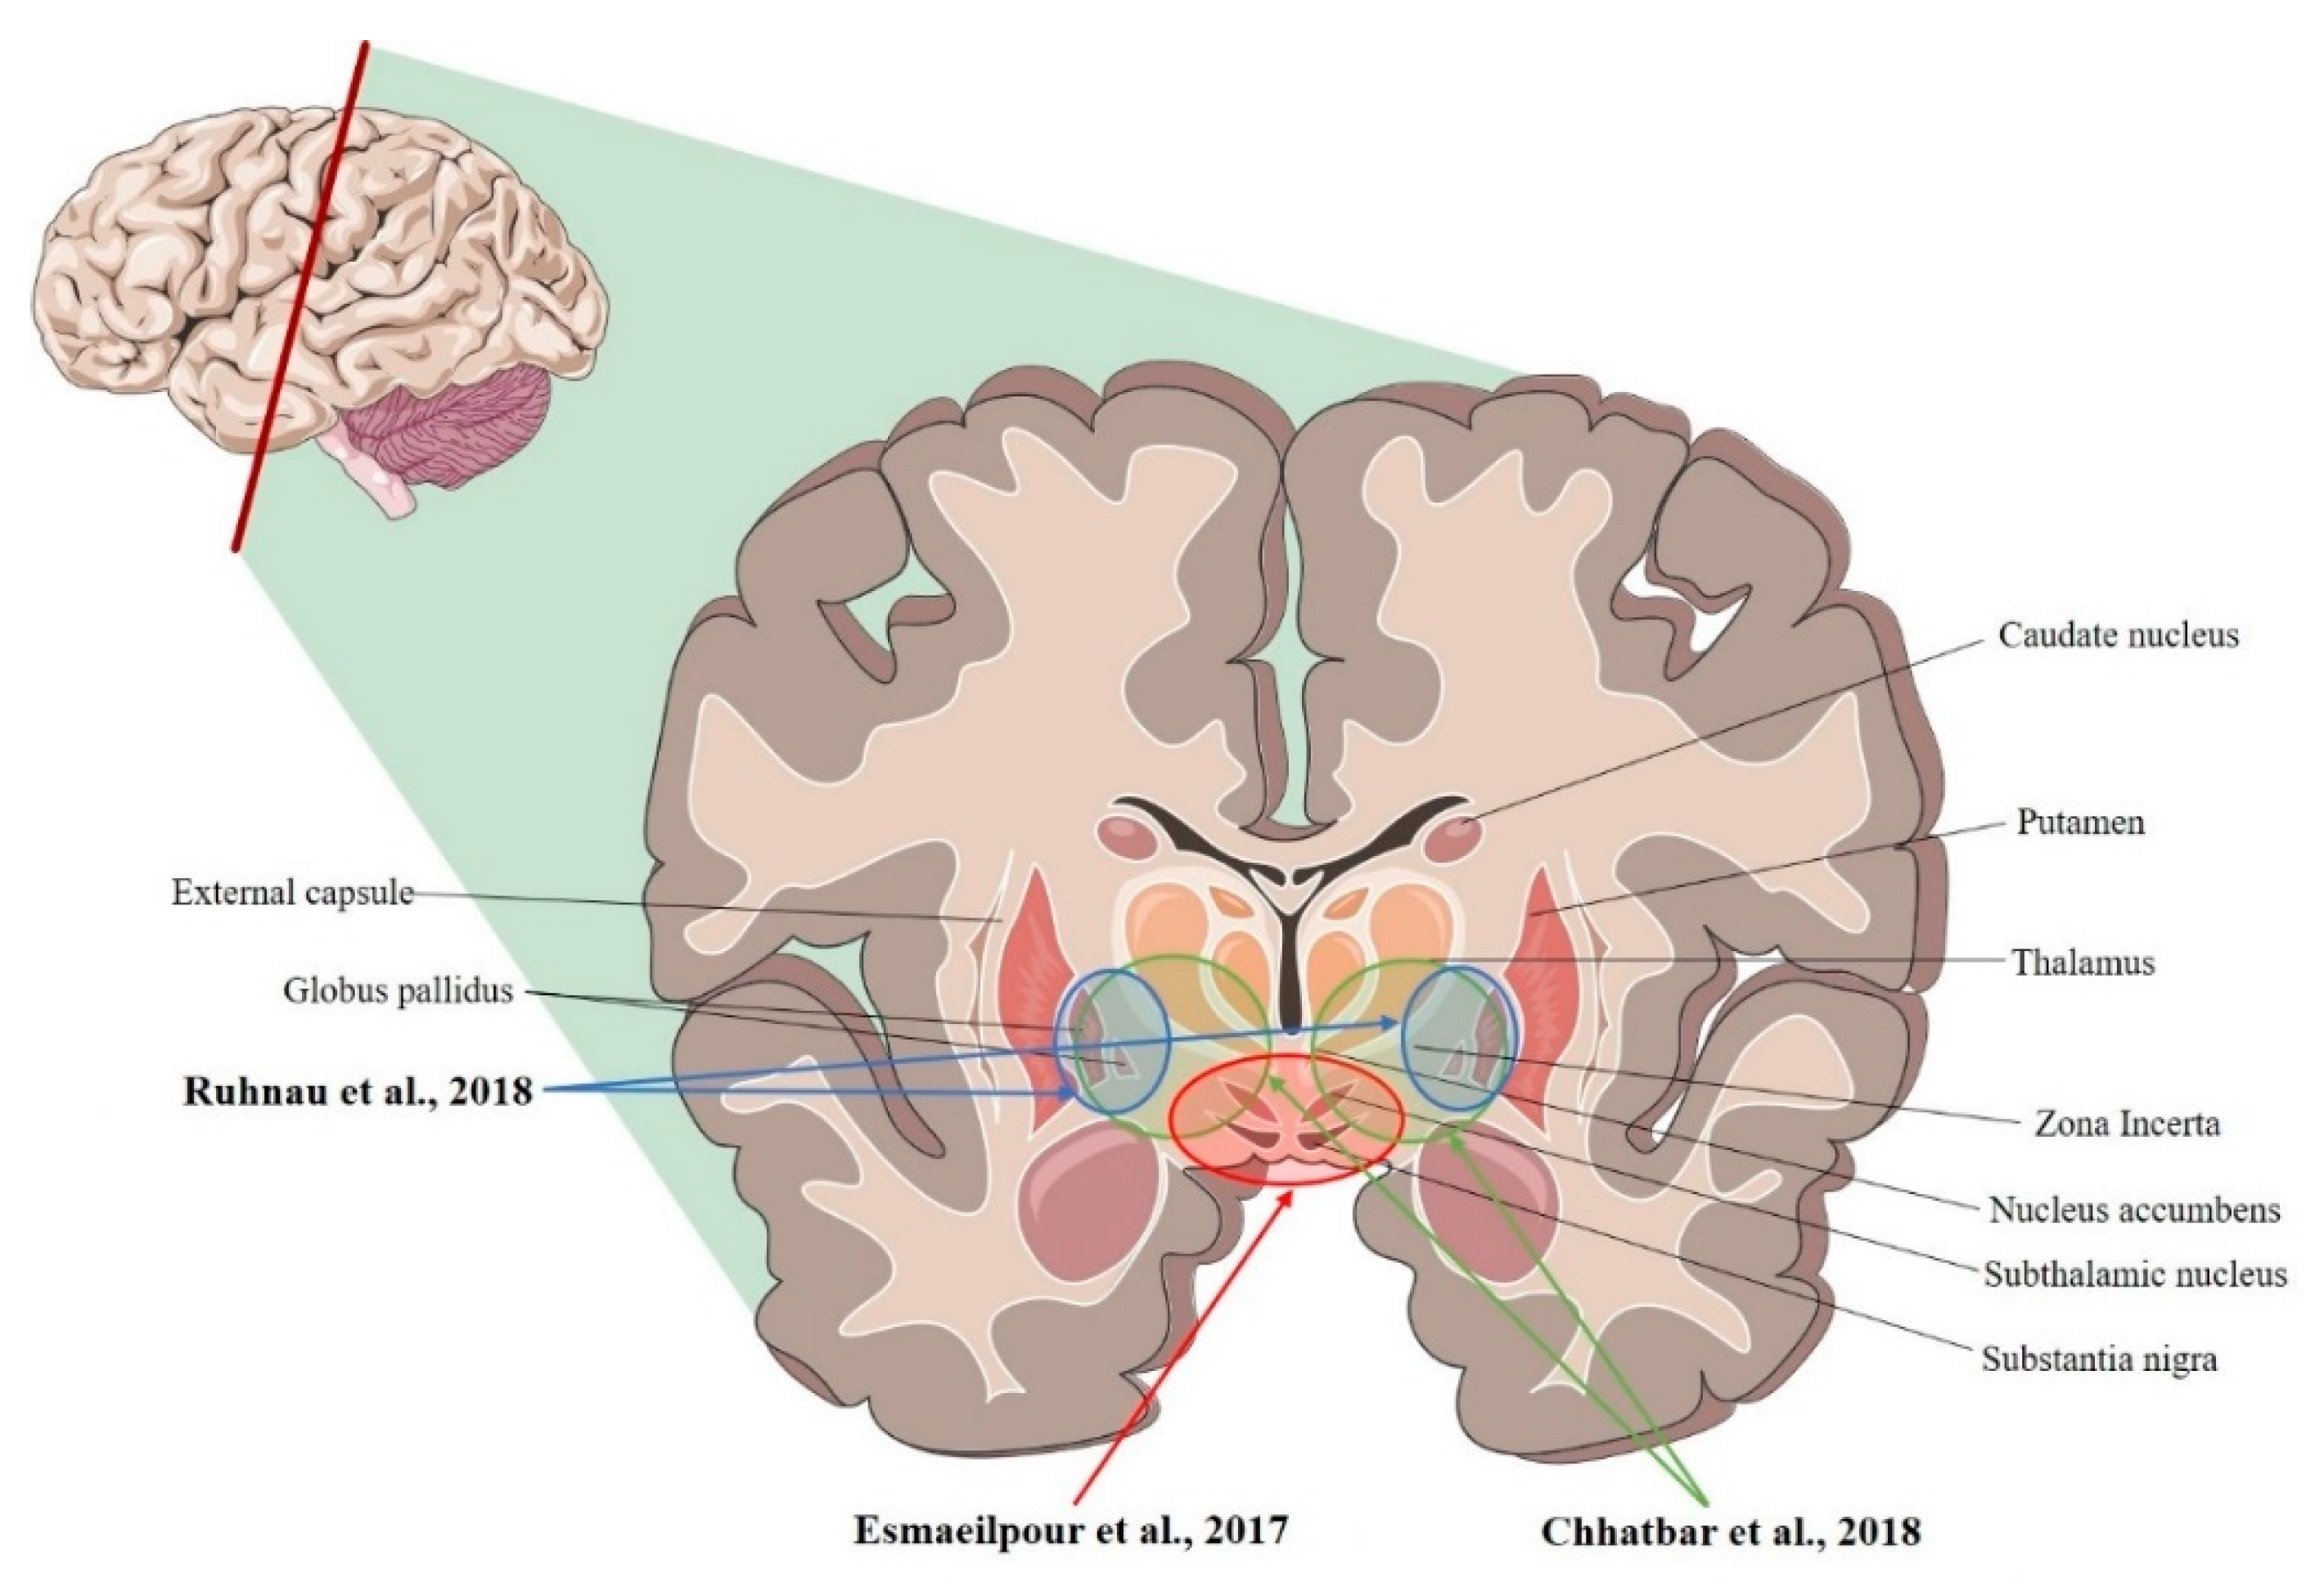
| Ruhnau et al., 2018 [36] | Human | R- and L-VIM nucleus; R- and L-GPi (tACS; ~0.08 mV/mm) |
| Chhatbar et al., 2018 [34] | Human | L-VIM nucleus; R- and L- STN, R- and L-GP (tDCS; 3.34 mV/mm) |
| Esmaeilpour et al., 2017 [37] | Human | R- and L- NAc; R- and L- STN; R-MC (tDCS; 5.06 mV/mm) |

| Study | Model | Recording Area (tES Stimulation, Max E-Field Recorded) |
|---|---|---|
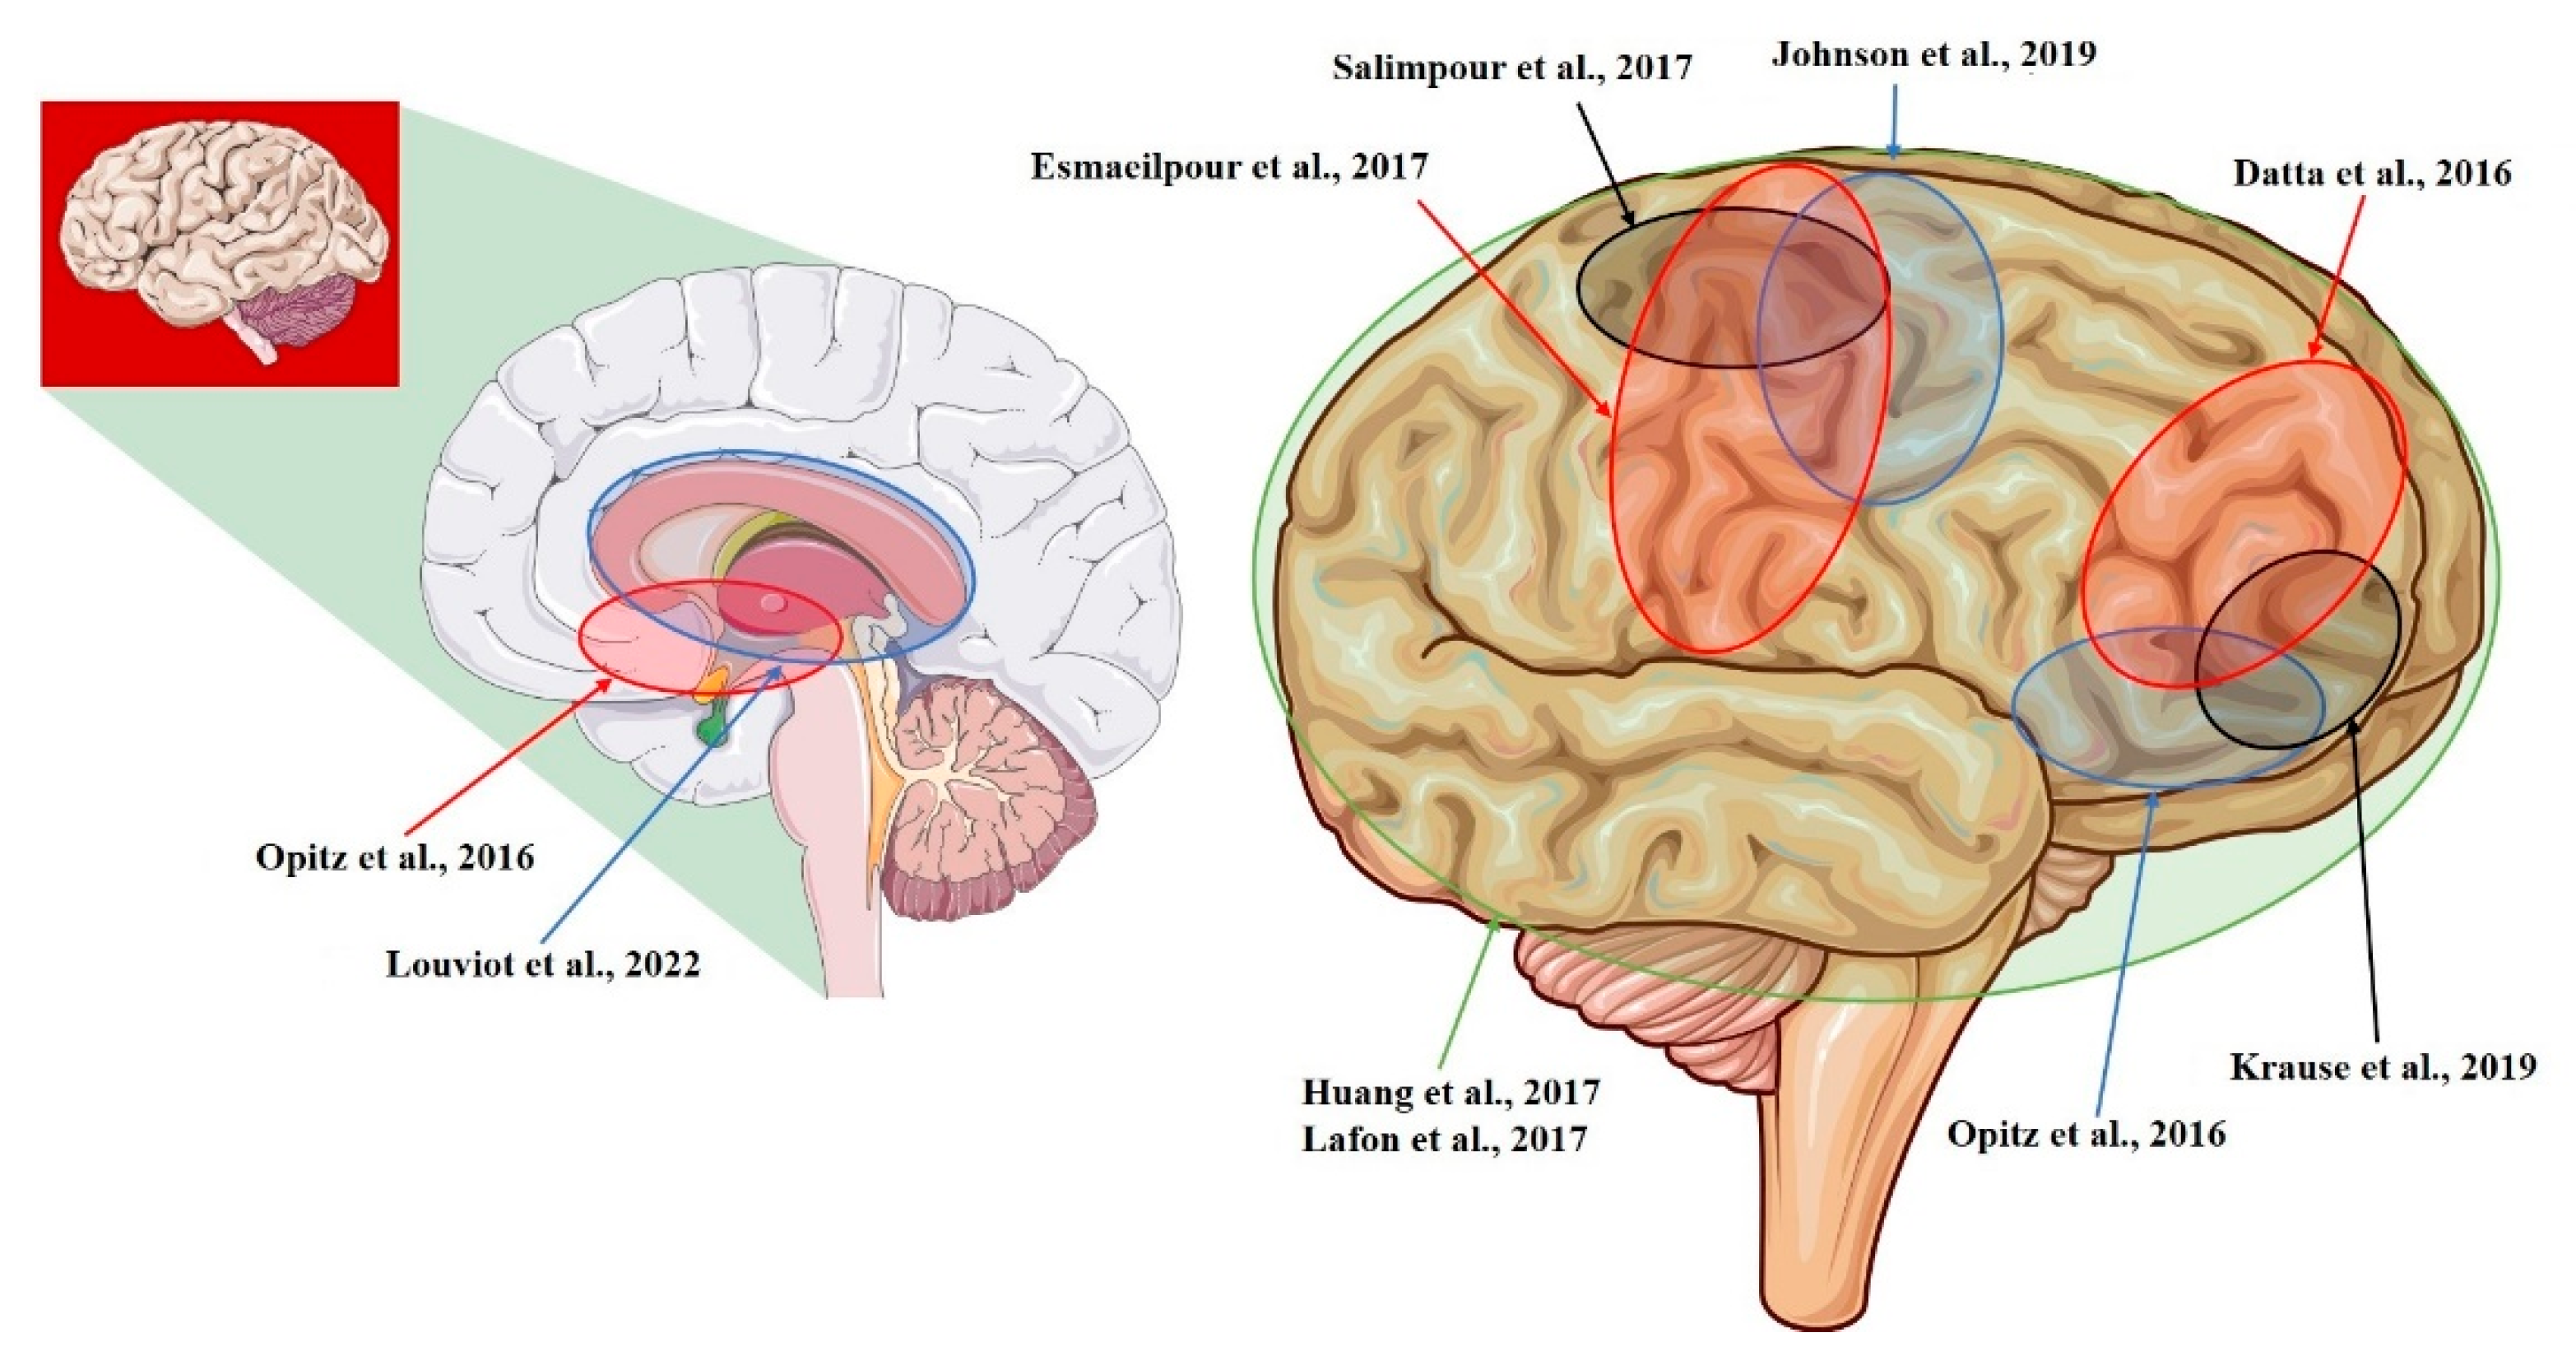
| Datta et al., 2016 [14] | NHP | L-ITC; R-PFC (tDCS; 0.68 mV/mm) |
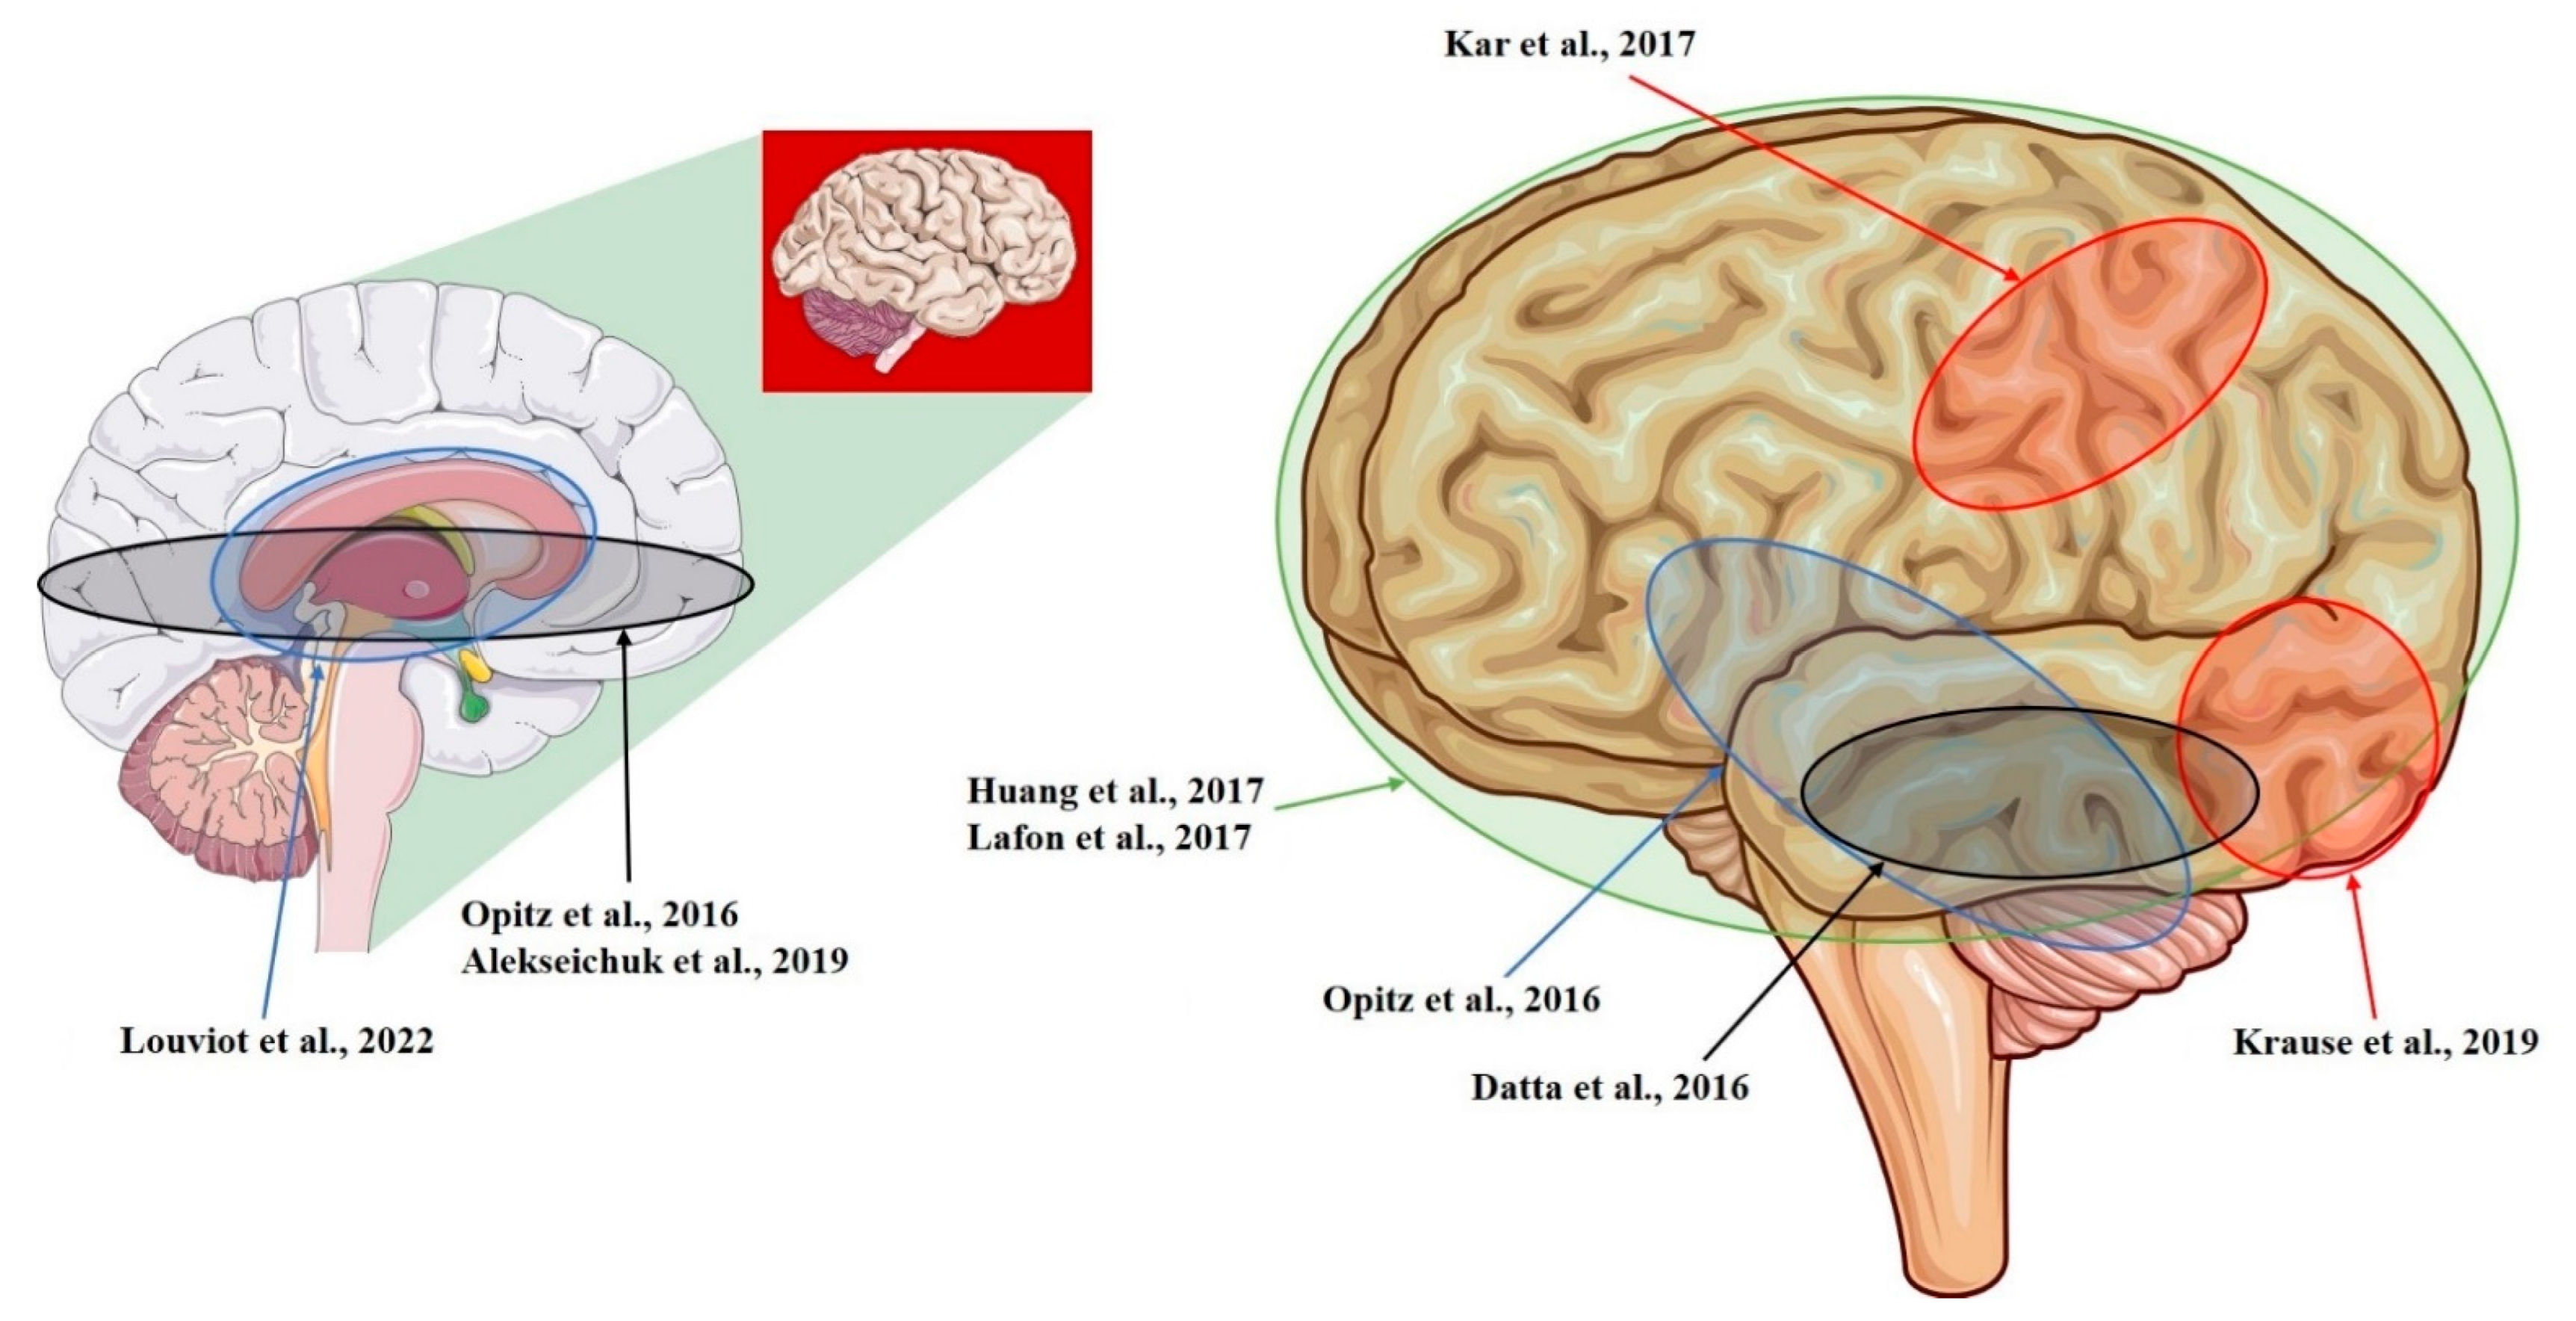
| Opitz et al., 2016 [12] | NHP + Human | R-lateral, L-medial orbitofrontal area; R- and L-superior, R- and L-inferior, and R- and L-middle temporal area; L-entorhinal area; L-cerebellum (tACS; 1.17 mV/mm) |
| Huang et al., 2017 [10] | Human | R- and L-, lateral and medial frontal, parietal, occipital, and temporal cortex; hippocampus * (tACS; 0.38 mV/mm) |
| Lafon et al., 2017 [32] | Human | R- and L-, lateral and medial frontal, parietal, occipital, and temporal cortex; hippocampus * (tACS; 0.16 mV/mm) |
| Krause et al., 2019 [29] | NHP | L-posterior ITC; R-ventrolateral PFC; lateral ventricle (tACS; 0.35 mV/mm) |
| Louviot et al., 2022 [38] | Human | R- and L amygdala, hippocampus, cingulate gyrus * (tACS; 0.49 mV/mm) |
| Esmaeilpour et al., 2017 [37] | Human | R- and L- NAc; R- and L- STN; R-MC (tDCS; 5.06 mV/mm) |
| Salimpour et al., 2017 [26] | Human | R-M1 and R-S1 (tDCS) |
| Johnson et al., 2019 [30] | NHP | R-M1; R-MC (tACS; median: 1.33 mV/mm) |

| Study | Model | Recording Area (tES Stimulation, Max E-Field Recorded) |
|---|---|---|
| Opitz et al., 2016 [12] | NHP + Human | R-lateral, L-medial orbitofrontal area; R- and L-superior, R- and L-inferior, and R- and L-middle temporal area; L-entorhinal area; L-cerebellum (tACS; 1.17 mV/mm) |
| Kar et al., 2017 [28] | NHP | L-middle temporal area (tACS; 0.12 mV/mm) |
| Krause et al., 2019 [29] | NHP | L-posterior ITC; R-ventrolateral PFC; lateral ventricle (tACS; 0.35 mV/mm) |
| Datta et al., 2016 [14] | NHP | L-ITC; R-PFC (tDCS; 0.68 mV/mm) |
| Huang et al., 2017 [10] | Human | R- and L-, lateral and medial frontal, parietal, occipital, and temporal cortex; hippocampus * (tACS; 0.38 mV/mm) |
| Louviot et al., 2022 [38] | Human | R- and L amygdala, hippocampus, cingulate gyrus * (tACS; 0.49 mV/mm) |
| Lafon et al., 2017 [32] | Human | R- and L-, lateral and medial frontal, parietal, occipital, and temporal cortex; hippocampus * (tACS; 0.16 mV/mm) |
| Alekseichuk et al., 2019 [39] | NHP | L-occipital cortex, L-medial PFC; L-anterior hippocampus (tACS; 8.75 mV/mm) |
2.1. tDCS Recordings—Animal Studies
2.2. tDCS Recordings—Human Studies
| Study | Subjects | Stimulation Protocol | Electrodes Dimensions | Time of Stimulation | Recording Area | Induced Electric Field Intensity | |
|---|---|---|---|---|---|---|---|
| Datta et al., 2016 [14] | Adult macaque (M) | tDCS, L-frontoparietal montage, 2 mA | Circular, 3.14 cm2 | 5 min (during fixation task) | L-ITC | Max predicted: 0.23 mV/mm (not confirmed) | |
| tDCS, R-frontooccipital montage, 2 mA | R-PFC | Max predicted: 0.68 mV/mm (confirmed) | |||||
| Adult macaque (F) | tDCS, L-frontoparietal montage, 2 mA | L-ITC | n.r. | ||||
| tDCS, R-frontoparietal, L-parietal montage, 2 mA | R-PFC | Max predicted: 0.42 mV/mm (confirmed) | |||||
| Opitz et al., 2016 [12] | Cebus monkey (M) | tACS, L-occipitofrontal montage at 21 frequencies (1 to 10 Hz in 1 Hz steps, 10 Hz to 100 Hz in 10 Hz steps, plus 125 Hz and 150 Hz), 0.2 mA | Circular, 3.14 cm2 | 30 s each frequency | L-orbitofrontal cortex, frontal eye field and hippocampus | Max ± SE: 0.358 ± 0.001 mV/mm (median = 0.21 mV/mm) | |
| Cebus monkey (F) | tACS, L-occipitofrontal montage at 21 frequencies (1 to 10 Hz in 1 Hz steps, 10 Hz to 100 Hz in 10 Hz steps, plus 125 Hz and 150 Hz), 0.1 mA | Circular, 3.14 cm2 | 30 s each frequency | L-orbitofrontal cortex, frontal eye field, hippocampus, and thalamus | Max ± SE: 1.173 ± 0.003 mV/mm (median = 0.39 mV/mm) | ||
| A single subject with medication-refractory epilepsy | tACS, bilateral frontoparietal montage, 1 Hz, 1 mA | 25 cm2 | 2 min | L-medial and R-lateral orbitofrontal, L- and R- superior temporal, L-middle temporal, R-middle temporal, R- and L-inferior temporal cortical and subcortical regions, hippocampus, amygdala, cerebellum * | Max ± SE: 0.360 ± 0.008 mV/mm (median = 0.098 mV/mm) | ||
| A single subject with medication-refractory epilepsy | 25 cm2 | 2 min | Max ± SE: 0.163 ± 0.007 mV/mm (median = 0.059 mV/mm) | ||||
| Esmaeilpour et al., 2017 [37] | A single subject | tDCS, R-occipital-supraorbital montage, 1 mA and 2 mA | Rectangular, 35 cm2 | ~30 s | NAc bilaterally | Max: 5.06 mV/mm | |
| A single subject | tDCS, R-occipital-supraorbital montage, 1 mA and 2 mA | STN bilaterally | Max: 2.6 mV/mm | ||||
| A single subject | tDCS, R-occipital-supraorbital montage, 1 mA | R-motor cortex | Max: 0.12 mV/mm | ||||
| Salimpour et al., 2017 [26] | A single subject with PD undergoing surgery | tDCS, bilateral frontoparietal montage, 2 mA | Rectangular, 25 cm2 | ~1 min | R-primary motor cortex and primary sensory cortex | Unable to record | |
| Kar et al., 2017 [28] | Adult macaque (M) | tACS, L-frontotemporal montage, 10 Hz, 2 mA | Square, 10.24 cm2 | 3 s | L-middle temporal area | Max: 0.12 mV/mm | |
| tACS, R-frontotemporal montage, 10 Hz, 2 mA | Square, 10.24 cm2 | 3 s | Max: 0.03 mV/mm | ||||
| Huang et al., 2017 [10] | Nine subjects undergoing invasive monitoring for epilepsy surgery | tACS, frontooccipital montage, 1 to 10 Hz, 0.25 to 1 mA | Square, 4 cm2 | n.r. | Lateral and medial frontal, parietal, occipital, and temporal cortex bilaterally; hippocampus * | Max (scaled at 1 mA): 0.28 mV/mm | |
| tACS, frontolateral-occipital montage, 1 to 10 Hz, 0.25 to 1 mA | Square, 4 cm2 | n.r. | Max (scaled at 1 mA): 0.25 mV/mm | ||||
| tACS, frontolateral-occipital montage, 1 to 10 Hz, 0.25 to 1 mA | Square, 4 cm2 | n.r. | Max (scaled at 1 mA): 0.10 mV/mm | ||||
| A single subject undergoing invasive monitoring for epilepsy surgery | tACS, L-frontoparietal, R-supraorbital, bilateral frontoparietal, and fronto-occipital montage, 1 to 10 Hz, 0.25 to 1 mA | Square, 4 cm2 | n.r. | Max (scaled at 1 mA): 0.38 mV/mm | |||
| Lafon et al., 2017 [32] | Nine subjects with medication-refractory epilepsy | tACS, fronto-occipital montage, 0.75 to 1 Hz, 0.5 to 2.5 mA | Square, 4 cm2 | Between 5 to 10 min | frontal, parietal, occipital, and temporal cortex bilaterally, deeper structures * | Median: 0.02 mV/mm (scaled to 1 mA of stimulation) | |
| A single subject with medication-refractory epilepsy | tACS, fronto-occipital montage plus three additional montages, 0.75 to 1 Hz, 0.5 to 2.5 mA (one patient) | Square, 4 cm2 | Between 5 to 10 min | Median (scaled at 1 mA): 0.02 mV/mm Max intensity: 0.16 mV/mm at the highest current intensity (2.5 mA) | |||
| Three subjects with medication-refractory epilepsy | tACS, frontolateral-occipital montage, 0.75 to 1 Hz, 0.5 to 2.5 mA (three patients) | Square, 4 cm2 | Between 5 to 10 min | Median (scaled at 1 mA): 0.02 mV/mm | |||
| Ruhnau et al., 2018 [36] | A single subject suffering from movement disorders | tACS, bilateral temporal montage, 10 Hz, 1 mA | Rectangular, 35 cm2 | n.r. | VIM nucleus and GPi, bilaterally | Max: ~0.08 mV/mm | |
| Chhatbar et al., 2018 [34] | A single subject with ET | tDCS, bitemporal montage, 2 mA | Rectangular, 35 cm2 | 3 min | L-VIM nucleus | - | |
| A single subject with PD | tDCS, bitemporal montage, 2 mA | Bilateral STN | Max: −0.11 mV/mm | ||||
| tDCS, bitemporal montage, 4 mA | Max: −0.19 mV/mm | ||||||
| tDCS, occipitofrontal montage, 2 mA | Max: −0.06 mV/mm | ||||||
| tDCS, occipitofrontal montage 4 mA | Max: −0.02 mV/mm | ||||||
| A single subject with PD | tDCS, bitemporal montage, 2 mA | Bilateral Gpi | Max: −0.13 mV/mm | ||||
| tDCS, bitemporal montage, 4 mA | Max: −0.26 mV/mm | ||||||
| tDCS, occipitofrontal montage, 2 mA | Max: 0.04 mV/mm | ||||||
| tDCS, occipitofrontal montage, 4 mA | Max: 0.03 mV/mm | ||||||
| Opitz et al., 2018 [24] | A single subject undergoing invasive monitoring for epilepsy surgery | tACS, bilateral frontoparietal montage, 1 Hz, 1 mA | Circular, 25 cm2 | 2 min | n.r. * | Mean: 0.058 mV/mm | |
| A single subject undergoing invasive monitoring for epilepsy surgery | Circular, 25 cm2 | 2 min | Mean: 0.115 mV/mm | ||||
| Alekseichuk et al., 2019 [39] | Capuchin monkey (F) | Multielectrode tACS, 3 electrodes (L-fronto-occipito-temporal), 10 Hz, in 25 different phase conditions (from 0° to 360° in 15° steps) at 0.1 mA | Circular, 3.14 cm2 | 30 s each frequency | L-occipital cortex, medial PFC, and anterior hippocampus | Max: 6.03 mV/mm at 180° condition Min: 1.32 mV/mm at 0° condition | |
| Rhesus monkey (F) | Circular, 3.14 cm2 | 30 s each frequency | Max: 8.75 mV/mm at 180° condition Min: 3.03 mV/mm at 0° condition | ||||
| Krause et al., 2019 [29] | Macaque monkey (M) | tACS, L-fronto–R-occipital montage, several frequencies at 2 mA | Circular, 3.14 cm2 | 5 min (during fixation task) | L-posterior ITC and R-ventrolateral PFC, lateral ventricle | Max: 0.28 mV/mm mean ± SE: 0.23 ± 0.01 | |
| Macaque monkey (M) | tACS, L-frontoparietal-occipital montage, several frequencies at 2 mA | Circular, 3.14 cm2 | 5 min (during fixation task) | Max: 0.35 mV/mm mean ± SE: 0.19 ± 0.02 mV/mm | |||
| Johnson et al., 2019 [30] | Two monkeys (F) | tACS, bilateral frontotemporal montage, 10 Hz, 0.5 mA | Circular, 3.14 cm2 | 2 min | R-premotor and R-primary motor cortex | Median: 0.38 mV/mm (subject 1); Median: 0.43 mV/mm (subject 2) | |
| tACS, bilateral frontotemporal montage, 10 Hz, 1 mA | Circular, 3.14 cm2 | 2 min | Median intensity: 0.77 mV/mm (subject 1); Median intensity: 0.86 mV/mm (subject 2) | ||||
| tACS, bilateral frontotemporal montage, 10 Hz, 1.5 mA | Circular, 3.14 cm2 | 2 min | Median intensity: 1.15 mV/mm (subject 1); Median intensity: 1.33 mV/mm (subject 2) | ||||
| Louviot et al., 2022 [38] | A single subject with medication-refractory focal epilepsy | tACS, bilateral temporal montage, 1 Hz, 3 Hz, 7 Hz, 35 Hz, 71 Hz, 140 Hz, 300 Hz, 0.5 and 1 mA; tACS, bilateral frontotemporal montage, 1 Hz, 3 Hz, 7 Hz, 35 Hz, 71 Hz, 140 Hz, 300 Hz, 0.5 and 1 mA | Circular, 4.52 cm2 | 2 min | Amygdala, hippocampus, cingulate gyrus * | Amygdala (1 mA): mean: 0.22 mV/mm; max: 0.25 mV/mm Hippocampus (1 mA): mean: 0.16 mV/mm; max: 0.26 mV/mm Cingulate gyrus (1 mA): mean: 0.06 mV/mm; max: 0.06 mV/mm | |
| Five subjects with medication-refractory focal epilepsy | tACS, bilateral temporal montage, 300 Hz, 0.5 and 1 mA; tACS, bilateral frontotemporal montage, 300 Hz, 0.5 and 1 mA | Circular, 4.52 cm2 | 2 min | Amygdala, hippocampus, cingulate gyrus * | Amygdala (1 mA): mean: 0.22 mV/mm; max: 0.29 mV/mm Hippocampus (1 mA): mean: 0.17 mV/mm; max: 0.38 mV/mm Cingulate gyrus (1 mA): mean: 0.08 mV/mm; max: 0.9 mV/mm | ||
| A single subject with medication-refractory focal epilepsy | tACS, L-frontoparietal–R-temporal montage; bifronto-parietal montage; vertex–R-temporal montage; vertex–R-frontoparietal montage; fronto–R-temporal montage; fronto–L-temporal montage; fronto–R-frontoparietal montage; vertex–frontal montage; vertex–L-frontoparietal montage; bitemporal montage; L-temporo–R-frontoparietal, 300 Hz, 0.5 and 1 mA | Circular, 4.52 cm2 | 2 min | Amygdala, hippocampus, cingulate gyrus * | Amygdala (1 mA): mean: 0.18 mV/mm; max: 0.49 mV/mm Cingulate gyrus (1 mA): mean: 0.06 mV/mm; max: 0.11 mV/mm | ||
2.3. tACS Recordings—Animal Studies
2.4. tACS Recordings—Human Studies
3. Recording Set-Up
4. Electrical Stimulation Dose
5. Technical Issues and Limitations
- (I)
- The anatomical characteristics of the subject. Pathological subjects undergoing neurosurgery are often preferred for in vivo assessments for ethical reasons; however, their altered anatomy changes the E-field distribution, such as in stroke patients [75,76], patients with skull defects [24,77] or craniectomy [78]. Similar consequences can be seen in the use of cranial implants [77], such as electrodes [79] or bone screws [77], which alter the current flow in the surrounding tissues and lead to locally high current concentrations—a phenomenon that is known as the “edge effect” [80,81]. This effect occurs because the E-field masses around (i.e., at and near) the zone have a higher conductivity than bordering tissues which are less conductive. Replacing the removed skull with an insulating filler [82] or using a natural skull foramina as is the case for other neuromodulatory interventions [83] might minimizes these problems, but it is not clear whether natural openings promote an edge effect as well [84].
- (II)
- The translation from animal studies to clinical practice. Besides the methodological differences between animal and human studies [85,86]—for example, animals typically undergo invasive stimulation techniques and have applied to them very strong intensities of stimulation [29] which are several-fold stronger than the humans undergo [87], the in vitro results do not account for the system-level properties [88], while the in vivo ones deal with a physiology and cytoarchitecture that may not be assimilable to the human brain [30,34]. Human neurons possess longer and compartmentalized apical dendrites, and their pyramidal neurons have larger dendritic arbores than rodents and primates do [89]. Also, their brain size, cortical folding, skin, skull, and CSF thicknesses are different [10,12,90]. For example, in a lissencephalic brain, the brain regions under the stimulating electrodes are exposed to an radially-inward (anodal) and radially-outward (cathodal) direct current flow, and the intermediate brain regions are exposed to a tangentially-direct current flow [91]. For the folded cortex, current crossing across the gyri can create a highly mixed pattern of directionality, even directly under electrodes [92,93].
- (III)
- The technical and methodological aspect of the recording. The recording set-up challenges the observation of the voltage changes, being typically planned for recording neural activity or local field potentials [34]. For example, the use of microelectrode neural recording systems (single electrode or arrays) has shown their robustness and reliability to record neuronal activity in a number of studies, with multielectrode arrays able to target neuronal population per recording session [94]. However, microelectrodes can detect the electrical changes in the extracellular field [95], allowing for punctual recordings. During tES, there is no uniform induced E-field, but rather a range of intensities varying across the brain, with regions of maximum and regions of minimum values [16,92]. This is why any type of index that is considered (e.g., mean, median, maximum and minimum) may be misleading [22]. Also, the placement of the recording electrodes has been often not carefully planned [10,12,24,32]. This is of great concern because their position has a large effect on the measurements that are performed [25]. Intracranial electrodes, indeed, can measure potential differences only in the plane of the electrode strip [10], which should coincide with the general direction of the induced E-field to have maximal registering efficacy [34]. Also, the current density under the implanted electrode might not be equal to the average current density at the electrode, but instead it may be orders of magnitude higher at the electrode edges [96,97]. Similarly, other methods of recording that do not require electrodes might play a complementary and adjunctive role in investigating the neuromodulatory effects of tES in the deep brain areas thus potentially confirming the evidence that is here reported. For example, voltage-sensitive dye (VSD) imaging has been used to monitor cortical activity [98] and describe the cellular responses to invasive direct electrical stimulation [99], while intrinsic optical signal (IOS) imaging can be used to map the patterns of brain activity [100,101,102]. They reflect the functional response of the cells to the stimulation, rather than assess the E-field that is generated in the brain. Indeed, VSD imaging is based on dye molecules that are embedded in the cell membrane, which fluoresce proportionally to the changes in the transmembrane potential difference; IOS imaging refers to changes in the optical transmission, scattering, and reflectance of the tissue due to alterations in the blood volume [103], in the balance of oxy- and deoxyhemoglobins [100,101] and in ionic metabolism in astrocytes [104], among the others.
- (IV)
- The theoretical framework of E-fields assessment. Current knowledge estimates that the minimum field strength for a direct neuromodulatory effect is likely somewhere between 0.10–1.00 mV/mm in the brain [87,105], with around 20 mV/mm for the plasticity effects [106,107]. Experimental [108] and clinical [109] tES protocols commonly provide a stimulation of <2 mA that produces E-fields on the order of 0.10–0.40 mV/mm [48,105], that are up to 1 mV/mm [4] in the brain. However, there is no consensus on the amount of stimulation that is needed to affect the human brain [110]. For example, a human cadaver study suggested that ab approximately 6 mA (i.e., three times the common amplitudes) stimulation would induce an effective intracerebral E-field [48], but the biophysical properties of brain tissue change profoundly after death [87], thus limiting a comparison [13].
6. Clinical Considerations
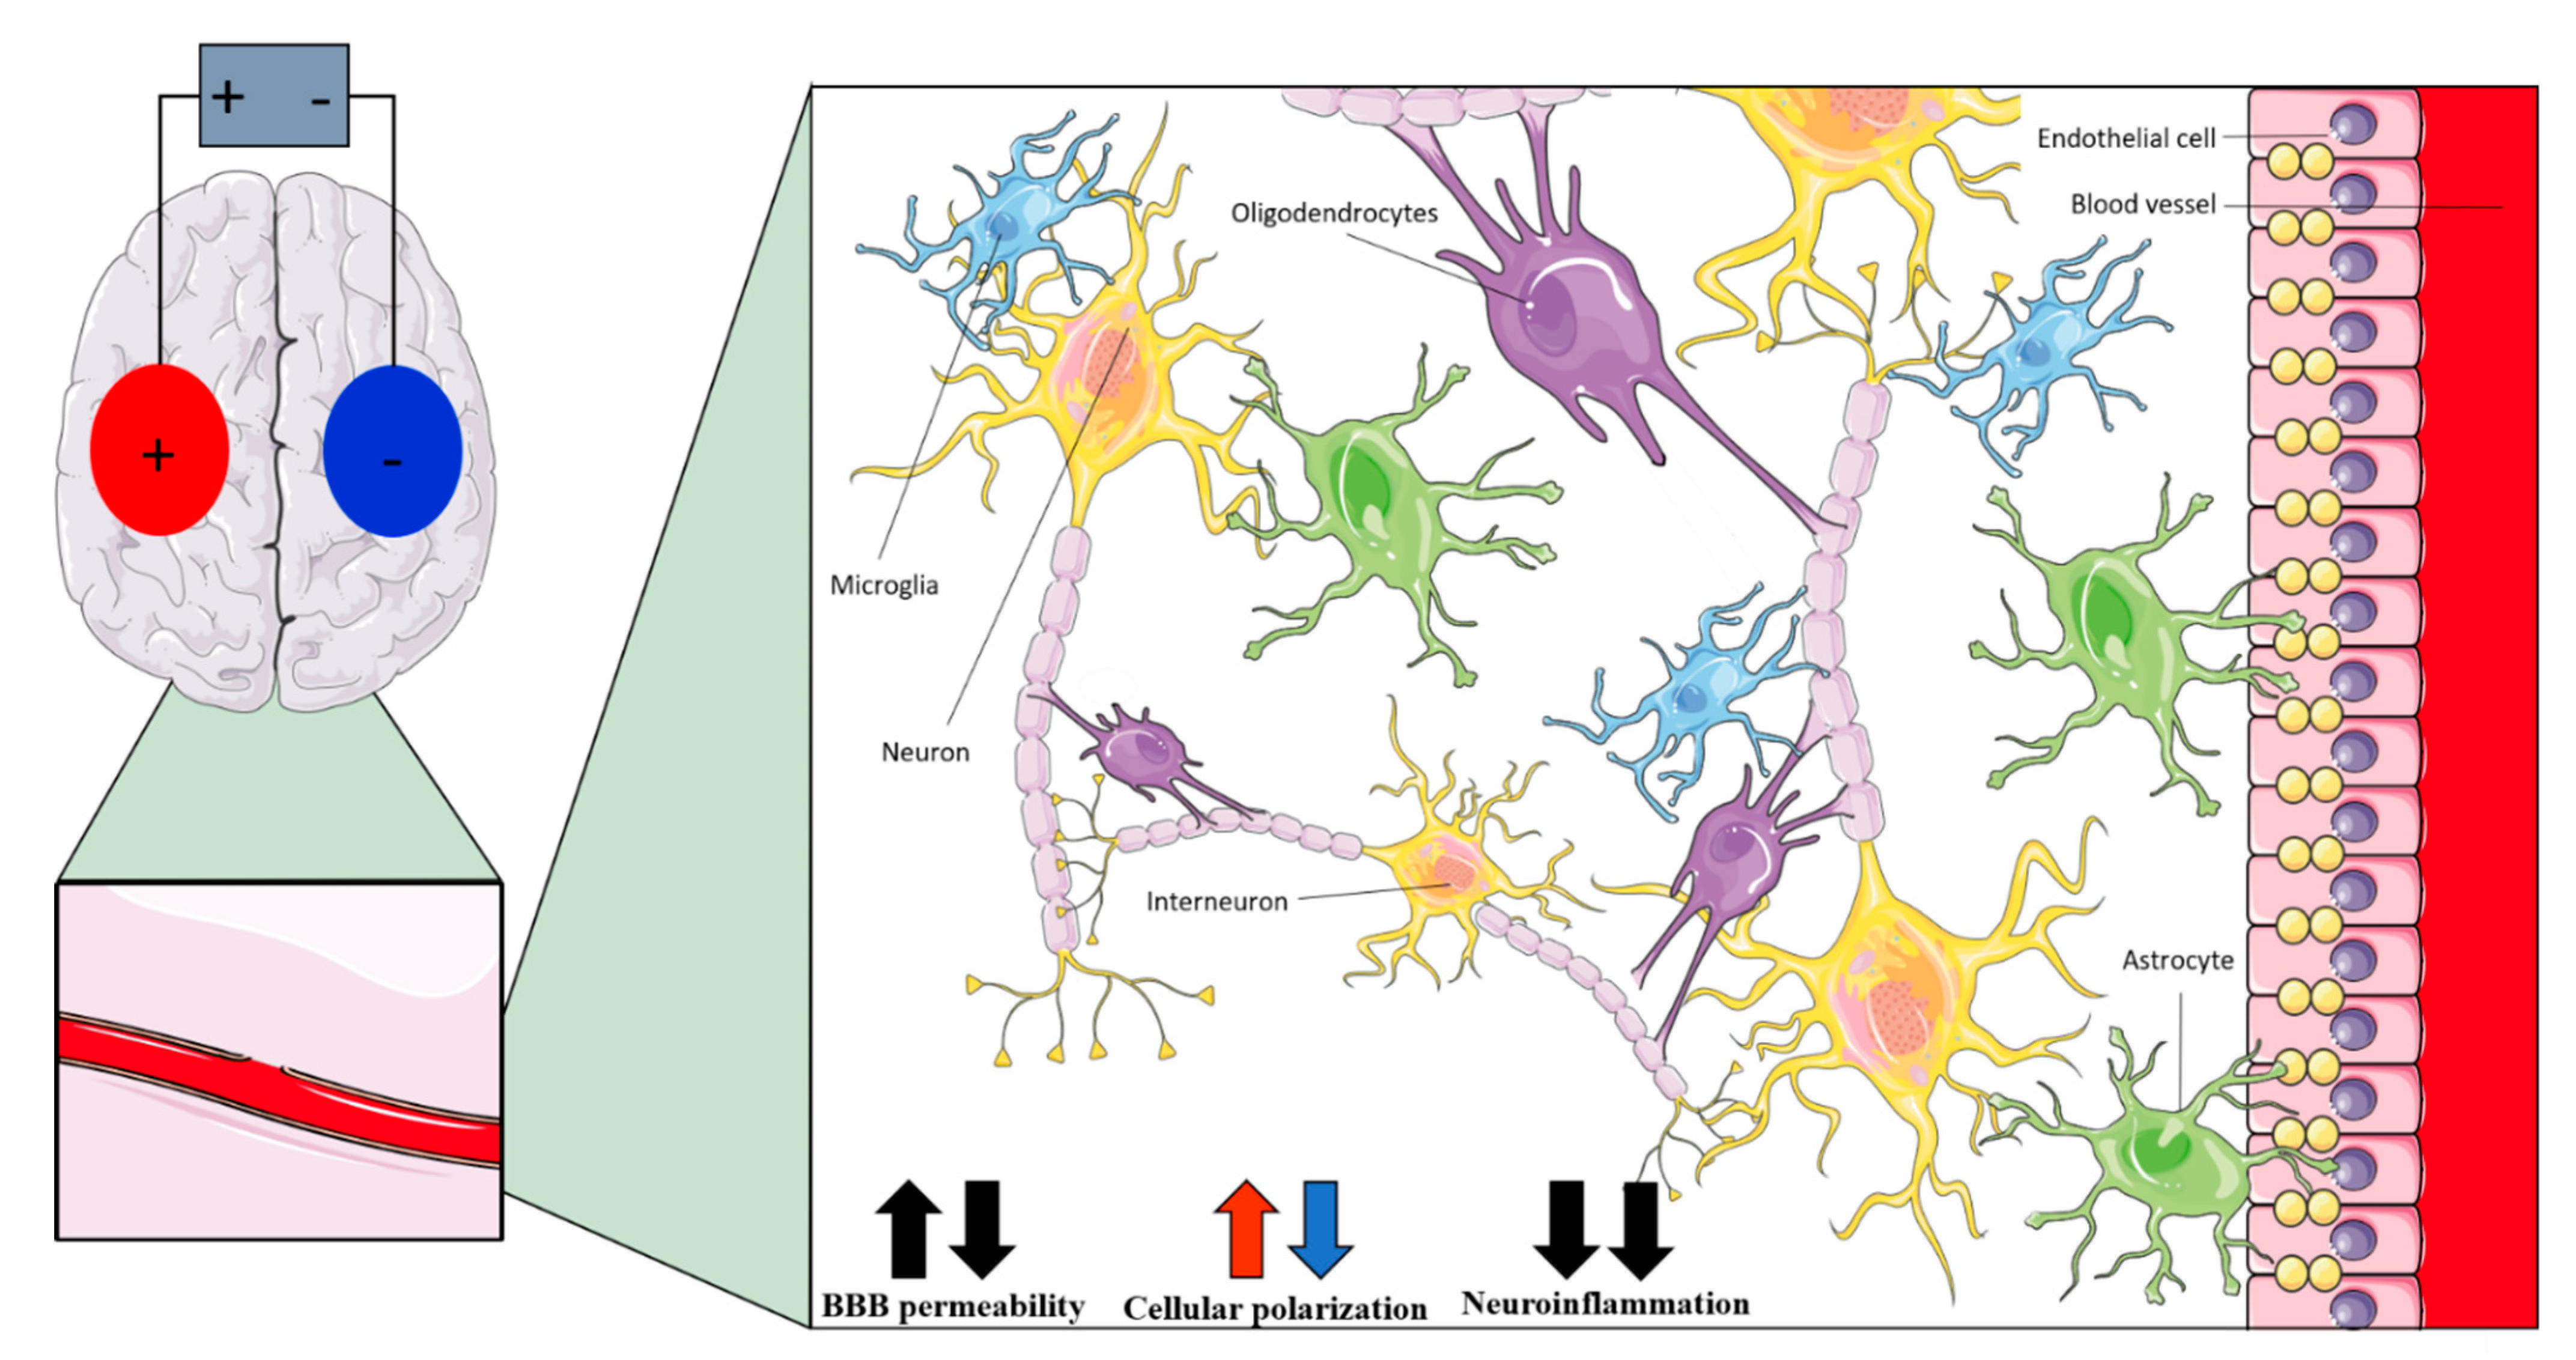
| Non-Neuronal Cell | Anodal tDCS | Cathodal tDCS | tACS |
|---|---|---|---|
| Interneurons | Polarizing effects on dendrites and axons [22] | Modulation of fast-spiking interneurons activity [35] | |
| Astrocytes | Polarizing effects (increased by network effect) [121] | - | |
| Microglia | Shifting of microglia to active state [86,123]; modulation of neuroinflammation [126,127,128,129] | - | |
| Oligodendrocytes | Promotion of neurogenesis [131]; promotion of oligodendrocyte-specific progenitors’ proliferation and differentiation [130] | Promotion of neurogenesis [131] | Promotion of oligodendrocyte-specific progenitors’ proliferation and differentiation [130] |
| Endothelial cells | Changes in cerebral blood perfusion [138] | - | |
7. Concluding Remarks
Author Contributions
Funding
Conflicts of Interest
References
- Priori, A. Brain polarization in humans: A reappraisal of an old tool for prolonged non-invasive modulation of brain excitability. Clin. Neurophysiol. 2003, 114, 589–595. [Google Scholar] [CrossRef]
- Nitsche, M.A.; Paulus, W. Excitability changes induced in the human motor cortex by weak transcranial direct current stimulation. J. Physiol. 2000, 527, 633–639. [Google Scholar] [CrossRef] [PubMed]
- Woods, A.J.; Antal, A.; Bikson, M.; Boggio, P.S.; Brunoni, A.R.; Celnik, P.; Cohen, L.G.; Fregni, F.; Herrmann, C.S.; Kappenman, E.S.; et al. A technical guide to tDCS, and related non-invasive brain stimulation tools. Clin. Neurophysiol. 2016, 127, 1031–1048. [Google Scholar] [CrossRef] [PubMed]
- Antal, A.; Alekseichuk, I.; Bikson, M.; Brockmöller, J.; Brunoni, A.; Chen, R.; Cohen, L.; Dowthwaite, G.; Ellrich, J.; Flöel, A.; et al. Low intensity transcranial electric stimulation: Safety, ethical, legal regulatory and application guidelines. Clin. Neurophysiol. 2017, 128, 1774–1809. [Google Scholar] [CrossRef] [PubMed]
- Reed, T.; Kadosh, R.C. Transcranial electrical stimulation (tES) mechanisms and its effects on cortical excitability and connectivity. J. Inherit. Metab. Dis. 2018, 41, 1123–1130. [Google Scholar] [CrossRef]
- Gellner, A.-K.; Reis, J.; Fritsch, B. Glia: A Neglected Player in Non-invasive Direct Current Brain Stimulation. Front. Cell. Neurosci. 2016, 10, 188. [Google Scholar] [CrossRef]
- Peterchev, A.V.; Wagner, T.A.; Miranda, P.C.; Nitsche, M.A.; Paulus, W.; Lisanby, S.H.; Pascual-Leone, A.; Bikson, M. Fundamentals of transcranial electric and magnetic stimulation dose: Definition, selection, and reporting practices. Brain Stimul. 2012, 5, 435–453. [Google Scholar] [CrossRef]
- Lefaucheur, J.-P.; Antal, A.; Ayache, S.S.; Benninger, D.H.; Brunelin, J.; Cogiamanian, F.; Cotelli, M.; De Ridder, D.; Ferrucci, R.; Langguth, B.; et al. Evidence-based guidelines on the therapeutic use of transcranial direct current stimulation (tDCS). Clin. Neurophysiol. 2016, 128, 56–92. [Google Scholar] [CrossRef]
- Antal, A.; Herrmann, C.S. Transcranial Alternating Current and Random Noise Stimulation: Possible Mechanisms. Neural Plast. 2016, 2016, 3616807. [Google Scholar] [CrossRef]
- Huang, Y.; Liu, A.A.; Lafon, B.; Friedman, D.; Dayan, M.; Wang, X.; Bikson, M.; Doyle, W.K.; Devinsky, O.; Parra, L.C. Measurements and models of electric fields in the in vivo human brain during transcranial electric stimulation. eLife 2017, 6, e18834. [Google Scholar] [CrossRef]
- Reato, D.; Salvador, R.; Bikson, M.; Opitz, A.; Dmochowski, J.; Miranda, P.C. Principles of Transcranial Direct Current Stimulation (tDCS): Introduction to the Biophysics of tDCS. In Practical Guide to Transcranial Direct Current Stimulation; Springer International Publishing: Cham, Switzerland, 2019; pp. 45–80. [Google Scholar] [CrossRef]
- Opitz, A.; Falchier, A.; Yan, C.-G.; Yeagle, E.M.; Linn, G.S.; Megevand, P.; Thielscher, A.; Deborah, R.A.; Milham, M.P.; Mehta, A.D.; et al. Spatiotemporal structure of intracranial electric fields induced by transcranial electric stimulation in humans and nonhuman primates. Sci. Rep. 2016, 6, 31236. [Google Scholar] [CrossRef] [PubMed]
- Opitz, A.; Falchier, A.; Linn, G.S.; Milham, M.P.; Schroeder, C.E. Limitations of ex vivo measurements for in vivo neuroscience. Proc. Natl. Acad. Sci. USA 2017, 114, 5243–5246. [Google Scholar] [CrossRef] [PubMed]
- Datta, A.; Krause, M.R.; Pilly, P.K.; Choe, J.; Zanos, T.P.; Thomas, C.; Pack, C.C. On comparing in vivo intracranial recordings in non-human primates to predictions of optimized transcranial electrical stimulation. In Proceedings of the 2016 38th Annual International Conference of the IEEE Engineering in Medicine and Biology Society (EMBC), Orlando, FL, USA, 16–20 August 2016; pp. 1774–1777. [Google Scholar] [CrossRef]
- Parazzini, M.; Fiocchi, S.; Liorni, I.; Rossi, E.; Cogiamanian, F.; Vergari, M.; Priori, A.; Ravazzani, P. Modeling the current density generated by transcutaneous spinal direct current stimulation (tsDCS). Clin. Neurophysiol. 2014, 125, 2260–2270. [Google Scholar] [CrossRef] [PubMed]
- Datta, A.; Bansal, V.; Diaz, J.; Patel, J.; Reato, D.; Bikson, M. Gyri-precise head model of transcranial direct current stimulation: Improved spatial focality using a ring electrode versus conventional rectangular pad. Brain Stimul. 2009, 2, 201–207.e1. [Google Scholar] [CrossRef]
- Senço, N.M.; Huang, Y.; D’Urso, G.; Parra, L.C.; Bikson, M.; Mantovani, A.; Shavitt, R.G.; Hoexter, M.Q.; Miguel, E.C.; Brunoni, A.R. Transcranial direct current stimulation in obsessive–compulsive disorder: Emerging clinical evidence and considerations for optimal montage of electrodes. Expert Rev. Med. Devices 2015, 12, 381–391. [Google Scholar] [CrossRef]
- Alekseichuk, I.; Mantell, K.; Shirinpour, S.; Opitz, A. Comparative modeling of transcranial magnetic and electric stimulation in mouse, monkey, and human. NeuroImage 2019, 194, 136–148. [Google Scholar] [CrossRef]
- Neuling, T.; Wagner, S.; Wolters, C.H.; Zaehle, T.; Herrmann, C.S. Finite-element model predicts current density distribution for clinical applications of tDCS and tACS. Front. Psychiatry 2012, 3, 83. [Google Scholar] [CrossRef]
- Ciechanski, P.; Carlson, H.L.; Yu, S.S.; Kirton, A. Modeling transcranial direct-current stimulation-induced electric fields in children and adults. Front. Hum. Neurosci. 2018, 12, 268. [Google Scholar] [CrossRef]
- Fiocchi, S.; Ravazzani, P.; Priori, A.; Parazzini, M. Cerebellar and Spinal Direct Current Stimulation in Children: Computational Modeling of the Induced Electric Field. Front. Hum. Neurosci. 2016, 10. [Google Scholar] [CrossRef]
- Jackson, M.P.; Rahman, A.; Lafon, B.; Kronberg, G.; Ling, D.; Parra, L.C.; Bikson, M. Animal models of transcranial direct current stimulation: Methods and mechanisms. Clin. Neurophysiol. 2016, 127, 3425–3454. [Google Scholar] [CrossRef]
- Saturnino, G.B.; Thielscher, A.; Madsen, K.H.; Knösche, T.R.; Weise, K. A principled approach to conductivity uncertainty analysis in electric field calculations. NeuroImage 2018, 188, 821–834. [Google Scholar] [CrossRef] [PubMed]
- Opitz, A.; Yeagle, E.; Thielscher, A.; Schroeder, C.; Mehta, A.D.; Milham, M.P. On the importance of precise electrode placement for targeted transcranial electric stimulation. NeuroImage 2018, 181, 560–567. [Google Scholar] [CrossRef] [PubMed]
- Puonti, O.; Saturnino, G.B.; Madsen, K.H.; Thielscher, A. Value and limitations of intracranial recordings for validating electric field modeling for transcranial brain stimulation. NeuroImage 2019, 208, 116431. [Google Scholar] [CrossRef] [PubMed]
- Salimpour, Y.; Liu, C.C.; Webber, W.R.; Mills, K.A.; Anderson, W.S. Subdural recordings from an awake human brain for measuring current intensity during transcranial direct current stimulation. In Proceedings of the 2017 39th Annual International Conference of the IEEE Engineering in Medicine and Biology Society (EMBC), Jeju, Korea, 11–15 July 2017; pp. 1110–1113. [Google Scholar] [CrossRef]
- Farahani, F.; Sharma, M.; Parra, L.C.; Bikson, M. Animal Models of tES: Methods, Techniques, and Safety. In Transcranial Direct Current Stimulation in Neuropsychiatric Disorders; Springer: Cham, Switzerland, 2021; pp. 49–66. [Google Scholar] [CrossRef]
- Kar, K.; Duijnhouwer, J.; Krekelberg, B. Transcranial alternating current stimulation attenuates neuronal adaptation. J. Neurosci. 2017, 37, 2325–2335. [Google Scholar] [CrossRef]
- Krause, M.R.; Vieira, P.G.; Csorba, B.A.; Pilly, P.K.; Pack, C.C. Transcranial alternating current stimulation entrains single-neuron activity in the primate brain. Proc. Natl. Acad. Sci. USA 2019, 116, 5747–5755. [Google Scholar] [CrossRef]
- Johnson, L.; Alekseichuk, I.; Krieg, J.; Doyle, A.; Yu, Y.; Vitek, J.; Johnson, M.; Opitz, A. Dose-Dependent Effects of Transcranial Alternating Current Stimulation on Spike Timing in Awake Nonhuman Primates. BioRxiv 2019. [Google Scholar] [CrossRef]
- Campbell, A.; Wu, C. Chronically implanted intracranial electrodes: Tissue reaction and electrical changes. Micromachines 2018, 9, 430. [Google Scholar] [CrossRef] [PubMed]
- Lafon, B.; Henin, S.; Huang, Y.; Friedman, D.; Melloni, L.; Thesen, T.; Doyle, W.; Buzsáki, G.; Devinsky, O.; Parra, L.C.; et al. Low Frequency Transcranial Electrical Stimulation Does Not Entrain Sleep Rhythms Measured by Human Intracranial Recordings. Nat. Commun. 2017, 8, 1–14. [Google Scholar] [CrossRef]
- McLaren, M.E.; Nissim, N.R.; Woods, A.J. The effects of medication use in transcranial direct current stimulation: A brief review. Brain Stimul. 2018, 11, 52–58. [Google Scholar] [CrossRef] [PubMed]
- Chhatbar, P.Y.; Kautz, S.A.; Takacs, I.; Rowland, N.C.; Revuelta, G.J.; George, M.S.; Bikson, M.; Feng, W. Evidence of transcranial direct current stimulation-generated electric fields at subthalamic level in human brain in vivo. Brain Stimul. 2018, 11, 727–733. [Google Scholar] [CrossRef] [PubMed]
- Grossman, N.; Bono, D.; Dedic, N.; Kodandaramaiah, S.B.; Rudenko, A.; Suk, H.J.; Cassara, A.M.; Neufeld, E.; Kuster, N.; Tsai, L.-H.; et al. Noninvasive Deep Brain Stimulation via Temporally Interfering Electric Fields. Cell 2017, 169, 1029–1041.e16. [Google Scholar] [CrossRef] [PubMed]
- Ruhnau, P.; Rufener, K.S.; Heinze, H.J.; Zaehle, T. Sailing in a sea of disbelief: In vivo measurements of transcranial electric stimulation in human subcortical structures. Brain Stimul. 2018, 11, 241–243. [Google Scholar] [CrossRef]
- Esmaeilpour, Z.; Milosevic, M.; Azevedo, K.; Khadka, N.; Navarro, J.; Brunoni, A.; Popovic, M.R.; Bikson, M.; Fonoff, E.T. Proceedings #21. Intracranial voltage recording during transcranial direct current stimulation (tDCS) in human subjects with validation of a standard model. Brain Stimul. 2017, 10, e72–e75. [Google Scholar] [CrossRef]
- Louviot, S.; Tyvaert, L.; Maillard, L.G.; Colnat-Coulbois, S.; Dmochowski, J.; Koessler, L. Transcranial Electrical Stimulation generates electric fields in deep human brain structures. Brain Stimul. 2022, 15, 1–12. [Google Scholar] [CrossRef]
- Alekseichuk, I.; Falchier, A.Y.; Linn, G.; Xu, T.; Milham, M.P.; Schroeder, C.E.; Opitz, A. Electric field dynamics in the brain during multi-electrode transcranial electric stimulation. Nat. Commun. 2019, 10, 2573. [Google Scholar] [CrossRef]
- Gabriel, C.; Gabriel, S.; Corthout, E. The dielectric properties of biological tissues: I. Literature survey. Phys. Med. Biol. 1996, 41, 2231–2249. [Google Scholar] [CrossRef] [PubMed]
- Francis, J.T.; Gluckman, B.J.; Schiff, S.J. Sensitivity of neurons to weak electric fields. J. Neurosci. 2003, 23, 7255–7261. [Google Scholar] [CrossRef] [PubMed]
- Ozen, S.; Sirota, A.; Belluscio, M.A.; Anastassiou, C.A.; Stark, E.; Koch, C.; Buzsáki, G. Transcranial electric stimulation entrains cortical neuronal populations in rats. J. Neurosci. 2010, 30, 11476–11485. [Google Scholar] [CrossRef]
- Terzuolo, C.A.; Bullock, T.H. Measurement of imposed voltage gradient adequate to modulate neuronal firing. Proc. Natl. Acad. Sci. USA 1956, 42, 687–694. [Google Scholar] [CrossRef]
- Chhatbar, P.Y.; George, M.S.; Kautz, S.A.; Feng, W. Charge density, not current density, is a more comprehensive safety measure of transcranial direct current stimulation. Brain Behav. Immun. 2017, 66, 414–415. [Google Scholar] [CrossRef][Green Version]
- Roche, N.; Geiger, M.; Bussel, B. Mechanisms underlying transcranial direct current stimulation in rehabilitation. Ann. Phys. Rehabil. Med. 2015, 58, 214–219. [Google Scholar] [CrossRef]
- Reato, D.; Rahman, A.; Bikson, M.; Parra, L.C. Low-intensity electrical stimulation affects network dynamics by modulating population rate and spike timing. J. Neurosci. 2010, 30, 15067–15079. [Google Scholar] [CrossRef]
- Anastassiou, C.A.; Perin, R.; Markram, H.; Koch, C. Ephaptic coupling of cortical neurons. Nat. Neurosci. 2011, 14, 217–224. [Google Scholar] [CrossRef] [PubMed]
- Vöröslakos, M.; Takeuchi, Y.; Brinyiczki, K.; Zombori, T.; Oliva, A.; Fernández-Ruiz, A.; Kozák, G.; Kincses, Z.T.; Iványi, B.; Buzsáki, G.; et al. Direct effects of transcranial electric stimulation on brain circuits in rats and humans. Nat. Commun. 2018, 9, 483. [Google Scholar] [CrossRef] [PubMed]
- Bikson, M.; Esmaeilpour, Z.; Adair, D.; Kronberg, G.; Tyler, W.J.; Antal, A.; Datta, A.; Sabel, B.A.; Nitsche, M.A.; Loo, C. Transcranial electrical stimulation nomenclature. Brain Stimul. 2019, 12, 1349–1366. [Google Scholar] [CrossRef]
- Plonsey, R.; Heppner, D.B. Considerations of quasi-stationarity in electrophysiological systems. Bull. Math. Biophys. 1967, 29, 657–664. [Google Scholar] [CrossRef] [PubMed]
- Wagner, S.; Rampersad, S.M.; Aydin, Ü.; Vorwerk, J.; Oostendorp, T.F.; Neuling, T.; Herrmann, C.S.; Stegeman, D.F.; Wolters, C.H. Investigation of tDCS volume conduction effects in a highly realistic head model. J. Neural Eng. 2014, 11, 016002. [Google Scholar] [CrossRef] [PubMed]
- Truong, D.Q.; Bikson, M. Physics of Transcranial Direct Current Stimulation Devices and Their History. J. ECT 2018, 34, 137–143. [Google Scholar] [CrossRef]
- D’Urso, G.; Bruzzese, D.; Ferrucci, R.; Priori, A.; Pascotto, A.; Galderisi, S.; Altamura, A.C.; Bravaccio, C. Transcranial direct current stimulation for hyperactivity and noncompliance in autistic disorder. World J. Biol. Psychiatry 2015, 16, 361–366. [Google Scholar] [CrossRef]
- Datta, A.; Truong, D.; Minhas, P.; Parra, L.C.; Bikson, M. Inter-individual variation during transcranial direct current stimulation and normalization of dose using MRI-derived computational models. Front. Psychiatry 2012, 3, 91. [Google Scholar] [CrossRef]
- Bikson, M.; Rahman, A.; Datta, A. Computational models of transcranial direct current stimulation. Clin. EEG Neurosci. 2012, 43, 176–183. [Google Scholar] [CrossRef]
- Truong, D.Q.; Magerowski, G.; Blackburn, G.L.; Bikson, M.; Alonso-Alonso, M. Computational modeling of transcranial direct current stimulation (tDCS) in obesity: Impact of head fat and dose guidelines. NeuroImage Clin. 2013, 2, 759–766. [Google Scholar] [CrossRef] [PubMed][Green Version]
- Rezaee, Z.; Dutta, A. Cerebellar lobules optimal stimulation (CLOS): A computational pipeline to optimize cerebellar lobule-specific electric field distribution. Front. Neurosci. 2019, 13, 266. [Google Scholar] [CrossRef] [PubMed]
- Parazzini, M.; Rossi, E.; Ferrucci, R.; Liorni, I.; Priori, A.; Ravazzani, P. Modelling the electric field and the current density generated by cerebellar transcranial DC stimulation in humans. Clin. Neurophysiol. 2014, 125, 577–584. [Google Scholar] [CrossRef] [PubMed]
- Parazzini, M.; Rossi, E.; Ferrucci, R.; Fiocchi, S.; Liorni, I.; Priori, A.; Ravazzani, P. Computational model of cerebellar transcranial direct current stimulation. In Proceedings of the 2013 35th Annual International Conference of the IEEE Engineering in Medicine and Biology Society (EMBC), Osaka, Japan, 3–7 July 2013; pp. 237–240. [Google Scholar] [CrossRef]
- Opitz, A.; Paulus, W.; Will, S.; Antunes, A.; Thielscher, A. Determinants of the electric field during transcranial direct current stimulation. Neuroimage 2015, 109, 140–150. [Google Scholar] [CrossRef] [PubMed]
- Ho, K.A.; Taylor, J.L.; Chew, T.; Gálvez, V.; Alonzo, A.; Bai, S.; Dokos, S.; Loo, C.K. The Effect of Transcranial Direct Current Stimulation (tDCS) Electrode Size and Current Intensity on Motor Cortical Excitability: Evidence from Single and Repeated Sessions. Brain Stimul. 2016, 9, 1–7. [Google Scholar] [CrossRef]
- Priori, A.; Bertolasi, L.; Rothwell, J.C.; Day, B.L.; Marsden, C.D. Some saccadic eye movements can be delayed by transcranial magnetic stimulation of the cerebral cortex in man. Brain 1993, 116, 355–367. [Google Scholar] [CrossRef]
- Rech, F.; Wassermann, D.; Duffau, H. New insights into the neural foundations mediating movement/language interactions gained from intrasurgical direct electrostimulations. Brain Cogn. 2020, 142, 105583. [Google Scholar] [CrossRef]
- Rolland, A.; Herbet, G.; Duffau, H. Awake Surgery for Gliomas within the Right Inferior Parietal Lobule: New Insights into the Functional Connectivity Gained from Stimulation Mapping and Surgical Implications. World Neurosurg. 2018, 112, e393–e406. [Google Scholar] [CrossRef]
- Priori, A.; Maiorana, N.; Dini, M.; Guidetti, M.; Marceglia, S.; Ferrucci, R. Adaptive deep brain stimulation (aDBS). Int. Rev. Neurobiol. 2021, 159, 111–127. [Google Scholar] [CrossRef]
- Marceglia, S.; Guidetti, M.; Harmsen, I.E.; Loh, A.; Meoni, S.; Foffani, G.; Lozano, A.M.; Volkmann, J.; Moro, E.; Priori, A. Deep brain stimulation: Is it time to change gears by closing the loop? J. Neural Eng. 2021, 18, 061001. [Google Scholar] [CrossRef] [PubMed]
- Rossi, L.; Marceglia, S.; Foffani, G.; Cogiamanian, F.; Tamma, F.; Rampini, P.; Barbieri, S.; Bracchi, F.; Priori, A. Subthalamic local field potential oscillations during ongoing deep brain stimulation in Parkinson’s disease. Brain Res. Bull. 2008, 76, 512–521. [Google Scholar] [CrossRef] [PubMed]
- Duffau, H. Stimulation mapping of white matter tracts to study brain functional connectivity. Nat. Rev. Neurol. 2015, 11, 255–265. [Google Scholar] [CrossRef] [PubMed]
- Duffau, H. The death of localizationism: The concepts of functional connectome and neuroplasticity deciphered by awake mapping, and their implications for best care of brain-damaged patients. Rev. Neurol. 2021, 177, 1093–1103. [Google Scholar] [CrossRef] [PubMed]
- Southwell, D.G.; Hervey-Jumper, S.L.; Perry, D.W.; Berger, M.S. Intraoperative mapping during repeat awake craniotomy reveals the functional plasticity of adult cortex. J. Neurosurg. 2016, 124, 1460–1469. [Google Scholar] [CrossRef]
- Bährend, I.; Muench, M.R.; Schneider, H.; Moshourab, R.; Dreyer, F.R.; Vajkoczy, P.; Picht, T.; Faust, K. Incidence and linguistic quality of speech errors: A comparison of preoperative transcranial magnetic stimulation and intraoperative direct cortex stimulation. J. Neurosurg. 2020, 134, 1409–1418. [Google Scholar] [CrossRef]
- Krieg, S.M.; Sollmann, N.; Hauck, T.; Ille, S.; Meyer, B.; Ringel, F. Repeated mapping of cortical language sites by preoperative navigated transcranial magnetic stimulation compared to repeated intraoperative DCS mapping in awake craniotomy. BMC Neurosci. 2014, 15, 20. [Google Scholar] [CrossRef]
- Ille, S.; Sollmann, N.; Hauck, T.; Maurer, S.; Tanigawa, N.; Obermueller, T.; Negwer, C.; Droese, D.; Boeckh-Behrens, T.; Meyer, B.; et al. Impairment of preoperative language mapping by lesion location: A functional magnetic resonance imaging, navigated transcranial magnetic stimulation, and direct cortical stimulation study. J. Neurosurg. 2015, 123, 314–324. [Google Scholar] [CrossRef]
- Law, S.K. Thickness and resistivity variations over the upper surface of the human skull. Brain Topogr. 1993, 6, 99–109. [Google Scholar] [CrossRef]
- Datta, A.; Baker, J.M.; Bikson, M.; Fridriksson, J. Individualized model predicts brain current flow during transcranial direct-current stimulation treatment in responsive stroke patient. Brain Stimul. 2011, 4, 169–174. [Google Scholar] [CrossRef]
- Wagner, T.; Fregni, F.; Fecteau, S.; Grodzinsky, A.; Zahn, M.; Pascual-Leone, A. Transcranial direct current stimulation: A computer-based human model study. Neuroimage 2007, 35, 1113–1124. [Google Scholar] [CrossRef] [PubMed]
- Datta, A.; Bikson, M.; Fregni, F.; Hall, S. Transcranial Direct Current Stimulation in Patients with Skull Defects and Skull Plates: High-Resolution Computational FEM Study of Factors Altering Cortical Current Flow. Neuroimage 2010, 52, 1268–1278. [Google Scholar] [CrossRef]
- Sun, W.; Dong, X.; Yu, G.; Shuai, L.; Yuan, Y.; Ma, C. Transcranial direct current stimulation in patients after decompressive craniectomy: A finite element model to investigate factors affecting the cortical electric field. J. Int. Med. Res. 2021, 49, 0300060520942112. [Google Scholar] [CrossRef] [PubMed]
- Rampersad, S.M.; Stegeman, D.F.; Oostendorp, T.F. Single-layer skull approximations perform well in Transcranial direct current stimulation modeling. IEEE Trans. Neural Syst. Rehabil. Eng. 2013, 21, 346–353. [Google Scholar] [CrossRef] [PubMed]
- Bikson, M.; Grossman, P.; Thomas, C.; Zannou, A.L.; Jiang, J.; Adnan, T.; Mourdoukoutas, A.P.; Kronberg, G.; Truong, D.; Boggio, P.; et al. Safety of Transcranial Direct Current Stimulation: Evidence Based Update 2016. Brain Stimul. 2016, 9, 641–661. [Google Scholar] [CrossRef]
- Kuck, A.; Stegeman, D.F.; Van Asseldonk, E.H.F. Modeling Trans-Spinal Direct Current Stimulation in the Presence of Spinal Implants. IEEE Trans. Neural Syst. Rehabil. Eng. 2019, 27, 790–797. [Google Scholar] [CrossRef]
- Márquez-Ruiz, J.; Leal-Campanario, R.; Sańchez-Campusano, R.; Molaee-Ardekani, B.; Wendling, F.; Miranda, P.C.; Ruffini, G.; Gruart, A.; Delgado-García, J.M. Transcranial direct-current stimulation modulates synaptic mechanisms involved in associative learning in behaving rabbits. Proc. Natl. Acad. Sci. USA 2012, 109, 6710–6715. [Google Scholar] [CrossRef]
- Van Buyten, J.P.; Smet, I.; Van De Kelft, E. Electromagnetic navigation technology for more precise electrode placement in the foramen ovale: A technical report. Neuromodulation 2009, 12, 244–249. [Google Scholar] [CrossRef] [PubMed]
- Mekonnen, A.; Salvador, R.; Ruffini, G.; Miranda, P.C. The relationship between transcranial Current Stimulation electrode montages and the effect of the skull orbital openings. In Proceedings of the 2012 Annual International Conference of the IEEE Engineering in Medicine and Biology Society, San Diego, CA, USA, 28 August–1 September 2012; pp. 831–834. [Google Scholar] [CrossRef]
- Jackson, M.P.; Truong, D.; Brownlow, M.L.; Wagner, J.A.; McKinley, R.A.; Bikson, M.; Jankord, R. Safety parameter considerations of anodal transcranial Direct Current Stimulation in rats. Brain Behav. Immun. 2017, 64, 152–161. [Google Scholar] [CrossRef]
- Rueger, M.A.; Keuters, M.H.; Walberer, M.; Braun, R.; Klein, R.; Sparing, R.; Fink, G.R.; Graf, R.; Schroeter, M. Multi-session transcranial direct current stimulation (tDCS) elicits inflammatory and regenerative processes in the rat brain. PLoS ONE 2012, 7, e43776. [Google Scholar] [CrossRef]
- Liu, A.; Vöröslakos, M.; Kronberg, G.; Henin, S.; Krause, M.R.; Huang, Y.; Opitz, A.; Mehta, A.; Pack, C.C.; Krekelberg, B.; et al. Immediate neurophysiological effects of transcranial electrical stimulation. Nat. Commun. 2018, 9, 5092. [Google Scholar] [CrossRef] [PubMed]
- Sala, G.; Bocci, T.; Borzì, V.; Parazzini, M.; Priori, A.; Ferrarese, C. Direct current stimulation enhances neuronal alpha-synuclein degradation in vitro. Sci. Rep. 2021, 11, 2197. [Google Scholar] [CrossRef] [PubMed]
- Mohan, H.; Verhoog, M.B.; Doreswamy, K.K.; Eyal, G.; Aardse, R.; Lodder, B.N.; Goriounova, N.; Asamoah, B.; Brakspear, A.C.B.; Groot, C.; et al. Dendritic and Axonal Architecture of Individual Pyramidal Neurons across Layers of Adult Human Neocortex. Cereb. Cortex. 2015, 25, 4839–4853. [Google Scholar] [CrossRef]
- D’Urso, G.; Dell’Osso, B.; Rossi, R.; Brunoni, A.R.; Bortolomasi, M.; Ferrucci, R.; Priori, A.; de Bartolomeis, A.; Altamura, A.C. Clinical predictors of acute response to transcranial direct current stimulation (tDCS) in major depression. J. Affect. Disord. 2017, 219, 25–30. [Google Scholar] [CrossRef]
- Datta, A.; Elwassif, M.; Battaglia, F.; Bikson, M. Transcranial current stimulation focality using disc and ring electrode configurations: FEM analysis. J. Neural Eng. 2008, 5, 163. [Google Scholar] [CrossRef] [PubMed]
- Ahman, A.; Reato, D.; Arlotti, M.; Gasca, F.; Datta, A.; Parra, L.C.; Bikson, M. Cellular effects of acute direct current stimulation: Somatic and synaptic terminal effects. J. Physiol. 2013, 591, 2563–2578. [Google Scholar] [CrossRef]
- Sharma, M.; Farahani, F.; Bikson, M.; Parra, L.C. Animal Studies on the Mechanisms of Low-Intensity Transcranial Electric Stimulation. In Transcranial Direct Current Stimulation in Neuropsychiatric Disorders; Springer: Cham, Switzerland, 2021; pp. 67–92. [Google Scholar] [CrossRef]
- Kelly, R.C.; Smith, M.A.; Samonds, J.M.; Kohn, A.; Bonds, A.B.; Movshon, J.A.; Lee, T.S. Comparison of Recordings from Microelectrode Arrays and Single Electrodes in the Visual Cortex. J. Neurosci. 2007, 27, 261–264. [Google Scholar] [CrossRef]
- Obien, M.E.J.; Deligkaris, K.; Bullmann, T.; Bakkum, D.J.; Frey, U. Revealing neuronal function through microelectrode array recordings. Front. Neurosci. 2015, 9, 423. [Google Scholar] [CrossRef]
- Miranda, P.C.; Lomarev, M.; Hallett, M. Modeling the current distribution during transcranial direct current stimulation. Clin. Neurophysiol. 2006, 117, 1623–1629. [Google Scholar] [CrossRef]
- Minhas, P.; Datta, A.; Bikson, M. Cutaneous perception during tDCS: Role of electrode shape and sponge salinity. Clin. Neurophysiol. 2011, 122, 637–638. [Google Scholar] [CrossRef]
- Vanni, M.P.; Thomas, S.; Petry, H.M.; Bickford, M.E.; Casanova, C. Spatiotemporal Profile of Voltage-Sensitive Dye Responses in the Visual Cortex of Tree Shrews Evoked by Electric Microstimulation of the Dorsal Lateral Geniculate and Pulvinar Nuclei. J. Neurosci. 2015, 35, 11891–11896. [Google Scholar] [CrossRef] [PubMed]
- Takeshita, D.; Premachandra, K.; Bahar, S.; Tsytsarev, V. Imaging cortical electrical stimulation in vivo: Fast intrinsic optical signal versus voltage-sensitive dyes. Opt. Lett. 2008, 33, 1032–1034. [Google Scholar] [CrossRef]
- Grinvald, A.; Lieke, E.; Frostig, R.D.; Gilbert, C.D.; Wiesel, T.N. Functional architecture of cortex revealed by optical imaging of intrinsic signals. Nature 1986, 324, 361–364. [Google Scholar] [CrossRef] [PubMed]
- Frostig, R.D.; Lieke, E.E.; Ts’o, D.Y.; Grinvald, A. Cortical functional architecture and local coupling between neuronal activity and the microcirculation revealed by in vivo high-resolution optical imaging of intrinsic signals. Proc. Natl. Acad. Sci. USA 1990, 87, 6082–6086. [Google Scholar] [CrossRef]
- Uchida, N.; Takahashi, Y.K.; Tanifuji, M.; Mori, K. Odor maps in the mammalian olfactory bulb: Domain organization and odorant structural features. Nat. Neurosci. 2000, 3, 1035–1043. [Google Scholar] [CrossRef] [PubMed]
- O’Farrell, A.M.; Rex, D.E.; Muthialu, A.; Pouratian, N.; Wong, G.K.; Cannestra, A.F.; Chen, J.W.Y.; Toga, A.W. Characterization of optical intrinsic signals and blood volume during cortical spreading depression. Neuroreport 2000, 11, 2121–2125. [Google Scholar] [CrossRef]
- Pál, I.; Nyitrai, G.; Kardos, J.; Héja, L. Neuronal and Astroglial Correlates Underlying Spatiotemporal Intrinsic Optical Signal in the Rat Hippocampal Slice. PLoS ONE 2013, 8, e57694. [Google Scholar] [CrossRef]
- Esmaeilpour, Z.; Marangolo, P.; Hampstead, B.M.; Bestmann, S.; Galletta, E.; Knotkova, H.; Bikson, M. Incomplete evidence that increasing current intensity of tDCS boosts outcomes. Brain Stimul. 2018, 11, 310–321. [Google Scholar] [CrossRef] [PubMed]
- Kronberg, G.; Bridi, M.; Abel, T.; Bikson, M.; Parra, L.C. Direct Current Stimulation Modulates LTP and LTD: Activity Dependence and Dendritic Effects. Brain Stimul. 2017, 10, 51–58. [Google Scholar] [CrossRef] [PubMed]
- Ranieri, F.; Podda, M.V.; Riccardi, E.; Frisullo, G.; Dileone, M.; Profice, P.; Pilato, F.; Di Lazzaro, V.; Grassi, C. Modulation of LTP at rat hippocampal CA3-CA1 synapses by direct current stimulation. J. Neurophysiol. 2012, 107, 1868–1880. [Google Scholar] [CrossRef] [PubMed]
- Thair, H.; Holloway, A.L.; Newport, R.; Smith, A.D. Transcranial direct current stimulation (tDCS): A Beginner’s guide for design and implementation. Front. Neurosci. 2017, 11, 641. [Google Scholar] [CrossRef]
- Zhu, C.E.; Yu, B.; Zhang, W.; Chen, W.H.; Qi, Q.; Miao, Y. Effectiveness and safety of transcranial direct current stimulation in fibromyalgia: A systematic review and meta-analysis. J. Rehabil. Med. 2017, 49, 2–9. [Google Scholar] [CrossRef]
- Caulfield, K.A.; Badran, B.W.; DeVries, W.H.; Summers, P.M.; Kofmehl, E.; Li, X.; Borckardt, J.J.; Bikson, M.; George, M.S. Transcranial electrical stimulation motor threshold can estimate individualized tDCS dosage from reverse-calculation electric-field modeling. Brain Stimul. 2020, 13, 961–969. [Google Scholar] [CrossRef] [PubMed]
- Seo, H.; Jun, S.C. Relation between the electric field and activation of cortical neurons in transcranial electrical stimulation. Brain Stimul. 2019, 12, 275–289. [Google Scholar] [CrossRef]
- Monai, H.; Hirase, H. Astrocytes as a target of transcranial direct current stimulation (tDCS) to treat depression. Neurosci. Res. 2018, 126, 15–21. [Google Scholar] [CrossRef]
- Radman, T.; Ramos, R.L.; Brumberg, J.C.; Bikson, M. Role of cortical cell type and morphology in subthreshold and suprathreshold uniform electric field stimulation in vitro. Brain Stimul. 2009, 2, 215–228.e3. [Google Scholar] [CrossRef]
- Kabakov, A.Y.; Muller, P.A.; Pascual-Leone, A.; Jensen, F.E.; Rotenberg, A. Contribution of axonal orientation to pathway-dependent modulation of excitatory transmission by direct current stimulation in isolated rat hippocampus. J. Neurophysiol. 2012, 107, 1881–1889. [Google Scholar] [CrossRef]
- Negahbani, E.; Stitt, I.M.; Davey, M.; Doan, T.T.; Dannhauer, M.; Hoover, A.C.; Peterchev, A.V.; Radtke-Schuller, S.; Fröhlich, F. Transcranial Alternating Current Stimulation (tACS) Entrains Alpha Oscillations by Preferential Phase Synchronization of Fast-Spiking Cortical Neurons to Stimulation Waveform. BioRxiv 2019, 563163. [Google Scholar] [CrossRef]
- Pelletier, S.J.; Lagace, M.; St-Amour, I.; Arsenault, D.; Cisbani, G.; Chabrat, A.; Fecteau, S.; Lévesque, M.; Cicchetti, F. The Morphological and Molecular Changes of Brain Cells Exposed to Direct Current Electric Field Stimulation. Int. J. Neuropsychopharmacol. 2015, 18, pyu090. [Google Scholar] [CrossRef]
- Alexander, J.K.; Fuss, B.; Colello, R.J. Electric field-induced astrocyte alignment directs neurite outgrowth. Neuron. Glia Biol. 2006, 2, 93–103. [Google Scholar] [CrossRef]
- Borgens, R.B.; Shi, R.; Mohr, T.J.; Jaeger, C.B. Mammalian Cortical Astrocytes Align Themselves in a Physiological Voltage Gradient. Exp. Neurol. 1994, 128, 41–49. [Google Scholar] [CrossRef]
- Baer, M.L.; Henderson, S.C.; Colello, R.J. Elucidating the Role of Injury-Induced Electric Fields (EFs) in Regulating the Astrocytic Response to Injury in the Mammalian Central Nervous System. PLoS ONE 2015, 10, e0142740. [Google Scholar] [CrossRef]
- Massimini, M.; Amzica, F. Extracellular calcium fluctuations and intracellular potentials in the cortex during the slow sleep oscillation. J. Neurophysiol. 2001, 85, 1346–1350. [Google Scholar] [CrossRef]
- Ruohonen, J.; Karhu, J. TDCS possibly stimulates glial cells. Clin. Neurophysiol. 2012, 123, 2006–2009. [Google Scholar] [CrossRef]
- Gardner-Medwin, A.R.; Nicholson, C. Changes of extracellular potassium activity induced by electric current through brain tissue in the rat. J. Physiol. 1983, 335, 375–392. [Google Scholar] [CrossRef]
- Monai, H.; Ohkura, M.; Tanaka, M.; Oe, Y.; Konno, A.; Hirai, H.; Mikoshiba, K.; Itohara, S.; Nakai, J.; Iwai, Y.; et al. Calcium imaging reveals glial involvement in transcranial direct current stimulation-induced plasticity in mouse brain. Nat. Commun. 2016, 7, 11100. [Google Scholar] [CrossRef]
- Liebetanz, D.; Koch, R.; Mayenfels, S.; König, F.; Paulus, W.; Nitsche, M.A. Safety limits of cathodal transcranial direct current stimulation in rats. Clin. Neurophysiol. 2009, 120, 1161–1167. [Google Scholar] [CrossRef]
- Korai, S.A.; Ranieri, F.; Di Lazzaro, V.; Papa, M.; Cirillo, G. Neurobiological After-Effects of Low Intensity Transcranial Electric Stimulation of the Human Nervous System: From Basic Mechanisms to Metaplasticity. Front. Neurol. 2021, 12, 3. [Google Scholar] [CrossRef]
- Guo, T.; Fang, J.; Tong, Z.Y.; He, S.; Luo, Y. Transcranial Direct Current Stimulation Ameliorates Cognitive Impairment via Modulating Oxidative Stress, Inflammation, and Autophagy in a Rat Model of Vascular Dementia. Front. Neurosci. 2020, 14, 28. [Google Scholar] [CrossRef] [PubMed]
- Zhang, K.; Guo, L.; Zhang, J.; Rui, G.; An, G.; Zhou, Y.; Lin, J.; Xing, J.; Zhao, T.; Ding, G. tDCS Accelerates the Rehabilitation of MCAO-Induced Motor Function Deficits via Neurogenesis Modulated by the Notch1 Signaling Pathway. Neurorehabil. Neural Repair. 2020, 34, 640–651. [Google Scholar] [CrossRef]
- Regner, G.G.; Torres, I.L.S.; de Oliveira, C.; Pflüger, P.; da Silva, L.S.; Scarabelot, V.L.; Ströher, R.; de Souza, A.; Fregni, F.; Pereira, P. Transcranial direct current stimulation (tDCS) affects neuroinflammation parameters and behavioral seizure activity in pentylenetetrazole-induced kindling in rats. Neurosci. Lett. 2020, 735, 135162. [Google Scholar] [CrossRef]
- Leffa, D.T.; Bellaver, B.; Salvi, A.A.; de Oliveira, C.; Caumo, W.; Grevet, E.H.; Fregni, F.; Quincozes-Santos, A.; Rohde, L.A.; Torres, I.L. Transcranial direct current stimulation improves long-term memory deficits in an animal model of attention-deficit/hyperactivity disorder and modulates oxidative and inflammatory parameters. Brain Stimul. 2018, 11, 743–751. [Google Scholar] [CrossRef]
- Li, Q.; Brus-Ramer, M.; Martin, J.H.; McDonald, J.W. Electrical stimulation of the medullary pyramid promotes proliferation and differentiation of oligodendrocyte progenitor cells in the corticospinal tract of the adult rat. Neurosci. Lett. 2010, 479, 128–133. [Google Scholar] [CrossRef]
- Braun, R.; Klein, R.; Walter, H.L.; Ohren, M.; Freudenmacher, L.; Getachew, K.; Ladwig, A.; Luelling, J.; Neumaier, B.; Endepols, H.; et al. Transcranial direct current stimulation accelerates recovery of function, induces neurogenesis and recruits oligodendrocyte precursors in a rat model of stroke. Exp. Neurol. 2016, 279, 127–136. [Google Scholar] [CrossRef]
- Baba, T.; Kameda, M.; Yasuhara, T.; Morimoto, T.; Kondo, A.; Shingo, T.; Tajiri, N.; Wang, F.; Miyoshi, Y.; Borlongan, C.V.; et al. Electrical stimulation of the cerebral cortex exerts antiapoptotic, angiogenic, and anti-inflammatory effects in ischemic stroke rats through phosphoinositide 3-kinase/Akt signaling pathway. Stroke 2009, 40, e598–e605. [Google Scholar] [CrossRef]
- Xia, Y.; Li, Y.; Khalid, W.; Bikson, M.; Fu, B.M. Direct Current Stimulation Disrupts Endothelial Glycocalyx and Tight Junctions of the Blood-Brain Barrier in vitro. Front. Cell Dev. Biol. 2021, 9, 2714. [Google Scholar] [CrossRef]
- Hladky, S.B.; Barrand, M.A. Mechanisms of fluid movement into, through and out of the brain: Evaluation of the evidence. Fluids Barriers CNS 2014, 11, 26. [Google Scholar] [CrossRef]
- Cancel, L.M.; Arias, K.; Bikson, M.; Tarbell, J.M. Direct current stimulation of endothelial monolayers induces a transient and reversible increase in transport due to the electroosmotic effect. Sci. Rep. 2018, 8, 9265. [Google Scholar] [CrossRef]
- Trivedi, D.P.; Hallock, K.J.; Bergethon, P.R. Electric fields caused by blood flow modulate vascular endothelial electrophysiology and nitric oxide production. Bioelectromagnetics 2013, 34, 22–30. [Google Scholar] [CrossRef]
- Sawyer, P.N.; Himmelfarb, E.; Lustrin, I.; Ziskind, H. Measurement of Streaming Potentials of Mammalian Blood Vessels, Aorta and Vena Cava, in Vivo. Biophys. J. 1966, 6, 641. [Google Scholar] [CrossRef]
- Wachter, D.; Wrede, A.; Schulz-Schaeffer, W.; Taghizadeh-Waghefi, A.; Nitsche, M.A.; Kutschenko, A.; Rohde, V.; Liebetanz, D. Transcranial direct current stimulation induces polarity-specific changes of cortical blood perfusion in the rat. Exp. Neurol. 2011, 227, 322–327. [Google Scholar] [CrossRef]

Publisher’s Note: MDPI stays neutral with regard to jurisdictional claims in published maps and institutional affiliations. |
© 2022 by the authors. Licensee MDPI, Basel, Switzerland. This article is an open access article distributed under the terms and conditions of the Creative Commons Attribution (CC BY) license (https://creativecommons.org/licenses/by/4.0/).
Share and Cite
Guidetti, M.; Arlotti, M.; Bocci, T.; Bianchi, A.M.; Parazzini, M.; Ferrucci, R.; Priori, A. Electric Fields Induced in the Brain by Transcranial Electric Stimulation: A Review of In Vivo Recordings. Biomedicines 2022, 10, 2333. https://doi.org/10.3390/biomedicines10102333
Guidetti M, Arlotti M, Bocci T, Bianchi AM, Parazzini M, Ferrucci R, Priori A. Electric Fields Induced in the Brain by Transcranial Electric Stimulation: A Review of In Vivo Recordings. Biomedicines. 2022; 10(10):2333. https://doi.org/10.3390/biomedicines10102333
Chicago/Turabian StyleGuidetti, Matteo, Mattia Arlotti, Tommaso Bocci, Anna Maria Bianchi, Marta Parazzini, Roberta Ferrucci, and Alberto Priori. 2022. "Electric Fields Induced in the Brain by Transcranial Electric Stimulation: A Review of In Vivo Recordings" Biomedicines 10, no. 10: 2333. https://doi.org/10.3390/biomedicines10102333
APA StyleGuidetti, M., Arlotti, M., Bocci, T., Bianchi, A. M., Parazzini, M., Ferrucci, R., & Priori, A. (2022). Electric Fields Induced in the Brain by Transcranial Electric Stimulation: A Review of In Vivo Recordings. Biomedicines, 10(10), 2333. https://doi.org/10.3390/biomedicines10102333