Article

Dummy Molecularly Imprinted Polymers Using DNP as a Template Molecule for Explosive Sensing and Nitroaromatic Compound Discrimination

by
Anna Herrera-Chacon
,
Andreu Gonzalez-Calabuig
and
Manel del Valle
*
Sensors and Biosensors Group, Department of Chemistry, Universitat Autònoma de Barcelona, Edifici Cn, Bellaterra, 08193 Barcelona, Spain
*
Author to whom correspondence should be addressed.
Chemosensors 2021, 9(9), 255; https://doi.org/10.3390/chemosensors9090255
Submission received: 4 August 2021 / Revised: 3 September 2021 / Accepted: 6 September 2021 / Published: 8 September 2021

Abstract

:
This work reports a rapid, simple and low-cost voltammetric sensor based on a dummy molecularly imprinted polymer (MIP) that uses 2,4-dinitrophenol (DNP) as a template for the quantification of 2,4,6-trinitrotoluene (TNT) and DNP, and the identification of related substances. Once the polymer was synthesised by thermal precipitation polymerisation, it was integrated onto a graphite epoxy composite (GEC) electrode via sol–gel immobilisation. Scanning electron microscopy (SEM) was performed in order to characterise the polymer and the sensor surface. Responses towards DNP and TNT were evaluated, displaying a linear response range of 1.5 to 8.0 µmol L−1 for DNP and 1.3 to 6.5 µmol L1 for TNT; the estimated limits of detection were 0.59 µmol L−1 and 0.29 µmol L−1, for DNP and TNT, respectively. Chemometric tools, in particular principal component analysis (PCA), demonstrated the possibilities of the MIP-modified electrodes in nitroaromatic and potential interfering species discrimination with multiple potential applications in the environmental field.

Graphical Abstract

1. Introduction

There is an increasing interest in analytical methods for determining, quantifying and discriminating pollutant compounds in different matrices. Desirably, the analytical response should be fast, portable, reliable, cost-effective, with low-power consumption, easy to manipulate, and able to be used in indoor and outdoor spaces for on-site measurements. The field of sensors and biosensors tackles this challenging demand, improving sensing abilities year by year. A key element in the performance of sensing devices is its recognition capability. Molecularly imprinted polymers (MIPs) can be introduced in biosensing as the necessary recognition element, in this case derived from a synthetic approach. As a result, the sensor field can improve response features in a simple and inexpensive manner by incorporating these new recognition elements, which may constitute an alternative to antibodies, for example.
MIPs acting as artificial receptors have demonstrated their applicability in several fields; among these, we can note the food industry [1,2], environmental monitoring [3,4], clinical diagnosis [5,6] and forensic field [7]. MIPs are perfect candidates to improve the performance of current analytical methods due to their versatility, functionality, and ability to sample pre-concentration [8], separation [9] and/or purification [10]; alternatively, they may be used as a recognition element for the development of different biosensing strategies [11,12] and also in drug delivery [13].
Recently, the use of dummy MIPs has been described, i.e., when MIPs are synthesised towards an analogue molecule of the target analyte, which cannot be used as a template during the synthesis of the polymer. This happens when the analyte is (1) expensive, (2) has a poor solubility or by-products are generated that hinder the imprinting, or (3) is considered a hazard. For example, the use of dummy MIPs has been reported for detecting fluoroquinolones in fish samples [14], for detecting bisphenol A in river water samples [15], and for providing an alternative to acrylamide removal in foodstuffs [16].
Precisely, the use of dummy MIPs is a choice of interest when aiming for the detection of explosive compounds [17], such as nitroaromatic species [18]. A habitual task in forensic laboratories is to detect or confirm the presence of explosives [19] or explosive residues [20]. There is also a need to quantify explosives at trace level after a detonation [21,22], or in contaminated underground water reservoirs [23].
Nitroaromatic species are excellent candidates for electrochemical sensing due to inherent electroactivity, given their characteristic electron-transfer reduction reactions and their electron-acceptor properties [24,25]. For all the above reasons, their electrochemical sensing ability has become a promising alternative to address the growing security needs of society. Specifically, TNT, a common nitroaromatic explosive, complies with the abovementioned characteristics, making it a candidate to employ the dummy MIP strategy [26]. The following Table 1 presents a survey of recently published methods for determining TNT and related substances, focusing on sensor based procedures.
The presence of TNT and its degradation products in bodies of water has been considered by environmental agencies as a major concern. For example, monitoring, clean-up and adsorption experimental methods are needed, especially in the case of explosive-related compounds, where the legally tolerated levels in ground waters are in the microgram per litre range [34]. Apart from facilities dedicated to the manufacturing, processing and storage of munitions, TNT can be released into the environment through spills, weapon firing, leaching from inadequately sealed impoundments, or zone demilitarization. TNT has been classified as a probable human carcinogen by the United States Environmental Protection Agency (USEPA) [35]. According to USEPA, TNT in drinking water poses a considerable risk of inducing cancer at concentrations above 0.44 μmol L−1 [36]. Thus, there is a need to develop affordable and reliable methods to determine TNT levels, which can be deployed on-field, especially in countries where the access to more sophisticated techniques, e.g., high-performance liquid chromatography (HPLC) or solid-phase extraction and gas chromatography/mass spectrometry (GC/MS), may not be accessible. In the same direction, the electrochemical sensor and polymer synthesis proposed here is easy to conduct in non-specialist laboratories and undemanding to reproduce, due to the cheap and readily available reagents and laboratory apparatus, which is an advantage in cases of resource-limited facilities.
Electrochemical sensors for the detection of nitroaromatic compounds, such as TNT, have been described in the literature in studies that use screen-printed sensors [37,38]; additionally, voltammetric sensors modified with cobalt phtalocyanine [39], carbon fibres [28], carbon nanotubes [40], mesoporous carbon [41] and gold nanoparticles and poly(carbazole-aniline) have been specially electropolymerized to imprint nitroaromatics and nitramines [29]. These electrochemical sensors have special advantages, including their ability to be miniaturised which enables them to be used in portable equipment, making on-field detection in difficult scenarios possible. In the same line, these electrochemical sensors may be also involved in the detection of analytes in water samples without the need for sample pre-treatment, which translates to faster measurements due to the absence of extractions with organic solvents or demanding procedures to clean up and pre-treat the samples.
Although several approaches have been recently reported, see Table 1, with extensive linear ranges and low limits of detection, we think that there has been a persistent, urgent need for a simple, cheap, and robust sensor which is able to detect and quantify TNT and DNP and to identify related substances in a fast and reliable manner in on-field situations.
In this study, the abovementioned purpose was accomplished by a molecularly imprinted polymer for TNT using the TNT analogue 2,4-dinitrophenol (DNP) as a dummy template. Obtained polymers in the form of microbeads were next integrated into graphite epoxy composite (GEC) electrodes in a fast, simple and versatile process, converting insulating polymers in a biomimetic recognition element able to be employed as a reusable voltammetric sensor. Responses of these developed sensors towards TNT and DNP were studied, and the selectivity was evaluated with respect to additional nitroaromatic species which could be interferents in real samples, such as: 1-nitrobenzene (1-NB), 4-nitrotoluene (4-NT), 1,3-dinitrobenzene (1-DNB), 2-nitrotoluene (NT), 2,4-dinitrotoluene (2,4-DNT), and 2,6-dinitrotoluene (2-DNT). At the same time, many of these mono-nitro and di-nitroaromatic compounds may be degradation products of energetic materials, which envisages their use in environmental applications [42,43,44].
The schematic plot of the imprinting process is depicted in Figure 1. The dummy molecularly imprinting approach is shown by replacing the DNP imprinting motif by the TNT as the final analyte.

2. Materials and Methods

2.1. Chemicals and Reagents

Tetramethyl orthosilicate (TEOS), hydrochloric acid, sodium hydroxide, 1,3-dinitrobenzene (DNB), 2-nitrotoluene (NT), 2,4-dinitritoluene (DNT), 2,6-dinitrotoluene and 2,4-dinitrophenol (DNP) were purchased from Merck (Darmstadt, Germany). Ethylene dimethacrylate (EGDMA), methacrylic acid (MAA), 1-nitrobenzene (NB) and 4-nitrotoluene (NT) were supplied by Acros Organics (Geel, Belgium). 2,4,6-trinitrotoluene (TNT) was obtained from LGC standards (Teddington, Middlesex, UK). Methanol (MeOH), ethanol (EtOH) and acetic acid (HAc) were acquired from Scharlab (Barcelona, Spain) and 2,2-azobis(2,4-dimethylvaleronitrile) (AIVN) was purchased from Wako Chemicals GmbH (Neuss, Germany). Graphite powder (particle size < 50 μm) was received from BDH (BDH Laboratory Supplies, Poole, UK) and Resineco Epoxy Kit resin was supplied by Resineco Green Composites (Barcelona, Spain). All reagents used were of analytical reagent grade, and all solutions were made up using MilliQ water from MilliQ System (Millipore, Billerica, MA, USA). The final experimental samples were prepared in phosphate buffer (100 mmol L−1 KCl, 50 mmol L−1 K2HPO4·2H2O, 50 mmol L−1 KH2PO4, pH 7.0).

2.2. Equipment and Software

Imprinted polymers were synthesized in a water bath controlled with a Huber CC1 thermoregulation pump (Huber GmbH, Offenburg, Germany). Polymer beads and polymer-modified electrodes were characterized by scanning electron microscopy (SEM) and FT-IR, employing a MERLIN FE-SEM and an IR Spectrophotometer Tensor 27, Bruker, respectively. The resulting microscopy images were treated with Fiji package software and Image J software [45] (Zeiss GmbH, Jena, Germany). The electrochemical cell for voltammetric measurements employed a commercial 52–61 combined Ag/AgCl reference and counter platinum electrode (Crison Instruments, Barcelona, Spain) and was connected to an AUTOLAB PGSTAT30 (Ecochemie, Utrecht, The Netherlands) controlled with the GPES Multichannel 4.7 software package. Electrochemical data were plotted using Origin 8.0, whereas PCAs were calculated by the authors using techniques in MATLAB 2016b (MathWorks, Natick, MA, USA).

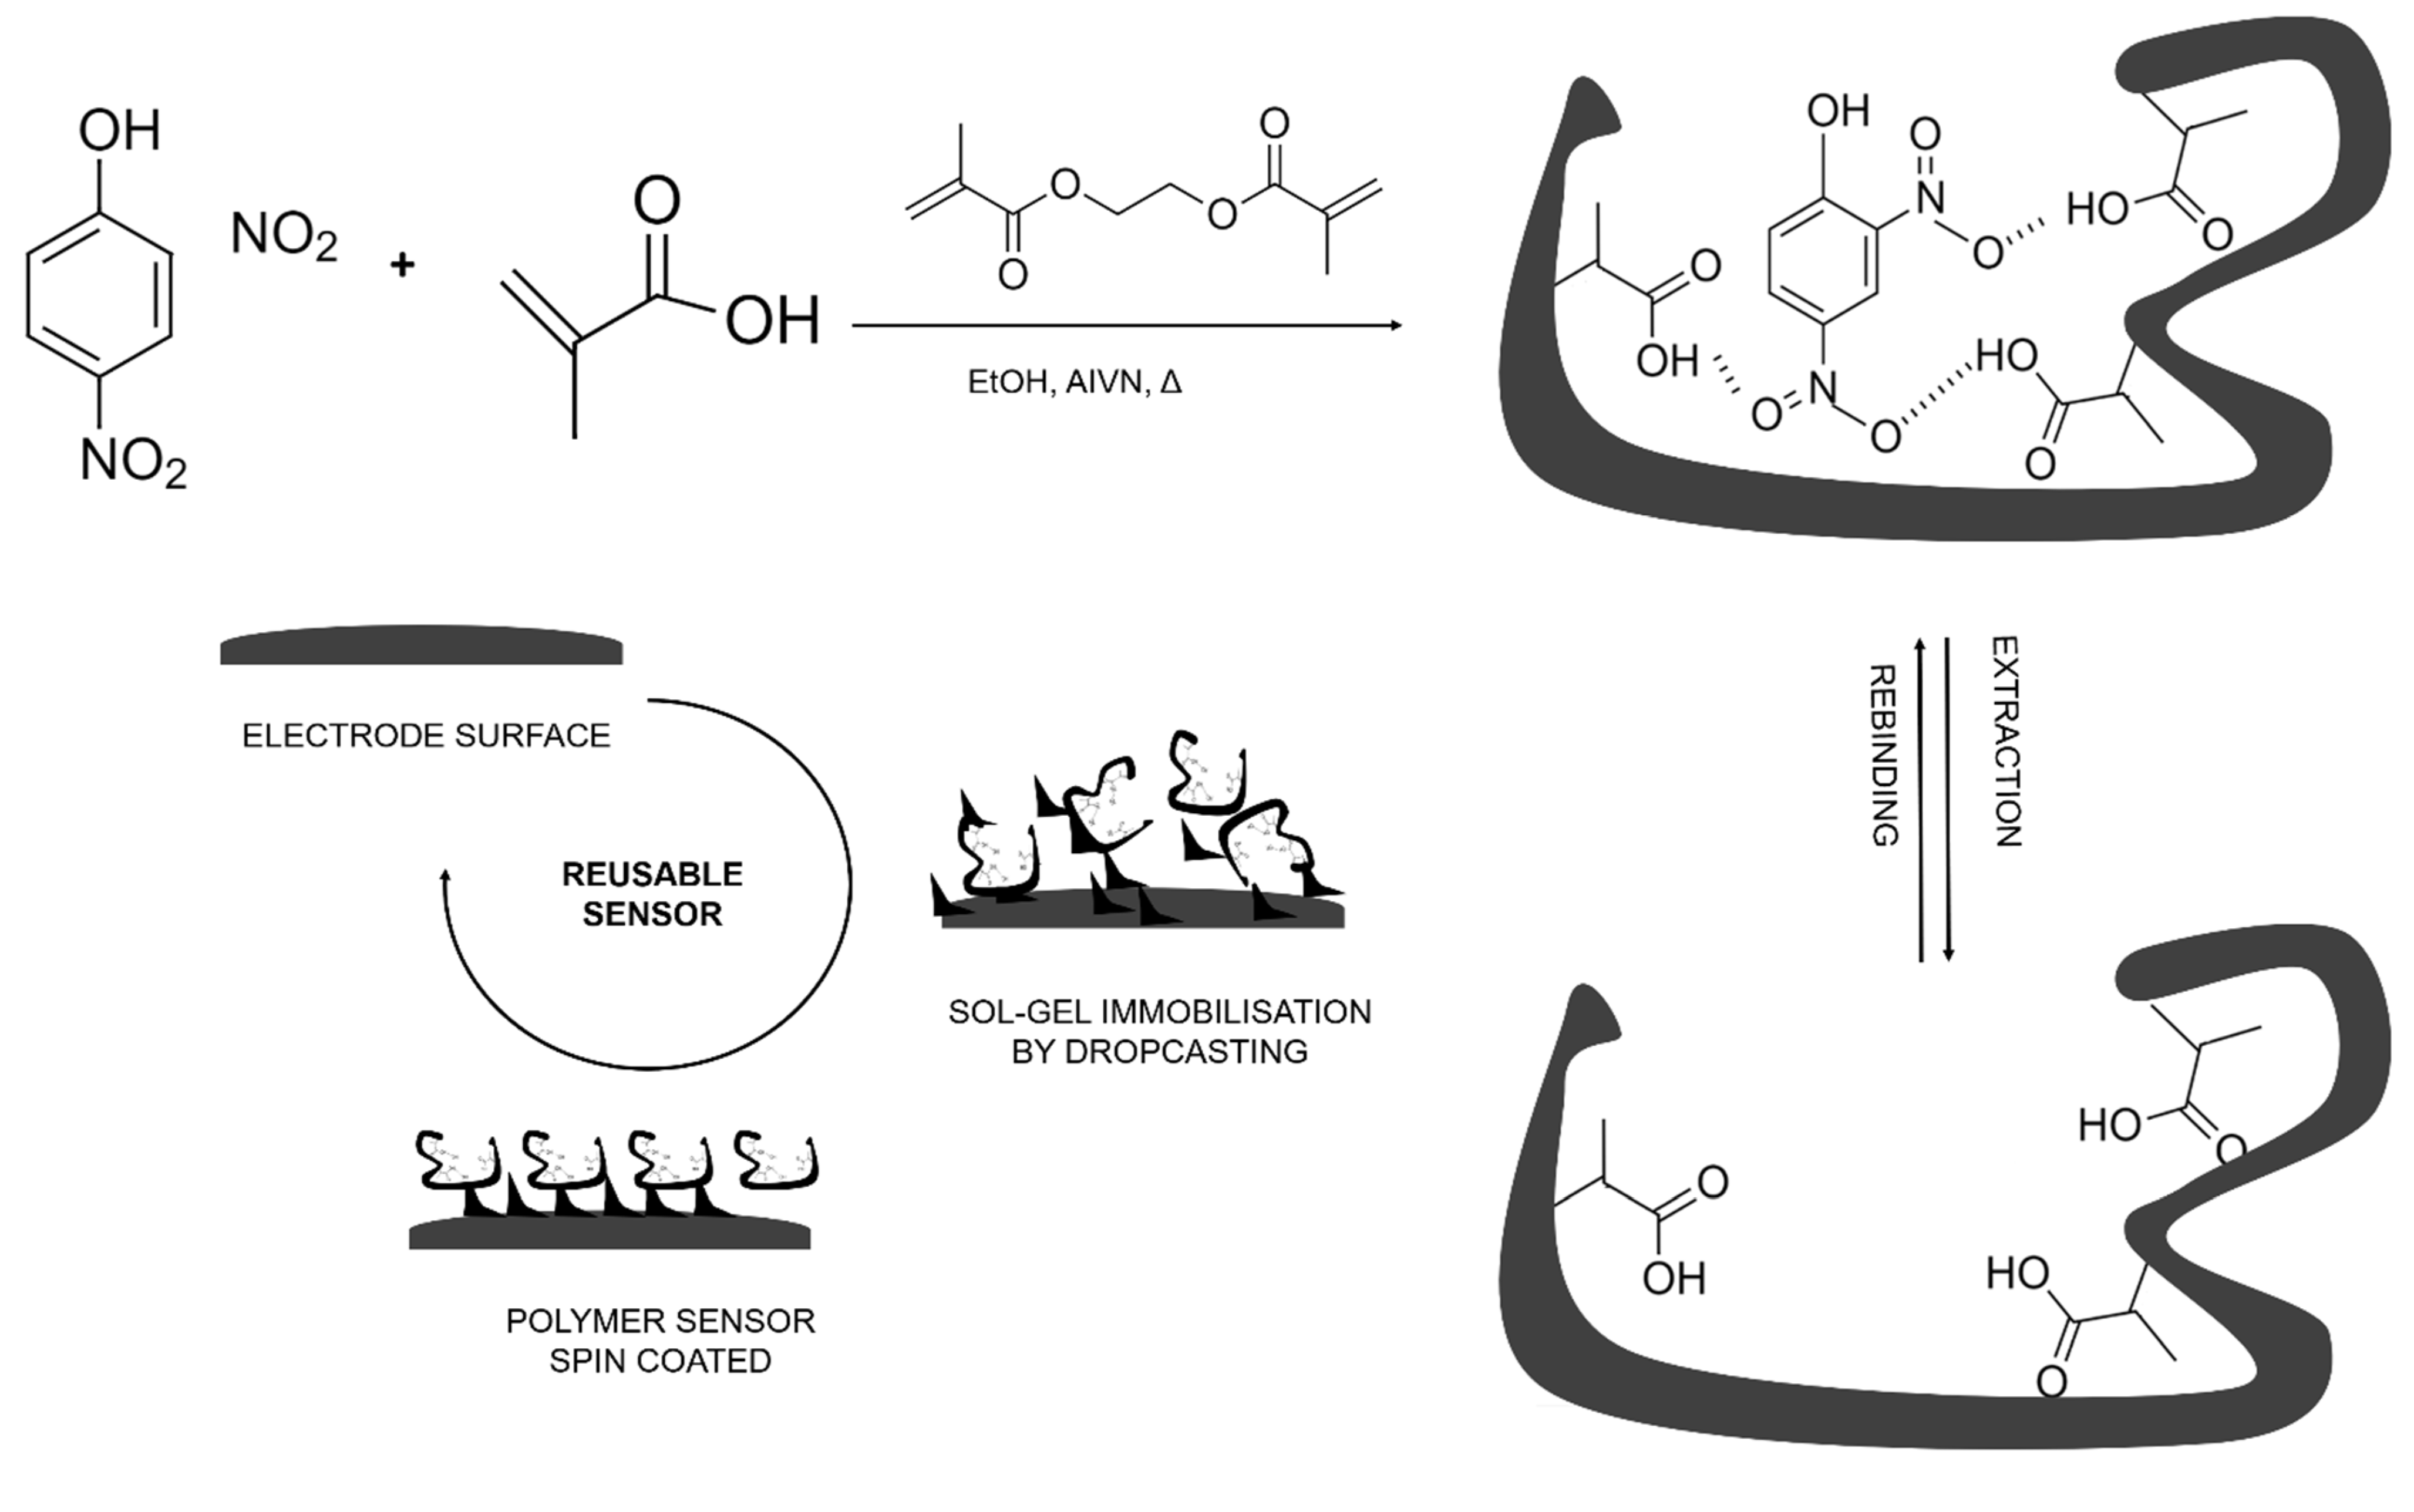
2.3. Polymer Synthesis

Quantities of 0.5 mmol of DNP and 1.05 mmol of MAA were transferred into a 250 mL round-bottomed flask and dissolved with 40 mL of EtOH. The solution was gently stirred in an ice bath for 30 min. Afterwards, 10.2 mmol of EGDMA and 0.10 mmol of AIVN were added to the solution and the obtained mixture was purged with a flow of dry nitrogen for 15 min. Polymerisation, in bead forms, was initiated in a water bath at 60 °C with magnetic stirring; the obtained polymer was collected after an overnight reaction. After this, the MIP was dried overnight at room temperature, the polymer was transferred into a Soxhlet system, and the template was extracted using a mixture of methanol:acetic acid (9:1) over 72 h. Non-imprinted polymers (NIPs) were prepared following the same methodology, but without the addition of the template molecule.

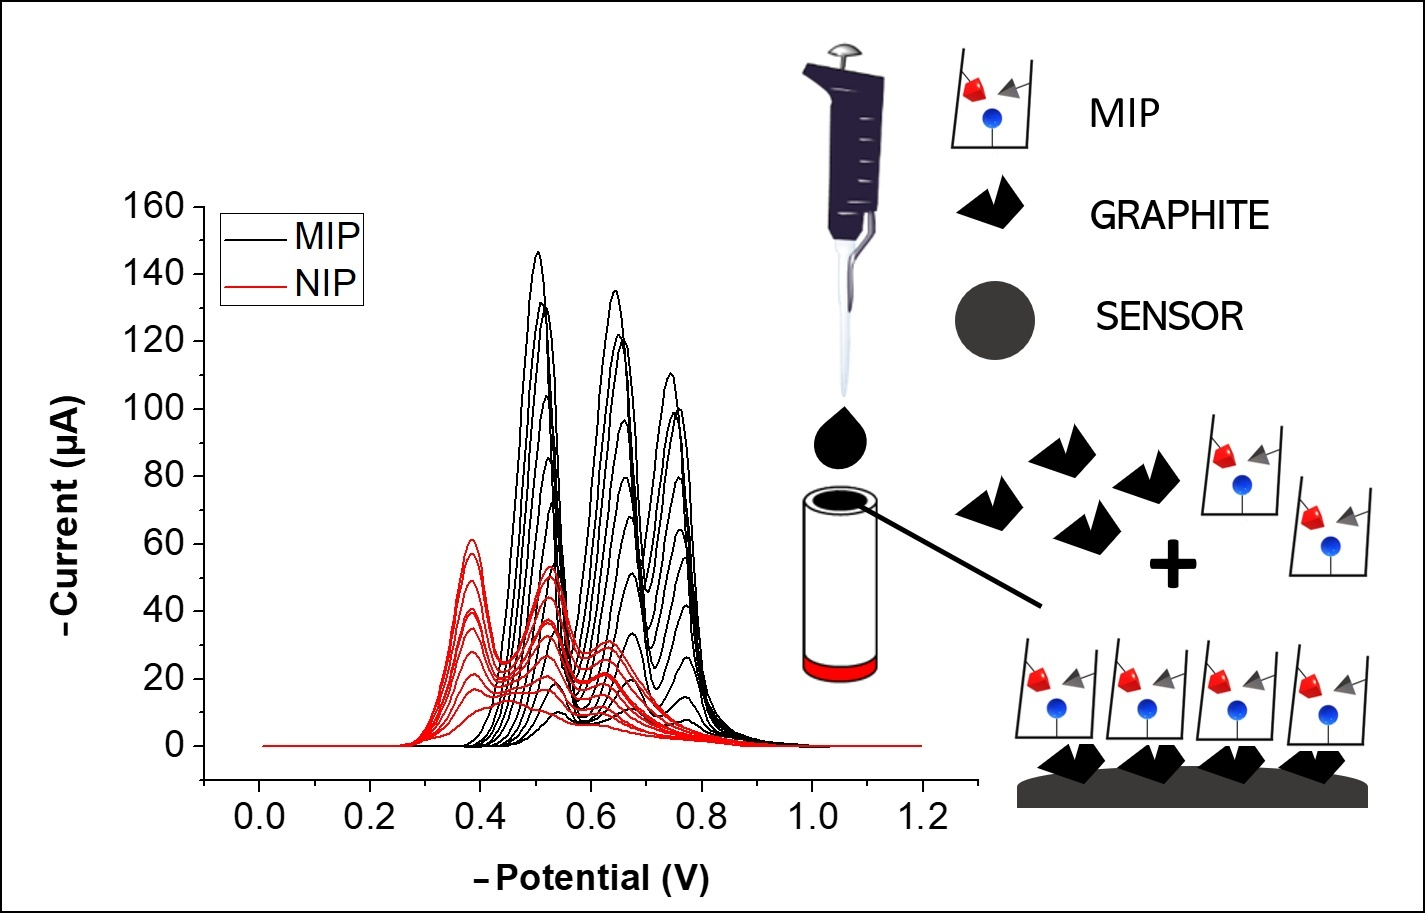
2.4. Sensor Preparation

The so-called graphite epoxy composite (GEC) electrode was prepared by soldering a 5 mm diameter copper disc into an electrical connector. Then, the connector was placed into a 6 mm inner diameter PVC tube. Afterwards, a mixture of epoxy resin and graphite was prepared in order to allocate the conductive graphite particles into a robust matrix. Once the epoxy graphite resin was added, the sensor was cured for 48 h in an oven at 65 °C. The resulting sensors had a sturdy surface which could be regenerated after a light polishing with sandpaper [46,47] and easily functionalised with several recognition elements [48,49]. Once the bare sensor was prepared, the MIPs were incorporated into the sensor. Once discarded, GEC sensors could be regenerated and reused by repeating the polishing procedure.

2.5. MIP Modification of Electrodes by Sol–Gel Entrapment

The polymers employed herein had an insulator nature; therefore, the proposed strategy was to create a conductive paste which incorporated insulating polymer beads and graphite particles. The polymer beads were allocated into the surface electrode by drop-casting via sol–gel immobilisation. The employed sol–gel was prepared with 0.5 mL of TEOS, 0.5 mL of EtOH, 0.25 mL of H2O and 25 µL of HCl 0.1 mol L−1 which were vigorously stirred for 45 min and then rested for 35 min in order to achieve the optimal polymerisation conditions. Subsequently, 0.2 mL of the rested solution and 7 mg of graphite were added to 40 µL of a 15 mg mL−1 polymer (MIP or NIP) suspension in EtOH. This mixture was stirred for 10 min at 1400 rpm. Then, the surface was prepared by spin-coating 10 µL of the polymer solution using a homemade spin-coater. Polymerisation was ended with overnight drying of the electrodes at 4 °C [46,47].

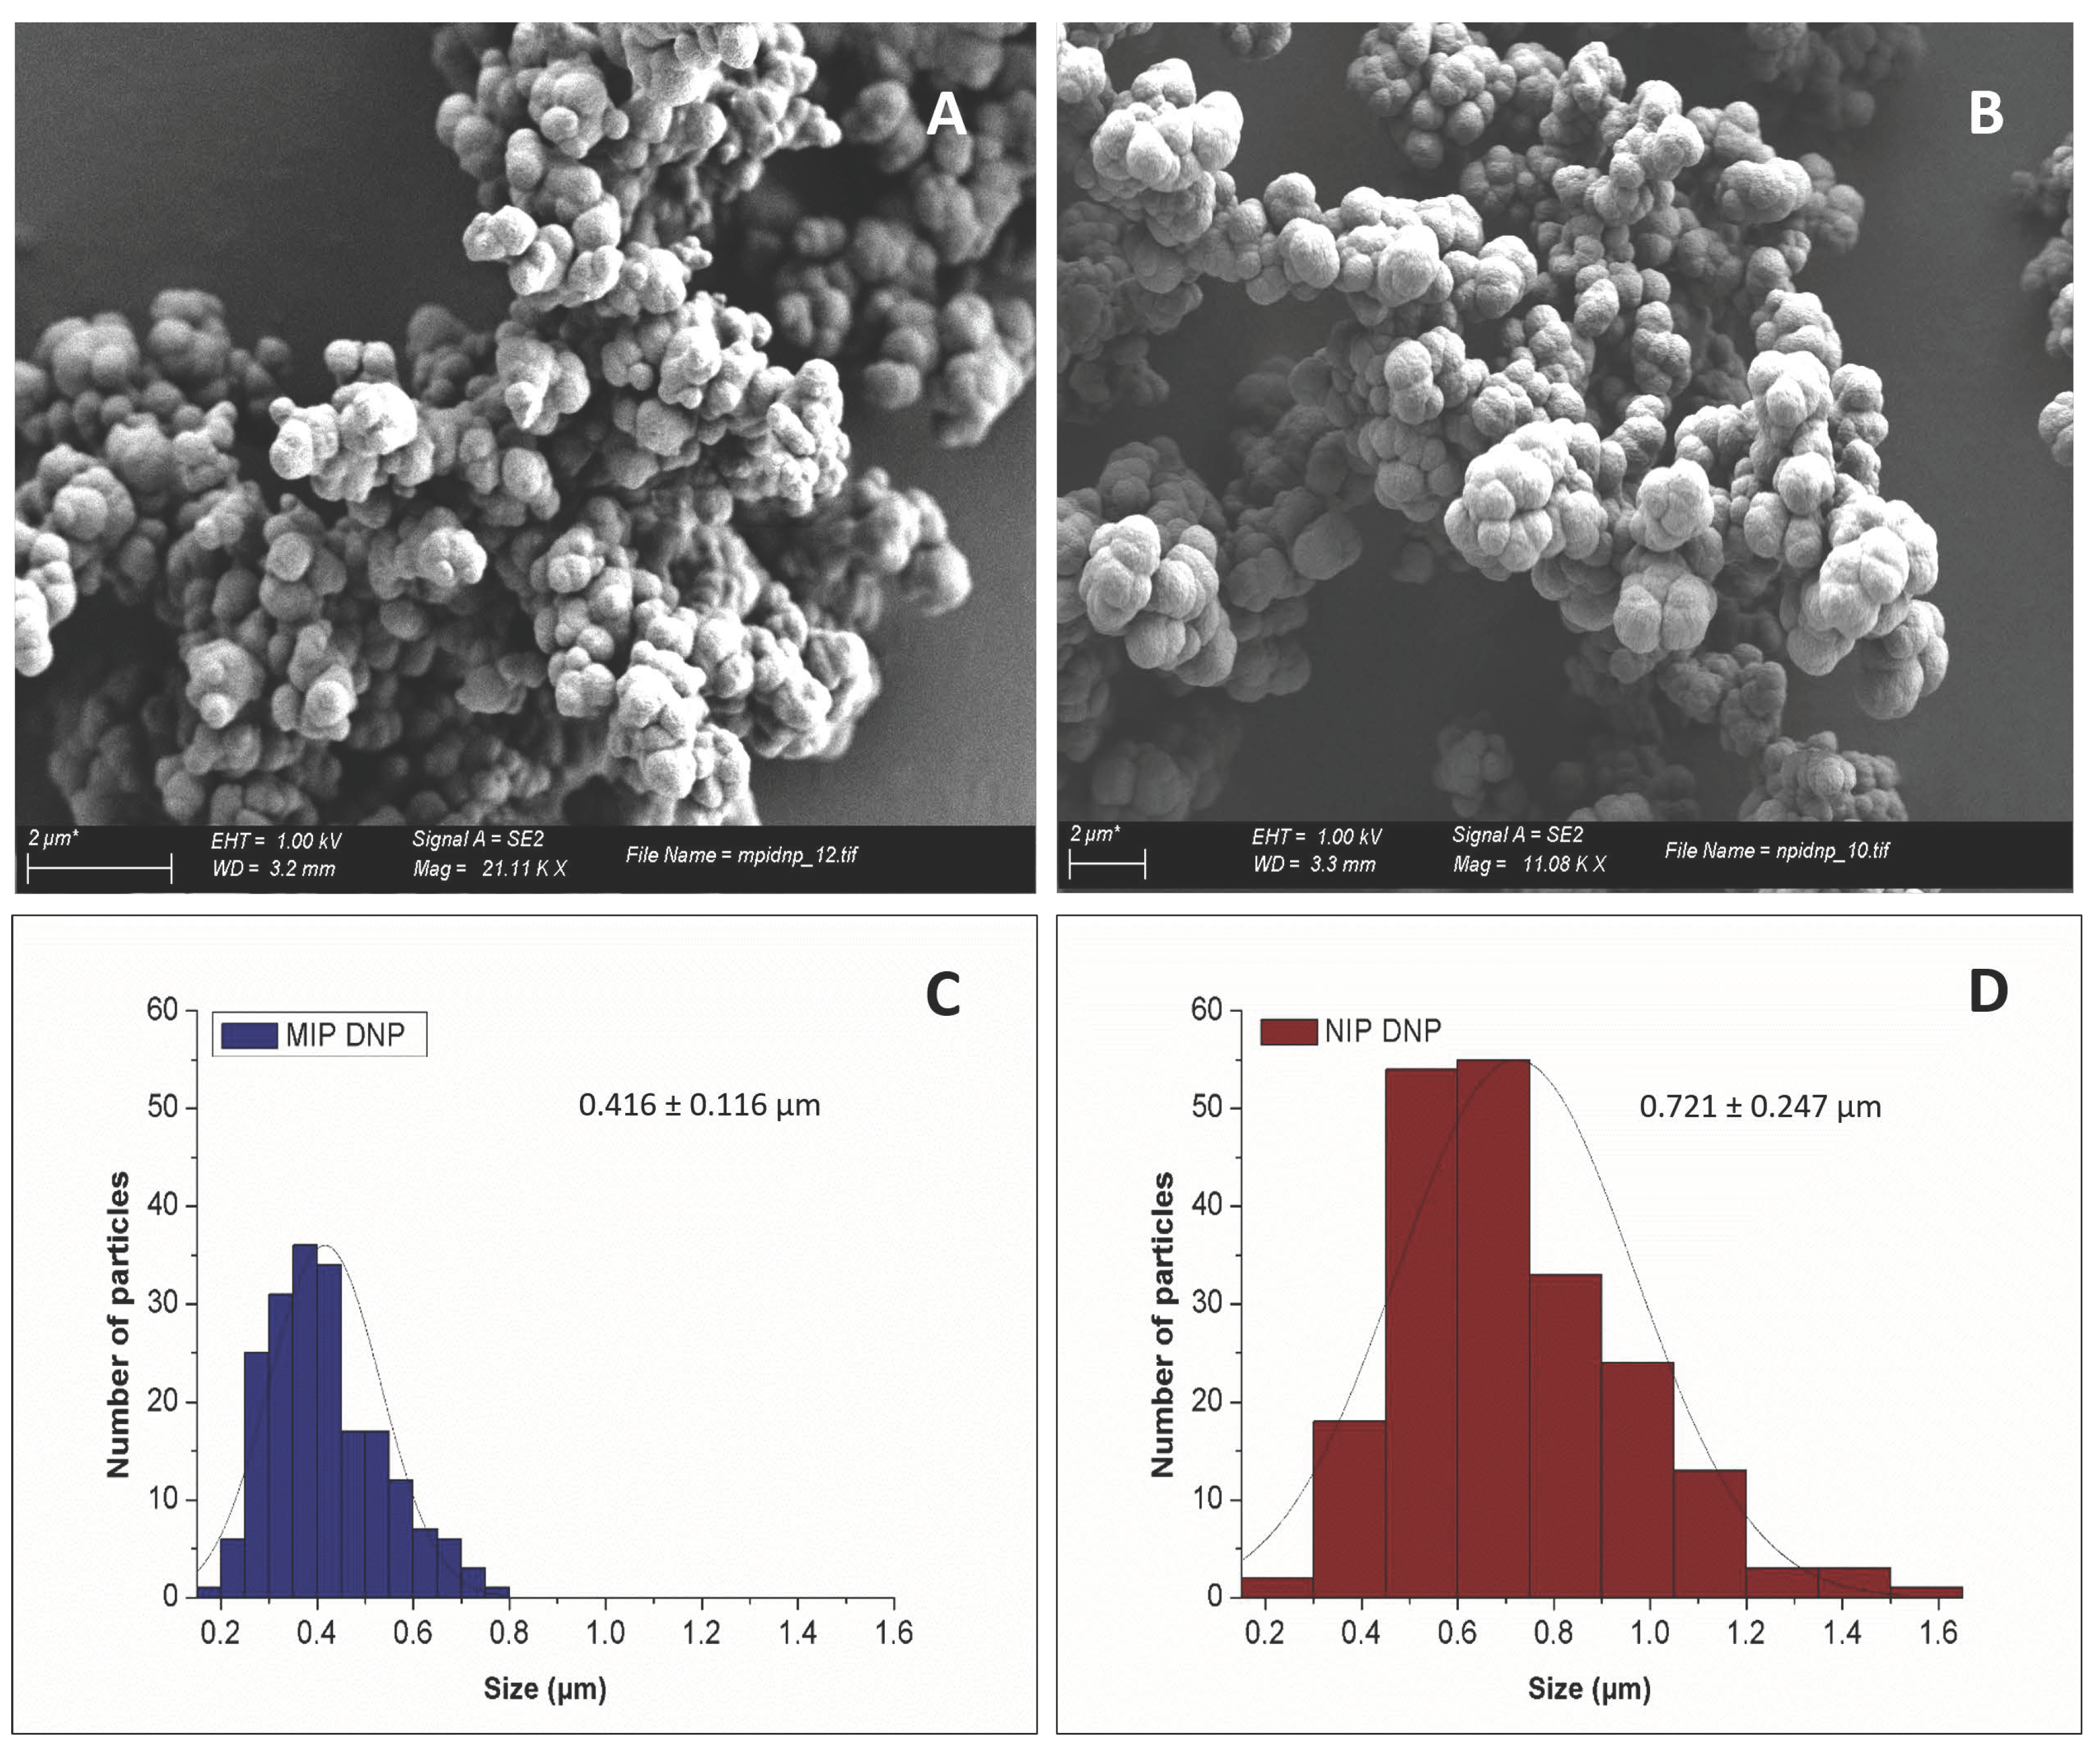
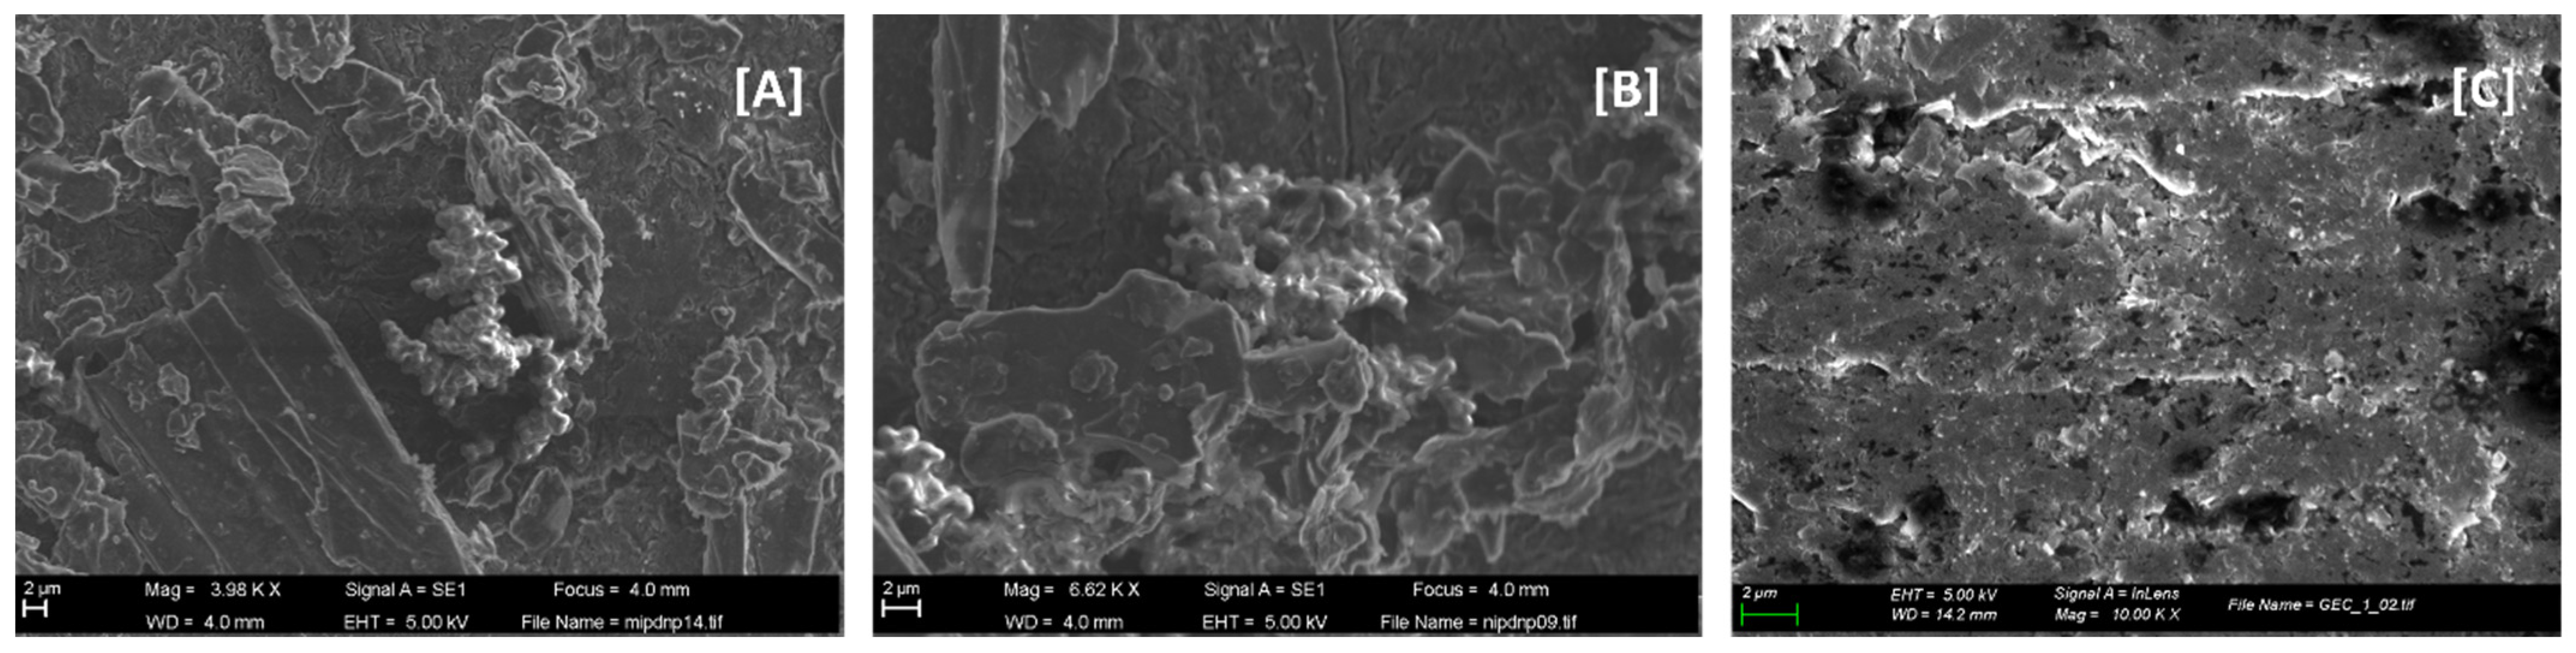
2.6. Characterisation by Scanning Electron Microscopy

In order to prepare the sample for SEM studies, MIP and NIP beads were sprinkled into different aluminium stubs that contained carbon-tape on the surface. Then, the conductive carbon-tapes were metallised, employing a Au–Pd alloy (80:20) for 4 min, which added a 15–20 nm layer onto the sample, which enabled visualisation of the synthesised polymer beads with an adequate contrast. Five SEM images were developed for each kind of polymer (MIPs and NIPs) in order to count at least 500 particles in order to obtain a histogram of both polymers (Figure 2 and Figure S1). Microscopy studies for the electrodes were performed by placing them on the stage and fixing them with carbon tape without employing any kind of metallisation.

2.7. Electrochemical Measurements

All the electrochemical measurements were performed using the differential pulse voltammetry (DPV) technique. The potential scan window was performed between 0 V and −1.2 V with a scan rate of 100 mV/s, a step potential of 5 mV and a modulation amplitude of 50 mV. No stirring was employed during the measurements. A cleaning step was performed between measurements, applying a potential of +1.4 V for 45 s in NaOH 0.1 mol L−1. According to previous studies in our laboratories, immersion of the electrode into the solution for at least 5 min is desirable to preconcentrate the analyte and to obtain a perceptible signal [2,50]. All stock standard solutions were prepared at 5000 mg L−1 in acetonitrile (ACN). All the electrochemical measurements were treated with baseline correction (Figure S5, supplementary data) and all the analytical response calculations were performed for the first peak reduction, around −0.45 V, as suggested in the literature for TNT [25]. The first peak was considered for quantification of all the aforementioned nitro-derived species.

3. Results and Discussion

3.1. MIP Physical Characterisation

Standard acrylic MIP synthesis was adopted in order to obtain the recognition material in beads form. Once the polymers were synthesised and the template was removed, SEM was performed in order to check the morphology of the abovementioned polymers before electrode immobilisation. Obtained MIPs beads showed a non-regular, highly cross-linked material with a spherical shape. Their average size and standard deviation were diameters of 0.416 ± 0.116 μm and 0.721 ± 0.247 μm for MIPs and NIPs, respectively, (Figure 2).
As can be observed, the MIPs presented a slightly smaller particle size in comparison with NIPs. This might suggest that during the synthesis there was more reactivity due to the imprinting, which might be due the template presence.
One of the key steps of the presented protocol is the immobilisation onto the electrode, as can be seen in Figure 3. Materials were deposited by a drop-casting, spin-coating technique via sol–gel immobilisation, as mentioned below, presenting a homogeneous dispersion on the whole surface of the sensors. On the other hand, Figure 3 also shows that the surface of the bare electrode was totally different from the polymer-modified sensors. As can be seen, the surface modification is self-evident; the roughness after sol–gel deposition is very noticeable when comparing unmodified sensors (Figure 3C) with modified sensors (Figure 3A,B). There are no clear differences between MIPs and NIPs: both present a modified surface where the immobilized polymer beads can be seen alongside the sol–gel and graphite.
An FT-IR assay was performed to observe the main chemical bonds. The FT-IR was performed in triplicates of MIP and NIP samples. MIP and NIP polymers showed very similar FT-IR spectra with little or no significant differences (Figure S2). Thus, no differences in the chemical bonds were observed between the different synthesis methodologies. The main bands observed are the broad band of hydroxyl groups around 3430 cm−1 from the MMA units; the stretching and bending of methyl groups from the MMA and the EGDMA at the band around 2950–2980 cm−1 and 1450–1470 cm−1; the carbonyl stretching at 1720 cm−1; the C–O–C stretching at 1145 and 1250 cm−1; and the rocking of the C–H stretching at 750 cm−1. The peak at 1636 cm−1 is associated with C=C bonds, which indicates an incompletely polymerized monomer. Probably, EGDMA was not totally crosslinked.
In the case of MIPs, in which DNP could be retained during the synthesis, the nitro groups showed a strong band around 1550 and 1350 cm−1, corresponding to asymmetric and symmetric stretching, respectively. The absence of a band at 1550 cm−1 confirmed the absence of DNP from the polymer. The band at 1390 cm−1 could be related to the asymmetric bending of the –OH groups of the carboxylic acid of the MMA units.
The obtained chemical bonding agreed with the expected polymer produced from free radical polymerisation. The slight differences in the wavenumber and peak intensity could be associated with the chemical structure and space distribution due to differences in the synthesis.

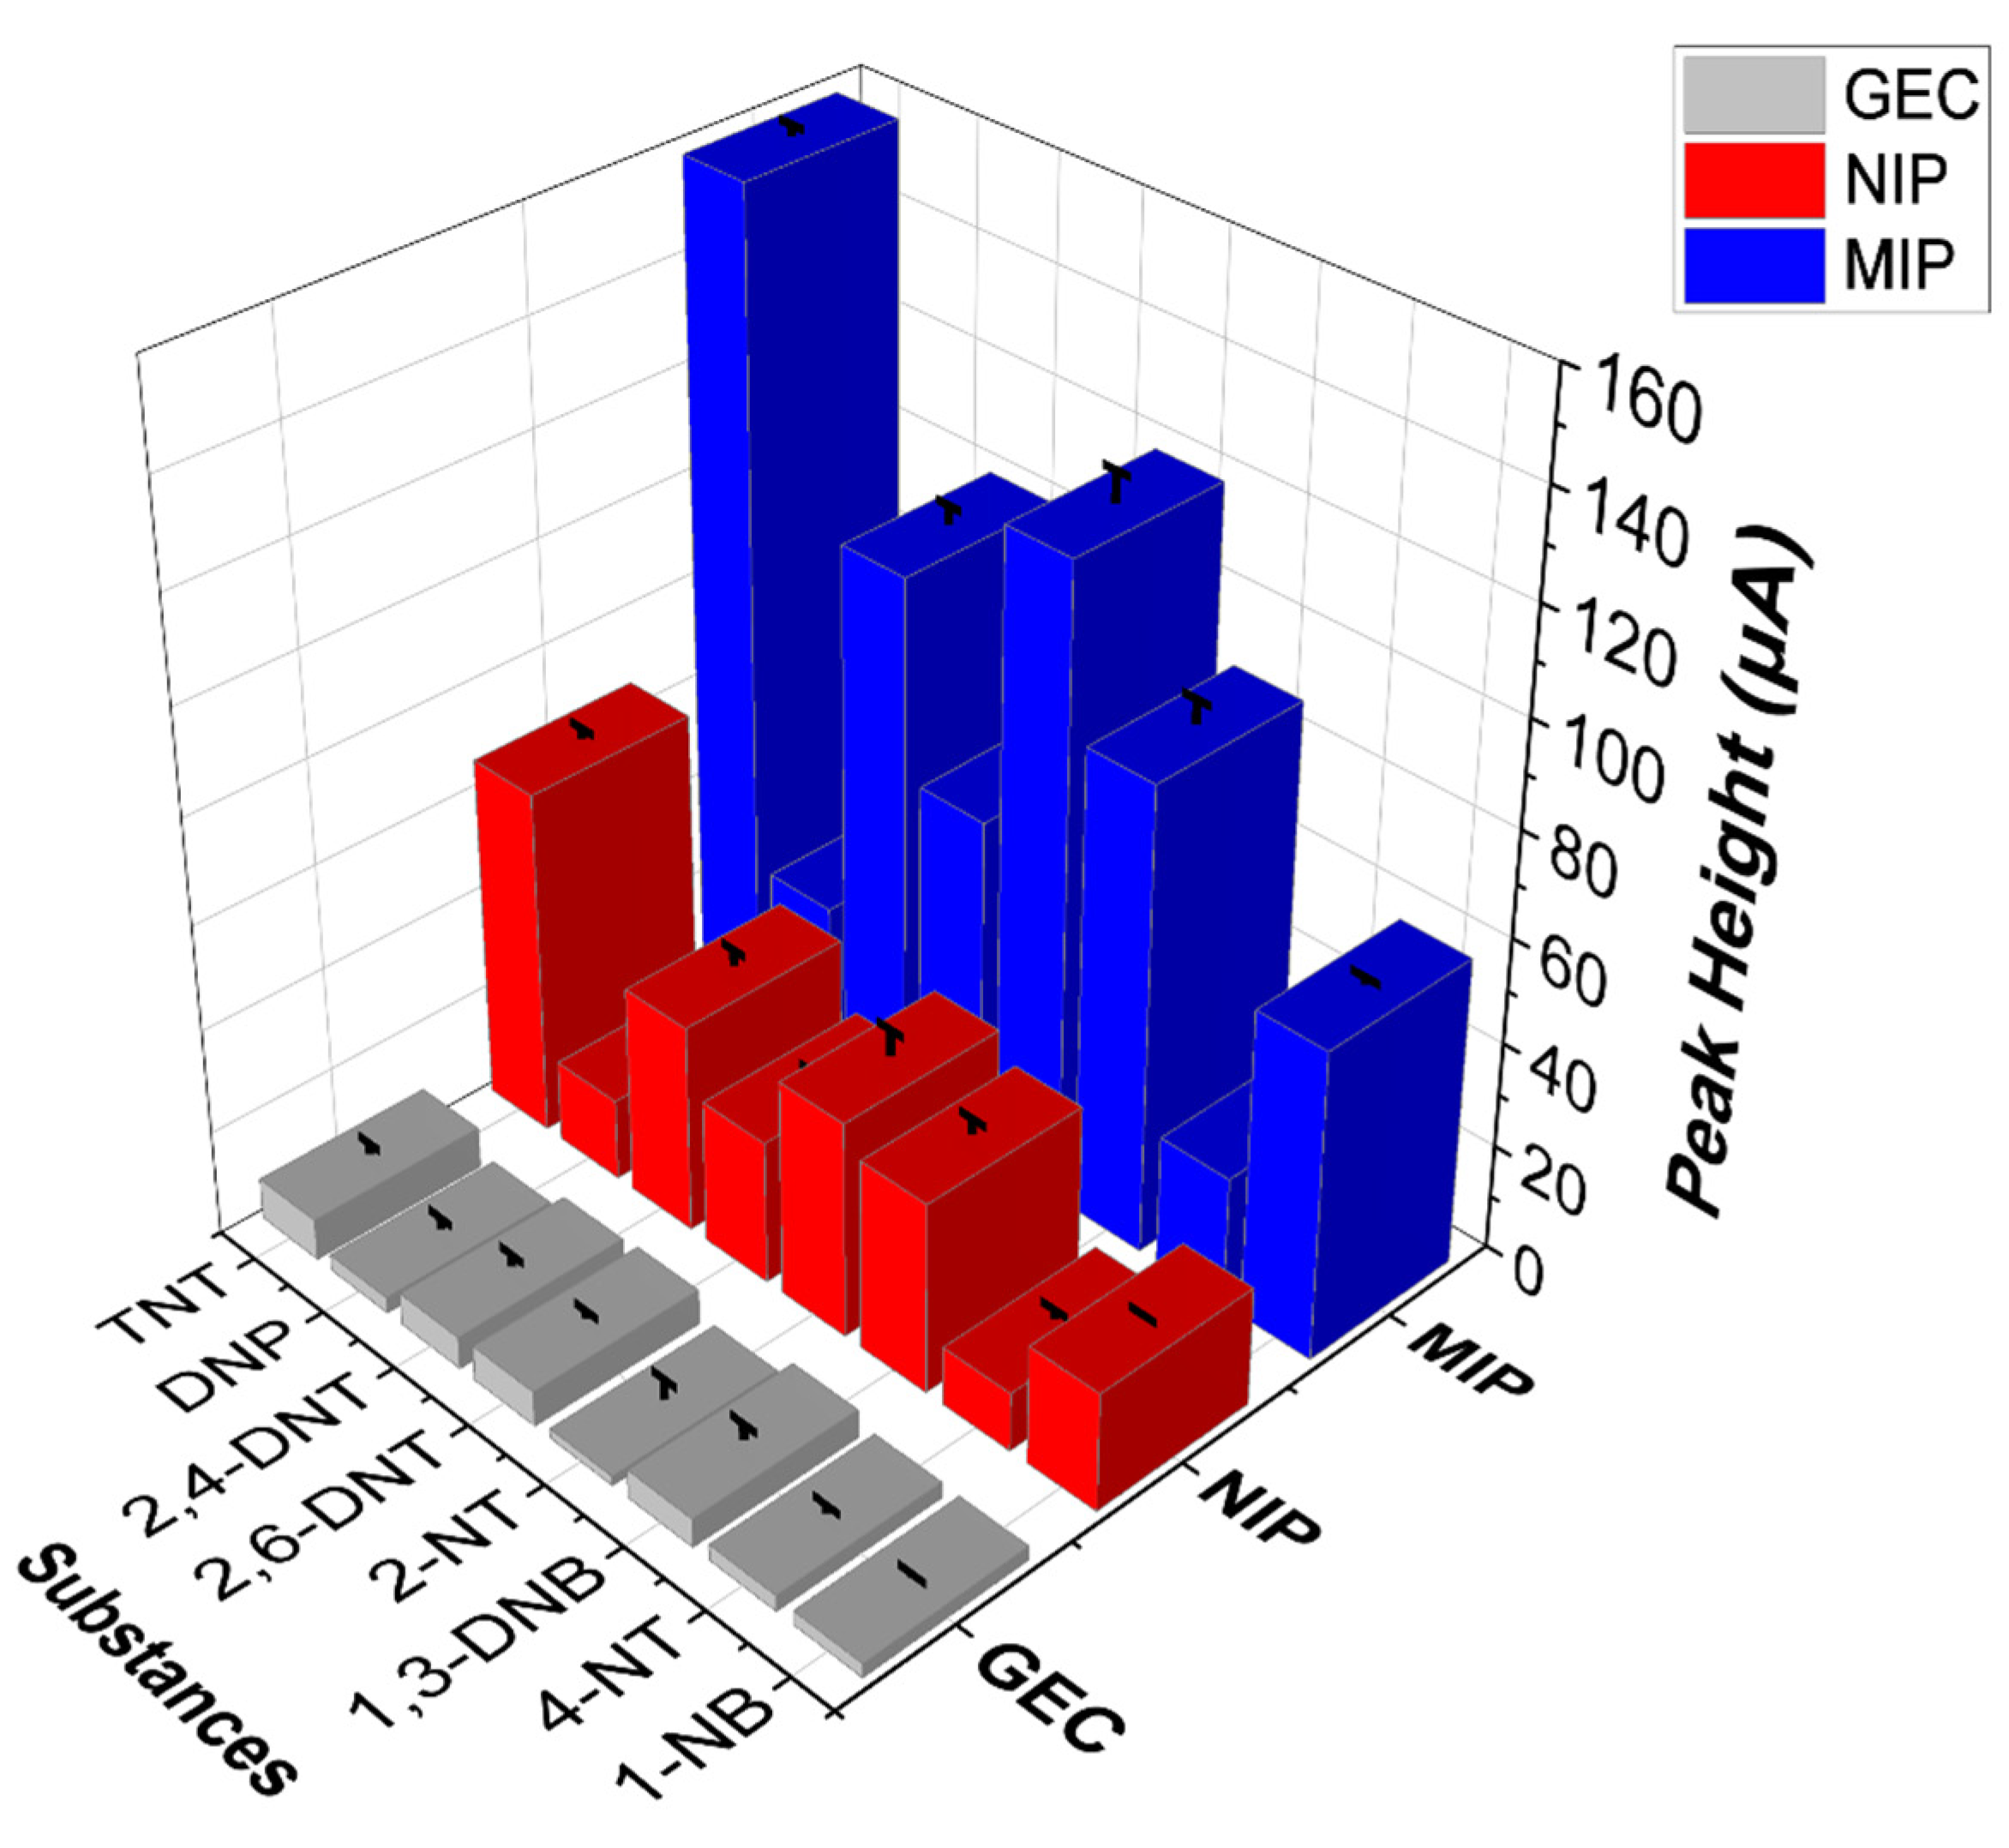
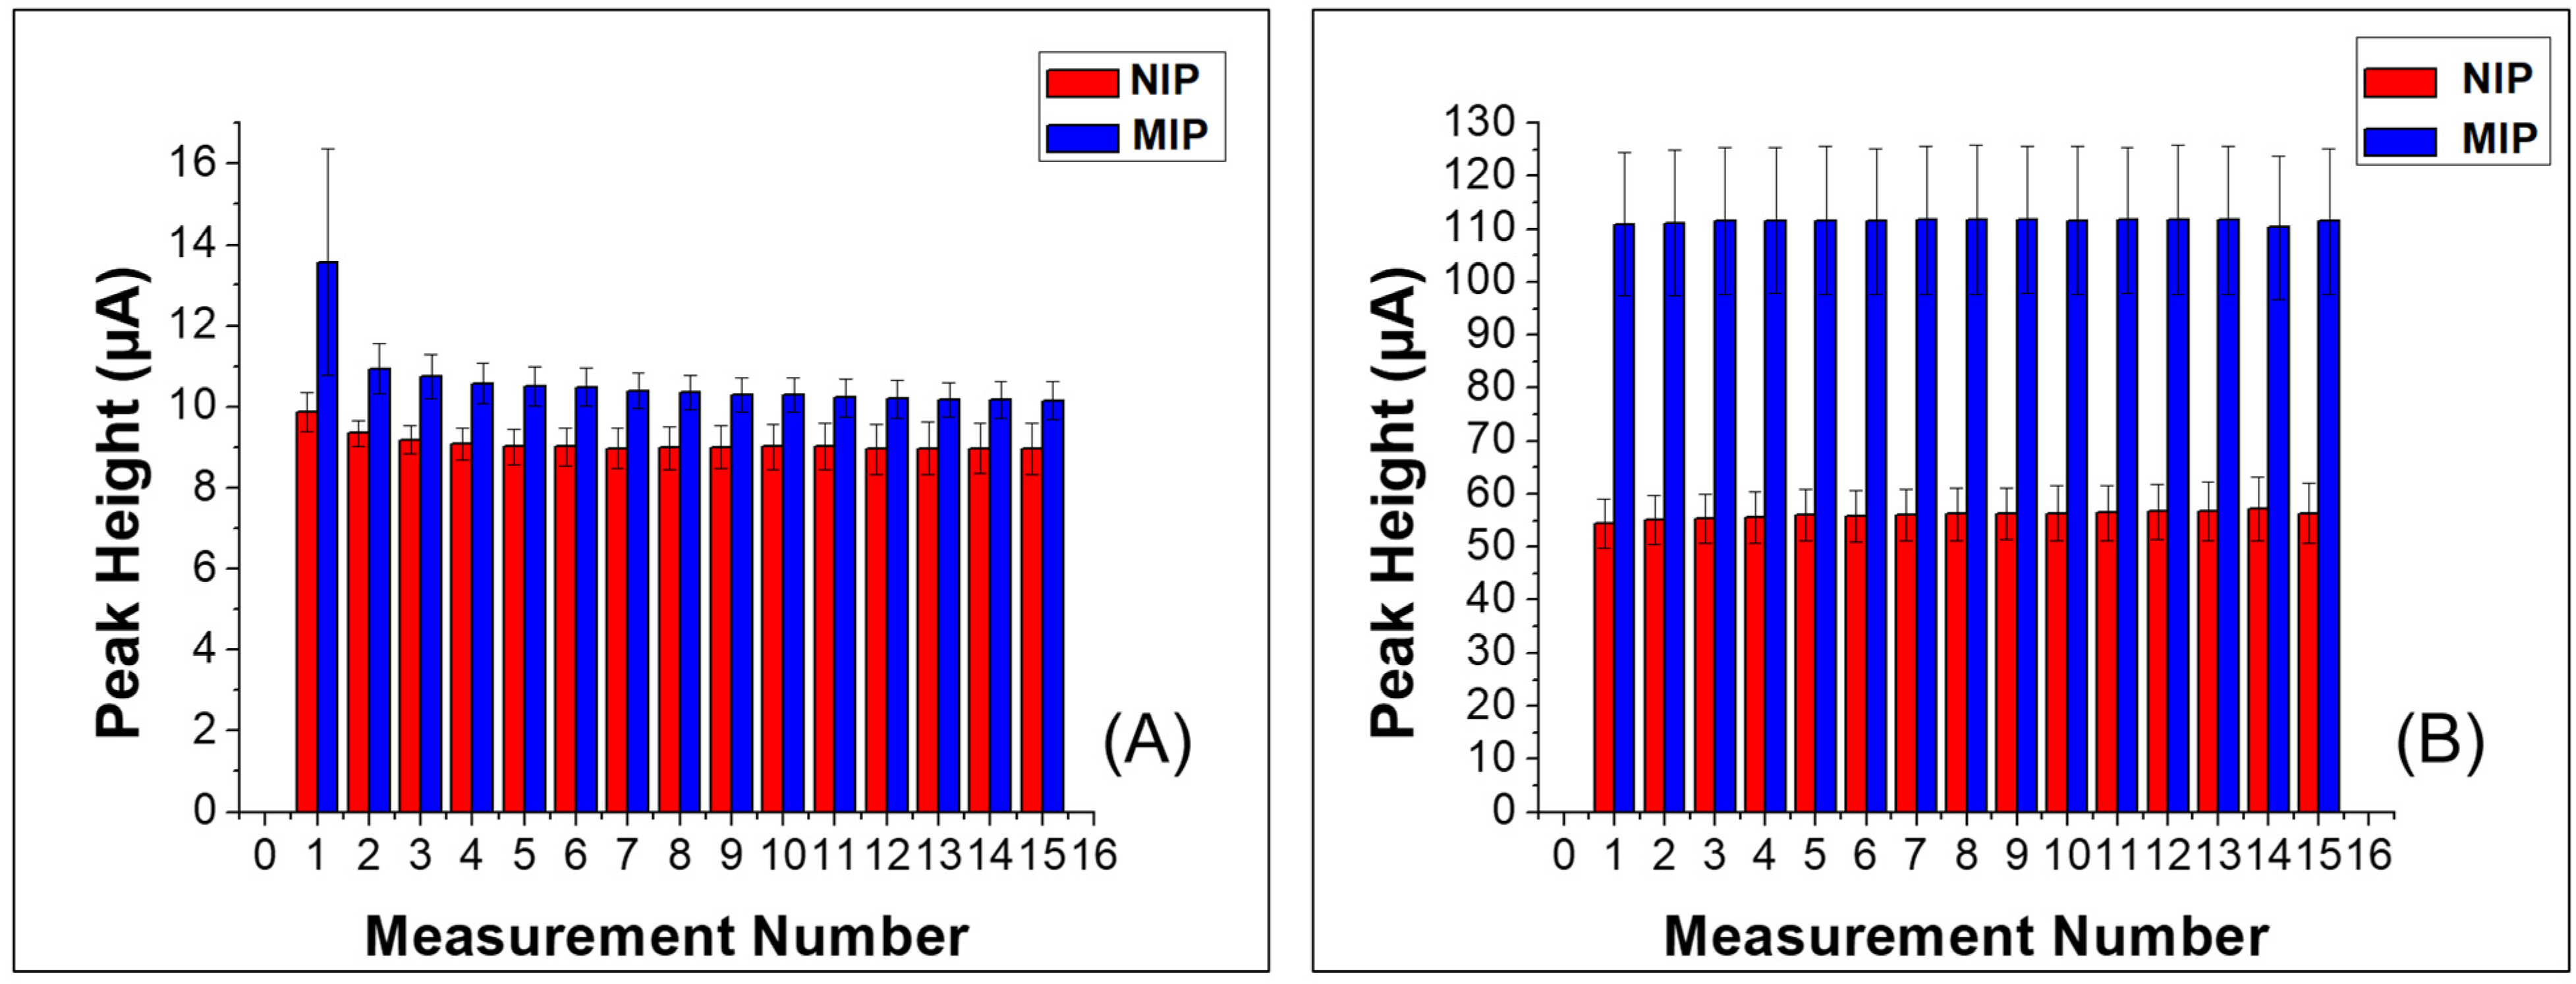
3.2. Electrochemical Response

Prior to the evaluation of the electrochemical response, the pH and enrichment times between template sample and sensor were studied and optimised. Stock solutions of 10 µmol L−1 for TNT and DNP were employed. The samples were measured with a contact time from 0 to 100 min, and the resultant plots and fittings are shown in Figure S3, in the supplementary information. The evaluated pH ranged from 5 to 8 (Figure S4). pH 7 was chosen because TNT and DNP presented maximum peak intensities at this neutral value. In order to achieve a balance between the increase in signal and speed, plus for simplicity of the method, a contact time of 5 min was chosen, which enabled reaching more than two-thirds of the final response with a reduced analysis time.
In order to study the repeatability of the manufactured sensors, 10 µmol L−1 samples of TNT and DNP were measured 15 times with three DNP-MIP-sensors and three DNP-NIP-sensors on the same day. The obtained repeatability values for DNP-MIPs and DNP-NIPS sensors when measuring TNT were 3.97% and 4.61%, respectively. For DNP, the DNP-MIP and DNP-NIP sensors had repeatability values of 9.14% and 7.34%, respectively.
The reproducibility was studied for three DNP-MIP sensors: 10 µmol L−1 samples of TNT and DNP were measured five times, obtaining values of 6.5% for TNT and 5.5% for DNP. DNP-MIP sensors’ repeatability values against DNP showed slightly better results than TNT, which is explained by the dummy imprinting performed for DNP, as can be seen in Figure 4.
The obtained voltammograms for DNP and TNT are presented in Figure 5. DNP has a double reduction peak between −0.4 V and −0.6 V, whereas TNT exhibits three reduction peaks in the same region. The three peaks that TNT presents are due the reduction in the three nitro groups. The first nitro reduction is produced around −0.5 V, and usually presents a sharper and more defined peak; the second nitro group is reduced around −0.65 V; and the last nitro group is around −0.75 V when measured with MIP-functionalised electrodes. It appears that the MIP electrode shifted these reduction peaks to more negative potentials when compared with the NIP electrode, which presented peaks at −0.35 V, −0.55 V and −0.65 V. In the case of DNP, the two nitro reduction peaks appeared at around −0.52 V and −0.68 V for MIP and NIP, respectively, with no apparent shift in potential.
These substances were studied in a concentration range of 0.55 to 19 µmol L−1 for DNP and from 0.45 to 10 µmol L−1 for TNT.

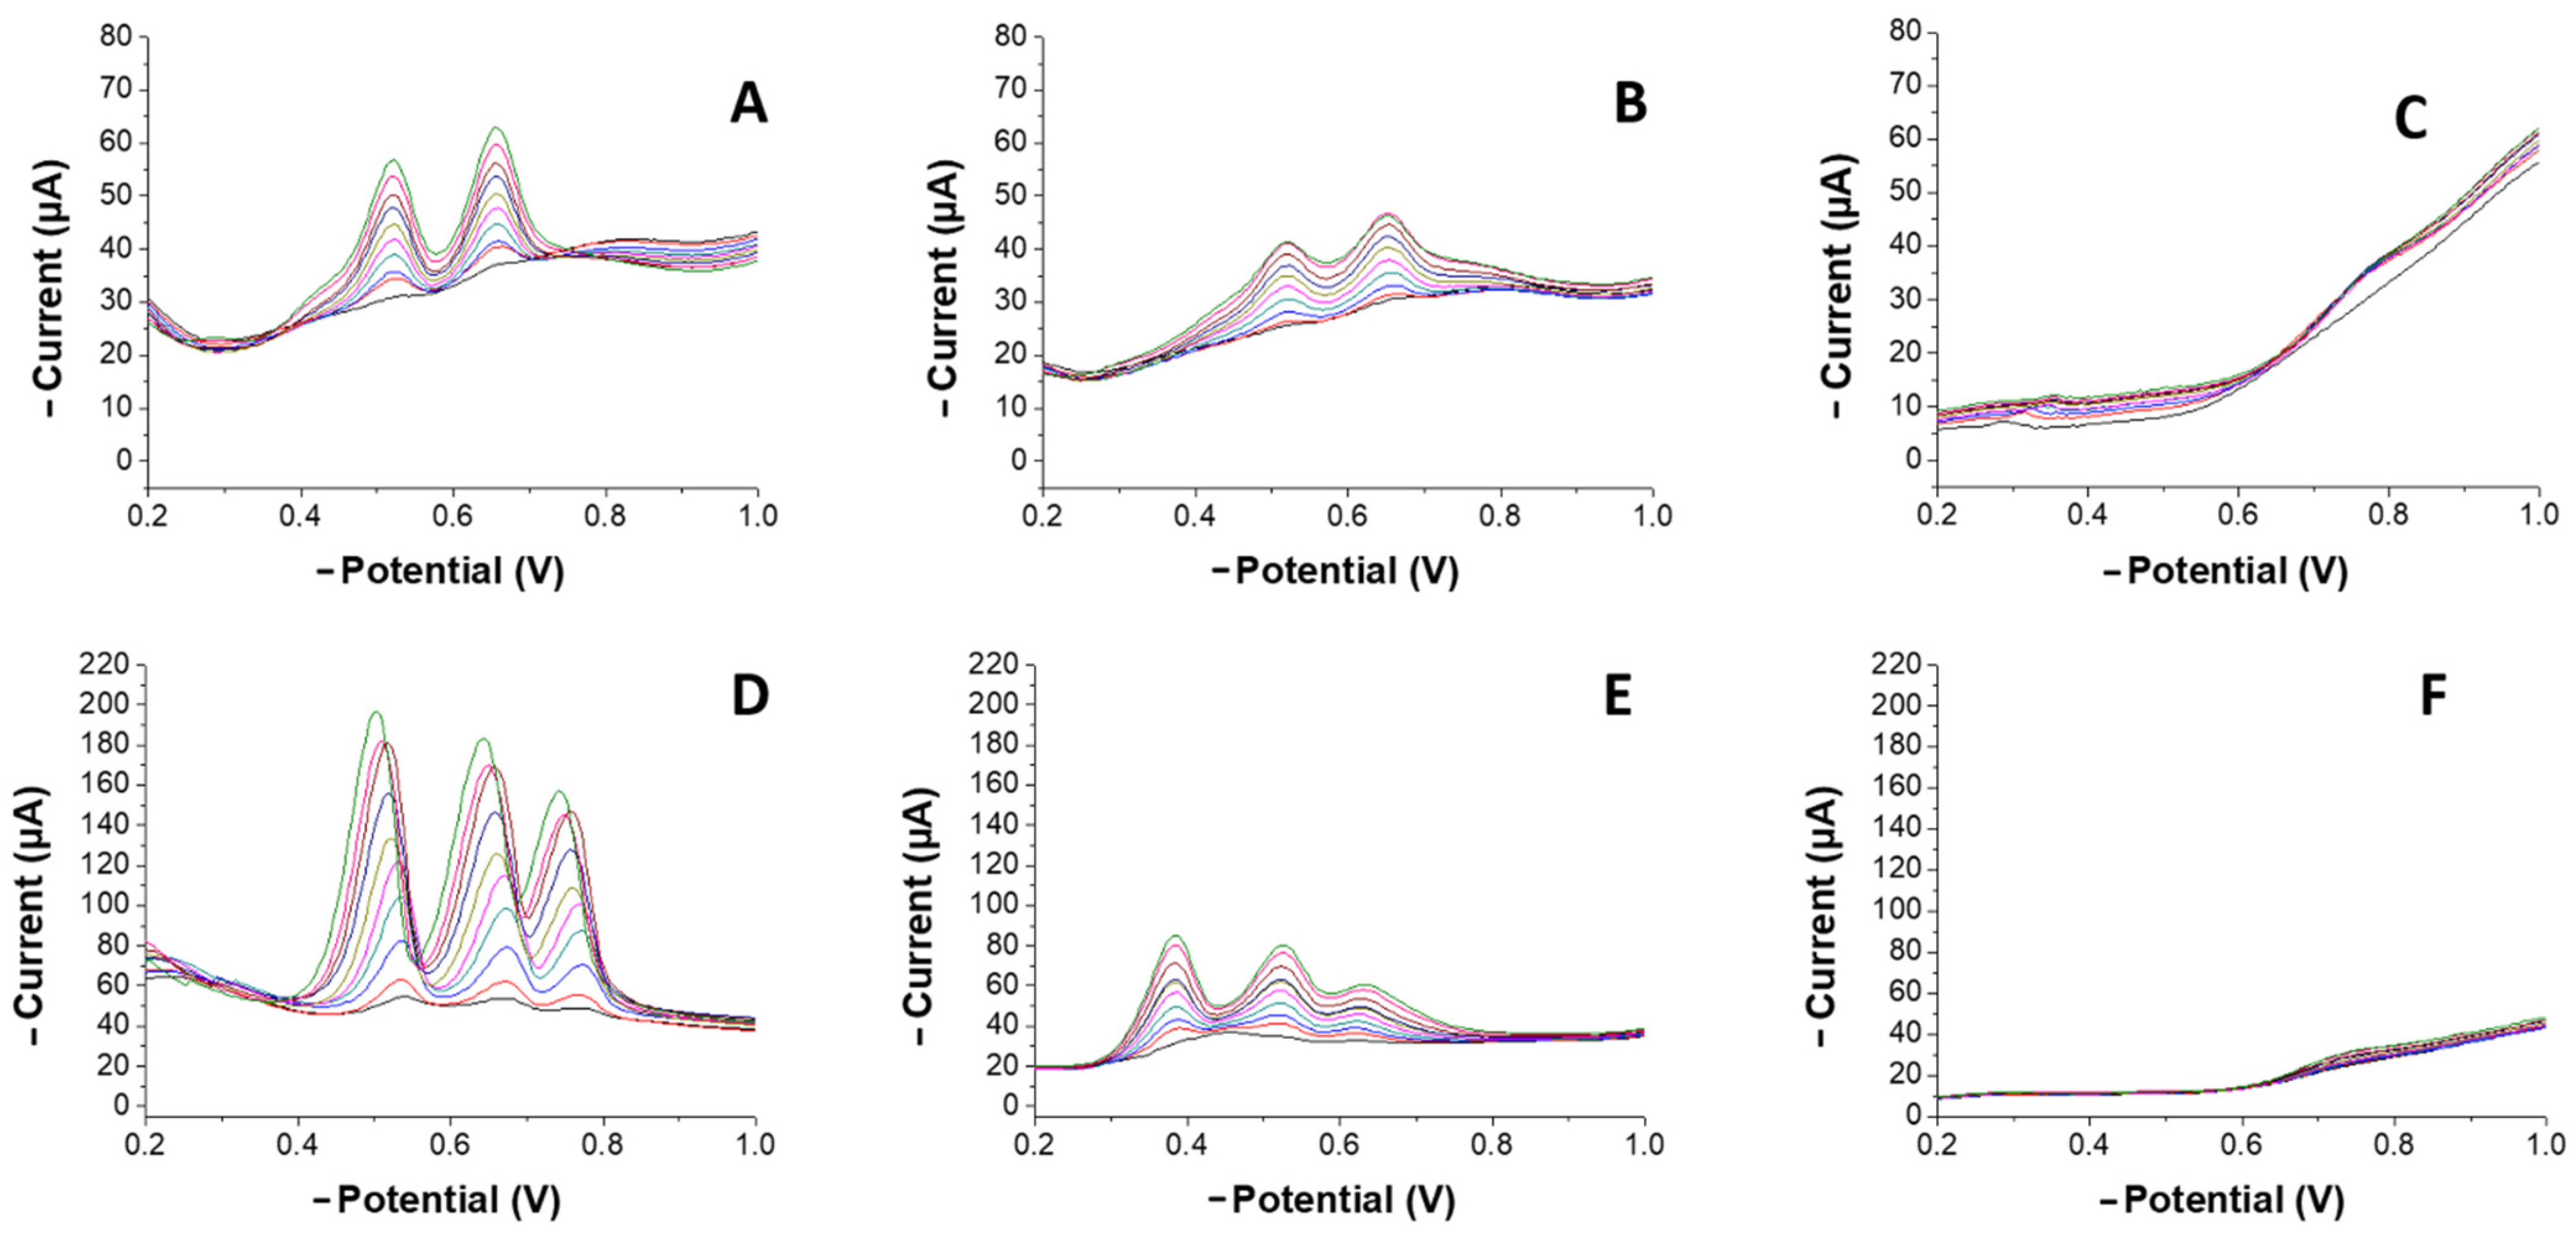
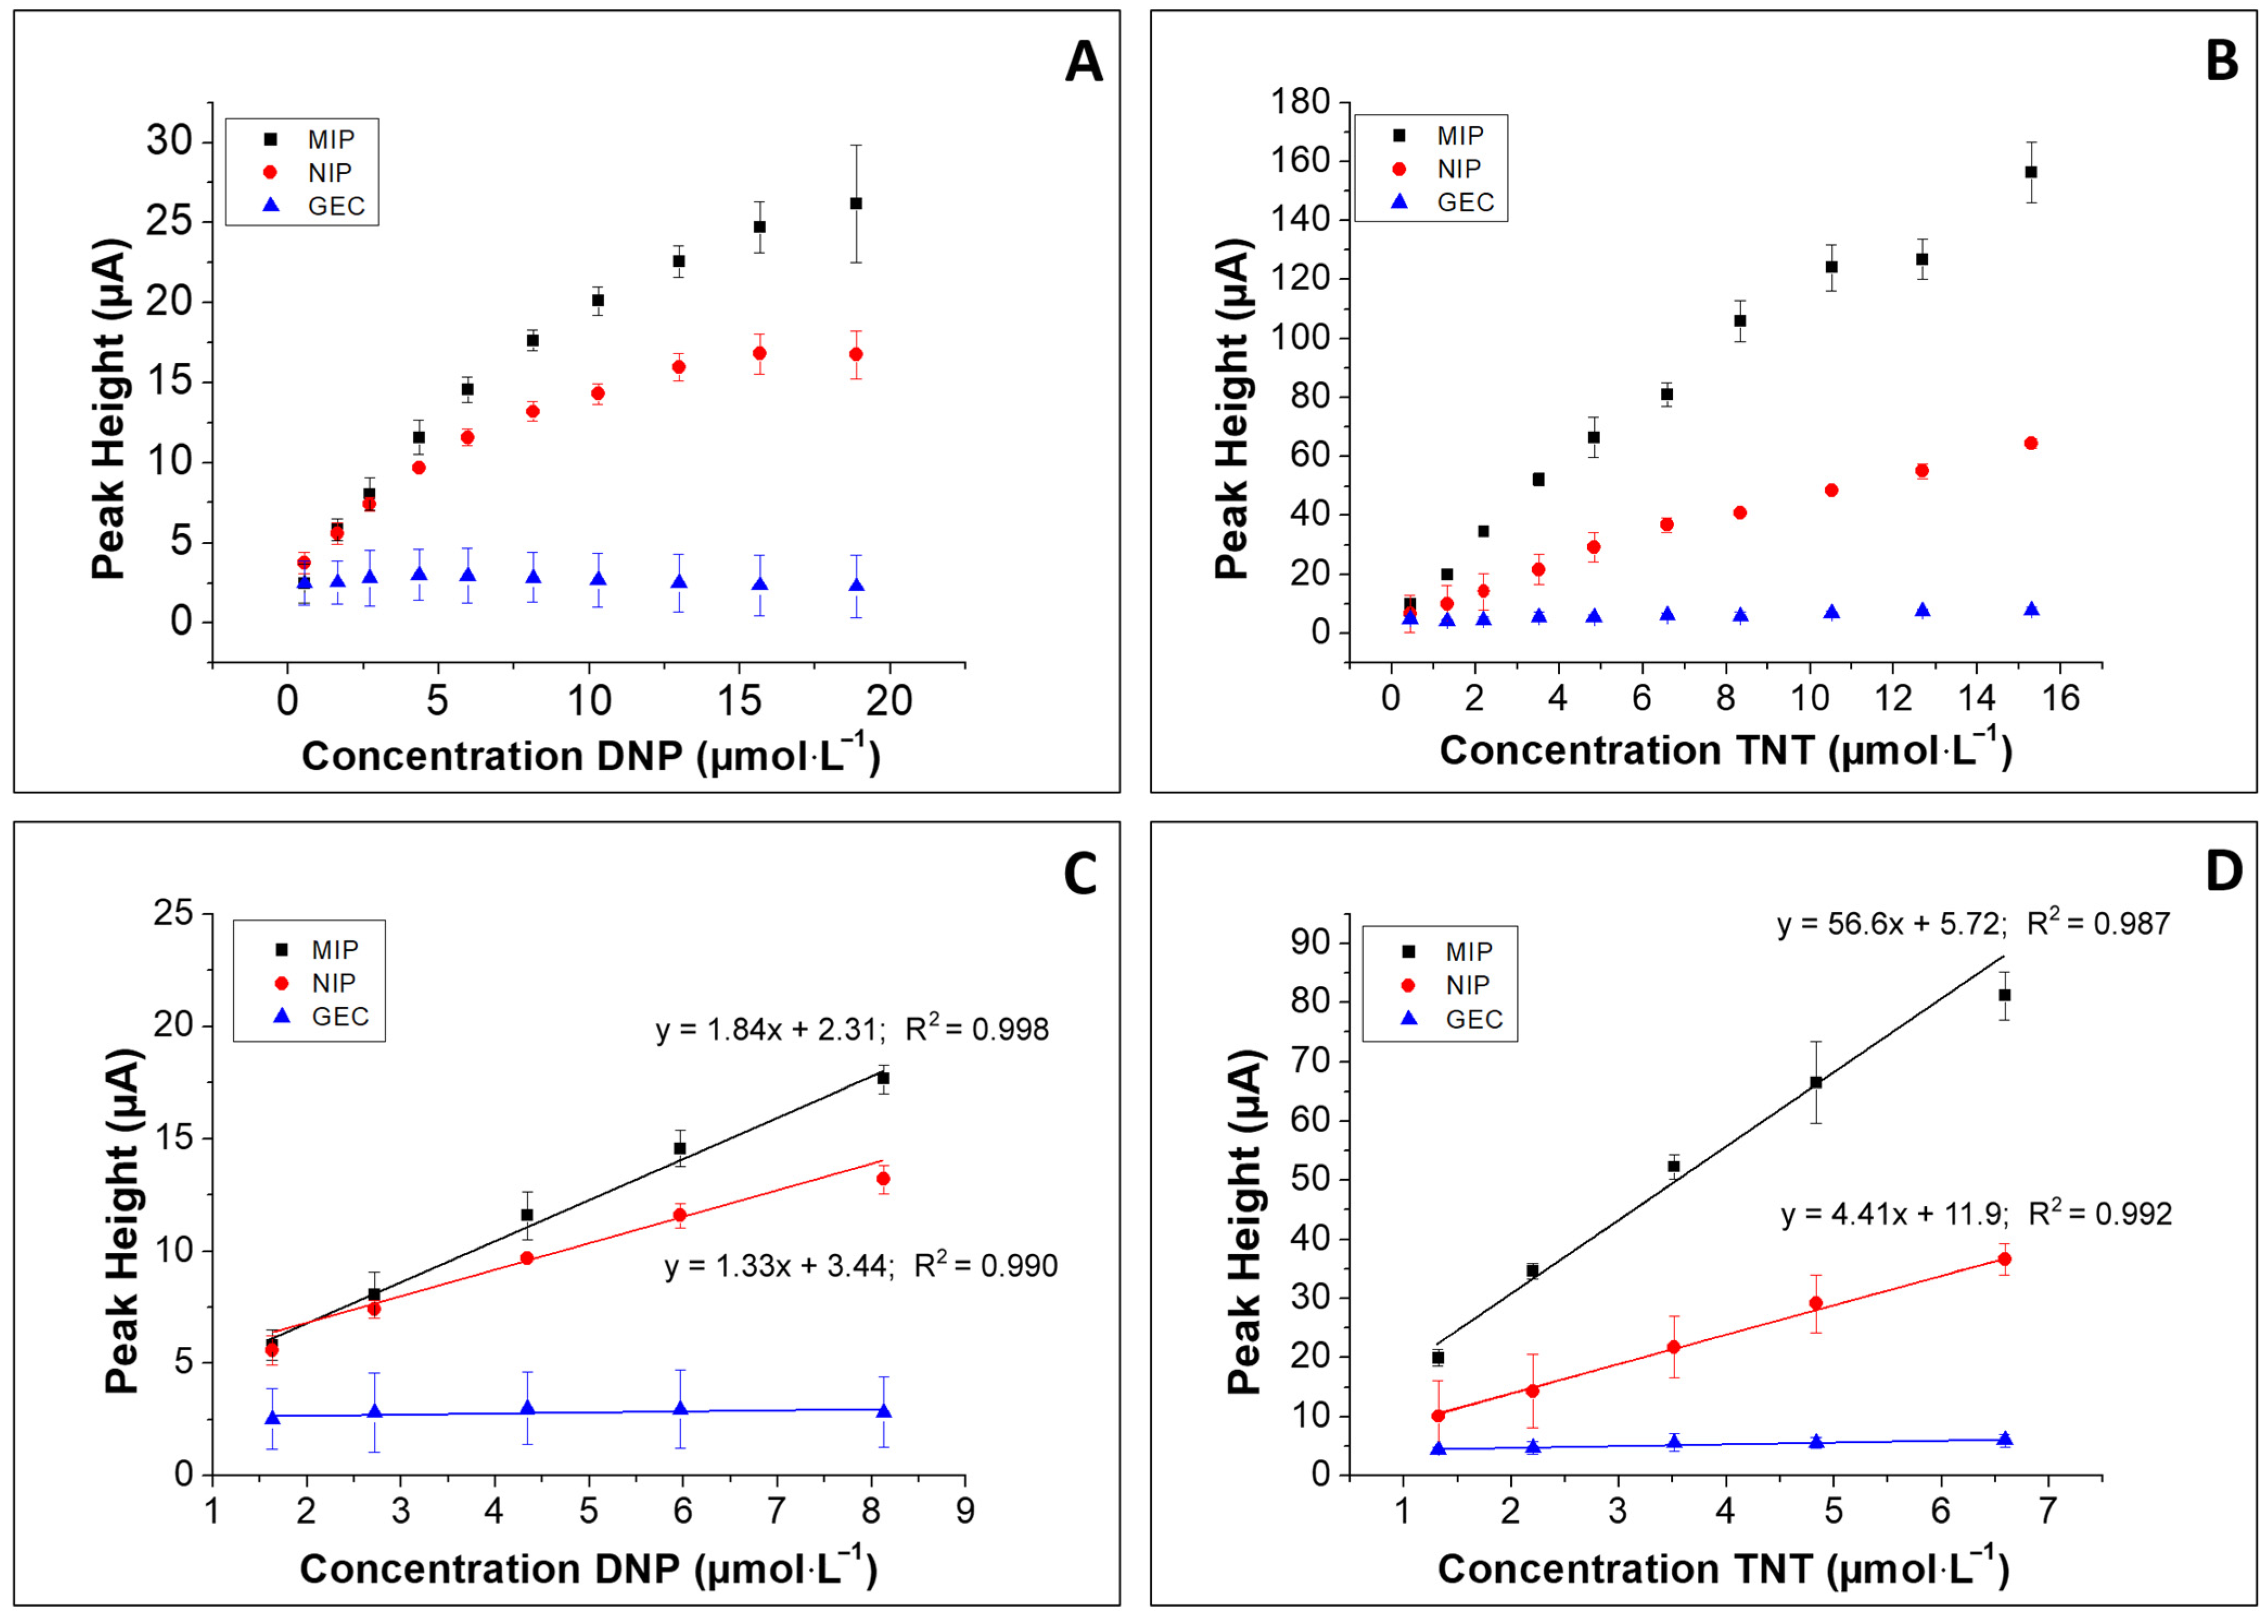
3.3. Calibration Curves

An MIP sensor, NIP sensor and bare electrode (GEC) were used to compare the voltammetric responses for DNP and TNT in detail, as depicted in Figure 6. Three sensors of each type were used to build the calibration curves on different days. The obtained voltammograms were treated with baseline correction and the first peak was chosen to determine the peak height. To illustrate the processing, the baseline-corrected voltammograms are plotted in Figure S5, in the supplementary information.
In order to obtain LOD values (S/N = 3), the regression lines were fitted with the first five concentration values of the calibration curves, from 1.6 to 8.0 µmol L−1 for DNP and 1.3 to 6.5 µmol L−1 for TNT, and the linear portions of the calibration curve were used for the calculation. Detailed parameters of the calibration curves are shown in Table 2.
As per the results obtained, it may seem that the affinity of the MIP is better for TNT than for DNP. These results may be explained in view of the electrostatic attraction between a bulk polymer and the number of nitro groups borne by each compound: TNT has three groups whereas DNP only has two.
A quick assessment of specificity was performed, verifying the interference effect of three related phenolic compounds, acetaminophen, tryptamine and serotonin, in mixtures with TNT, to check any significant alteration of the voltammetric signals and/or the adsorption abilities of the MIP materials. In all assayed cases (Figure S6, supplementary info), the TNT signals were only minimally affected, demonstrating the accomplished selectivity with the MIP modified devices.

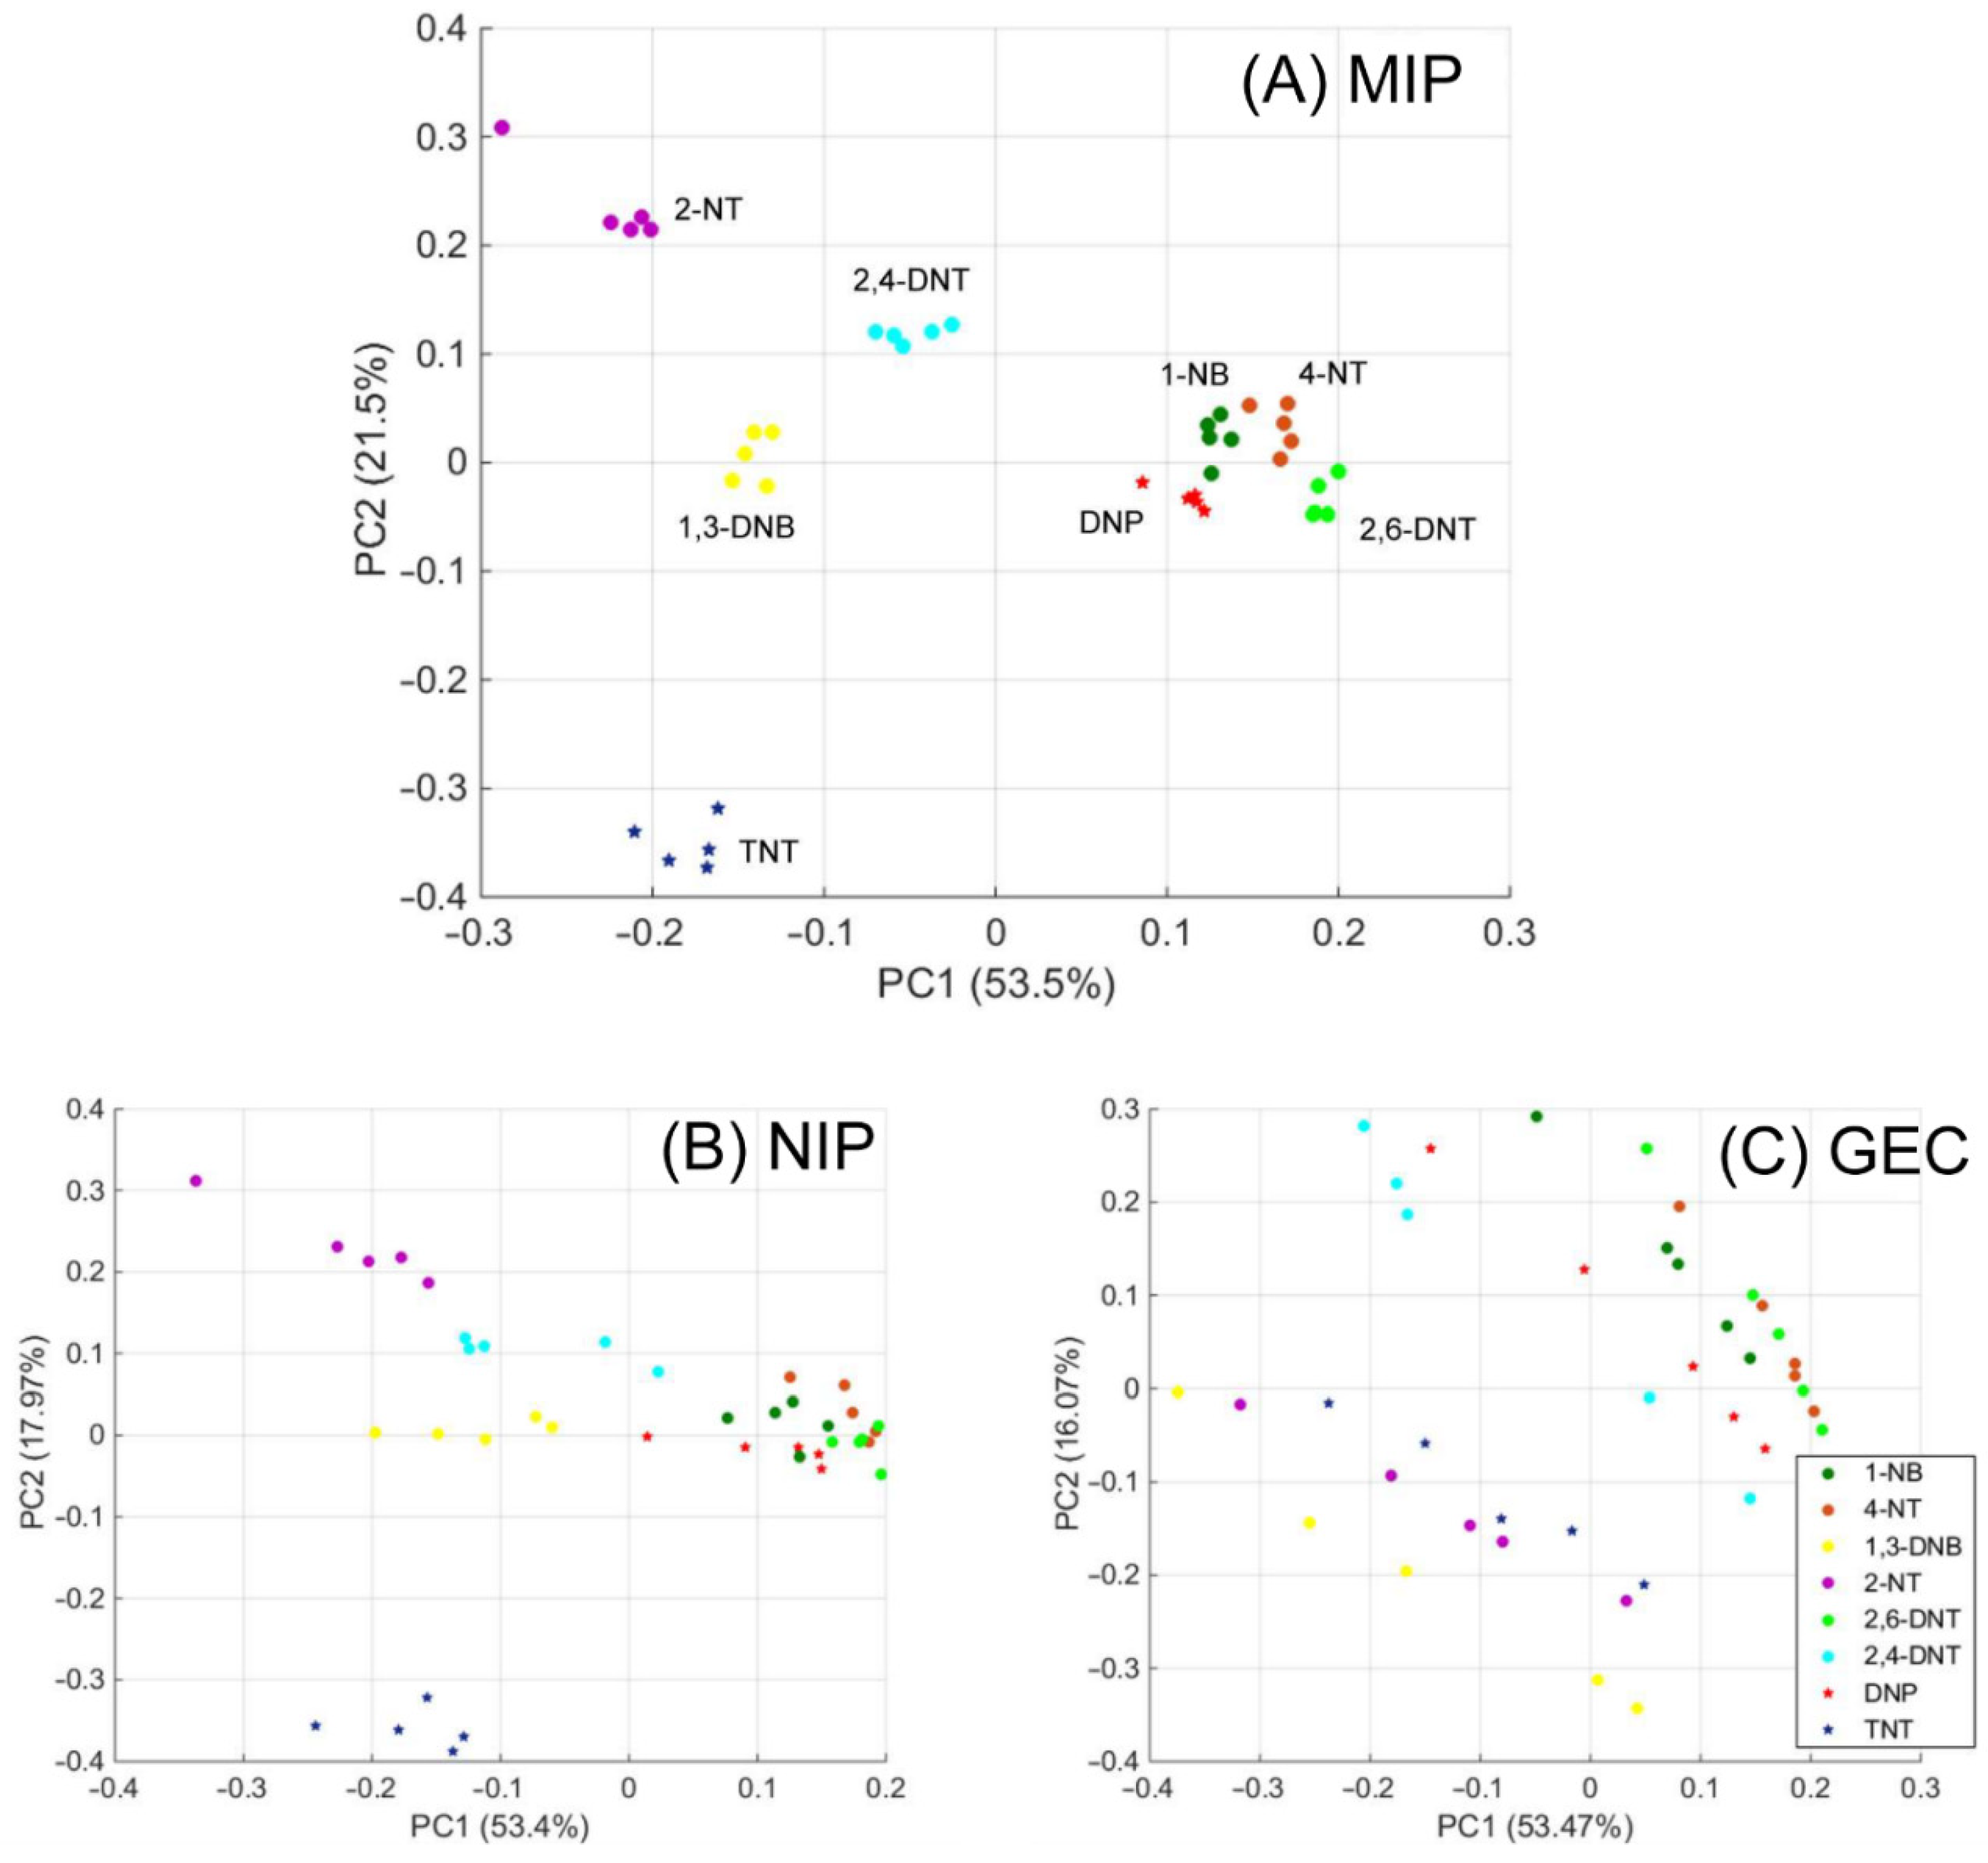
3.4. Specificity versus Other Nitroaromatic Compounds

Other mono-nitro and di-nitro aromatic compounds available in the laboratory were measured five times at the same concentration in order to evaluate the specificity of the imprinted sensor. Examined compounds, in addition to DNP and TNT, were 2,4-dinitrotoluene (2,4-DNT), 2,6-dinitrotoluene (2,6-DNT), 2-nitrotoluene (2-NT), 1,3-dinitrobenzene (1,3-DNB), 4-nitrotoluene (4-NT) and 1-nitrobezene (1-NB). Fixed concentrations of 10 µmol L−1 of the corresponding compounds were employed to evaluate the differences in specificity.
As can be seen in Figure 7, current intensities are clearly higher for the MIP sensor when compared with the NIP and GEC sensors for all the evaluated compounds. This higher current may be attributed to the enrichment of electroactive species on the surface electrode due to the imprinted sites.
However, when we examined the specificity, it was evident that TNT exhibited the highest current, followed by the group formed by 2-NT, 2,4-DNT, 1,3-DNB and 2,6-DNT, and finally, in the last group, we observed 4-NT, 1-NB and DNP. These different groups can be explained again by the number of nitro groups present in the molecule. It may seem that a larger number of nitro groups allows a higher concentration on the polymer surface and an increase in the signal intensity.
As an additional feature that may be derived from these assays, we foresee possible uses in discriminating the different nitroaromatic compounds in a type of intelligent sensor, for which an exploratory application was attempted. Multivariate analysis of the complete voltammogram employing a principal component analysis (PCA) was performed in order to evaluate whether the voltammetric signals obtained were promising for future studies involving classification and/or quantification of the substances. Five samples for each compound at 10 µmol L−1 were measured with the MIP, NIP and GEC sensors (see characteristic voltammogram profiles in the supplementary information, Figure S8). In Figure 8, the scores obtained after the PCA transformation are plotted, and as can be seen, each different compound formed its own cluster in the case of MIP [A], whereas in the case of the NIP sensor [B] and GEC sensor [C], the samples were grouped clearly but with a lower degree of clustering, or did not group at all in the case of the GEC sensor. It is significative that the intended compounds in this study, i.e., DNP and TNT, exhibited distinct clusters, meaning that there is a clear difference in the response obtained from the template (DNP) and the intended analyte (TNT). The remaining compounds considered as possible interferents appeared in clusters more or less together; however, a separation could be seen inside the main “nitroaromatic cluster”, and each mono-nitro and di-nitro compound tested enabled its identification. The differences in the PCA results for the compared sensors show that the MIP sensor enabled a better discrimination among the tested nitroaromatic compounds (as can be seen in Figure 8). These results shown by this PCA treatment are a promising starting point to apply a combination of electrochemistry and chemometrics, which is commonly known as Electronic Tongue [51], to identify nitrated compounds in the environmental field.

4. Conclusions

The use of DNP as a dummy template in a biomimetic MIP-based sensor for the determination and discrimination of TNT has been proven to offer a suitable electrochemical response for identification and quantification of the latter. Electron microscopy showed how the spatial distribution of the synthesized MIP was homogeneous within the electrodes modified by spin-coating. The optimisation of the electroanalytical system resulted in a linear response range from 1.6 to 8.0 µmol L−1 for DNP and from 1.3 to 6.5 µmol L−1 for TNT. Furthermore, a specificity study was carried out in order to discriminate TNT from other nitroaromatic species. The constructed sensory platform was sensitive to TNT, capable of detecting TNT below the concentrations where it is considered a risk, i.e., 0.44 µmol L−1, among other mono, di and tri-nitro compounds that can be found and discriminated as derivate species in polluted surface or underground waters. However, more work is still needed to improve the sensitivity of MIP-GEC sensors while retaining a high selectivity; this is needed as well as choosing the simplest way of increasing the enrichment time by one or more orders of magnitude.
In future studies, the authors intend to apply this approach to build a sensor array with different imprinted polymers and use chemometrics to extract the maximum amount of information from the obtained electrochemical data in the electronic tongue approach [52]. Obtaining such an electronic tongue will hopefully enable the simultaneous quantification and identification of different nitrobenzene species in complex mixtures with enhanced sensitivity and selectivity features, with remarkable interest specifically in environmental applications.

Supplementary Materials

The following are available online at https://www.mdpi.com/article/10.3390/chemosensors9090255/s1, Figure S1: Representative SEM images employed to determine the polymers’ particle sizes for [A] MIP and [B] NIP. Figure S2: Comparison between MIP (red) and NIP (blue) FT-IR spectra. Figure S3: Adsorptive kinetics fitted curves for the different sensor types. Figure S4: [A] pH study for TNT at different pH values; [B] pH study for DNP at different pH vales for the three MIP sensors (n = 3). Figure S5: Voltammetric results with baseline correction responses for the calibration curves. Figure S6: Interferent study at different ratios for TNT versus acetaminophen, serotonin and tryptamine. Figure S7: Schematic representation of different species used into the discrimination study. Figure S8. Differential pulse voltammograms for 10 mol L−1 of [A] NB, [B] NT, [C] 1,3-DNB, [D] 2-NT, [E] 2,6-DNT, [F] 2,4-DNT, [G] 2,4-DNP, and [H] TNT employed in the principal component Analysis.

Author Contributions

Conceptualization, M.d.V.; Methodology, M.d.V.; Investigation, A.H.-C., A.G.-C.; A.H.-C. performed the design and synthesis of polymers and the experimental measurements. A.G.-C. performed the calculations for the qualitative modelling. M.d.V.; supervision, M.d.V.; funding acquisition. All authors contributed to the writing, reviewing and editing of the manuscript. All authors have read and agreed to the published version of the manuscript.

Funding

Financial support for this work was provided by the Spanish Ministry of Economy and Innovation, MINECO (Madrid) through project PID2019-107102RB-C21. Manel del Valle thanks the support from program ICREA Academia from Generalitat de Catalunya.

Institutional Review Board Statement

Not applicable.

Informed Consent Statement

Not applicable.

Data Availability Statement

Not applicable.

Acknowledgments

Anna Herrera-Chacon and Andreu González-Calabuig thank Universtitat Autònoma de Barcelona (UAB) for the PIF fellowship.

Conflicts of Interest

The authors declare no conflict of interest.

References

  1. Liang, C.; Ristic, R.; Jiranek, V.; Jeffery, D.W. Chemical and Sensory Evaluation of Magnetic Polymers as a Remedial Treatment for Elevated Concentrations of 3-Isobutyl-2-methoxypyrazine in Cabernet Sauvignon Grape Must and Wine. J. Agric. Food Chem. 2018, 66, 7121–7130. [Google Scholar] [CrossRef]
  2. Herrera-Chacon, A.; González-Calabuig, A.; Campos, I.; del Valle, M. Bioelectronic tongue using MIP sensors for the resolution of volatile phenolic compounds. Sens. Actuators B Chem. 2018, 258, 665–671. [Google Scholar] [CrossRef]
  3. Yola, M.L.; Atar, N. Electrochemical Detection of Atrazine by Platinum Nanoparticles/Carbon Nitride Nanotubes with Molecularly Imprinted Polymer. Ind. Eng. Chem. Res. 2017, 56, 7631–7639. [Google Scholar] [CrossRef]
  4. Nabavi, S.A.; Vladisavljević, G.T.; Zhu, Y.; Manović, V. Synthesis of Size-Tunable CO2-Philic Imprinted Polymeric Particles (MIPs) for Low-Pressure CO2 Capture Using Oil-in-Oil Suspension Polymerization. Environ. Sci. Technol. 2017, 51, 11476–11483. [Google Scholar] [CrossRef] [PubMed]
  5. Jiang, W.; Liu, L.; Chen, Y. Simultaneous Detection of Human C-Terminal p53 Isoforms by Single Template Molecularly Imprinted Polymers (MIPs) Coupled with Liquid Chromatography-Tandem Mass Spectrometry (LC-MS/MS)-Based Targeted Proteomics. Anal. Chem. 2018, 90, 3058–3066. [Google Scholar] [CrossRef] [PubMed]
  6. Chunta, S.; Suedee, R.; Lieberzeit, P.A. Low-Density Lipoprotein Sensor Based on Molecularly Imprinted Polymer. Anal. Chem. 2016, 88, 1419–1425. [Google Scholar] [CrossRef] [PubMed]
  7. Turner, A.P.F.; Piletsky, S. Biosensors and Biomimetic Sensors for the Detection of Drugs, Toxins and Biological Agents. In Defense against Bioterror. NATO Security through Science Series; Morrison, D., Milanovich, F., Ivnitski, D., Austin, T.R., Eds.; Springer: Dordrecht, The Nerthlands, 2005; pp. 261–272. [Google Scholar]
  8. Huang, Y.; Pan, J.; Liu, Y.; Wang, M.; Deng, S.; Xia, Z. A SPE method with two MIPs in two steps for improving the selectivity of MIPs. Anal. Chem. 2019, 91, 8436–8442. [Google Scholar] [CrossRef] [PubMed]
  9. Chen, L.; Huang, X. Sensitive Monitoring of Fluoroquinolones in Milk and Honey Using Multiple Monolithic Fiber Solid-Phase Microextraction Coupled to Liquid Chromatography Tandem Mass Spectrometry. J. Agric. Food Chem. 2016, 64, 8684–8693. [Google Scholar] [CrossRef]
  10. Gómez-Arribas, L.N.; Urraca, J.L.; Benito-Penìa, E.; Moreno-Bondi, M.C. Tag-specific affinity purification of recombinant proteins by using molecularly imprinted polymers. Anal. Chem. 2019, 91, 4100–4106. [Google Scholar] [CrossRef]
  11. Ben Aissa, A.; Herrera-Chacon, A.; Pupin, R.R.; Sotomayor, M.D.P.T.; Pividori, M.I. Magnetic molecularly imprinted polymer for the isolation and detection of biotin and biotinylated biomolecules. Biosens. Bioelectron. 2017, 88, 101–108. [Google Scholar] [CrossRef] [Green Version]
  12. Klimuntowski, M.; Alam, M.M.; Singh, G.; Howlader, M.M.R. Electrochemical Sensing of Cannabinoids in Biofluids: A Noninvasive Tool for Drug Detection. ACS Sens. 2020, 5, 620–636. [Google Scholar] [CrossRef]
  13. Wackerlig, J.; Schirhagl, R. Applications of Molecularly Imprinted Polymer Nanoparticles and Their Advances toward Industrial Use: A Review. Anal. Chem. 2016, 88, 250–261. [Google Scholar] [CrossRef] [PubMed]
  14. Sun, X.; Wang, J.; Li, Y.; Yang, J.; Jin, J.; Shah, S.M.; Chen, J. Novel dummy molecularly imprinted polymers for matrix solid-phase dispersion extraction of eight fluoroquinolones from fish samples. J. Chromatogr. A 2014, 1359, 1–7. [Google Scholar] [CrossRef] [PubMed]
  15. Yin, Y.M.; Chen, Y.P.; Wang, X.F.; Liu, Y.; Liu, H.L.; Xie, M.X. Dummy molecularly imprinted polymers on silica particles for selective solid-phase extraction of tetrabromobisphenol A from water samples. J. Chromatogr. A 2012, 1220, 7–13. [Google Scholar] [CrossRef] [PubMed]
  16. Bagheri, A.R.; Arabi, M.; Ghaedi, M.; Ostovan, A.; Wang, X.; Li, J.; Chen, L. Dummy molecularly imprinted polymers based on a green synthesis strategy for magnetic solid-phase extraction of acrylamide in food samples. Talanta 2019, 195, 390–400. [Google Scholar] [CrossRef]
  17. McCluskey, A.; Holdsworth, C.I.; Bowyer, M.C. Molecularly imprinted polymers (MIPs): Sensing, an explosive new opportunity? Org. Biomol. Chem. 2007, 5, 3233–3244. [Google Scholar] [CrossRef] [PubMed]
  18. Xu, S.; Lu, H.; Li, J.; Song, X.; Wang, A.; Chen, L.; Han, S. Dummy molecularly imprinted polymers-capped CdTe quantum dots for the fluorescent sensing of 2,4,6-trinitrotoluene. ACS Appl. Mater. Interfaces 2013, 5, 8146–8154. [Google Scholar] [CrossRef]
  19. Yılmaz, E.; Garipcan, B.; Patra, H.K.; Uzun, L. Molecular imprinting applications in forensic science. Sensors 2017, 17, 691. [Google Scholar] [CrossRef] [Green Version]
  20. Zhu, H.; Zhang, H.; Xia, Y. Planar Is Better: Monodisperse Three-Layered MoS2 Quantum Dots as Fluorescent Reporters for 2,4,6-Trinitrotoluene Sensing in Environmental Water and Luggage Cases. Anal. Chem. 2018, 90, 3942–3949. [Google Scholar] [CrossRef]
  21. Lu, W.; Xue, M.; Xu, Z.; Dong, X.; Xue, F.; Wang, F.; Wang, Q.; Meng, Z. Molecularly Imprinted Polymers for the Sensing of Explosives and Chemical Warfare Agents. Curr. Org. Chem. 2015, 19, 62–71. [Google Scholar] [CrossRef]
  22. Lu, W.; Li, H.; Meng, Z.; Liang, X.; Xue, M.; Wang, Q.; Dong, X. Detection of nitrobenzene compounds in surface water by ion mobility spectrometry coupled with molecularly imprinted polymers. J. Hazard. Mater. 2014, 280, 588–594. [Google Scholar] [CrossRef]
  23. Cortada, C.; Vidal, L.; Canals, A. Determination of nitroaromatic explosives in water samples by direct ultrasound-assisted dispersive liquid-liquid microextraction followed by gas chromatography-mass spectrometry. Talanta 2011, 85, 2546–2552. [Google Scholar] [CrossRef]
  24. Shi, L.; Hou, A.G.; Chen, L.Y.; Wang, Z.F. Electrochemical sensor prepared from molecularly imprinted polymer for recognition of TNT. Polym. Compos. 2015, 36, 1280–1285. [Google Scholar] [CrossRef]
  25. Wang, J. Electrochemical sensing of explosives. Electroanalysis 2007, 19, 415–423. [Google Scholar] [CrossRef]
  26. Pesavento, M.; D’Agostino, G.; Alberti, G.; Biesuz, R.; Merli, D. Voltammetric platform for detection of 2,4,6-trinitrotoluene based on a molecularly imprinted polymer. Anal. Bioanal. Chem. 2013, 405, 3559–3570. [Google Scholar] [CrossRef] [PubMed]
  27. Leibl, N.; Duma, L.; Gonzato, C.; Haupt, K. Polydopamine-based molecularly imprinted thin films for electro-chemical sensing of nitro-explosives in aqueous solutions. Bioelectrochemistry 2020, 135, 107541. [Google Scholar] [CrossRef] [PubMed]
  28. Alizadeh, T.; Zare, M.; Ganjali, M.R.; Norouzi, P.; Tavana, B. A new molecularly imprinted polymer (MIP)-based electrochemical sensor for monitoring 2,4,6-trinitrotoluene (TNT) in natural waters and soil samples. Biosens. Bioelectron. 2010, 25, 1166–1172. [Google Scholar] [CrossRef]
  29. Sağlam, Ş.; Üzer, A.; Erçağ, E.; Apak, R. Electrochemical Determination of TNT, DNT, RDX, and HMX with Gold Nanoparticles/Poly(Carbazole-Aniline) Film–Modified Glassy Carbon Sensor Electrodes Imprinted for Molecular Recognition of Nitroaromatics and Nitramines. Anal. Chem. 2018, 90, 7364–7370. [Google Scholar] [CrossRef]
  30. Nie, D.; Jiang, D.; Zhang, D.; Liang, Y.; Xue, Y.; Zhou, T.; Jin, L.; Shi, G. Two-dimensional molecular imprinting approach for the electrochemical detection of trinitrotoluene. Sens. Actuators B Chem. 2011, 156, 43–49. [Google Scholar] [CrossRef]
  31. Zhang, Z.; Chen, S.; Shi, R.; Ji, J.; Wang, D.; Jin, S.; Han, T.; Zhou, C.; Shu, Q. A single molecular fluorescent probe for selective and sensitive detection of nitroaromatic explosives: A new strategy for the mask-free discrimination of TNT and TNP within same sample. Talanta 2017, 166, 228–233. [Google Scholar] [CrossRef] [PubMed]
  32. Ma, Y.; Wang, L. Upconversion luminescence nanosensor for TNT selective and label-free quantification in the mixture of nitroaromatic explosives. Talanta 2014, 120, 100–105. [Google Scholar] [CrossRef]
  33. Ma, Y.; Li, H.; Peng, S.; Wang, L. Highly Selective and Sensitive Fluorescent Paper Sensor for Nitroaromatic Explosive Detection. Anal. Chem. 2012, 84, 8415–8421. [Google Scholar] [CrossRef] [PubMed]
  34. Zimmermann, Y.; Broekaert, J.A.C. Determination of TNT and its metabolites in water samples by voltammetric techniques. Anal. Bioanal. Chem. 2005, 383, 998–1002. [Google Scholar] [CrossRef] [PubMed]
  35. Drinking Water Standards and Health Advisories; EPA 822-S-12-001; United States Environmental Protection Agency: Washington, DC, USA, 2012; pp. 1–20.
  36. Technical Fact Sheet—2,4,6-Trinitrotoluene (TNT); United States Environmental Protection Agency: Washington, DC, USA, 2014; pp. 1–8.
  37. Wang, J.; Lu, F.; MacDonald, D.; Lu, J.; Ozsoz, M.E.S.; Rogers, K.R. Screen-printed voltammetric sensor for TNT. Talanta 1998, 46, 1405–1412. [Google Scholar] [CrossRef]
  38. Caygill, J.S.; Collyer, S.D.; Holmes, J.L.; Davis, F.; Higson, S.P.J. Disposable screen-printed sensors for the electrochemical detection of TNT and DNT. Analyst 2013, 138, 346–352. [Google Scholar] [CrossRef] [PubMed]
  39. Caygill, J.S.; Collyer, S.D.; Holmes, J.L.; Davis, F.; Higson, S.P.J. Electrochemical Detection of TNT at Cobalt Phthalocyanine Mediated Screen-Printed Electrodes and Application to Detection of Airborne Vapours. Electroanalysis 2013, 25, 2445–2452. [Google Scholar] [CrossRef] [Green Version]
  40. Wang, J.; Hocevar, S.B.; Ogorevc, B. Carbon nanotube-modified glassy carbon electrode for adsorptive stripping voltammetric detection of ultratrace levels of 2,4,6-trinitrotoluene. Electrochem. Commun. 2004, 6, 176–179. [Google Scholar] [CrossRef]
  41. Zang, J.; Guo, C.X.; Hu, F.; Yu, L.; Li, C.M. Electrochemical detection of ultratrace nitroaromatic explosives using ordered mesoporous carbon. Anal. Chim. Acta 2011, 683, 187–191. [Google Scholar] [CrossRef] [PubMed]
  42. Yu, J.; Wang, X.; Kang, Q.; Li, J.; Shen, D.; Chen, L. One-pot synthesis of a quantum dot-based molecular imprinting nanosensor for highly selective and sensitive fluorescence detection of 4-nitrophenol in environmental waters. Environ. Sci. Nano 2017, 4, 493–502. [Google Scholar] [CrossRef]
  43. Saloni, J.; Walker, K.; Hill, G. Theoretical investigation on monomer and solvent selection for molecular imprinting of nitrocompounds. J. Phys. Chem. A 2013, 117, 1531–1534. [Google Scholar] [CrossRef] [PubMed]
  44. Lopez-Nogueroles, M.; Lordel-Madeleine, S.; Chisvert, A.; Salvador, A.; Pichon, V. Development of a selective solid phase extraction method for nitro musk compounds in environmental waters using a molecularly imprinted sorbent. Talanta 2013, 110, 128–134. [Google Scholar] [CrossRef] [PubMed]
  45. Schindelin, J.; Arganda-Carreras, I.; Frise, E.; Kaynig, V.; Longair, M.; Pietzsch, T.; Preibisch, S.; Rueden, C.; Saalfeld, S.; Schmid, B.; et al. Fiji: An open-source platform for biological-image analysis. Nat. Methods 2019, 9, 676–682. [Google Scholar] [CrossRef] [PubMed] [Green Version]
  46. Olivé-Monllau, R.; Baeza, M.; Bartrolí, J.; Céspedes, F. Novel amperometric sensor based on rigid near-percolation composite. Electroanalysis 2009, 21, 931–938. [Google Scholar] [CrossRef]
  47. Alegret, S.; Alonso, J.; Bartrolí, J.; Céspedes, F.; Martínez-Fàbregas, E.; del Valle, M. Amperometric biosensors based on bulk-modified epoxy graphite biocomposites. Sens. Mater. 1996, 8, 147–153. [Google Scholar]
  48. Aceta, Y.; del Valle, M. Graphene electrode platform for impedimetric aptasensing. Electrochim. Acta 2017, 229, 458–466. [Google Scholar] [CrossRef]
  49. Ocaña, C.; del Valle, M. Signal amplification for thrombin impedimetric aptasensor: Sandwich protocol and use of gold-streptavidin nanoparticles. Biosens. Bioelectron. 2014, 54, 408–414. [Google Scholar] [CrossRef] [Green Version]
  50. Herrera-Chacón, A.; Dinç-Zor, Ş.; del Valle, M. Integrating molecularly imprinted polymer beads in graphite-epoxy electrodes for the voltammetric biosensing of histamine in wines. Talanta 2020, 208, 120348. [Google Scholar] [CrossRef]
  51. Ciosek, P.; Wróblewski, W. Sensor arrays for liquid sensing—Electronic tongue systems. Analyst 2007, 132, 963–978. [Google Scholar] [CrossRef]
  52. Del Valle, M. Electronic Tongues Employing Electrochemical Sensors. Electroanalysis 2010, 22, 1539–1555. [Google Scholar] [CrossRef] [Green Version]
Figure 1. Schematic procedure of polymer imprinting synthesis process employing 2,4-dinitrophenol (DNP) and its immobilization onto the surface sensor.
Chemosensors 09 00255 g001
Figure 2. Characterisation of the polymers for MIP (A,C) and NIP (B,D): scanning electron microscopy (SEM) with secondary electron (A,B) and size distribution of the particles (C,D).
Chemosensors 09 00255 g002
Figure 3. Scanning electron microscopy (SEM) images with secondary electron detector for the MIP-sensor (A) and NIP-sensor (B) and GEC electrode (C).
Chemosensors 09 00255 g003
Figure 4. Repeatability measurements of MIP and NIP for (A) DNP and (B) TNT (n = 3).
Chemosensors 09 00255 g004
Figure 5. Voltammetric responses from 0.55 to 19 µmol L−1 of DNP and from 0.45 to 15 µmol L−1 TNT for the prepared sensors (each colour represents an increasing concentration of the corresponding compound). (A) Voltammetric response vs. DNP measured with the MIP sensor. (B) Voltammetric response vs. DNP measured with the NIP sensor. (C) Voltammetric response of DNP measured with the GEC sensor. (D) Voltammetric response vs. TNT measured with the MIP sensor. (E) Voltammetric response of TNT measured with the NIP sensor. (F) Voltammetric response vs. TNT measured with the GEC sensor.
Chemosensors 09 00255 g005
Figure 6. Calibration curves from 0.55 to 19 µmol L−1 for DNP (A) and from 0.45 to 15 µmol L−1 for TNT (B) for the three different sensor types used in this study. Linear ranges from 1.6 to 8.0 µmol L−1 for DNP and from 1.3 to 6.5 µmol L−1 for TNT are added in (C,D).
Chemosensors 09 00255 g006
Figure 7. Comparison of voltammetric response of 10 µmol L−1 nitroaromatic compounds for each sensor and different nitroaromatic species.
Chemosensors 09 00255 g007
Figure 8. Score plots for each nitroaromatic compound performed with the voltammetric signals of (A) MIP, (B) NIP and (C) GEC sensors for five replicates of each nitroaromatic compound at 10 µmol L−1 after principal component analysis.
Chemosensors 09 00255 g008
Table 1. Summary of recent studies dedicated to the detection of TNT, detailing the strategy and technique employed, linear range and limit of detection.
Sensing Platform InterferentsTechniqueLinear Range (mol L−1)LOD (mol L−1)Reference
Molecularly imprinted polydopamine films onto gold electrodesTrimesic acid, isopthalic acid and
4-nitrophenol
Cyclic Voltammetry 0.1 × 10⁻⁹–10.0 × 10−950.0 × 10⁻¹²[27]
Carbon paste electrodes modified with MIP particles Phenol, Aniline, para-Nitrophenol,
Benzoic acid and Nitrobenzene
Square-Wave Voltammetry 5.0 × 10⁻⁹–1.0 × 10−61.5 × 10−9[28]
Gold nanoparticles/poly
(carbazole-aniline) film-modified glassy carbon electrode
Paracetamol-caffeine-based analgesic drug, acetylsalicylic acid (aspirin), sweetener, and sugarSquare-Wave Voltammetry4.4 × 10−7–4.4 × 10−61.1 × 10−7[29]
Alkanethiols self-assembled on AuNPs modified glassy carbon Trinitrobenzene, dinitrotoluene
and dinitrobenzene
Differential Pulse Voltammetry 4.0 × 10⁻⁸–3.2 × 10−61.3 × 10−8[30]
Dummy molecularly imprinted polymers with capped CdTe quantum
dots
2,4-dinitrophenol, 4-nitrophenol,
phenol, and dinitrotoluene
Fluorescence 0.8 × 10⁻⁶–30.0 × 10−60.28 × 10−6[18]
Naphthalene based fluorescent probeNitrobenzene, p-Nitrotoluene, Dinitrotoluene, Trinitrophenol, cyclotrimethylenetrinitramine, cyclotetra-
methylenetetranitramine and
Hexanitrohexaazaisowurtzitane
UV–Vis spectroscopy 5 × 10⁻⁹
1 × 10⁻⁶
1.5 × 10⁻⁹[31]
Amine functionalised nanoparticlesNitrobenzene, dinitrotoluene
and trinitrophenol
Fluorescence4.4 × 10−11–4.0 × 10−84.3 × 10−11[32]
Fluorescent paperNitrobenzene, dinitrotoluene
and trinitrophenol
Fluorescence 2.2 × 10⁻¹⁰–3.1 × 10−81.4 × 10−10[33]
MIP functionalised carbon graphite epoxy composite electrodesParacetamol, serotonin, tryptamineDifferential pulse voltammetry1.5 × 10−6–8 × 10−60.29 × 10−6The present work
Table 2. Summary of calibration results in the linear concentration region from 1.6 to 8.0 µmol L−1 towards DNP and from 1.3 to 6.5 µmol L−1 for TNT.
MIPNIP
DNPTNTDNPTNT
Sensitivity (µA µmol−1 L)1.8456.61.334.41
Intercept (µA)2.315.723.4411.9
R20.990.980.990.99
LOD (µmol1 L)0.590.291.380.95
LOQ (µmol−1 L)1.790.884.182.87
Publisher’s Note: MDPI stays neutral with regard to jurisdictional claims in published maps and institutional affiliations.

