This section details the material and methods used to perform the comparison, calibration, and verification of prototypes. First of all, we describe the background in magnetism and inductive coils as a sensor. Following, the developed prototypes and their features are described. Finally, the utilized equipment and the assays carried out are identified.
3.1. Background
An inductive sensor was patented in 1988, an apparatus for a micro-inductive investigation of earth formations with improved electroacoustics shieldings. The classification of this patent was “G01V3/28 Electric or magnetic prospecting or detecting; Measuring magnetic field characteristics of the earth, e.g., declination, deviation specially adapted for well-logging operating with magnetic or electric fields produced or modified either by the surrounding earth formation or by the detecting device using induction coils” [
39]. The following year, 1989, another team worked on inductive sensors. Their prototypes, a series of non-contacting electrical conductivity sensors, were used for monitoring remote, hostile environments. Kleinberg et al. [
40] measured the signal level when the sensor was placed near the homogenous formation. The formula developed by them was:
where
VL is the signal received by the sensor,
w is the operating frequency,
is the magnetic permeability of the formation,
G is the geometrical factor that depends on the coil characteristics and its space to the formation,
σ represents the formation,
is the number of turns in the transmitter coil, and
is the number of turns in the receiver coil. I is the current transmitter.
The principle stated before can be applied for environmental monitoring. In this paper, we propose several prototypes based on mutual inductance, which has been proven to be useful before [
38,
41]. The main novelty, according to the previous work [
40], is the change in the monitored environment. In [
41], the inductive coils were used to monitor the changes in the dielectric constant of a water body to estimate its conductivity or salt content. In this paper, the changes in the dielectric constant are related to the presence of water in the soil. In addition, as far as we know, there is no other work that analyzes the use of coils in different soils and including tests with the sensors buried for up to one month. Mutual inductance is a phenomenon with a principle stating that when a coil is powered with an electrical current (EC), a magnetic field appears. The characteristics of the said field depend on various parameters; among them, we find the diameter of the wire (ØW), the number of spires (
N), the signal used to power the coil (both the frequency and the voltage influencing it), as well as the diameter of the powered coil (ØPC). As seen in Equation (1) and Ampere’s Law, the number of spires (
N), the intensity of the current (I), and the permeability of the core of the solenoid (μ
0) determine the magnetic flux (
B) of the solenoid. Moreover, there is an equation for an infinite solenoid in free space which is:
Our prototypes were introduced in the soil, which contains water, with a relative permeability (μ
r). Since our prototype is finite, its length (
l) should be considered in the formula as:
An increase in permeability is to be expected when adding water. It is to be noted that for “permeability”, we understand the resistance a medium presents to creating a magnetic field. Therefore, when it increases, the magnetic field increases, as well. Furthermore, the said increase in the magnetic field, which is most prominent in the ferromagnetic core (in the center of the solenoid coil), increases the flow of electrons, thus affecting the electrical conductivity of the medium. For our experiment, this core in the center of the solenoid coil was filled with soil with a varying amount of water.
When placing another coil in the vicinity of the PC, the magnetic field previously mentioned causes said coil to be induced. This phenomenon is better known as mutual inductance. A magnetic flux is created when the lines about the magnetic field formed by the PC go through the IC. All modifications to the medium containing the coils and, therefore, to the magnetic flux, will affect it. Changes in the water quantity (soil moisture) affected the output voltage also known as Vout. The formula of the mutual inductance is as follows:
Equation (4) shows the description of the mutual inductance of two solenoids (
M). The parameters in that formula are
k for the coupling coefficient and
L1 and
L2 for the inductances of the coils. The later ones are dependent on the number of turns (
N), the length of the used solenoid (
l), the core of each coil (μ
0μ
r), and the cross-section area in m
2 (
A). The formula to calculate
L1 and
L2 with the aforementioned parameters is:
As stated before, the medium of the core determines the mutual inductance. For this experiment, the medium was soil. When the permeability experiences a change, the coupling effect (k) changes, as well. For the sake of the equation, it is important to note that the values for k range from 0, when no inductive coupling is present, to 1 (its maximum when there is a perfect coupling). A coupling effect of 1 implies that all the flux lines of the PC cut all the turns of the IC. For it to happen, the permeability should be high, and the coils should have a perfect geometry. One of the factors studied in our experiment is permeability, the characteristics of the core. Furthermore, the high number of prototypes tested is explained by the need to tests different geometries. Their position will be the same; nevertheless, the distance between the different coils and their length is one of the factors that change between prototypes.
Poljak et al. [
42] performed a series of experiments in which they proved that the induced voltage depends on some characteristics of the coil (N, ØW, and the diameter of the induced coil, ØIC). Furthermore, they stated that Vout depends on μ
r and
B. This principle, used for coils with a ferromagnetic core, is the power transformers’ principle.
The Biot–Savart Law [
43]:
The formula which determines the magnetic flux density is presented in Equation (6). The parameters on which it depends are the space of the source (R), a current which varies with time denoted by (t), the unit vector (), and the permeability (μ).
With Faraday’s Law, the induced electric field can be obtained:
In the above equation, a time-varying magnetic field (
dφ) is determined by an inducted electric field around a closed path. The induced electric field, using Stoke’s theorem [
44], can be defined in a non-varying surface (
dS) by the number of turns (
N), as in:
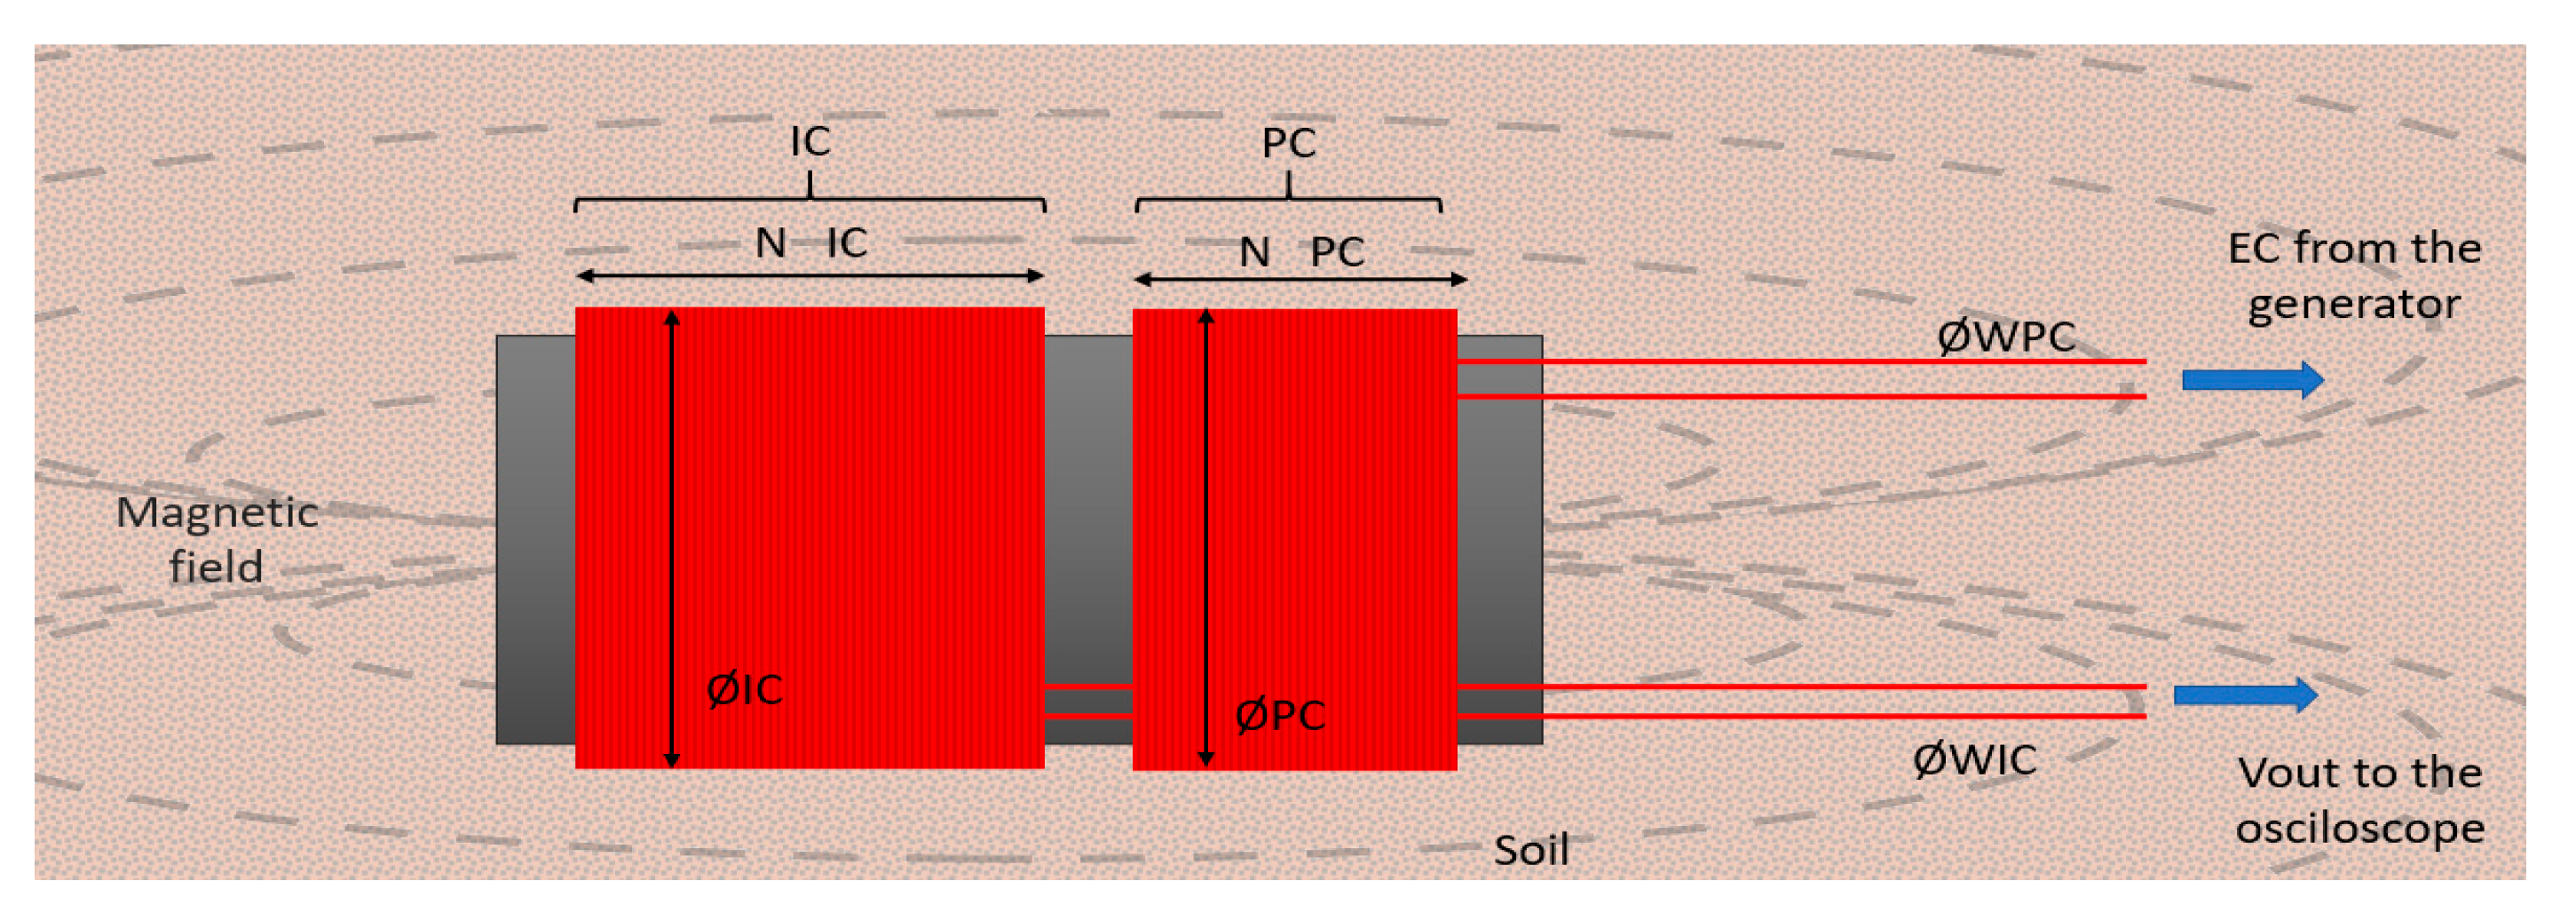
Figure 1 presents all the considered variables in the experiments we conducted. Seeing the position of PC concerning the IC, it is to be expected that when there would be an increase in the generated magnetic field, it would reflect an increase or decrease in the Vout. Moreover, to further limit the variables, the signal used to power the PC had a fixed intensity and voltage in each set of tests, modifying the frequency.
The utility of this kind of sensor has been proved for water conductivity monitoring [
41] and for monitoring the presence of fertilizers in water [
38]. Several prototypes were tested in these experiments since it has already been proven that changing some variables (ØPC, ØIC, ØW, and
N) is key in finding the best configuration. In this paper, we are trying to determine soil moisture based on its conductivity. Soil moisture is indicated as the water percentage in volume, as seen in Equation (9). Changes in soil moisture affect the dielectric constant, changing the permeability and producing a difference in the Vout. Soil moisture is indicated as the water percentage in volume as:
3.3. Circuit Characteristics and Measurement Protocol
A power generator was the source of the EC for the PC (a sinus-wave); the AFG1022 from Tektronix [
45] was selected. The range of frequencies it can generate and it is user-friendly handling fostered the selection of this generator. For the initial tests, a voltage of 10 Vpp was used. This was chosen to amplify the variances between the different Vout values. The objective of these tests was to determine the best configuration out of the very different P1 to P15 prototypes. Nevertheless, for enhancement tests, the voltage chosen was 3.3 Vpp. This is the standard voltage at which Arduino works. Therefore, it is best to adjust the equations derived from sensors NP1 to NP4.
For both sets of tests, the selected oscilloscope to register the Vout was the TBS1104 from Tektronix [
46]. Furthermore, a resistance of 47 Ω on the positive wire of the PC was added to protect the oscilloscope and reduce peaks, as well as a capacitor of 10 nF, which was connected to both wires on the IC. This assembly, see
Figure 3, is based on [
41].
It is to be noted that each datum for this experiment in the results section corresponds to the mean of five repetitions. The Vout reading was taken in quintuplicate, thus making the results more rigorous. To simplify the analyses, standard deviation data will only be presented when calibration tests were performed.
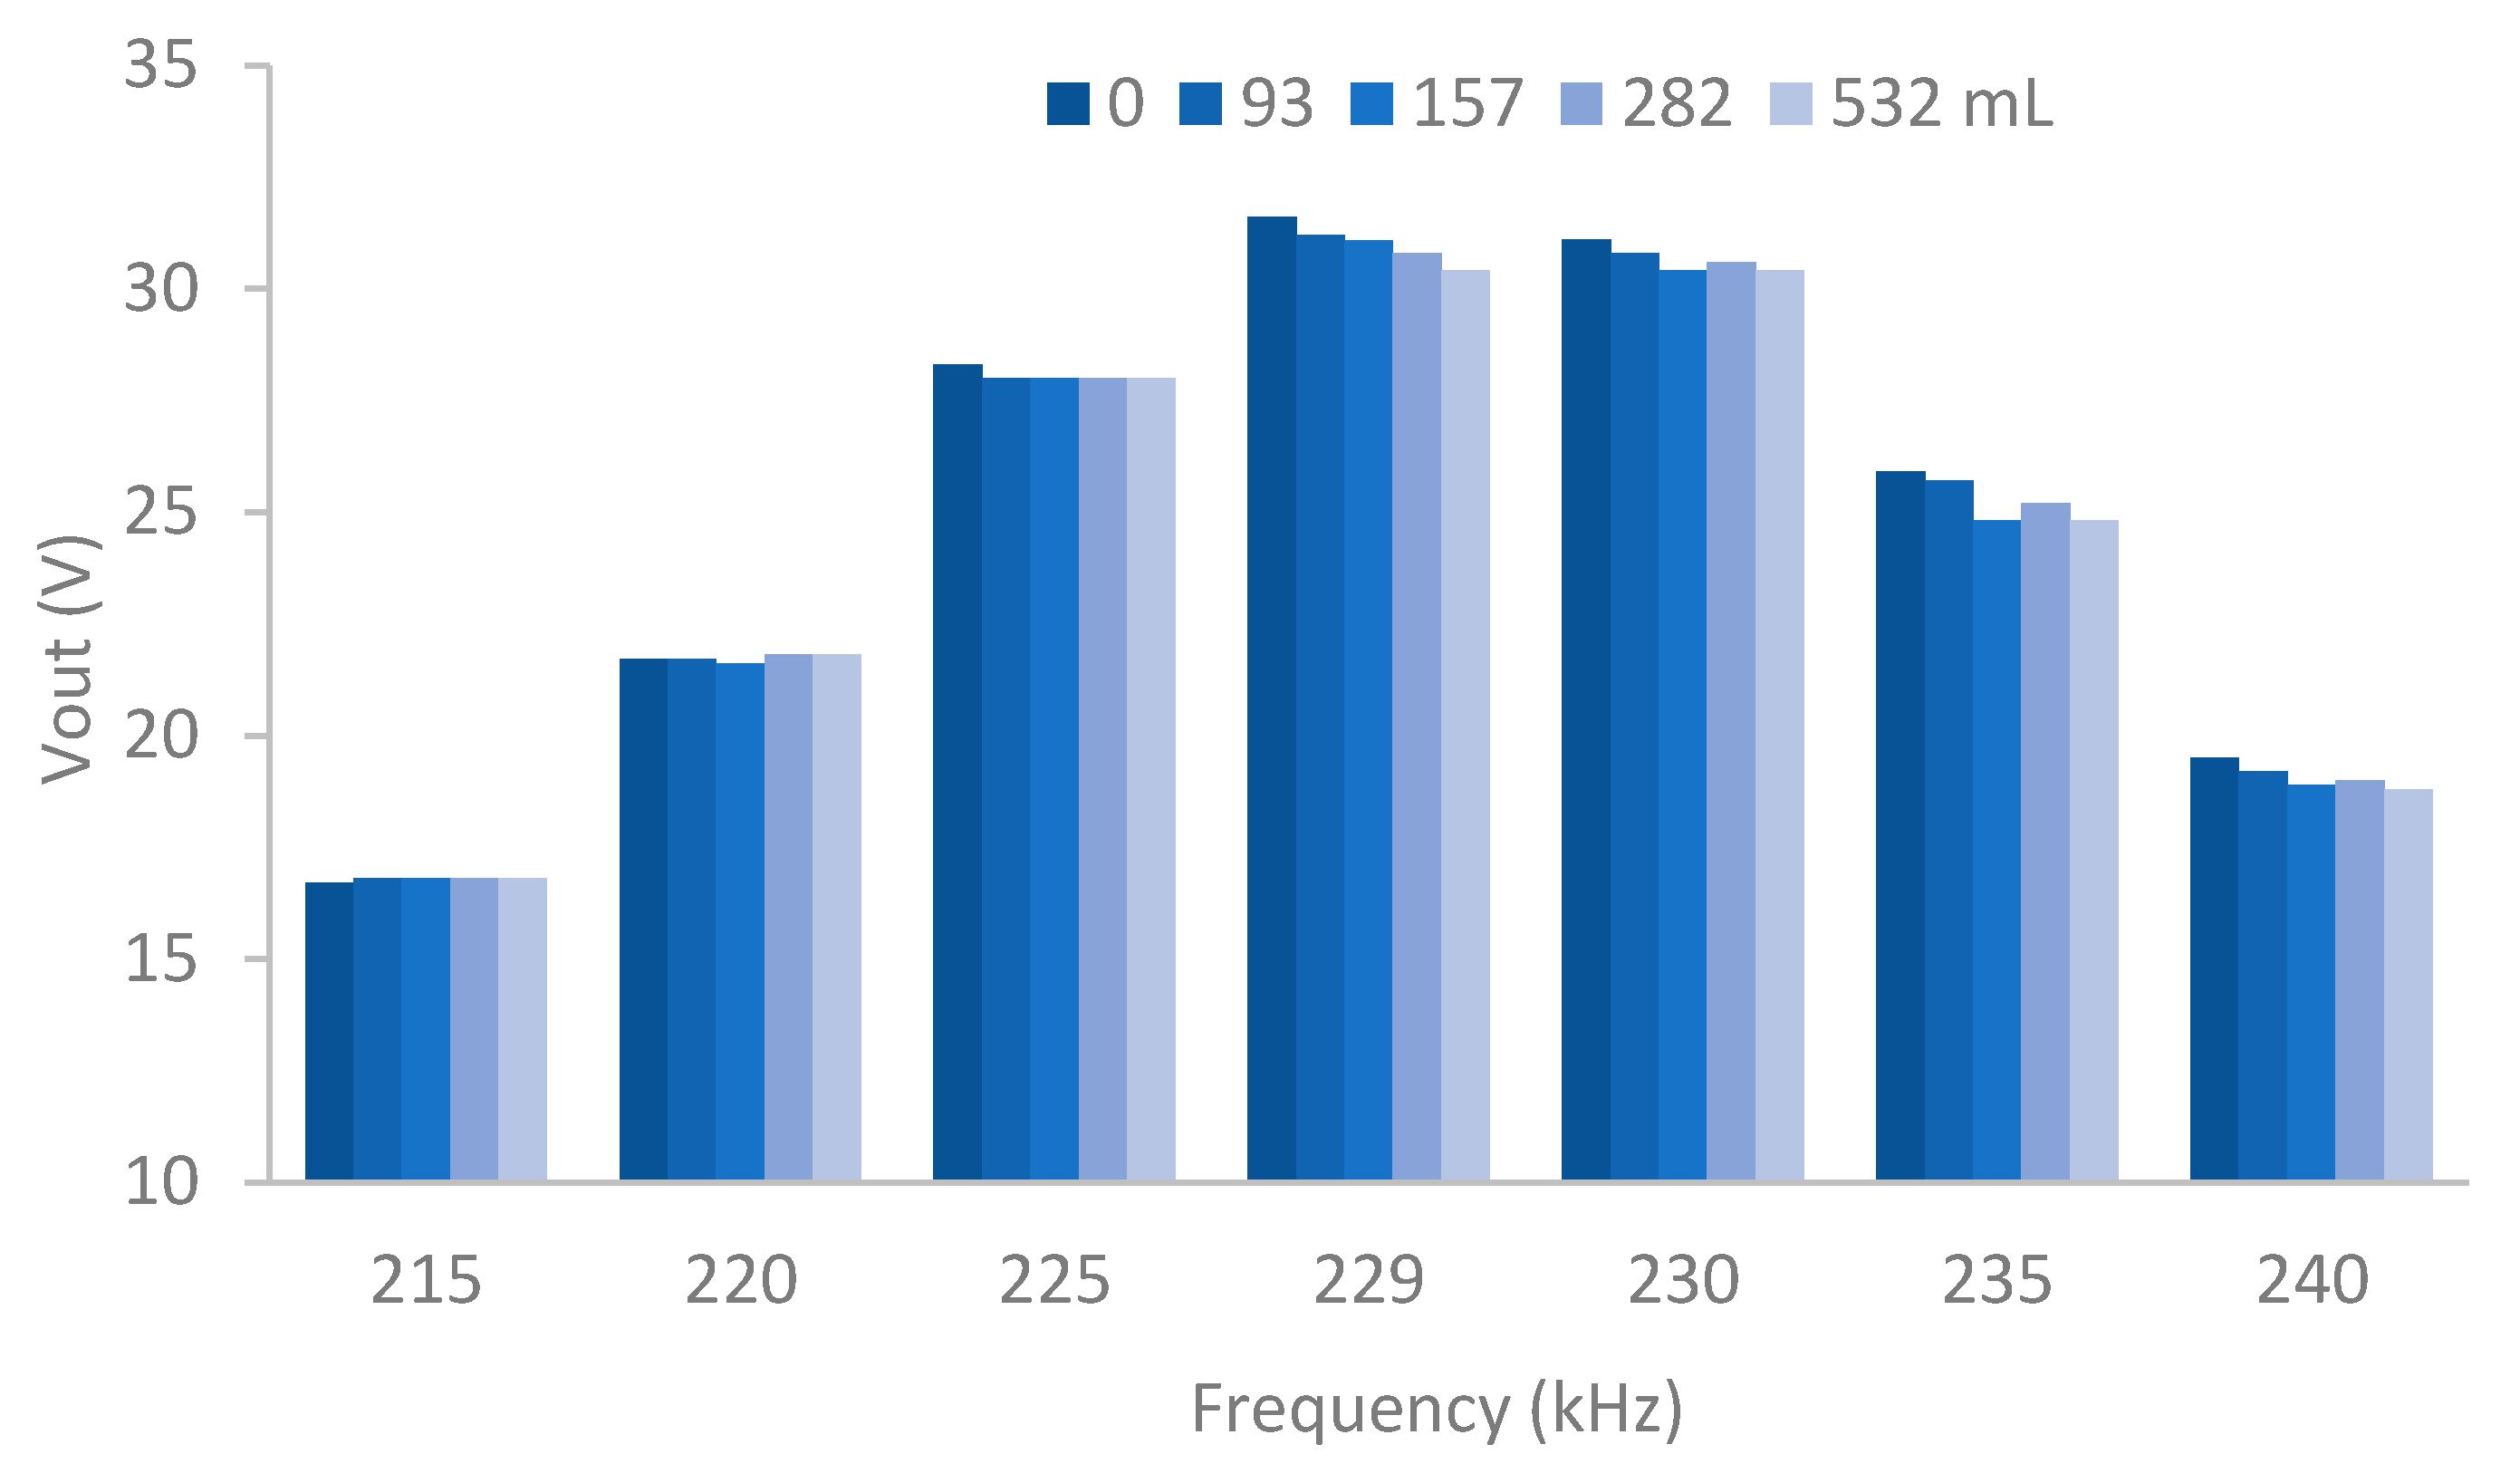
Next, the measurement protocols for each set of tests are described. For the initial tests, two experiments were conducted. In the first test, we used all the prototypes described in
Table 1, focusing on a narrow range of useful frequencies which present big differences between the Vout of different moisture values. The peak frequency (where the highest Vout is measured) and the ones close to it. We compromise to a low number of samples to test the 15 prototypes. Using five samples allowed us to test all 15 of them with a degree of certainty. After finishing the first experiment corresponding to the initial tests, the best prototypes were selected. The criteria used were the requirements stated in
Section 2. The selected prototypes were used to perform the second experiment for the initial tests.
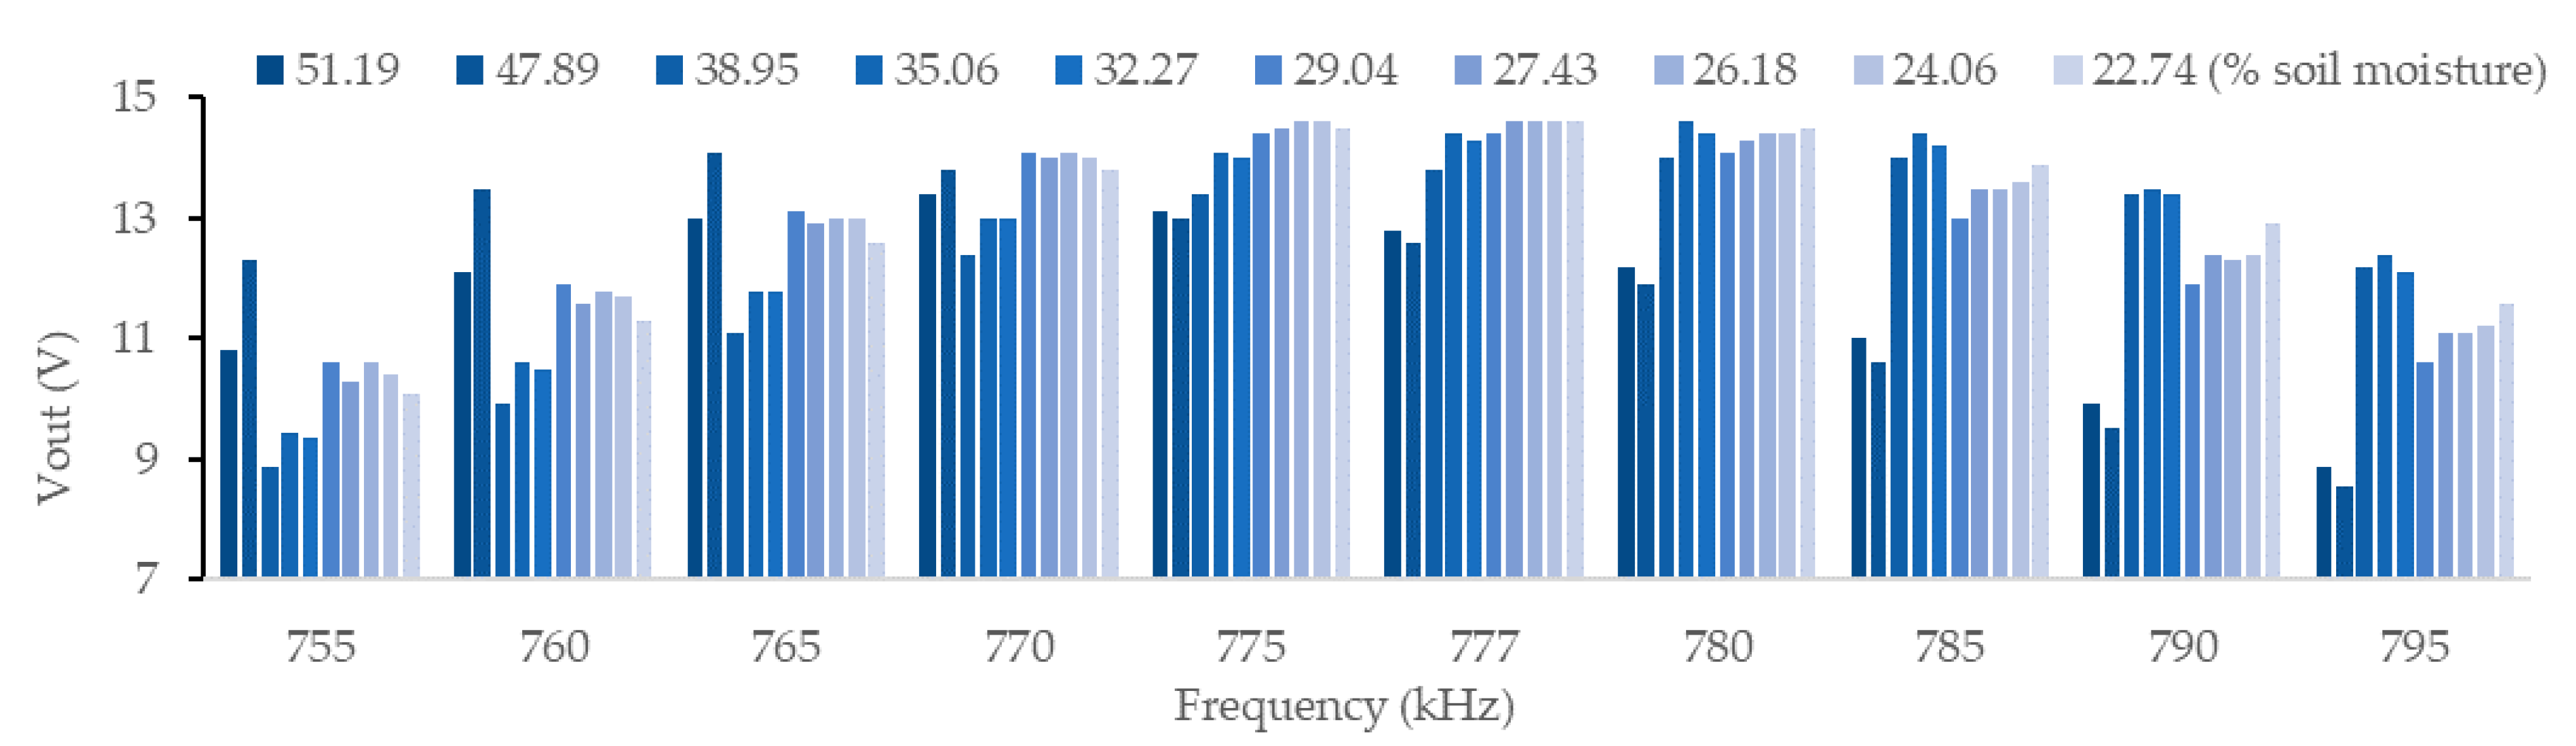
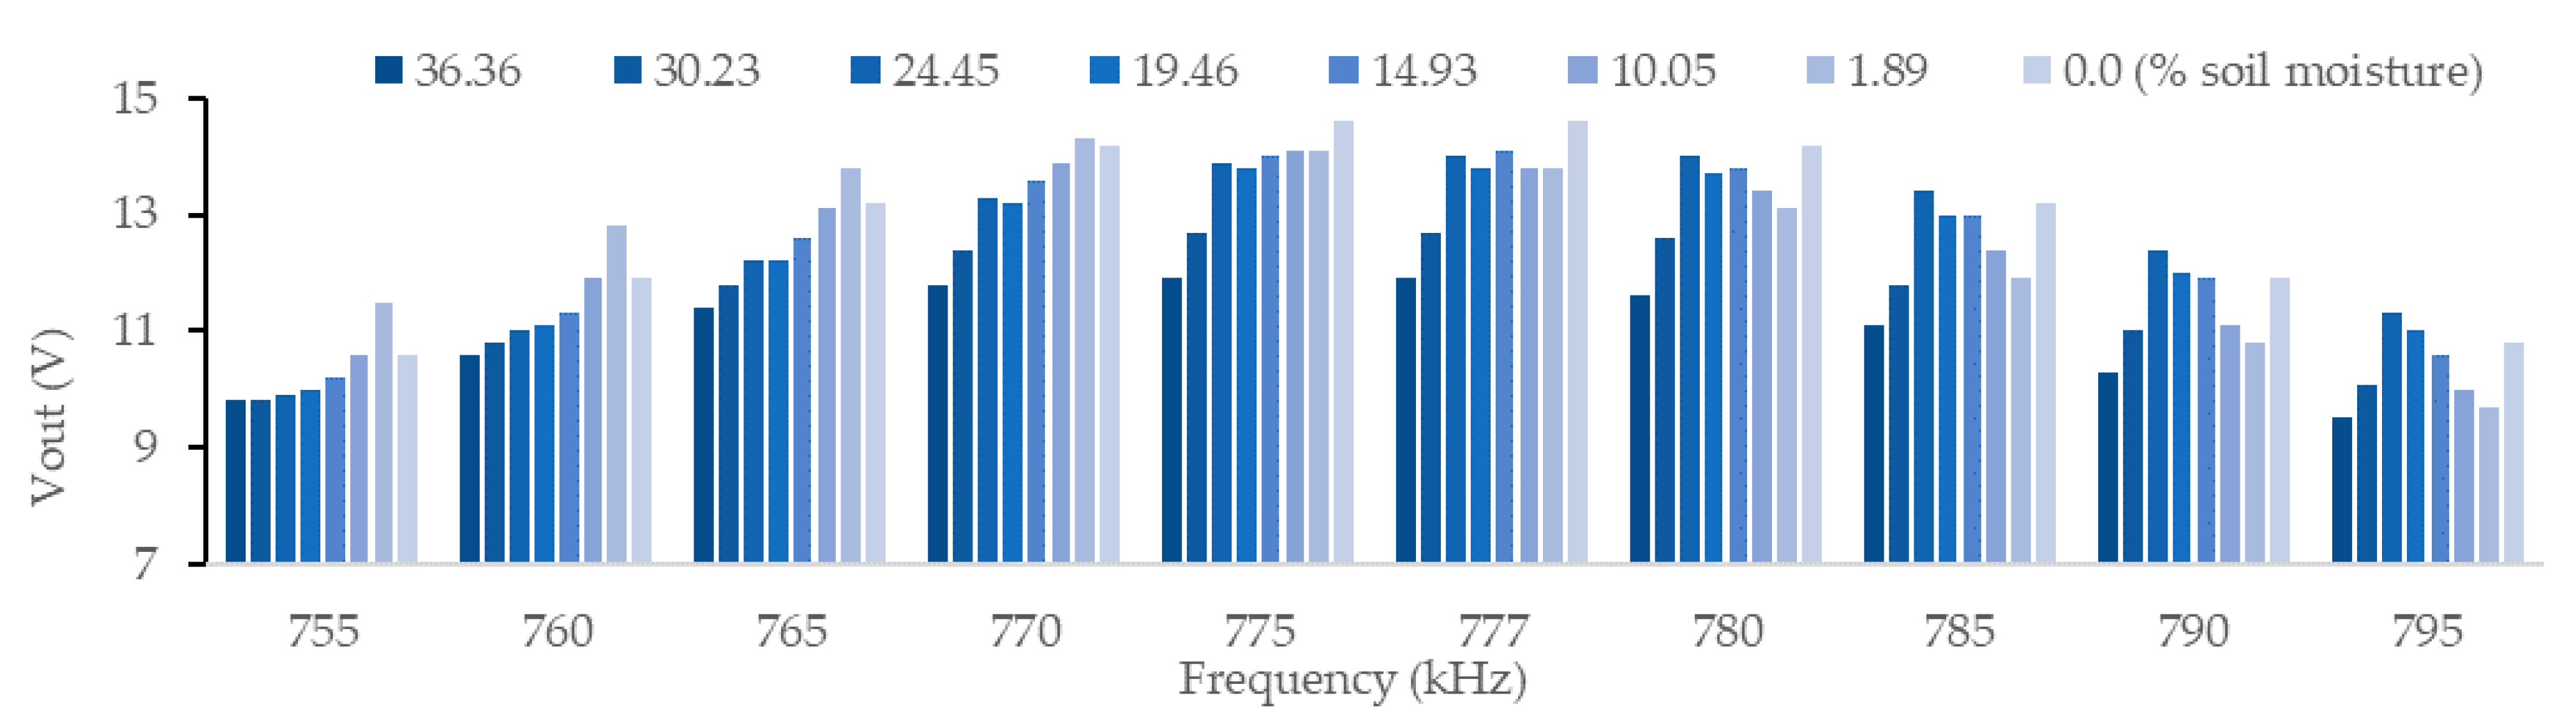
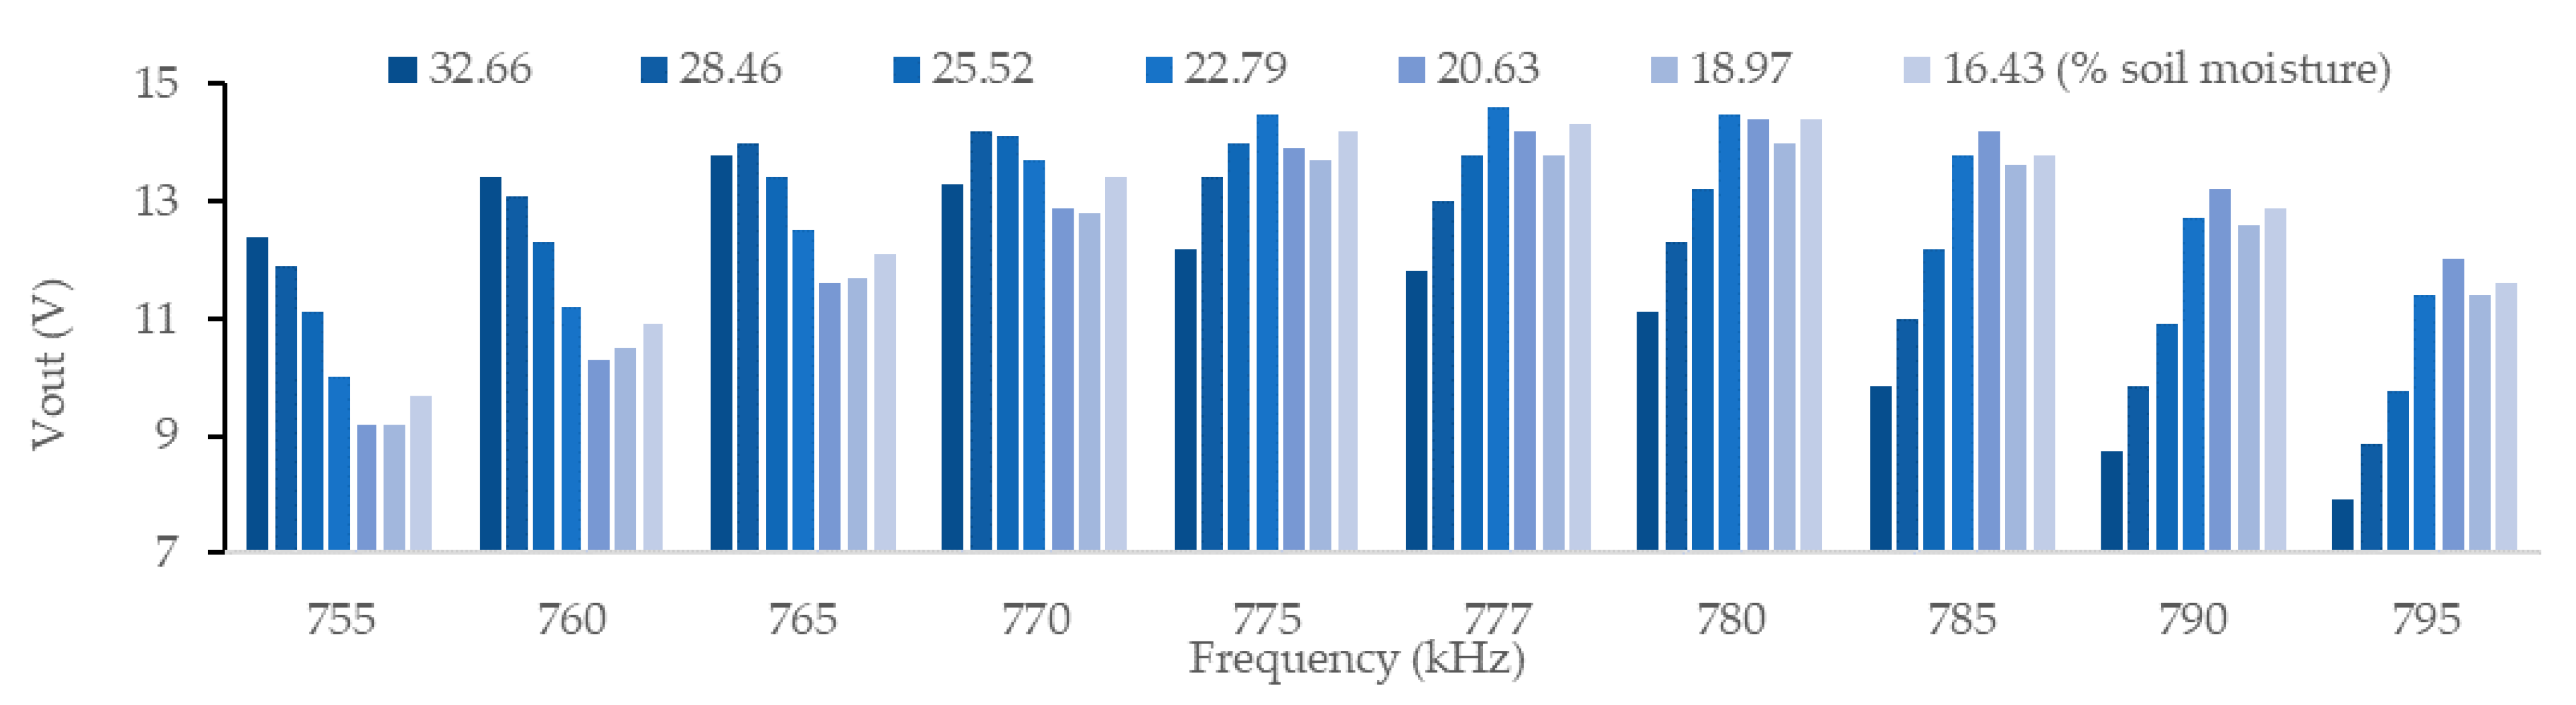
Once the best prototypes were defined, further tests were performed. These tests were conducted to test the performance of our sensors when kept on the soil all the time. The prototypes described in
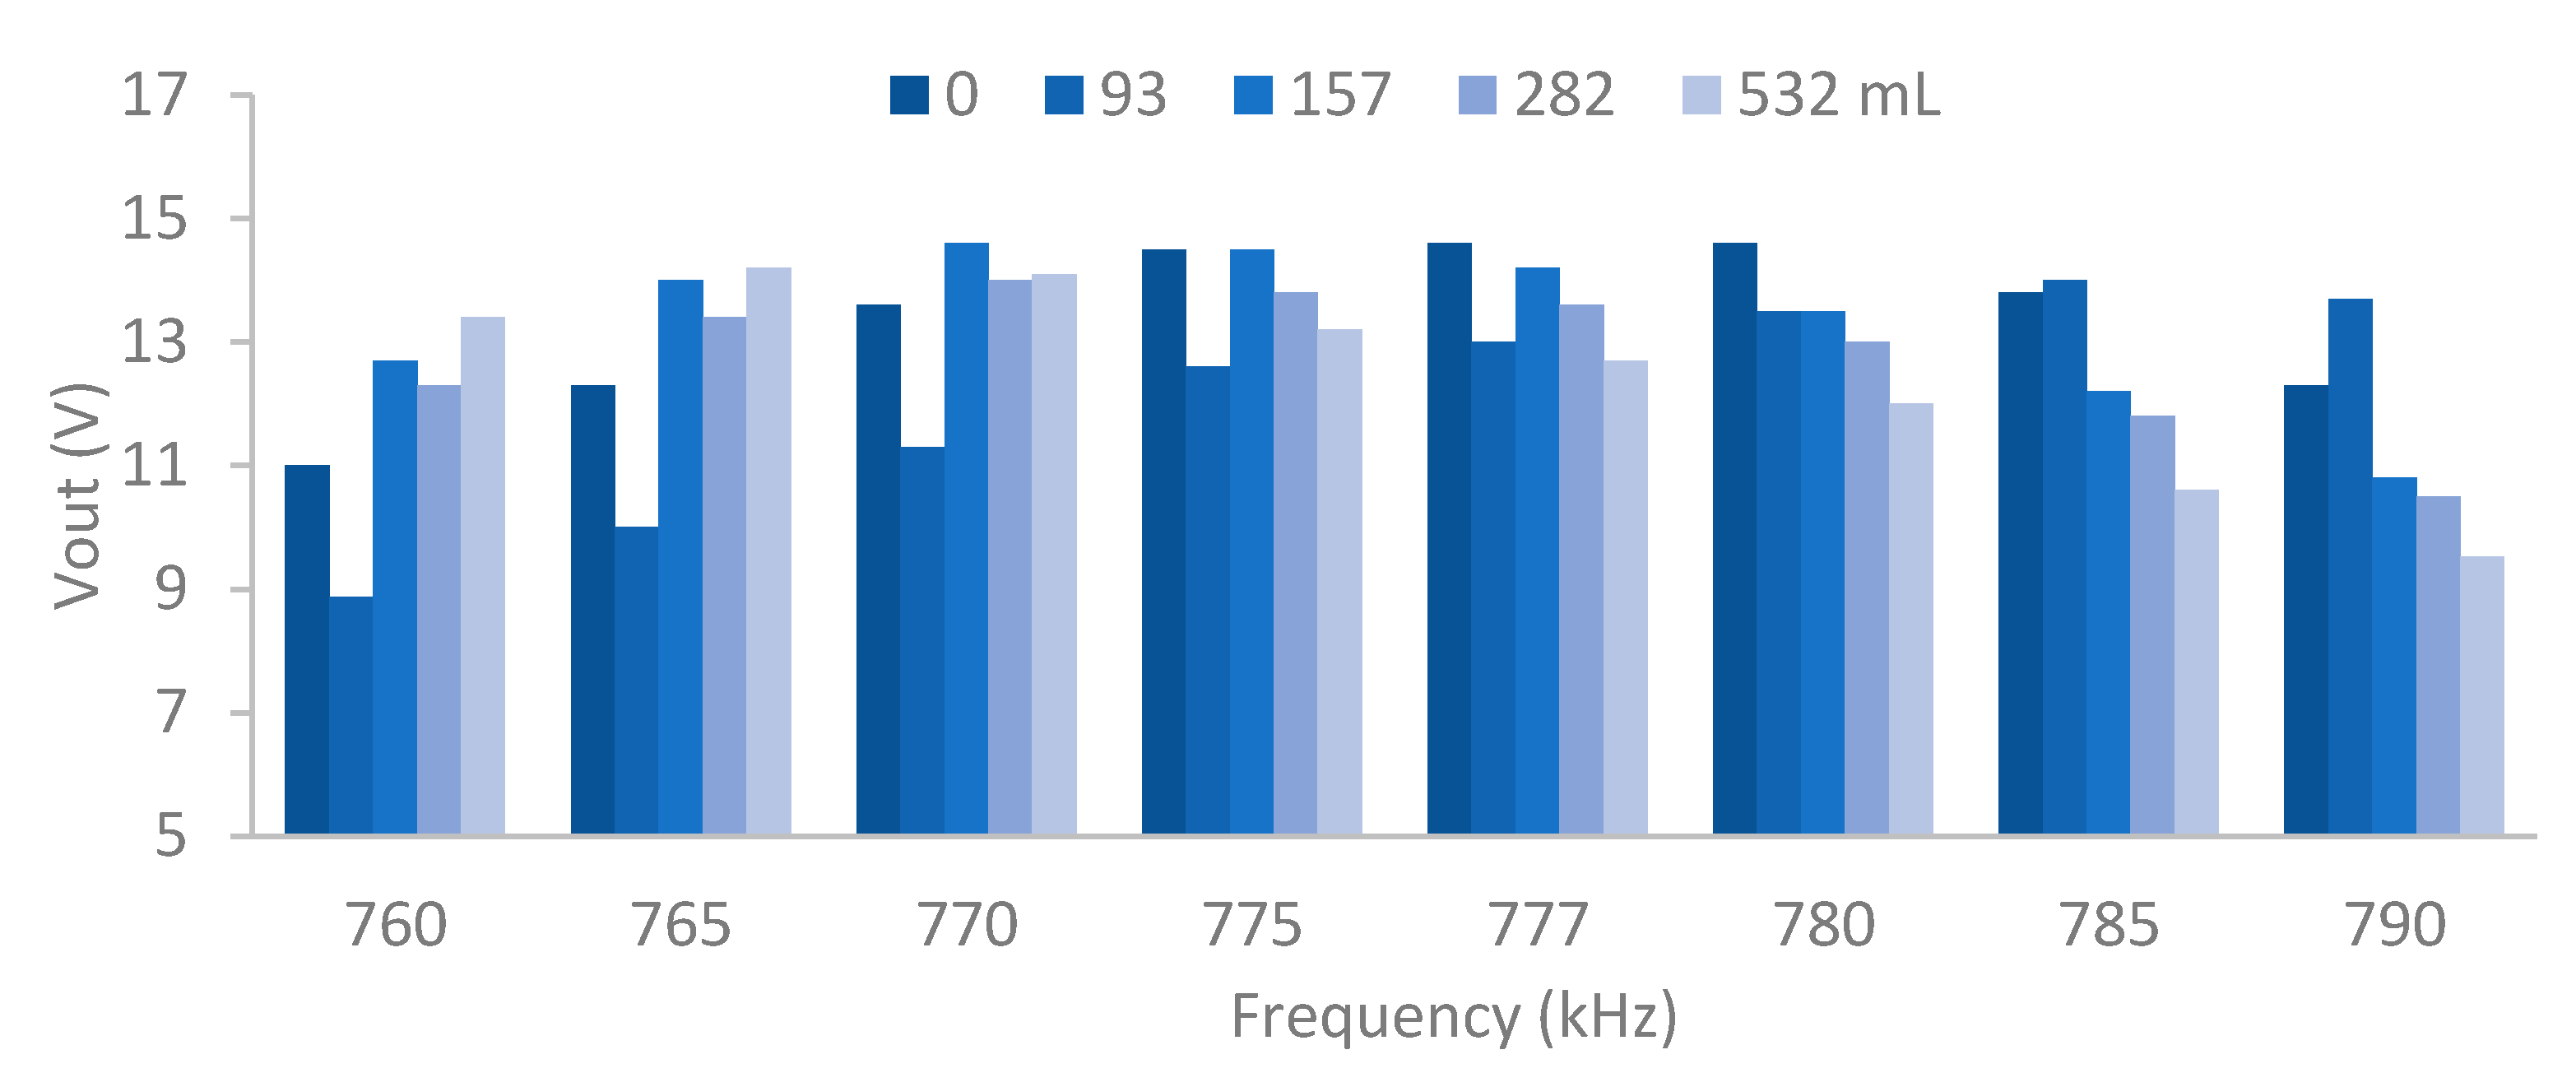
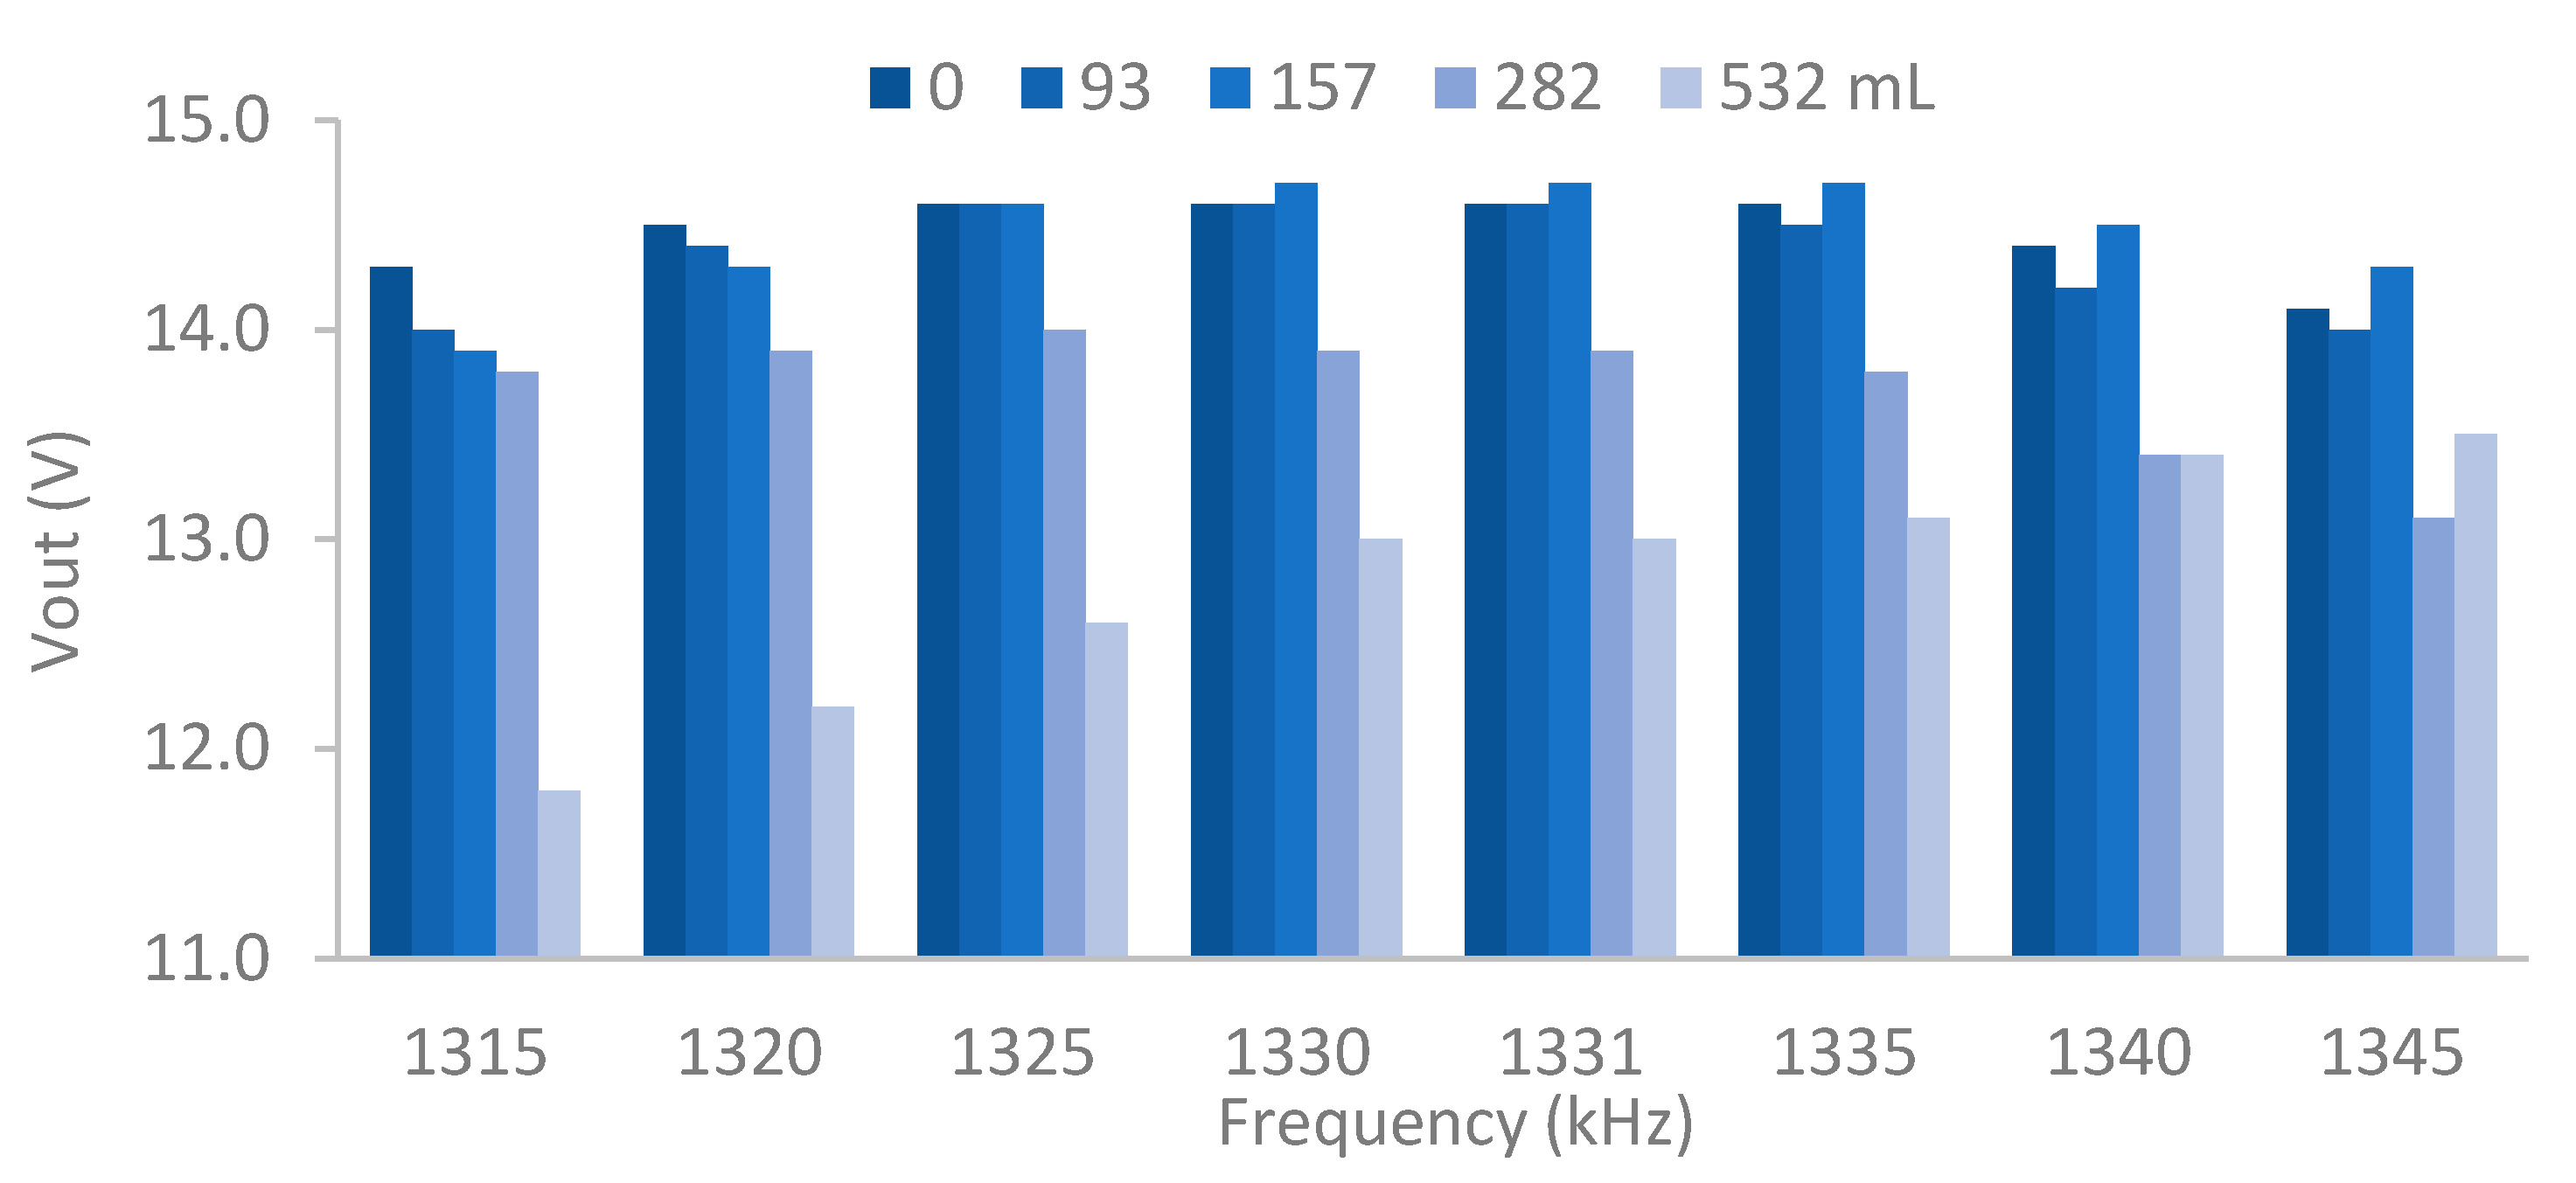
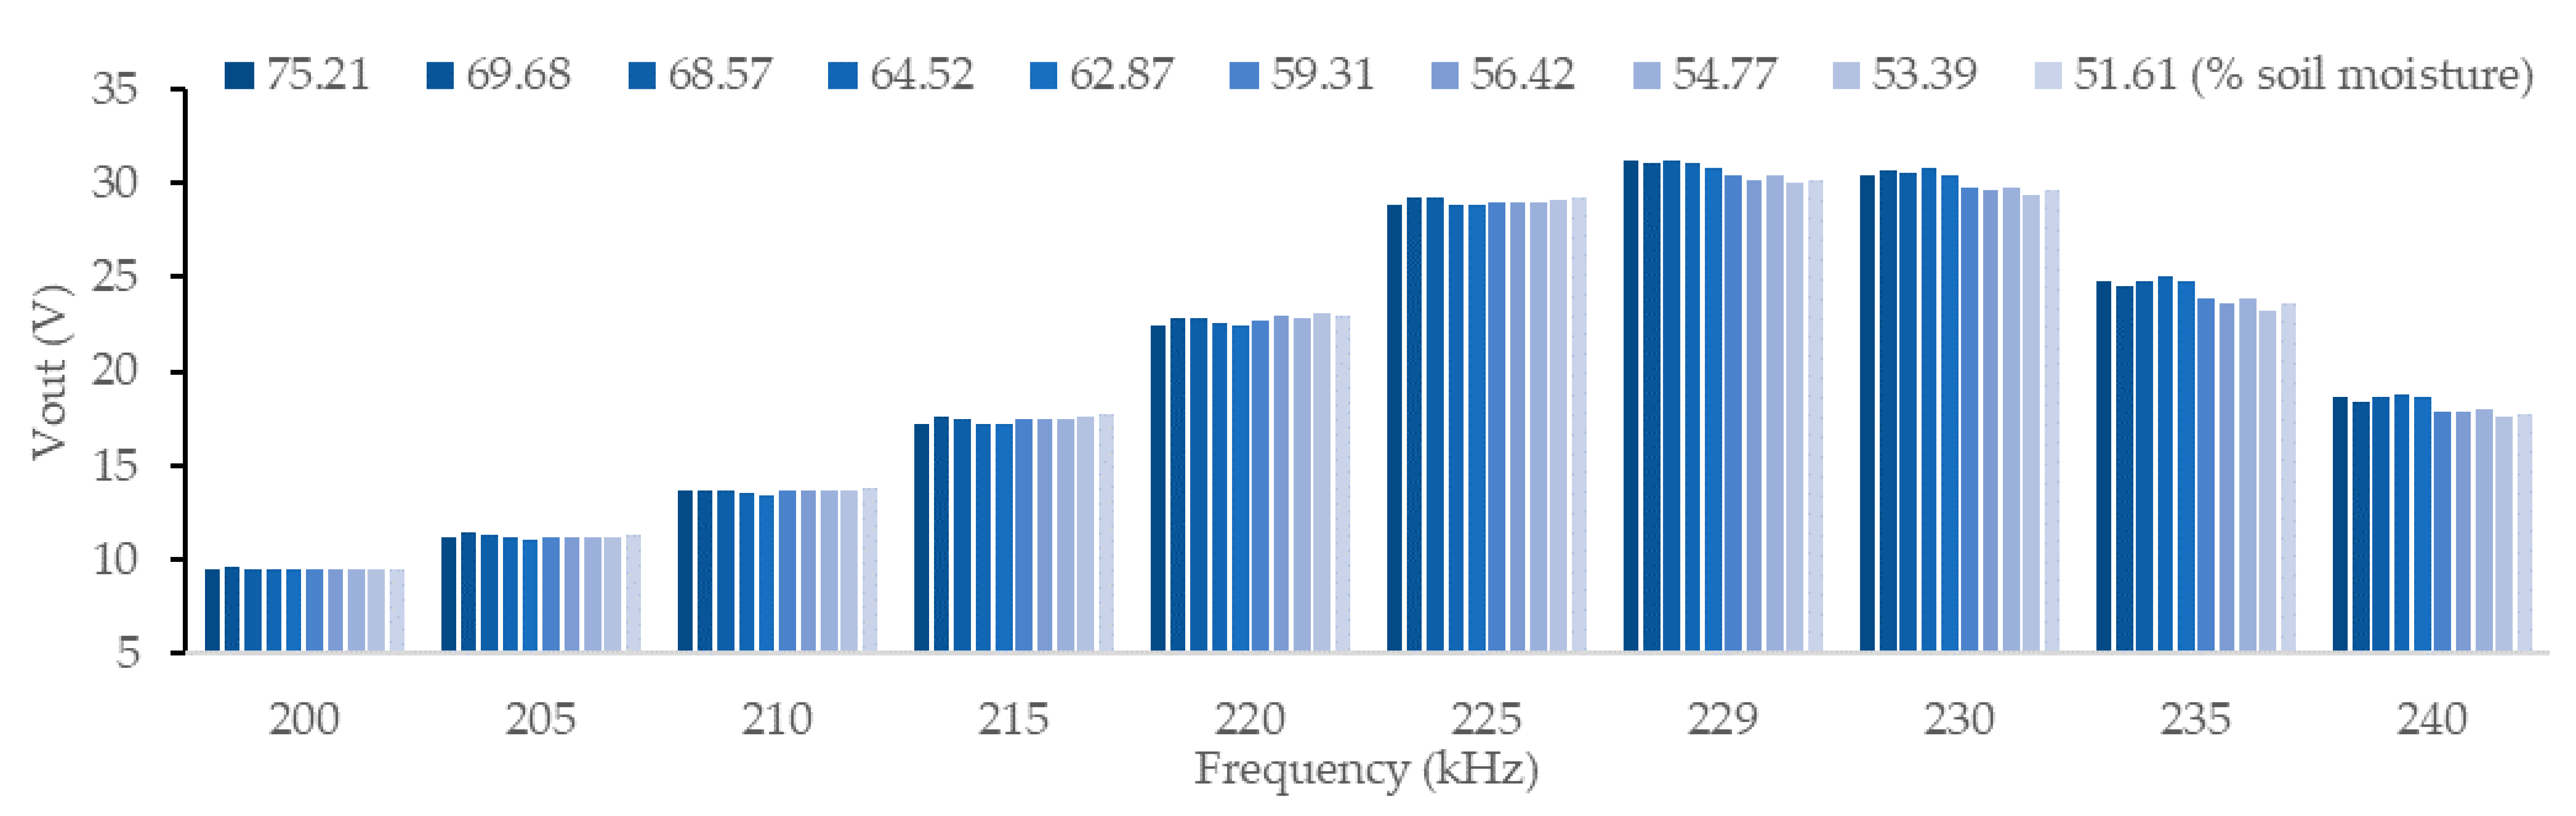
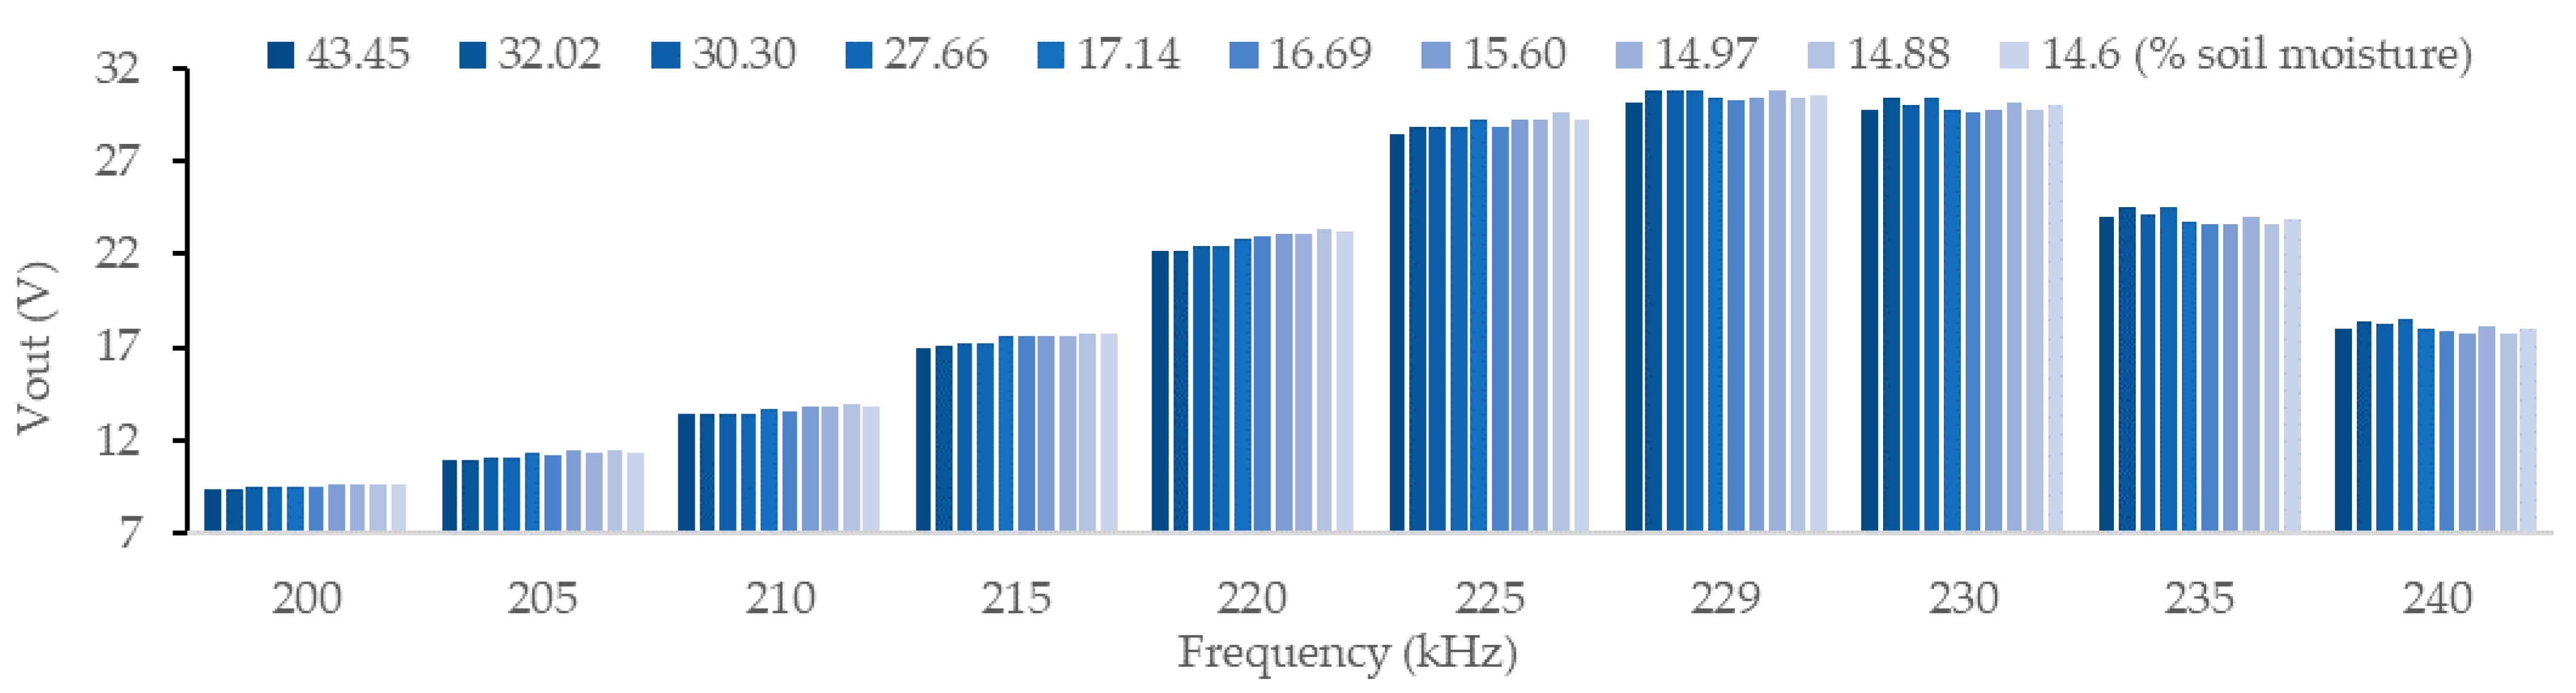
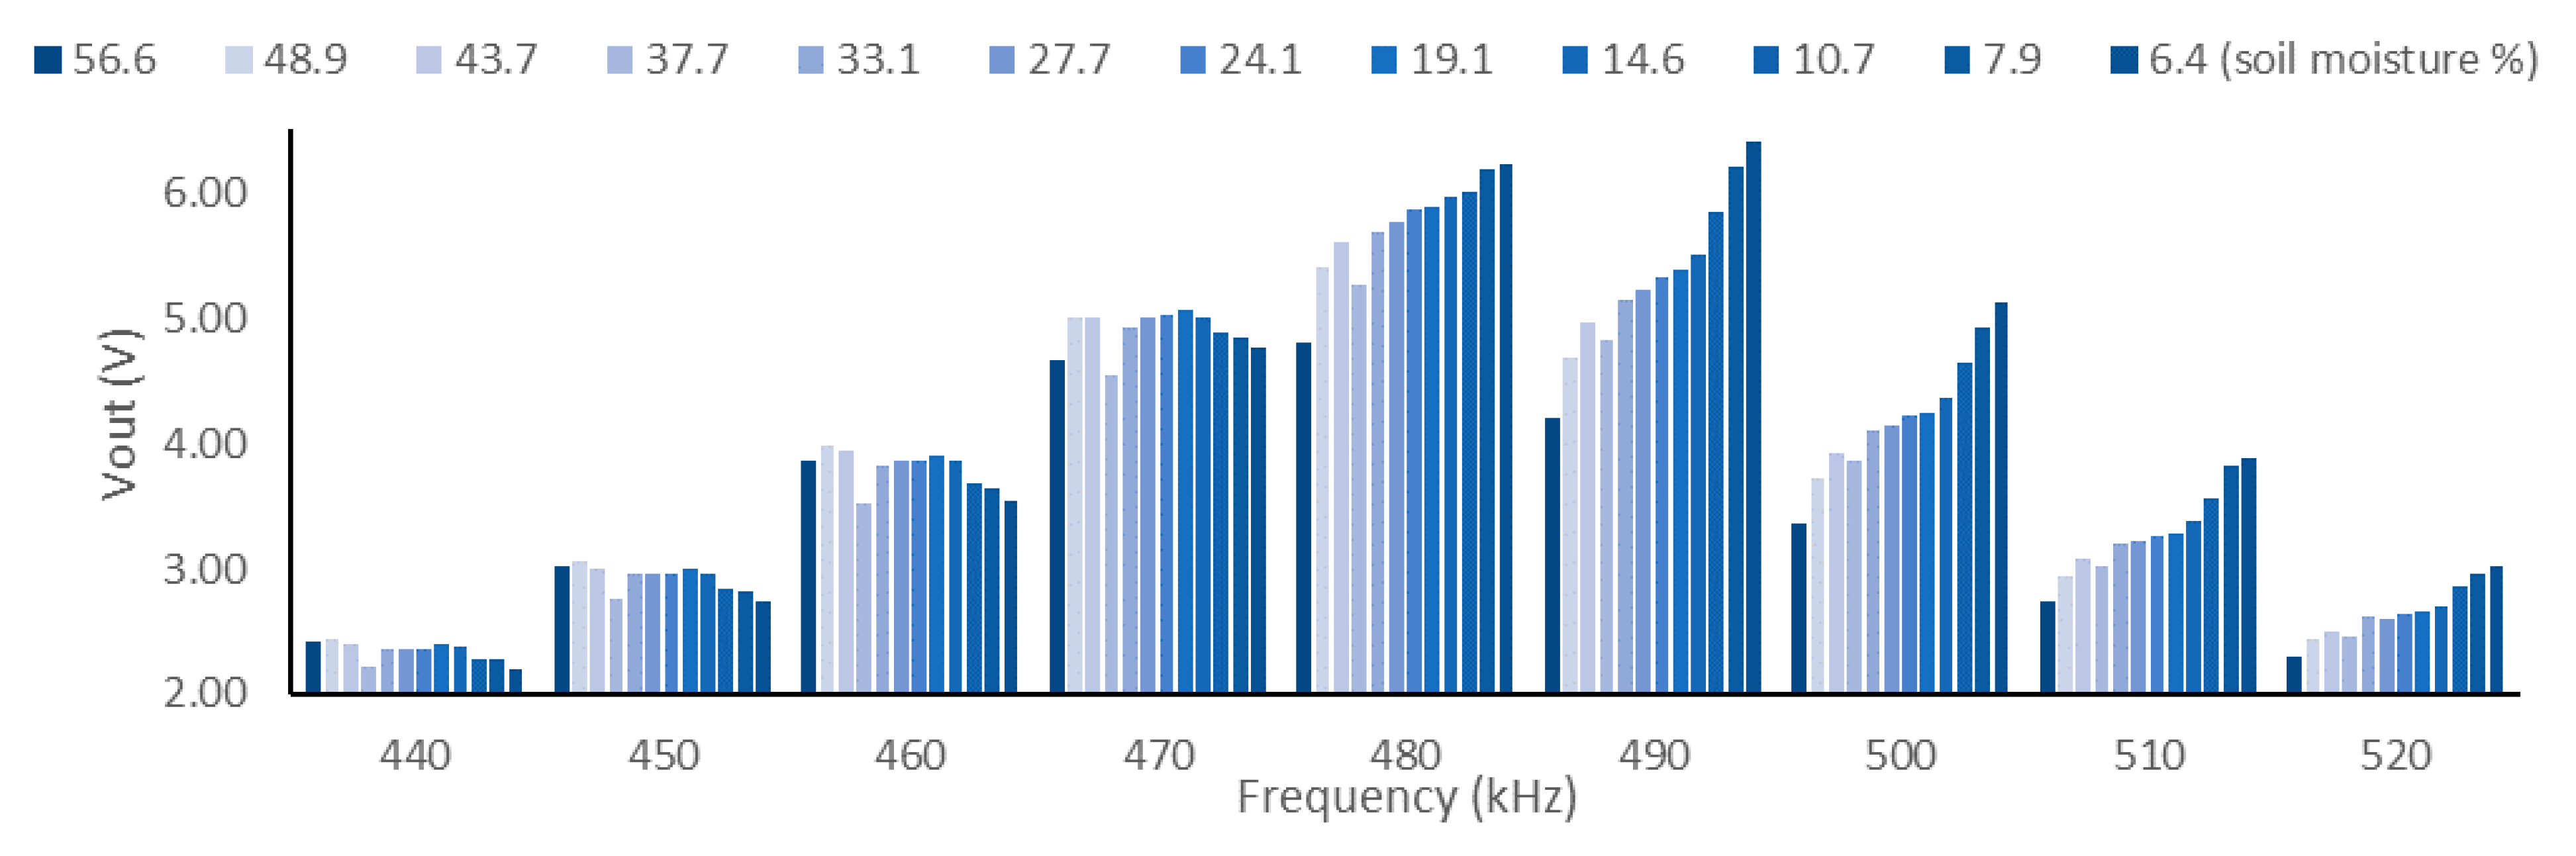
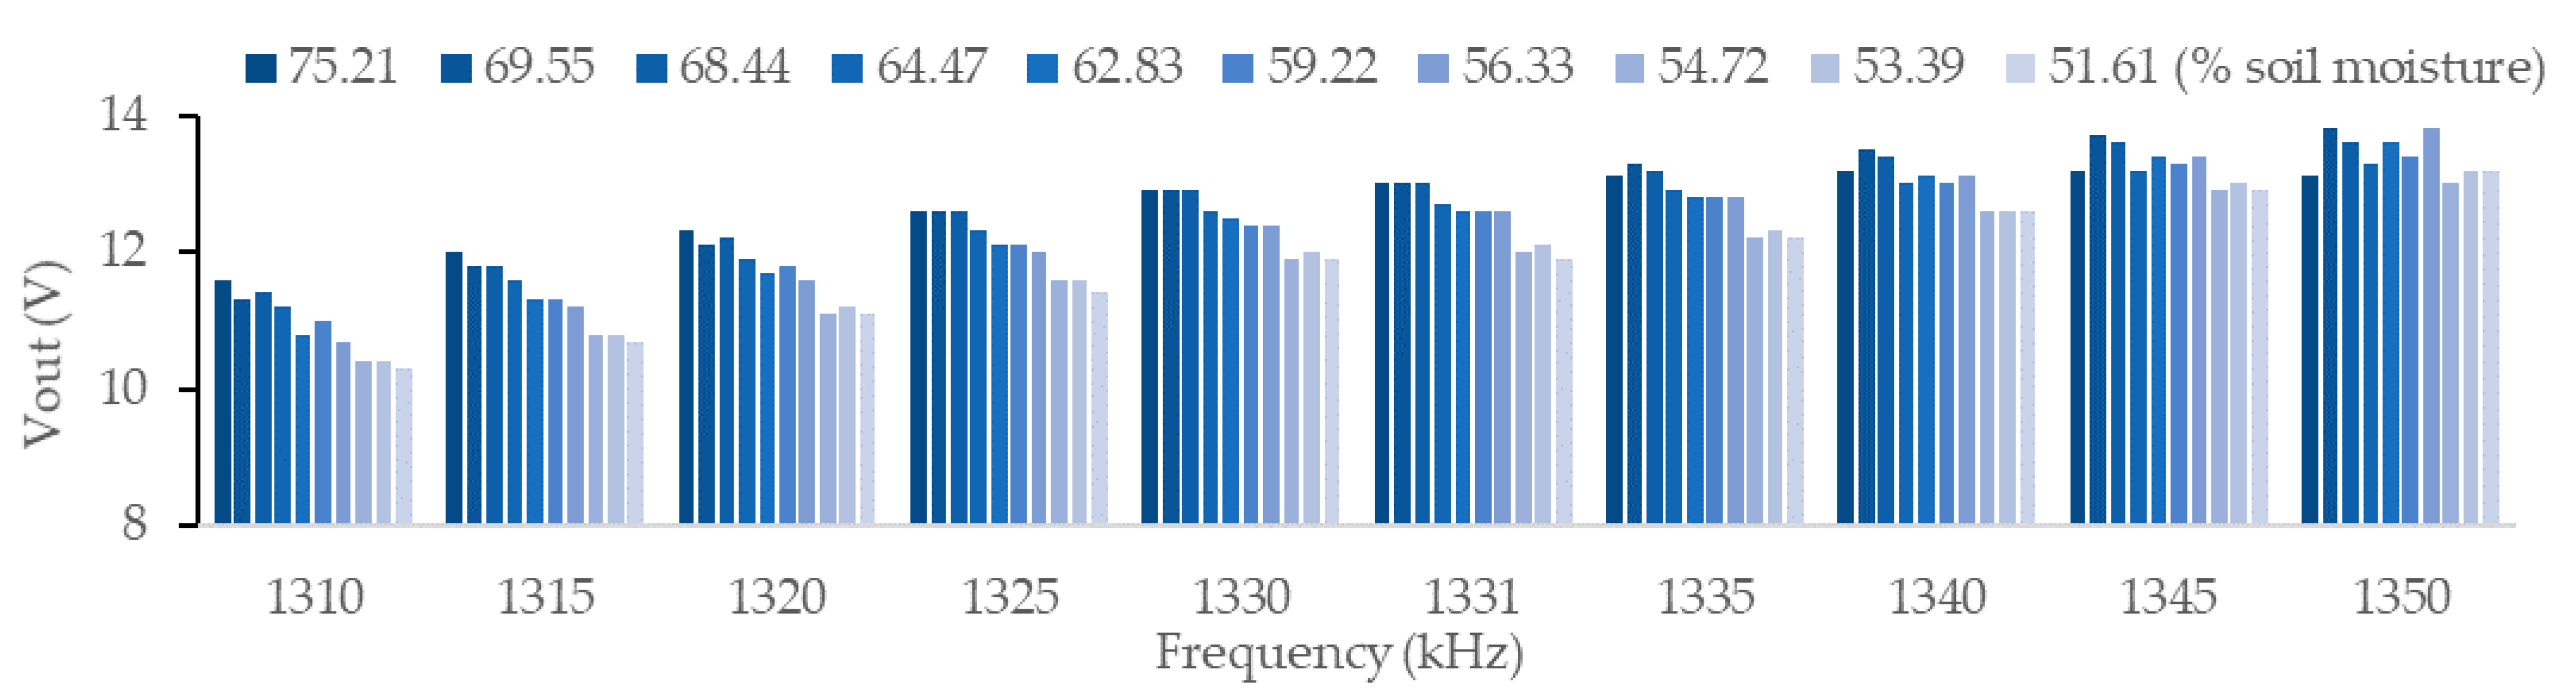
Table 2 were used for this experiment. The frequencies used for this set of tests were those close to the peak. The peak frequencies are determined in the different samples when the soil has the maximum moisture tested. In these conditions, we search the peak frequency in the range of 0 to 1 MHz. Once the peak frequency is found, we measure at the frequencies of ±10, 20, 30, and 40 kHz of peak frequency. This range was chosen because it represents the frequencies where the sensor shows a higher sensitivity to changes in the environment and displays a higher output voltage. These experiences allowed us to check the effectiveness of the sensors for a different soil type.
While for the first set of tests, the sensors are inserted and extracted from each pot every time the soil moisture is measured, for the second set of tests, the sensors were left inside the pots throughout the entire experiment. This modification in the measurement methodology was conducted to evaluate if the continuous introduction of the sensor might cause an alteration in the measurement by including interferences. Those interferences can be caused by the lack of homogeneity of the soil (different compaction, the apparition of preferential water channels, etc.) provoked by its continuous manipulation. Measurements were taken daily for as long as the tests were conducted. The objective of these experiments was to prove the usefulness of keeping the sensors buried, to minimize the errors from extracting and inserting them. Furthermore, since the soil was different, these experiments wanted to test the efficiency of the prototypes for a crop during harvest.
3.4. Soil Samples
In this subsection, we describe the soil samples used in the first and second set of tests and their variability in soil moisture along the experiments. The different soils were obtained during summer in the La Safor region (Valencia, Spain). The soils are a representation of typical farmer soils of this region. Considering that collected cannot be classified as unaltered samples since they are sifted and water was added to the soil, the specific ambient conditions in which the samples are collected are not relevant. The soil screening was carried out to avoid creating preferential water channels that could affect the measurements and homogenize the samples.
3.4.1. First Set of Tests: Selection of the Best Prototype/s
For the soil samples used in the initial tests, plastic pots shaped like a conical trunk were employed. Their dimensions were 18.9 cm in height, 16 cm of minor radius, and 20.5 cm of major radius. The pots were filled with soil and a variable volume of water for the experiments. Depending on the experiment, we used up to five types of soil.
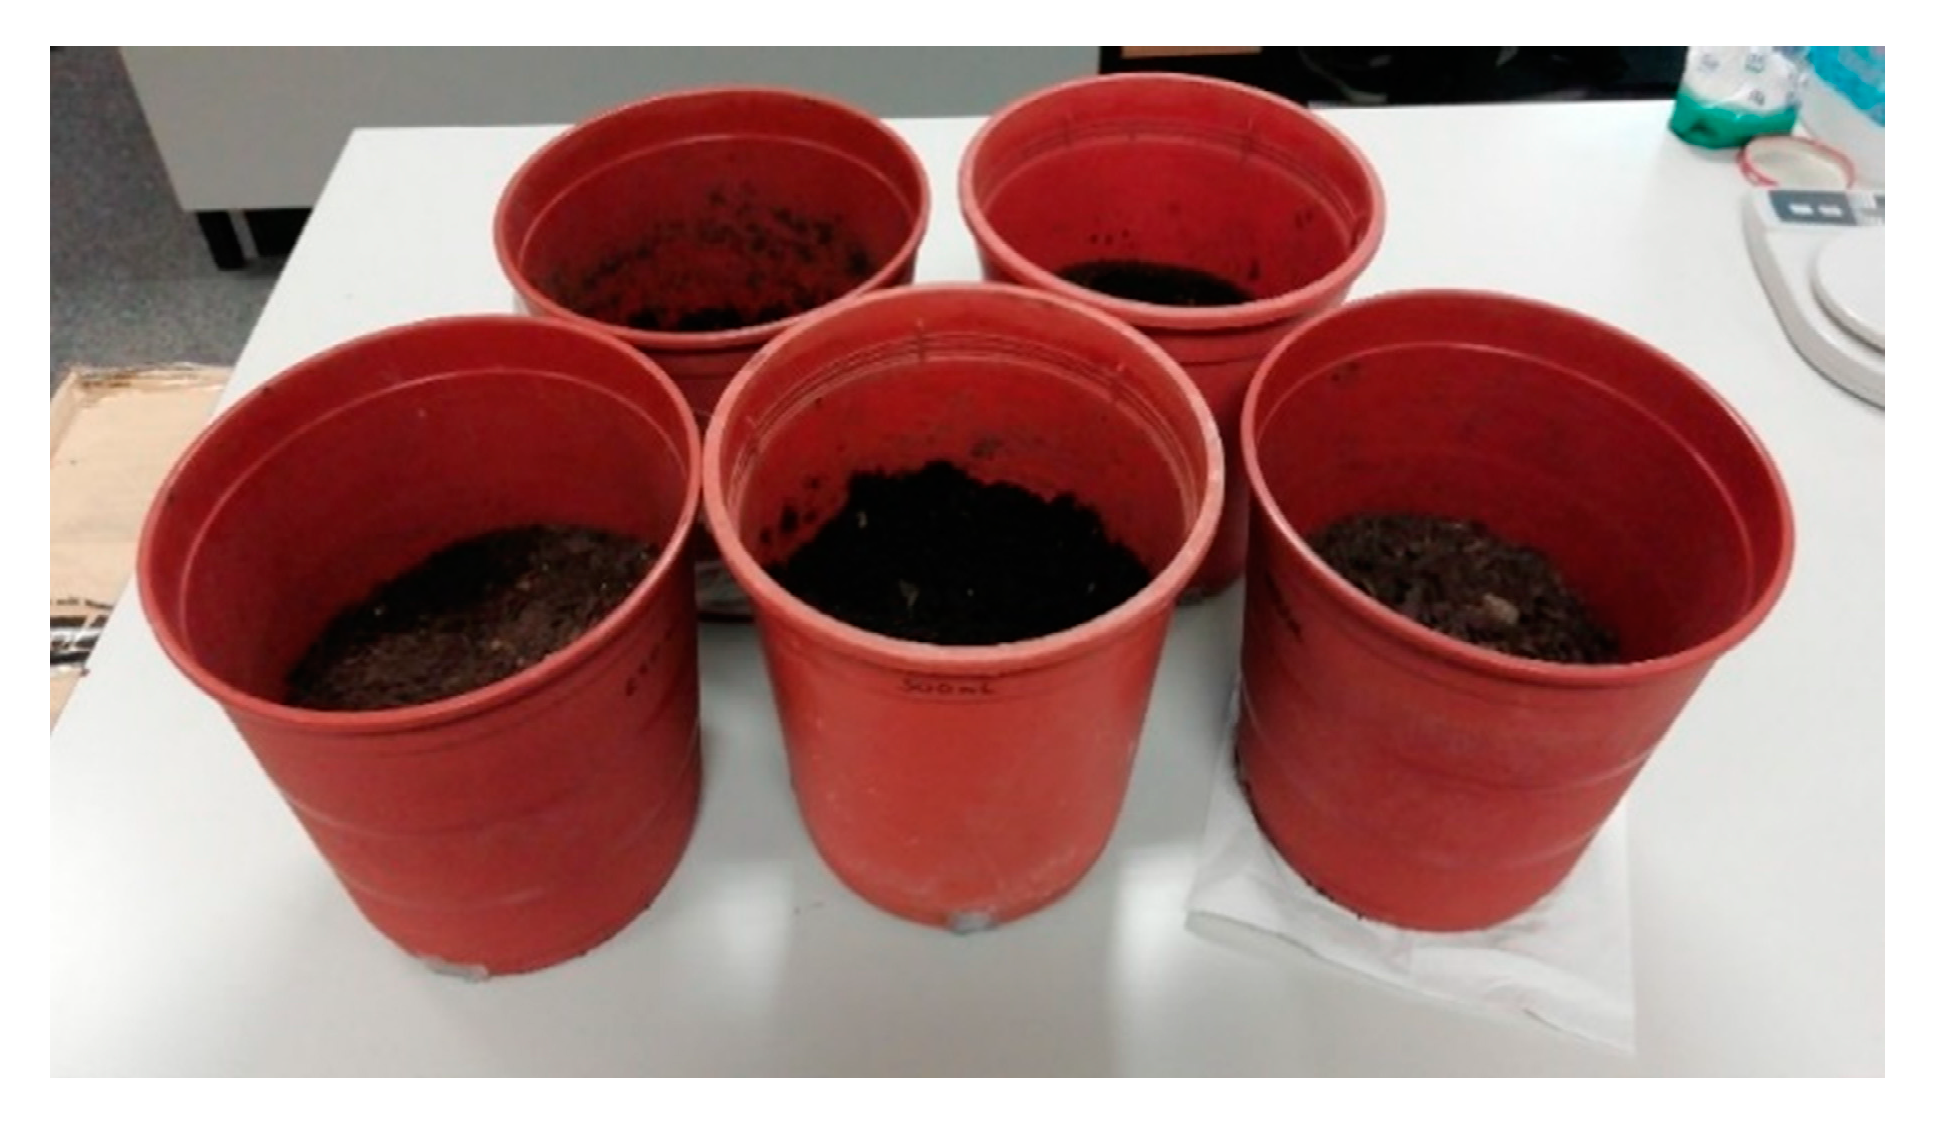
The used sample for the first experiment was a commercial soil composed of peat and manure, used mostly for gardening, with high sand content. Therefore, the soil moisture levels tested were close to the FC and WP presented by sandy soils—20% and 7%, respectively. Furthermore, the soil used for this experiment came from the same lot to prevent other factors from affecting the results. We started with dry soil, with 0% soil moisture, and water was added to create the samples, homogenizing them to guarantee soil uniformity; each sample contained 3 kg of soil. The five samples of soil presented volumetric water contents from 0% to 27% (M1 to M5); see
Table 3. A picture of the samples used in this experiment can be observed in
Figure 4. In addition,
Figure 5 presents the assembly for the tests where we can see the scheme of the experiment, with the oscilloscope, the pot, the generator, and the wires.
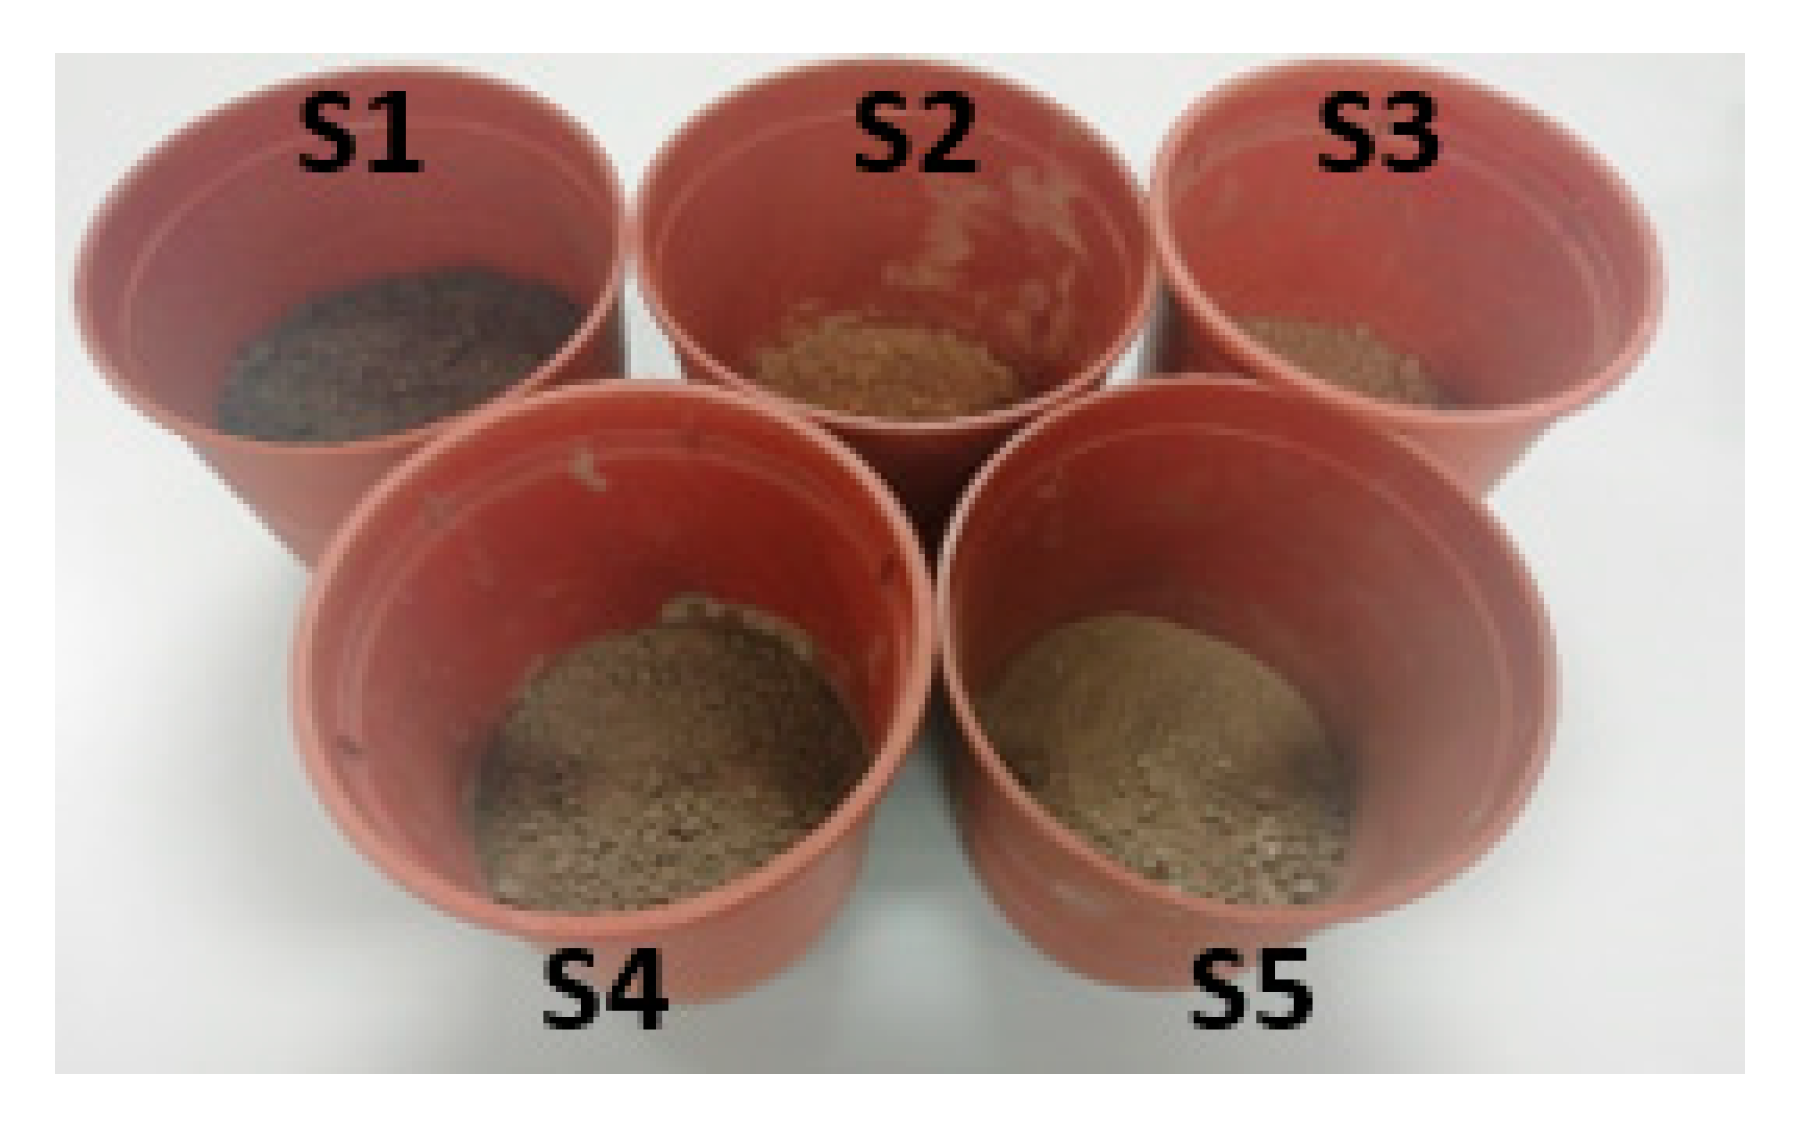
Samples from 5 different types of soil (S1 to S5) were used in the second part of the first set of experiments. The first type of soil, S1, was the one used for the previous test. S2 was obtained from a former citrus crop. S3 was gathered from calcareous soil in a mountain. Finally, two crops near the coastline provided the soil for S4 and S5. All the samples were taken from the region of Valencia, Spain. In order to prepare the samples, the following protocol was used. First, with a shovel and a recipient to put the soil in, the samples were collected. It was important to avoid rocks and plants to ease the process after the collection. Next, the clods and clumps of soil were crushed with the help of a tray and a rolling pin. In this step, all the rocks, plants, and possible invertebrates present on the soil were manually removed. Afterwards, using a 2 mm aperture sieve, the soil was filtered until we had a kilo and a half of the sample. The pots used for this test have the same characteristics as the ones used for the first one. The pots with the different soil types can be seen in
Figure 6. To estimate the volume of soil in each pot, the major radius at the top of the soil and its height were measured. Moreover, the minor radius was measured.
The soil moisturizing process for this assay was more precise than for the previous experiment. Since the objective of this test was to find the best prototype/s, it needed to be more accurate. The first step was to seal the bottom of the pot with filter paper, making water able to infiltrate the pot, so soil cannot fall out. The result was weighed, and afterwards, 500 g of soil was added. The pots, alongside the filter paper and soil, were submerged in water up to one cm under the soil level. When the top of the soil started looking wet, 500 more grams were added, and the pot was further submerged. The process was repeated a third time. This was carried out to fill with water all the gaps between soil particles and saturate it. The pots were left for 24 h at 25 °C to rid the excess water.
With weight measures, the mass of water can be obtained, and water volume is easily related to its weight. We used 1.5 kg of each soil. Nevertheless, the parameter needed to calculate the real soil weight is the original soil moisture. To calculate the weight of the dry soil, five samples of around 20–25 mg were prepared, one for each type of soil. They were weighed and then dried at 105 °C. This was performed to evaporate all water present in the samples. Then, the dry sample was weighed to calculate the % of dry soil using:
3.4.2. Second Set of Tests: Enhancement of the Pre-Selected Prototypes
A sole type of soil was used. Nevertheless, it was different from the previous types, and four repetitions were used (C1 to C4). The soil was a sandy type extracted from an orchard field.
The pots used for these tests were smaller, with a maximum radius of 6.65 cm. A total of 1 kg of each soil was inserted in each pot. A sample was taken from the original soil and dried in order to obtain the moisture percentage to calculate the dry soil. In
Figure 7, the pots of soils C1, C2, C3, and C4 are depicted. Regarding the procedure of soil moisturizing, we followed the aforementioned moisturizing process, which consists of adding small quantities of soil and letting water saturate all the gaps of soil.
3.4.3. Soil Samples Characterization
The soil characterization for both samples for the initial tests (S1–5) as well as for the enhancement of the pre-selected prototypes (C1–4) can be seen in this subsection. The soil weight characteristics, the original % of dry soil, and the derived weight values for the soil moisture estimation by weight are presented in
Table 4. The measures of the pots, as well as their volume, are presented in
Table 5. Furthermore, the results for the soil moisture measures are presented in
Table 6; this information will help understand the results. It presents the soil volume, the initial and final water volume, and their variation.
S1 to S3 could be measured for the duration of the experiment, a total of 10 days. Meanwhile, S4 and S5 could only be tested for eight and seven days each. This is because S4 was completely dried on the seventh day, and the last three measures for S5 gave the same reading, 16.23%. Due to the high organic matter content, S1 retained more water than the other samples, which preclude reaching the WP during the tests. The lowest soil moisture percentage measured on this soil was 51.61%. On the contrary, both S2 and S4 were tested from FC to WP. S2, composed of 60% sand and 30% of silt, have its WP of around 15% soil moisture. In S4, being sandy soil, the FC should be at around 24% and the WP at around 7%. Considering that both these limits have been surpassed, we can conclude that the analysis encompassed both points. S3 and S5 are in a similar condition to S1. The final soil moisture is higher than the WP, although in the case of S5, we could assume it is the WP due to the water being strongly retained in the soil.
The behavior of C1–4 is similar since they come from the same lot. All of them started at around 55–65% soil moisture and ended close to 6–9%. The target range was studied because sandy soils have their FC at around 24% and their WP at around 7% [
5].


 ,
, 


