Article

Performance Analysis of MAU-9 Electronic-Nose MOS Sensor Array Components and ANN Classification Methods for Discrimination of Herb and Fruit Essential Oils

1
Department of Biosystems Engineering, University of Mohaghegh Ardabili, Ardabil 56199-11367, Iran
2
Pathology Department, Southern Hardwoods Laboratory, Center for Forest Genetics & Ecosystems Biology, Southern Research Station, USDA Forest Service, 432 Stoneville Road, Stoneville, MS 38776-0227, USA
3
Institute of Agrophysics, Polish Academy of Sciences, Doświadczalna 4, 20-290 Lublin, Poland
4
Faculty of Production and Power Engineering, University of Agriculture in Kraków, Balicka 116B, 30-149 Kraków, Poland
*
Authors to whom correspondence should be addressed.
Chemosensors 2021, 9(9), 243; https://doi.org/10.3390/chemosensors9090243
Submission received: 17 July 2021 / Revised: 13 August 2021 / Accepted: 20 August 2021 / Published: 31 August 2021

Abstract

:
The recent development of MAU-9 electronic sensory methods, based on artificial olfaction detection of volatile emissions using an experimental metal oxide semiconductor (MOS)-type electronic-nose (e-nose) device, have provided novel means for the effective discovery of adulterated and counterfeit essential oil-based plant products sold in worldwide commercial markets. These new methods have the potential of facilitating enforcement of regulatory quality assurance (QA) for authentication of plant product genuineness and quality through rapid evaluation by volatile (aroma) emissions. The MAU-9 e-nose system was further evaluated using performance-analysis methods to determine ways for improving on overall system operation and effectiveness in discriminating and classifying volatile essential oils derived from fruit and herbal edible plants. Individual MOS-sensor components in the e-nose sensor array were performance tested for their effectiveness in contributing to discriminations of volatile organic compounds (VOCs) analyzed in headspace from purified essential oils using artificial neural network (ANN) classification. Two additional statistical data-analysis methods, including principal regression (PR) and partial least squares (PLS), were also compared. All statistical methods tested effectively classified essential oils with high accuracy. Aroma classification with PLS method using 2 optimal MOS sensors yielded much higher accuracy than using all nine sensors. The accuracy of 2-group and 6-group classifications of essentials oils by ANN was 100% and 98.9%, respectively.

1. Introduction

Electronic-nose (e-nose) devices, used in the food industry for quality control (QC) of animal and plant-based products, generally consist of an array of electrochemical sensors used in combination with machine-learning methods, such as through artificial neural networks (ANN), pattern-recognition algorithms, and various statistical data-evaluation systems collectively capable of detecting aroma emissions from organic food sources [1,2]. E-nose devices usually contain an array of non-specific, cross-reactive chemical sensors that have been used to detect complex food volatiles, consisting of unique combinations of volatile organic compounds (VOCs), and provide specific chemical, aroma signature patterns (smellprints) representative of the VOC-emissions being analyzed from various food sources [3,4,5].
Advances in electronic aroma detection (EAD) technologies have led to rapid proliferation in the use of artificial-intelligence (AI) devices, such as e-nose devices, as rapid and non-invasive detection tools [3,6]. Some important recent developments of EAD technologies in the food industry include applications for improving food shelf-life, freshness, and authenticity or adulteration quality assessments [7]. E-nose devices are particularly well suited for detection and analysis of VOCs [8], and these instruments have a long history of effective use in numerous industries, including food quality and safety [9], environmental protection [10], agriculture [11,12,13,14], human health [15], and biomedical applications [16].
The capabilities of e-nose technologies to provide fast, reliable, and sensitive detection of food-quality characteristics are increasingly important for the discovery of counterfeit and adulterated foods to facilitate the enforcement of regulatory controls. The rapid detection of counterfeit and toxin-contaminated food products allows for the implementation of early preemptive measures to preclude economic losses or harm to consumers before problems arise [17]. The development of e-nose gas-sensor array technologies are effective analytical tools for assessing food quality and detecting distinct mixtures of volatile emissions from food products [8,13].
Many challenging questions arise in relation to e-nose performance enhancement, including how to improve on instrument sample-classification rates, detection and recovery speed, and predictive accuracy [18]. Each unique EAD system has its own advantages and disadvantages affecting efforts to improve on machine performance. However, there are also numerous instrument-independent variables that exists for increasing VOC detection selectivity, sensitivity, operating range, as well as response and recovery times. These factors affect sample classification due to sample air relative humidity, temperature, sensor signal drift, and other factors [19].
The instrument output signal-to-noise ratio (S/N) and individual sensor sensitivity are fundamental features of e-nose sensor arrays. These characteristics are largely determined by the type of sensor operational technology utilized. The types and number of sensors most beneficial for inclusion in an e-nose sensor array is dependent on the chemical nature of the sample types to be analyzed [8]. Optimal sensors selected for effective sample discrimination must usually be empirically determined in practice. Verification of the most effective sensor number and combinations tested for a sensor array, producing the best classification performance, may be achieved using statistical sample-classification models with the least possible variables, leading to a higher ratio of data points to variables [19,20].
Electronic noses consist of gas-sensing systems designed to measure and analyze differences in VOC emissions from different sample types, having unique aroma characteristics. Recent advances in new data-processing algorithms and techniques, such as feature extraction and sensor array component analyses, provide more useful information to facilitate and improve sample discriminations. Feature selection is a means for removing redundant sensors that add noise (information not useful for classifications or discriminations) within the instrument sensory outputs [20].
Various statistical techniques, such as Partial Least Square (PLS) and Principal Regression (PR) have been used to select optimal sensors based on specific features and classification types. These techniques reduce the potential cost associated with new sensor developments to solve complex olfactory problems and create application-specific sensor arrays [13]. The optimization of e-nose sensor arrays, by the selection of appropriate high-performing sensors (as a subset of the original sensor array) that provide optimal discriminations, have been extensively reported [21,22,23,24,25,26,27]. Some studies [28,29,30,31,32] have reported the possibility of odor detection, using data collected by only one or a few sensors.
The research presented here is the result of a follow-up study to further analyze and improve on the performance of the experimental MOS e-nose system (the MAU-9), recently evaluated for its capabilities of classifying and identifying purified essential oils from herbal and fruit sources [33]. The purposes of this study were to: (1) evaluate the performance of individual sensors in the MAU-9 e-nose sensor array for effectiveness of contributions to discrimination of purified plant essential oils based on VOC emissions, (2) compare the usefulness of two statistical analysis methods, PR and PLS for evaluating discriminations between essential oils based on MAU-9 e-nose data, and (3) examine the performance of artificial neural network (ANN) learning and classification methods for e-nose discriminations based on purified essential oil VOC emissions.

2. Materials and Methods

2.1. Essential Oil Samples

Six different essential oils (EOs) including tarragon oil from tarragon (Artemisia dracunculus) leaves, thyme oil from thyme (Thymus vulgaris) leaves, mint oil from mint (Mentha arvensis) leaves, lemon oil from lemon (Citrus limon) fruit, orange oil from orange (Citrus sinensis) fruit, and mango oil from mango (Mangifera indica) fruit were used in this study. The essential oils were selected and purchased from a commercial source (Barij Essence Pharmaceutical Company, Tehran, Iran). The samples were extracted by steam, so that the essential oils were composed of pure and concentrated oils in liquid form and did not contain organic solvents in them [33].

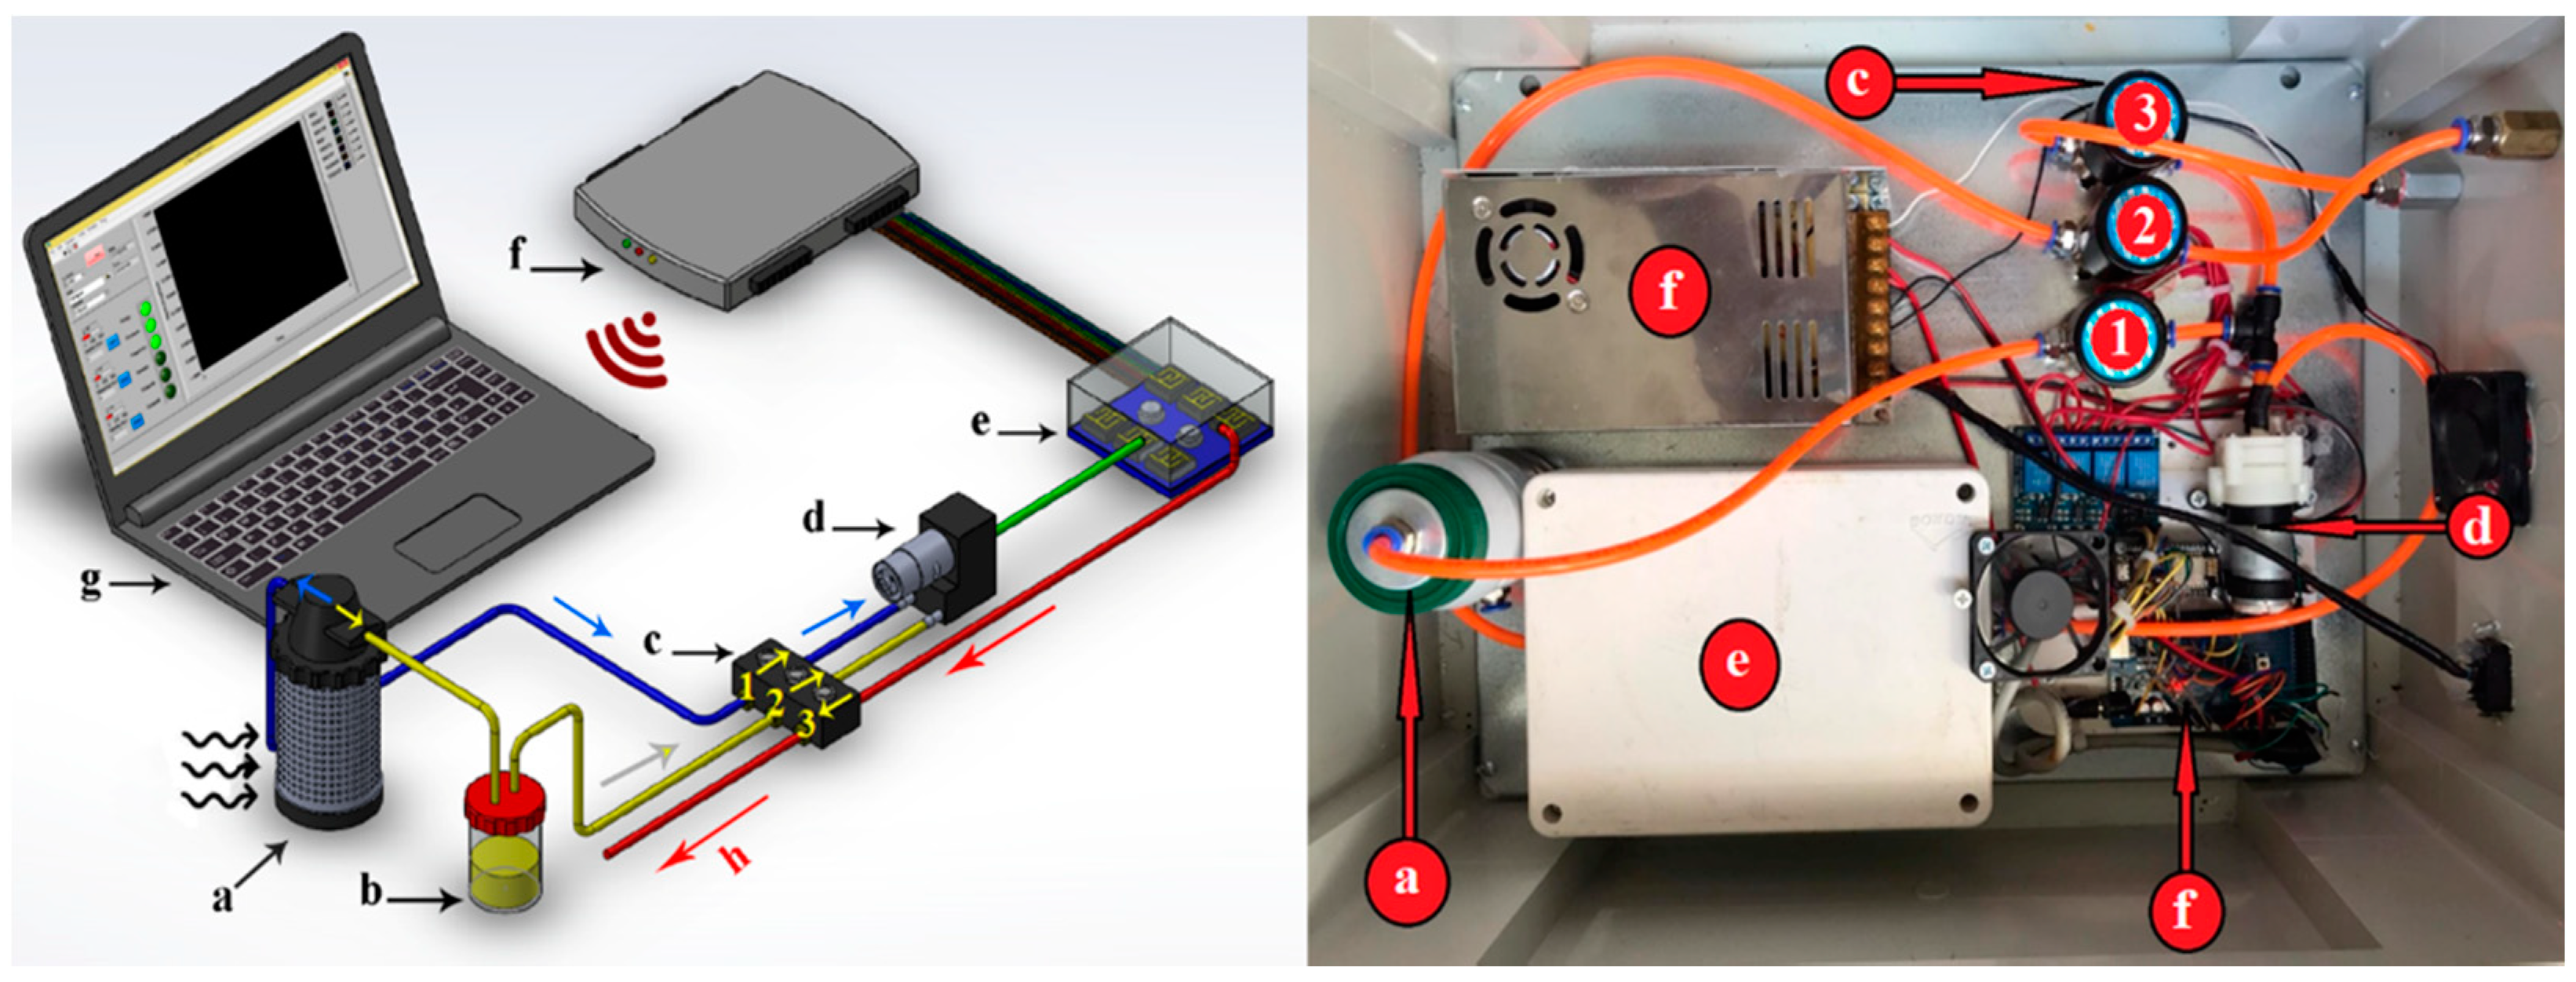
2.2. Electronic Nose Instrument

An olfactory machine (MAU-9 electronic-nose system) equipped with 9 metal oxide sensors (MOS) was used for the experiments. The names of the sensors (in order, with primary VOCs detected) are as follows: MQ9 (carbon monoxide and combustible gases), MQ4 (urban gases and methane), MQ135 (ammonia, benzene, sulfides), MQ8 (hydrogen), TGS2620 (alcohols, organic solvents), MQ136 (sulfur dioxide), TGS813 (aliphatic alkanes), TGS822 (organic solvents), and MQ3 (alcohols). This device was developed by the Department of Biosystems Engineering of Mohaghegh Ardabili University, Ardabil, Iran [33,34]. The components of this system consist of the following parts, indicated in the order of airflow from first coming into the e-nose system until exit as exhaust gas. First, the ambient air enters the air filter (activated-charcoal carbon to remove VOC hydrocarbons in the ambient air), then enters the sample chamber and goes through air vents, controlled by electronic valves, and propelled by the suction diaphragm pump into the chamber of the electronic aroma sensor array containing the nine responsive sensors. A schematic representation and photograph of the MAU-9 e-nose system is provided in Figure 1. The volume of the sensor chamber containing the sensor array was 1414 cm3. The inlet flow into the sensor chamber was 1.5 L per minute and the sampling chamber volume was 50 cm3. Sensors within the sensor array respond differently to sample aromas (VOC emissions) from different volatile sample types. The output response of the sensors is saved inside the PC by the data recorder and a wireless transmission card.
The MAU-9 MOS e-nose worked as a multisensory detector to sense VOC emissions from purified EOs of different plant species by measuring changes in electrical conductivity of individual sensors caused by a signal response to adsorption of different chemical classes of VOCs to the surface sensor coatings due to interactions between the semiconductor and analyte gas molecules. The changes in electrical conductivity are received by a transducer that converts the analog signal from the sensor array to digital values from each sensor. All detailed experimental methods and system components utilized for operating all phases of chemical analyses using the MAU-9 e-nose were described previously [33]. The room temperature was controlled at (20 ± 0.5 °C) during sample preparation and detection to help minimize changes in carrier input-air relative humidity prior to being filtered by the activated-charcoal carbon.
The sensor output signals from all nine sensors in the MAU-9 MOS e-nose sensor array constituted a full multisensor-array output response, commonly referred to as an aroma signature pattern or smellprint. The unique aroma signatures (smellprint patterns), resulting from sensor-array output responses to individual aroma VOC-emissions of the six purified and concentrated herb and fruit essential oil samples (recorded previously), are presented in Figure A1 (Appendix A).

2.3. Data Analysis

Several statistical methods, including Partial Least Square, Principal Regression Model, and Artificial Neural Networks (ANN) learning and classification methods, were used to analyze and interpret MAU-9 e-nose sensor output data obtained in this study. A complete list of statistical methods and algorithms utilized and mentioned in this study are defined, along with common-use acronyms, in alphabetical order within Appendix B. The process of data acquisition, derived from the MAU-9 e-nose system, was divided into three phases, including baseline establishment, sample air aroma injection and purification. The responses of the MOS sensors were recorded and graphed based on voltage variation (∆V) vs. time. Sensor responses were normalized relative to their baseline for purposes of thrust compensation, contrast enhancement, and scaling using the fraction method, as described previously by Karami et al. [34], and expressed by Equation 1:
Y s ( t ) = X s ( t ) X s ( 0 ) X s ( 0 )
in which Ys (t), Xs (0), and Xs (t) indicate the normalized sensor response, the baseline, and the raw unprocessed sensor response, respectively. The details of run parameters and procedures for the data-acquisition phases of this e-nose system are given in the following subsections.

2.3.1. Statistical Methods
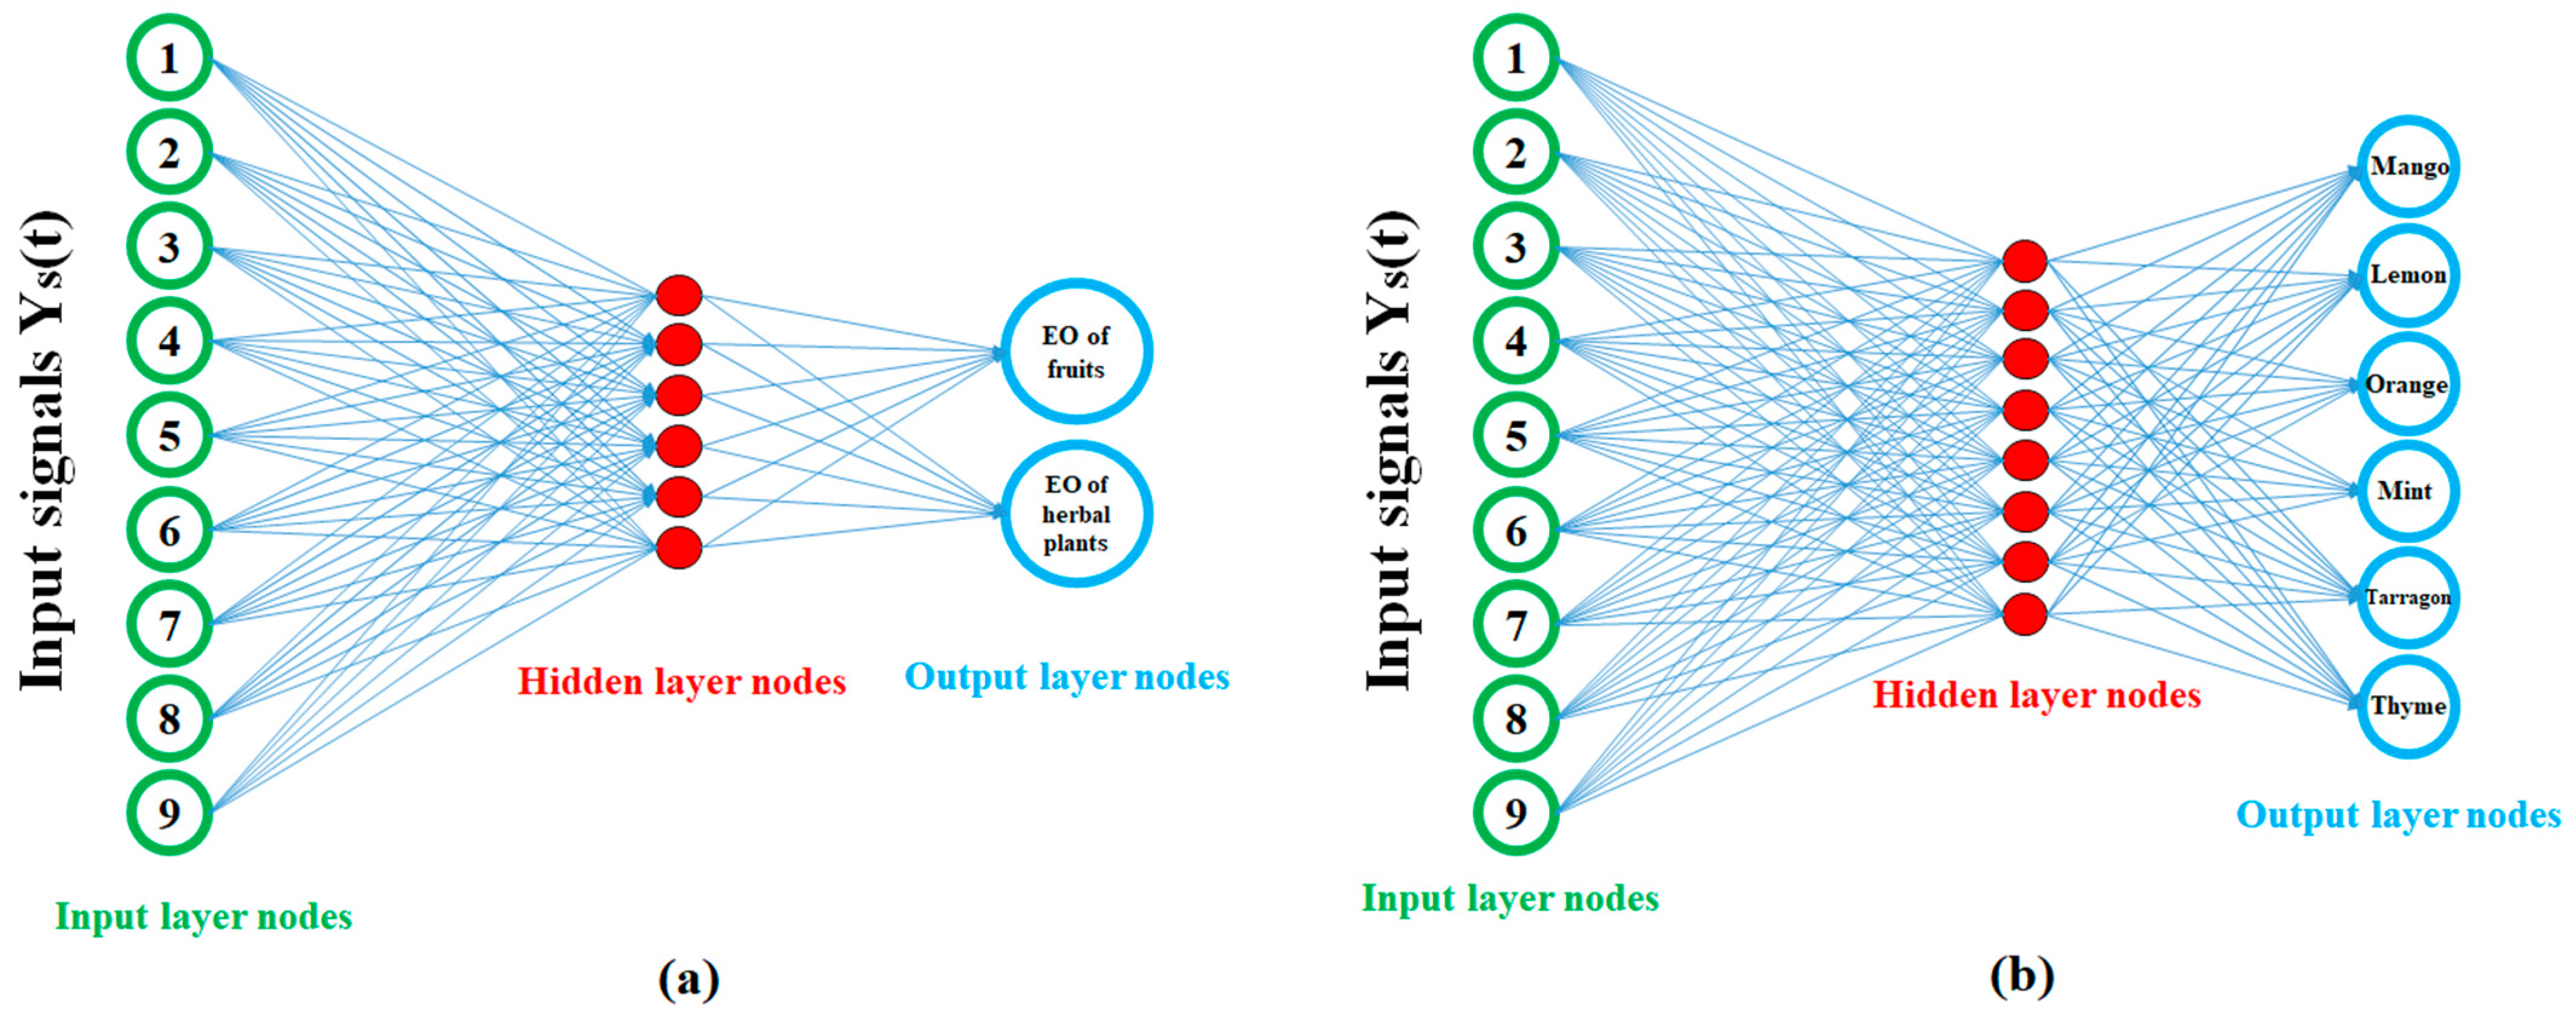
The partial least squares (PLS) method is a multivariate statistical analysis method that has been extensively used in research fields involving fruits and vegetables. This method can better summarize the information of independent variables and explain dependent variables by extracting effective comprehensive variables [35,36]. PLS can overcome the problem of multivariate correlation problems resulting from the interaction between independent variables, thus eliminating interference factors to a large extent and improving the accuracy of prediction. Besides helping to overcome correlation problems, using PLS also helps emphasize model performance by the interpretation and prediction of independent variables, relative to dependent variables, when selecting feature vectors, eliminating the result of regression noise, and establish a model with a minimum number of variables [13].
Principal regression (PR) is a type of linear regression analysis based on the principal component analysis (PCA) method. More precisely, PR is used to estimate unknown regression coefficients in a standard linear regression model. Principal regression can lead to the efficient prediction of results based on the assumed model by properly selecting the principal components used for regression [37].

2.3.2. ANN Methods

The effective use of ANN as a classification method, based on powerful machine learning, is particularly useful due to its nonlinear mapping capabilities. Different types of ANNs, such as multilayer perceptron (MLP), learning vector quantization (LVQ), and Kohonen networks, have been used to classify e-nose data [14]. ANN classification has learning capabilities (for improving sample discriminations) because it is comprised of interconnected layers of artificial neurons that carry out classifications by tuning the weight and bias of the connections between neurons. The neuron pattern structure, the learning process and the performance of nerve cell activation determines ANN performance [15]. In the ANN learning phase, both the input and the corresponding target (output) are required. The weight of the connections is tuned based on the comparison of the output and the target. This learning is repeated continuously until the outputs of network meet the termination criteria. Normally, transfer functions for learning ANNs include sigmoid function, step function, linear composition, and rectifier. ANN performance depends on many factors, including the number of learning pairs, the ANN structure, the choice of transfer and activation function, and the termination criteria.
A neural network can be used to effectively predict unknown samples based on the response of the sensor from the machine olfaction system. Machine olfaction was used to classify the essential oils based on the obtained sensor responses. The accuracy of the ANN model can be estimated based on the root mean square error (RMSE) and the value of the coefficient of determination (R2).

3. Results

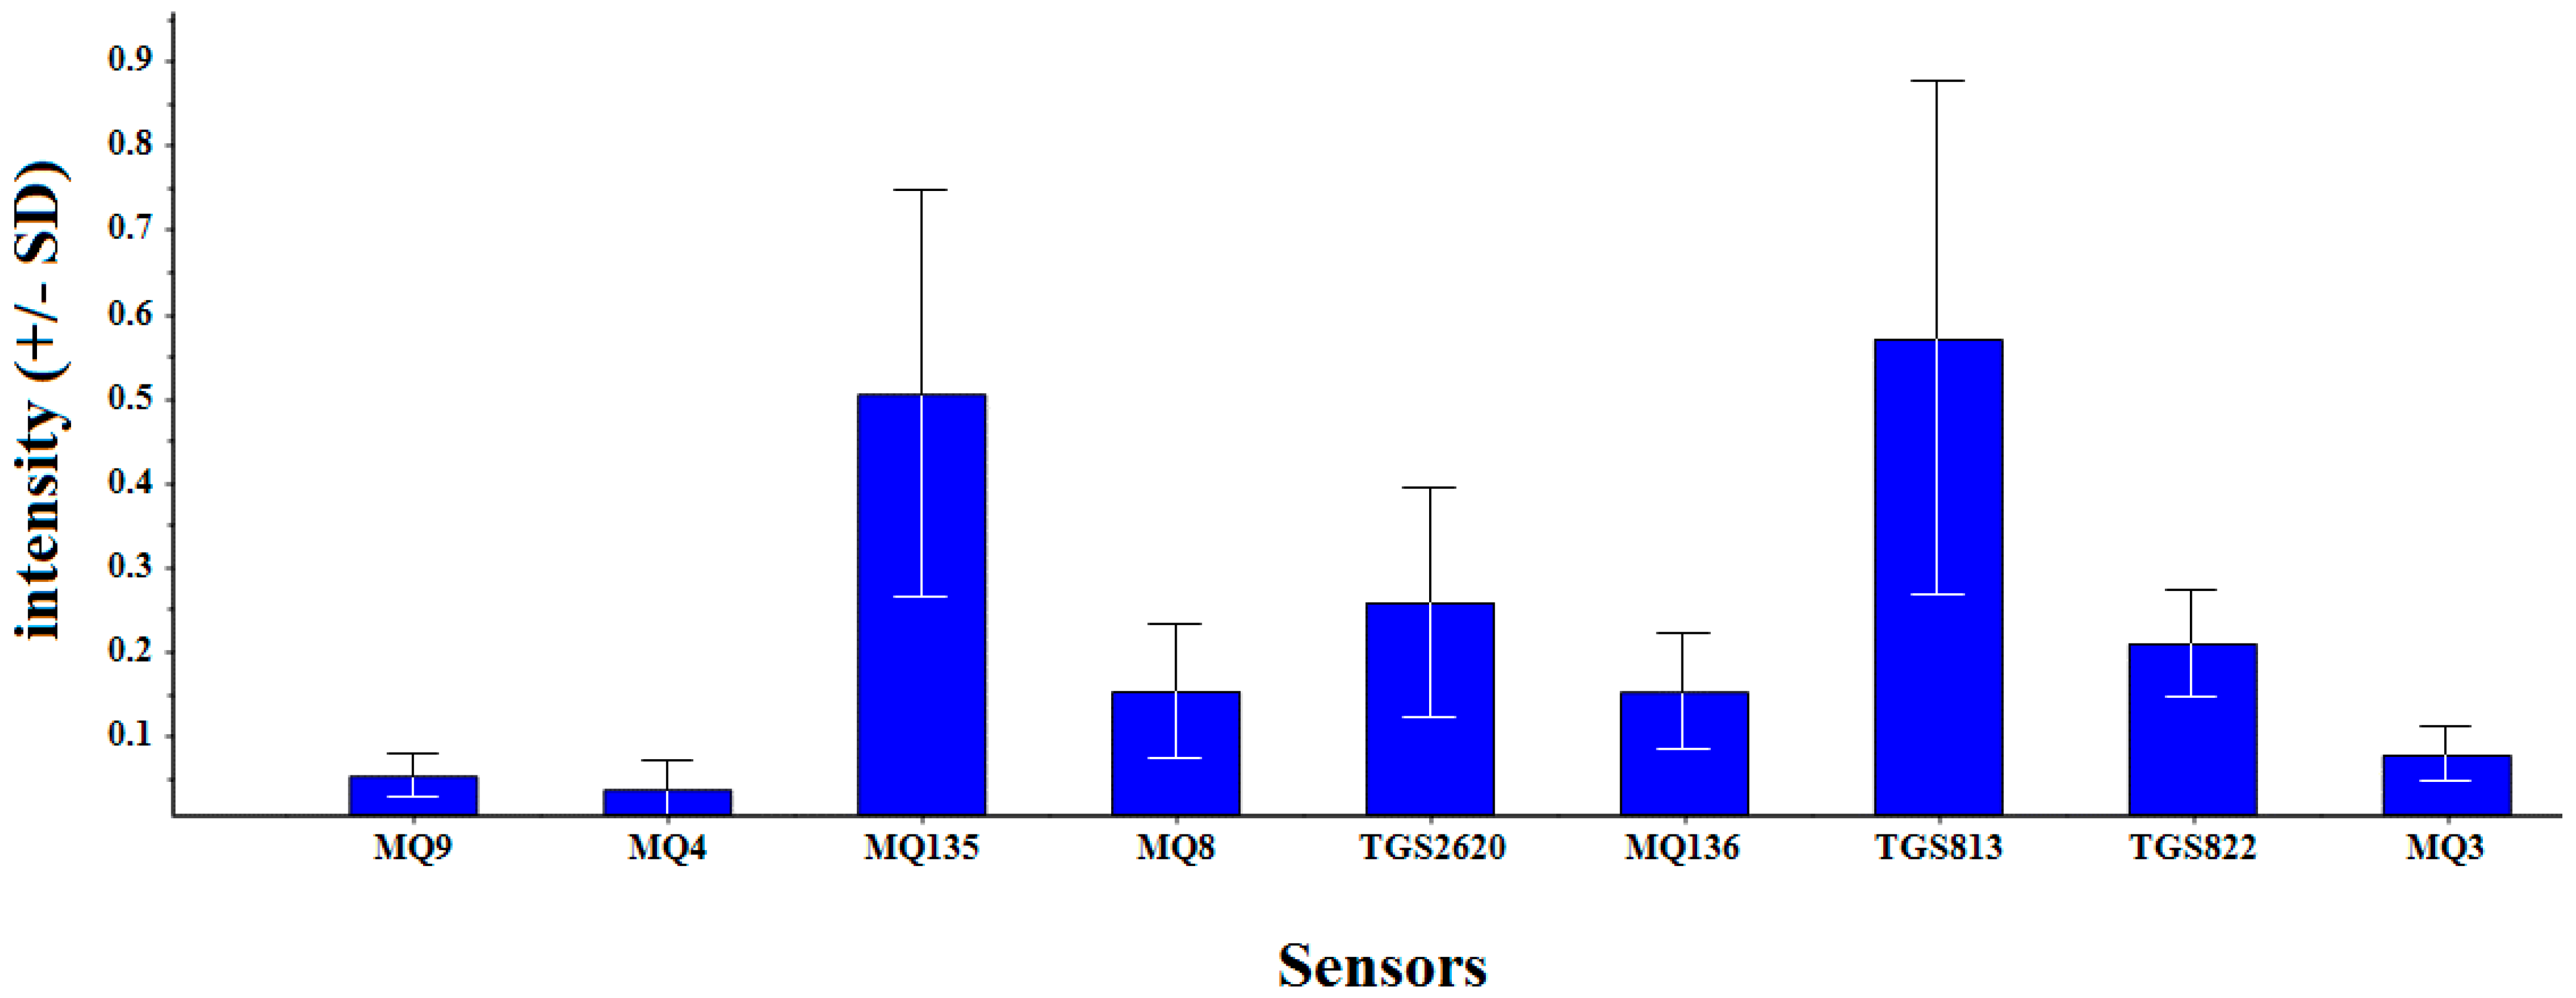
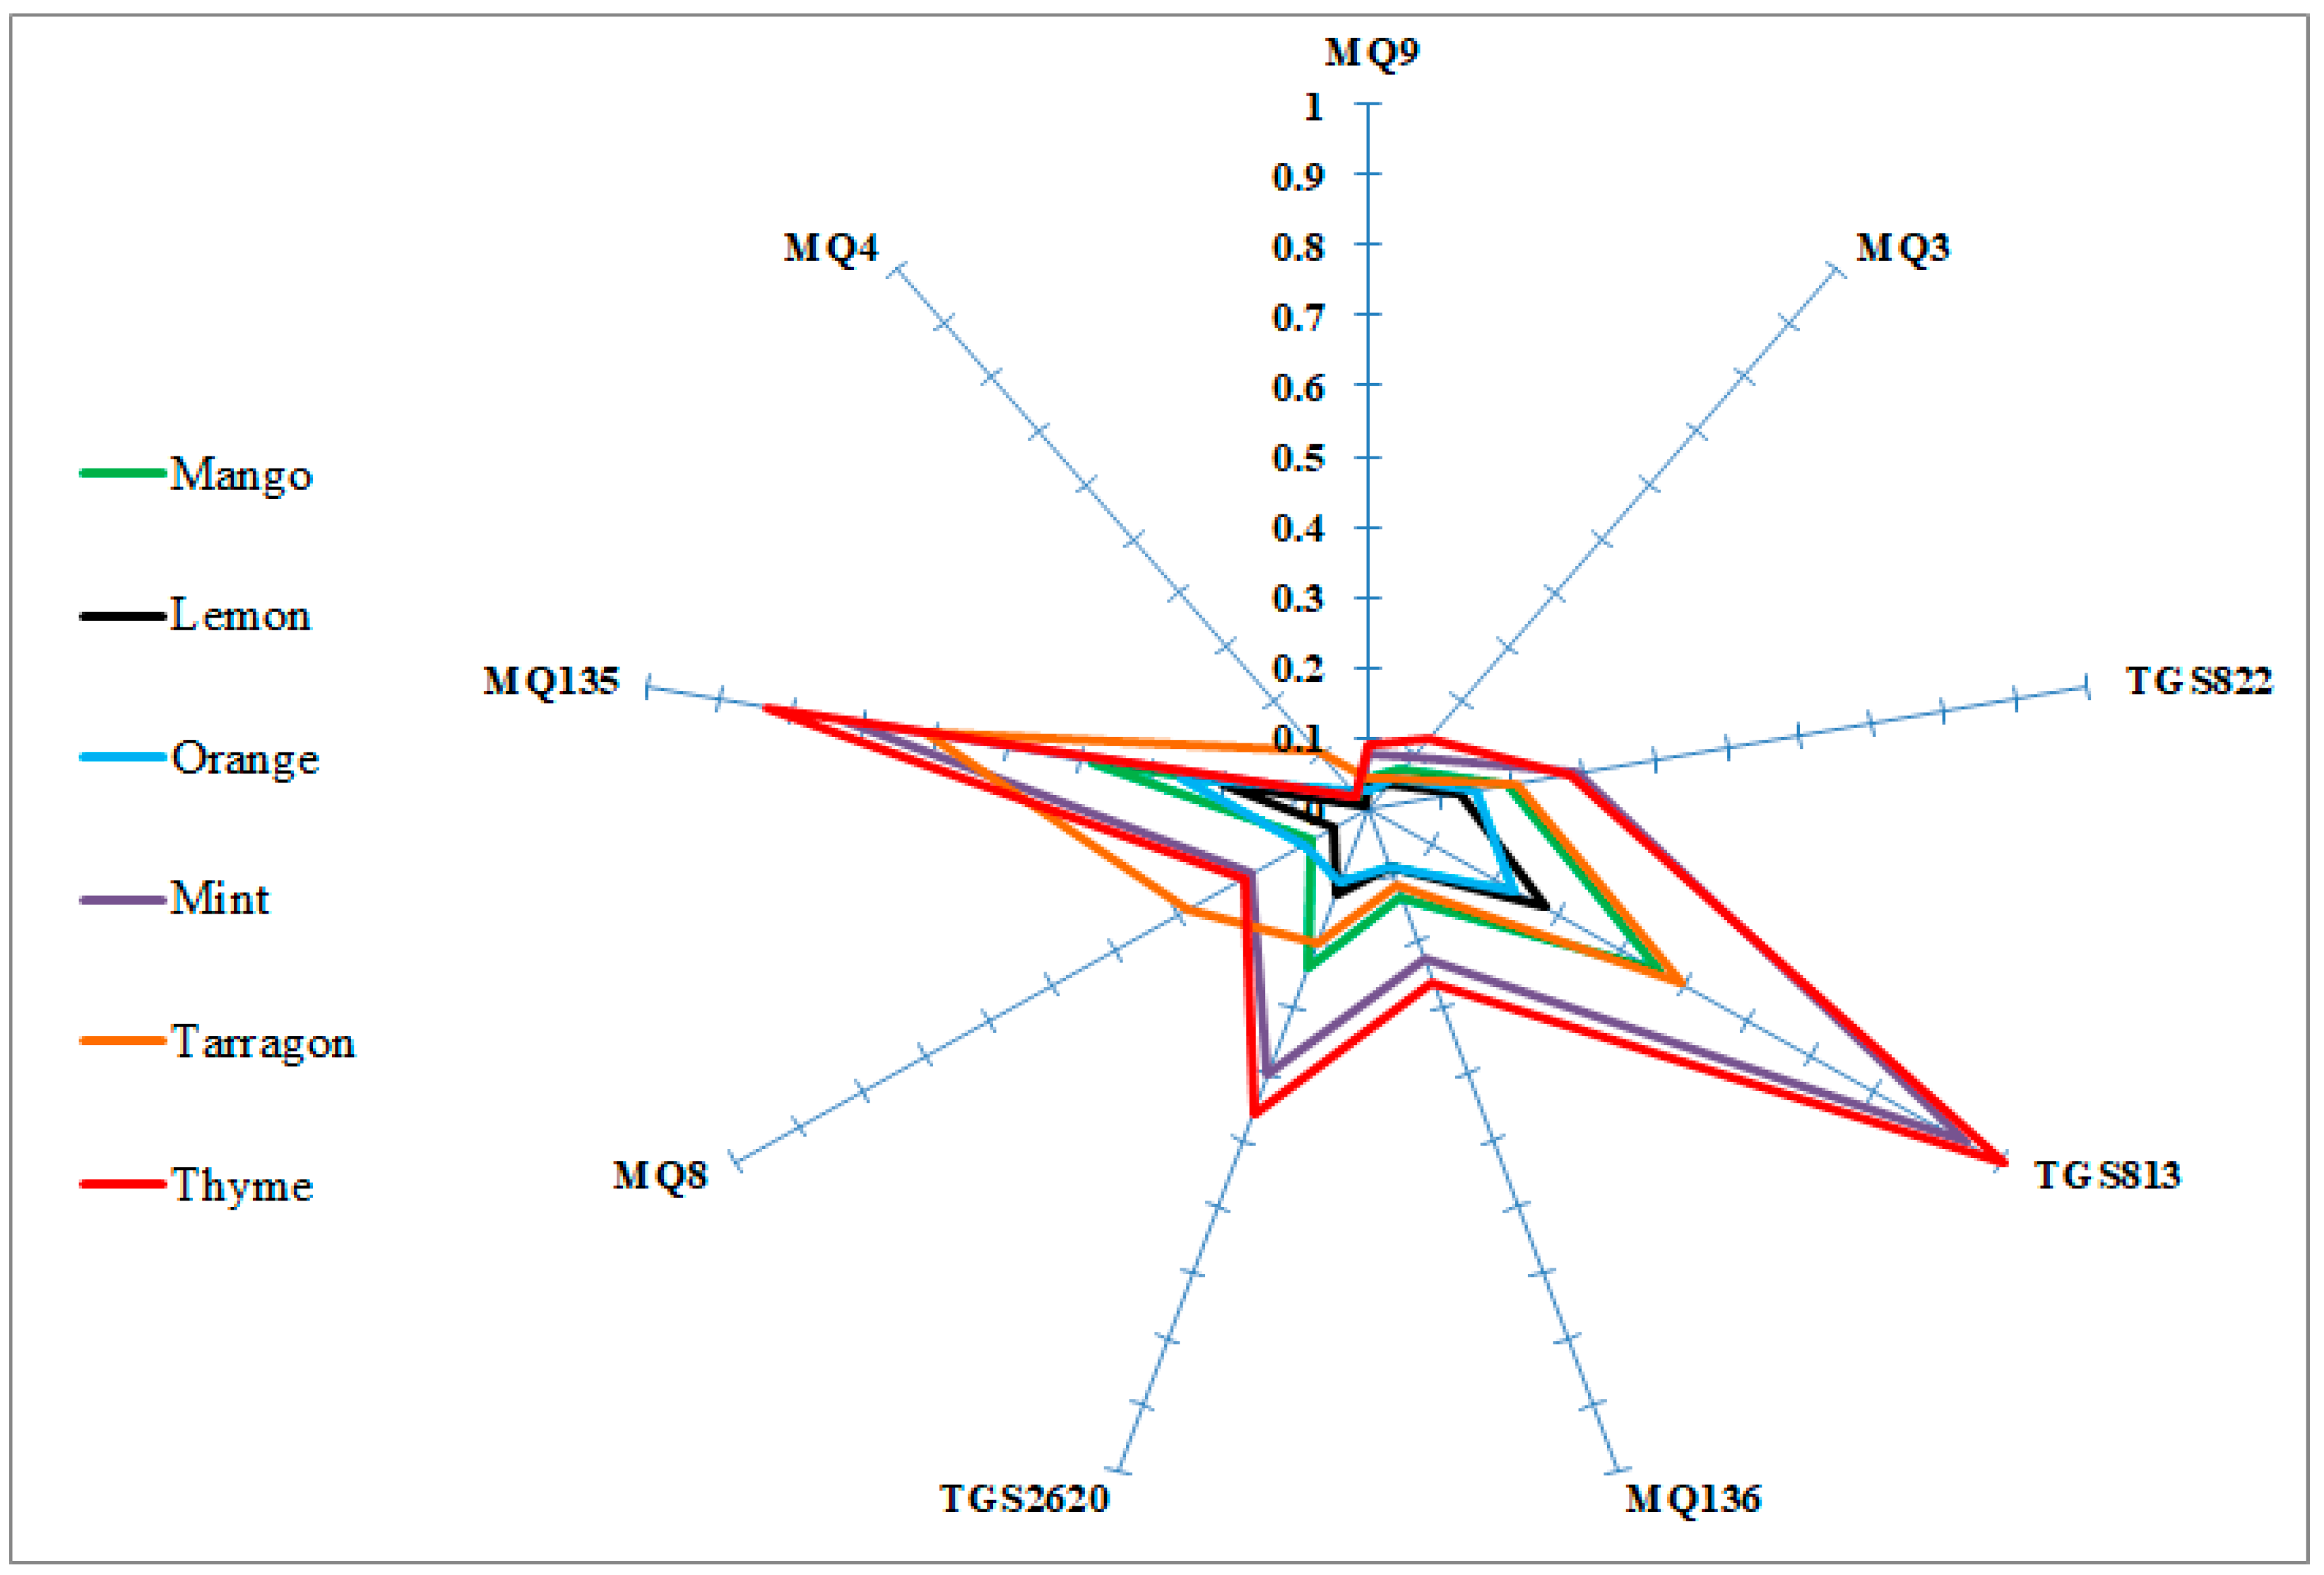
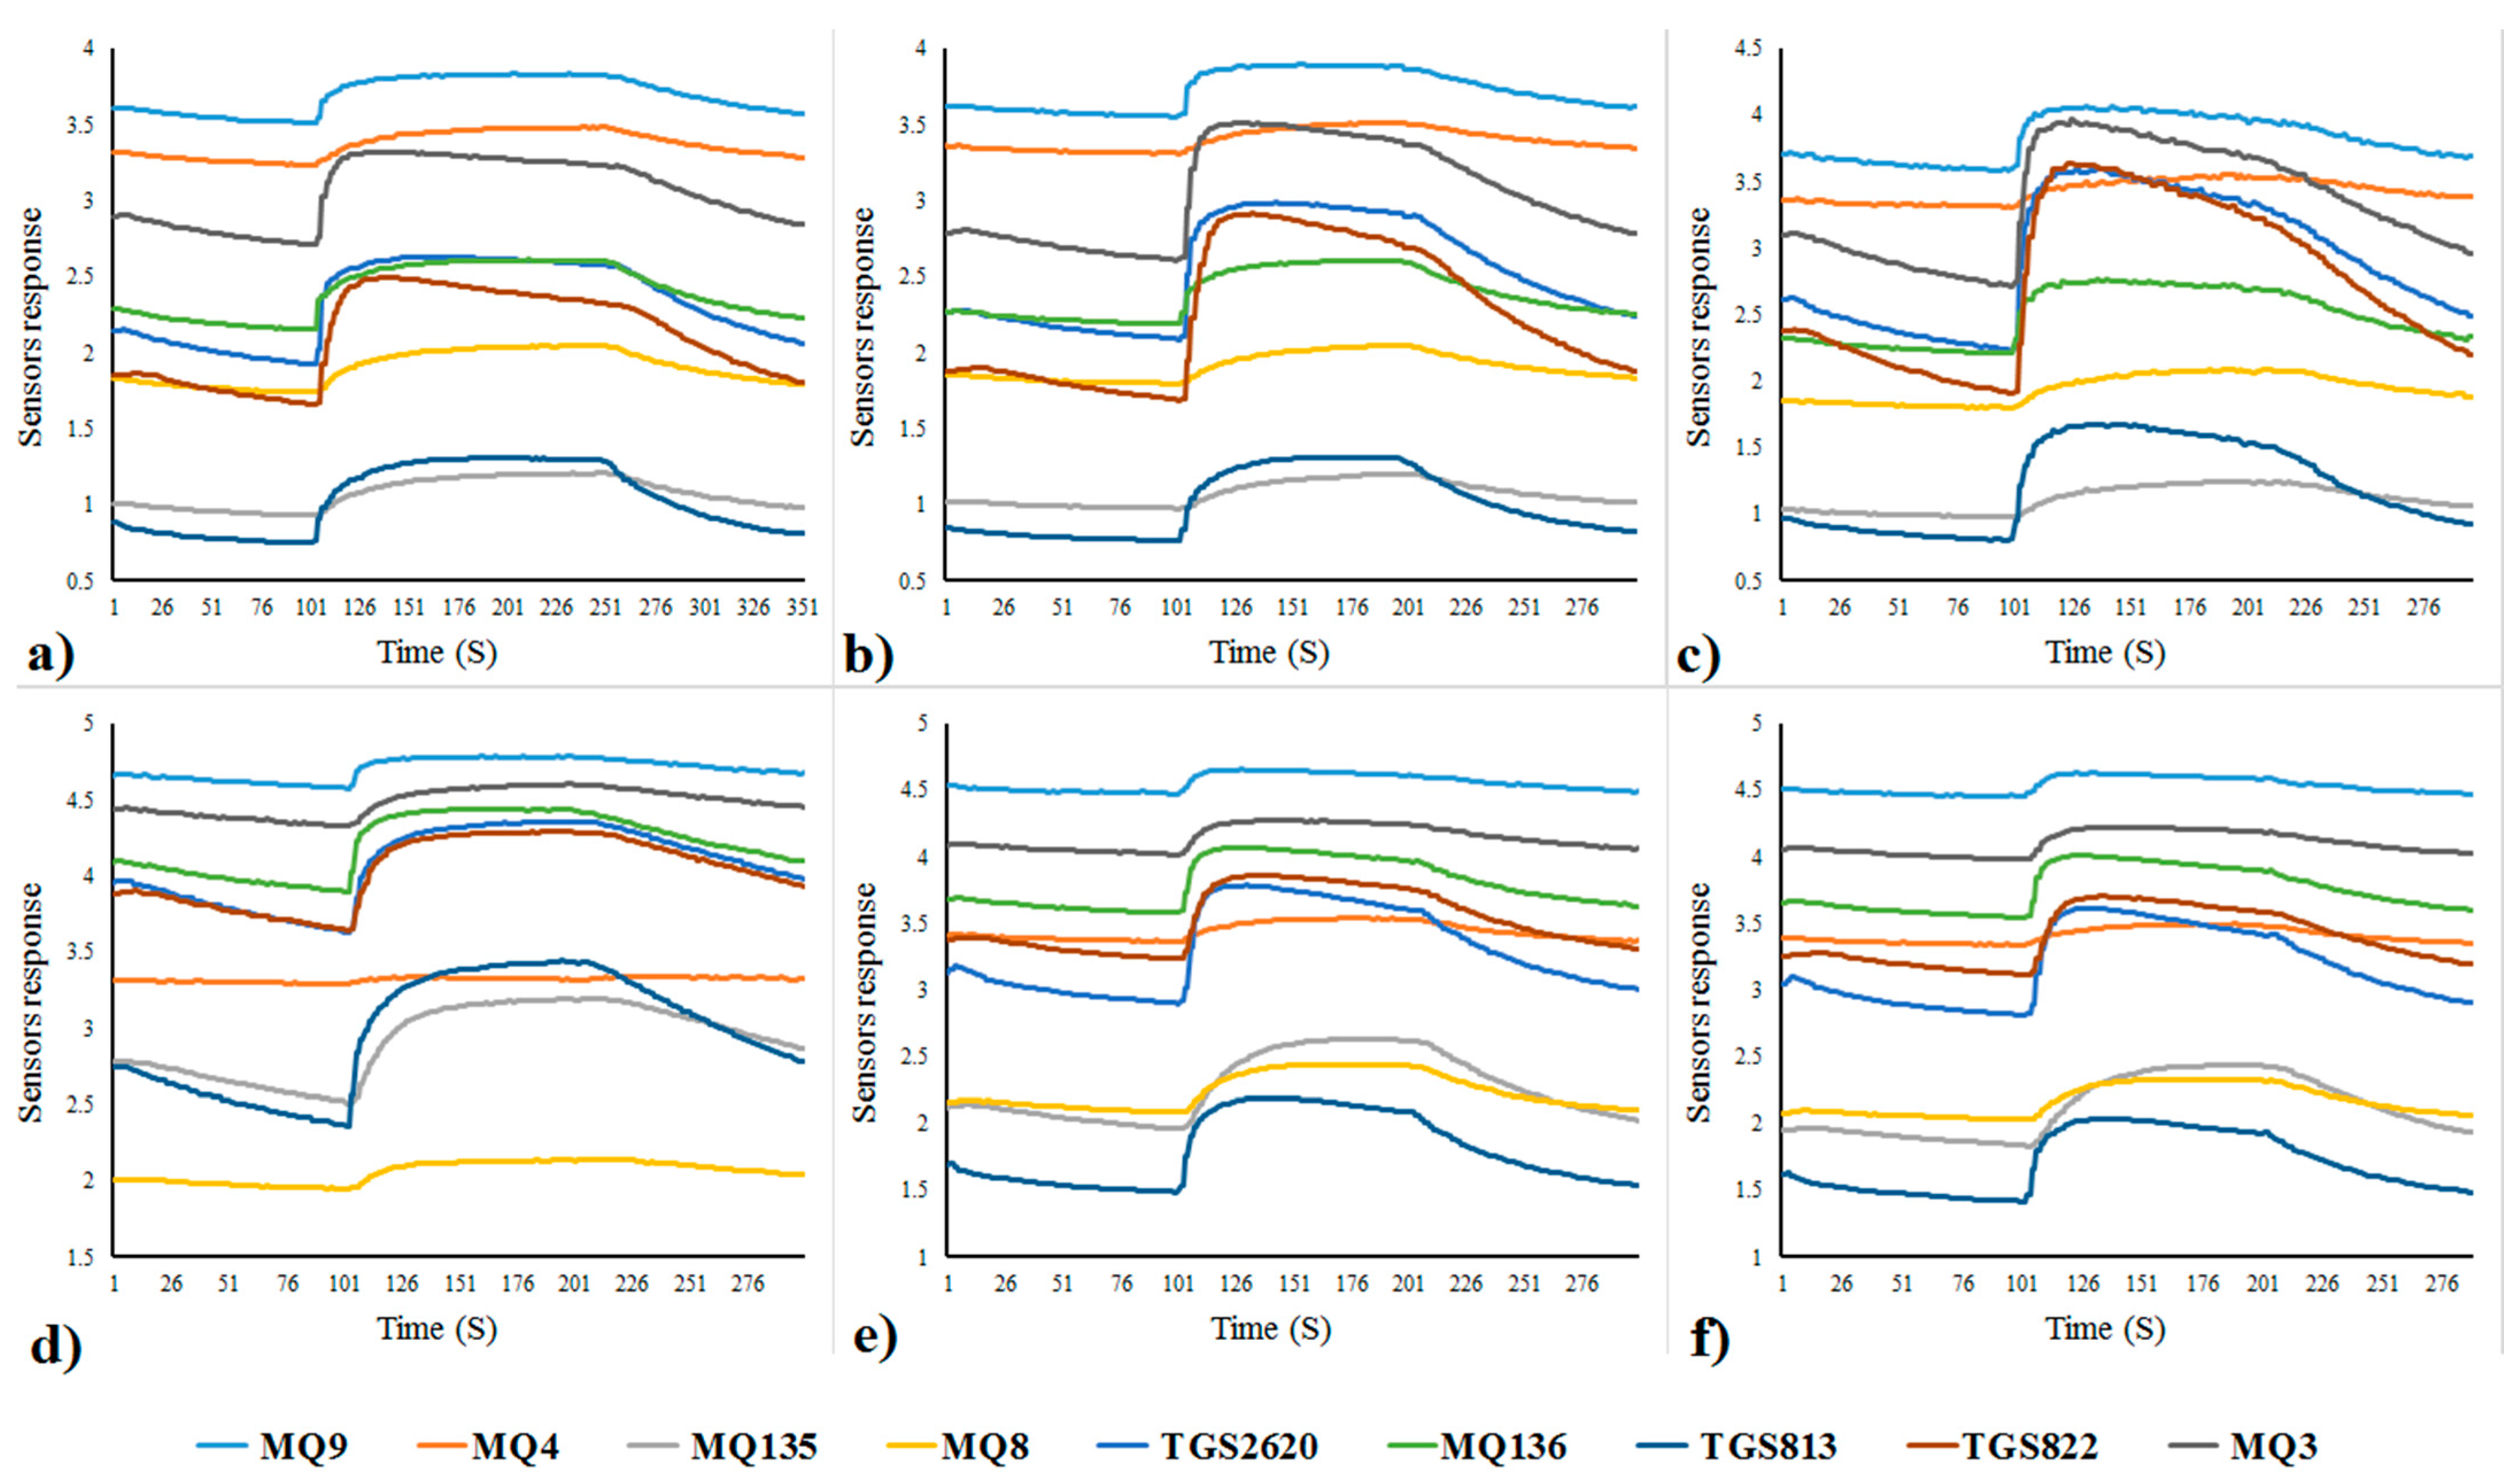
3.1. Electronic-Nose Sensor-Component Analysis

The average of the main response data generated by nine machine olfaction sensors is collected and converted into radar graphs, as shown in Figure 2. All sensors make a response when exposed to the aroma VOC-emissions of the samples, where the lowest response is related to the smell of fruit samples, and the smell of essential oils of medicinal plants has the highest response.
Sensors MQ135 and TGS813 were the strongest and most effective in the classification of different types of essential oils. Knowing the response of each sensor to the VOCs of essential oil samples can help determine the various qualitative characteristics of essential oils. Accordingly, one can choose the most important and effective sensors (with maximum responses to essential oil volatiles) among the sensors selected to be included within the sensor array of the e-nose. The selection of sensors with the strongest responses help to reduce the response time of the system. However, access to the most important sensors can play a significant role in the data processing stage because additional variables in data sometimes can lead to problems such as over analysis of the data. Sensors with poor selectivity adversely affect the discriminating power of the sensor array. Knowledge of the discrimination power and performance of sensor array components can facilitate decision making for the selection of the most suitable sensors. The selected nine-sensor array was previously effective for the olfaction-based qualitative classification of fruit juice quality and essential oils from herbs and fruits and could be used to construct an optimal or improved electronic-nose system [33,38].
The MOS gas sensors TGS813 and MQ135 had the highest sensor intensity responses to essential oil volatiles (VOCs), whereas the lowest sensor intensity responses to VOCs were recorded for sensors MQ3, MQ4, MQ9. Both TGS813 and MQ135 sensors showed high sensitivity to different VOCs (Figure 3). The variation in sensor responses (to individual essential oil sample replications) was greatest, with the two sensors (TGS813 and MQ135) having the strongest sensor responses.

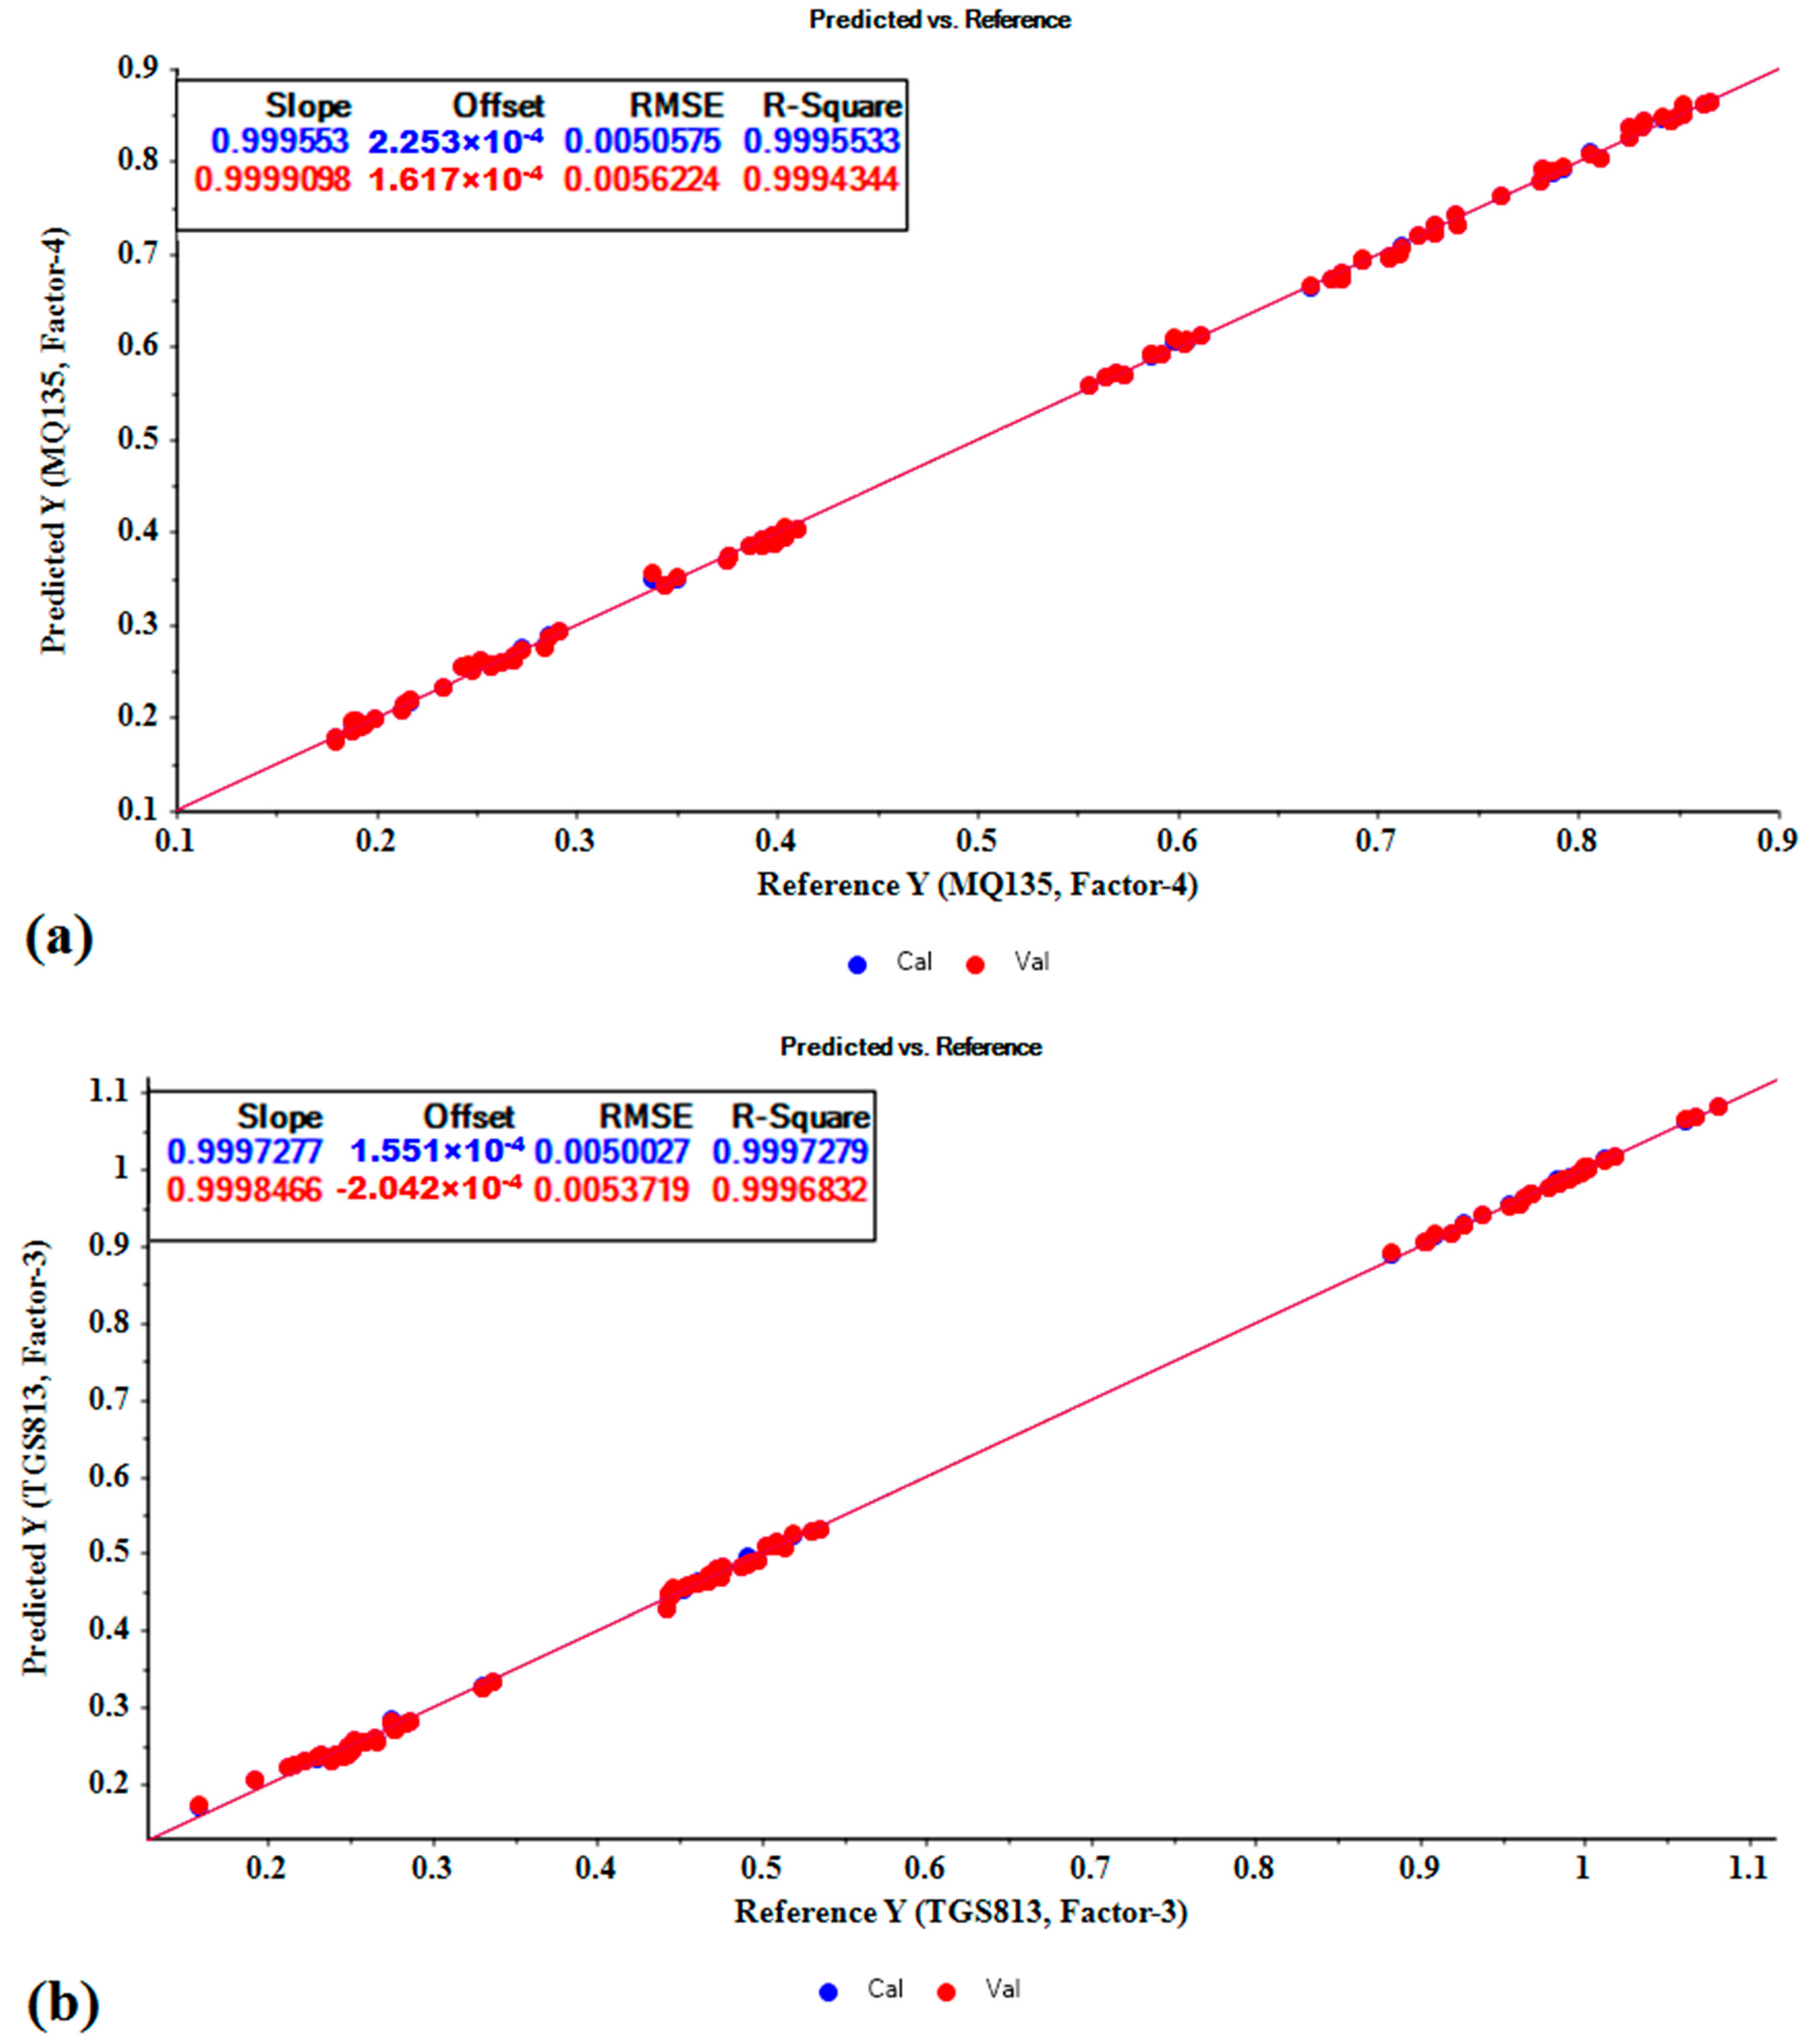
3.2. Partial Least Squares and Principal Regression Analyses
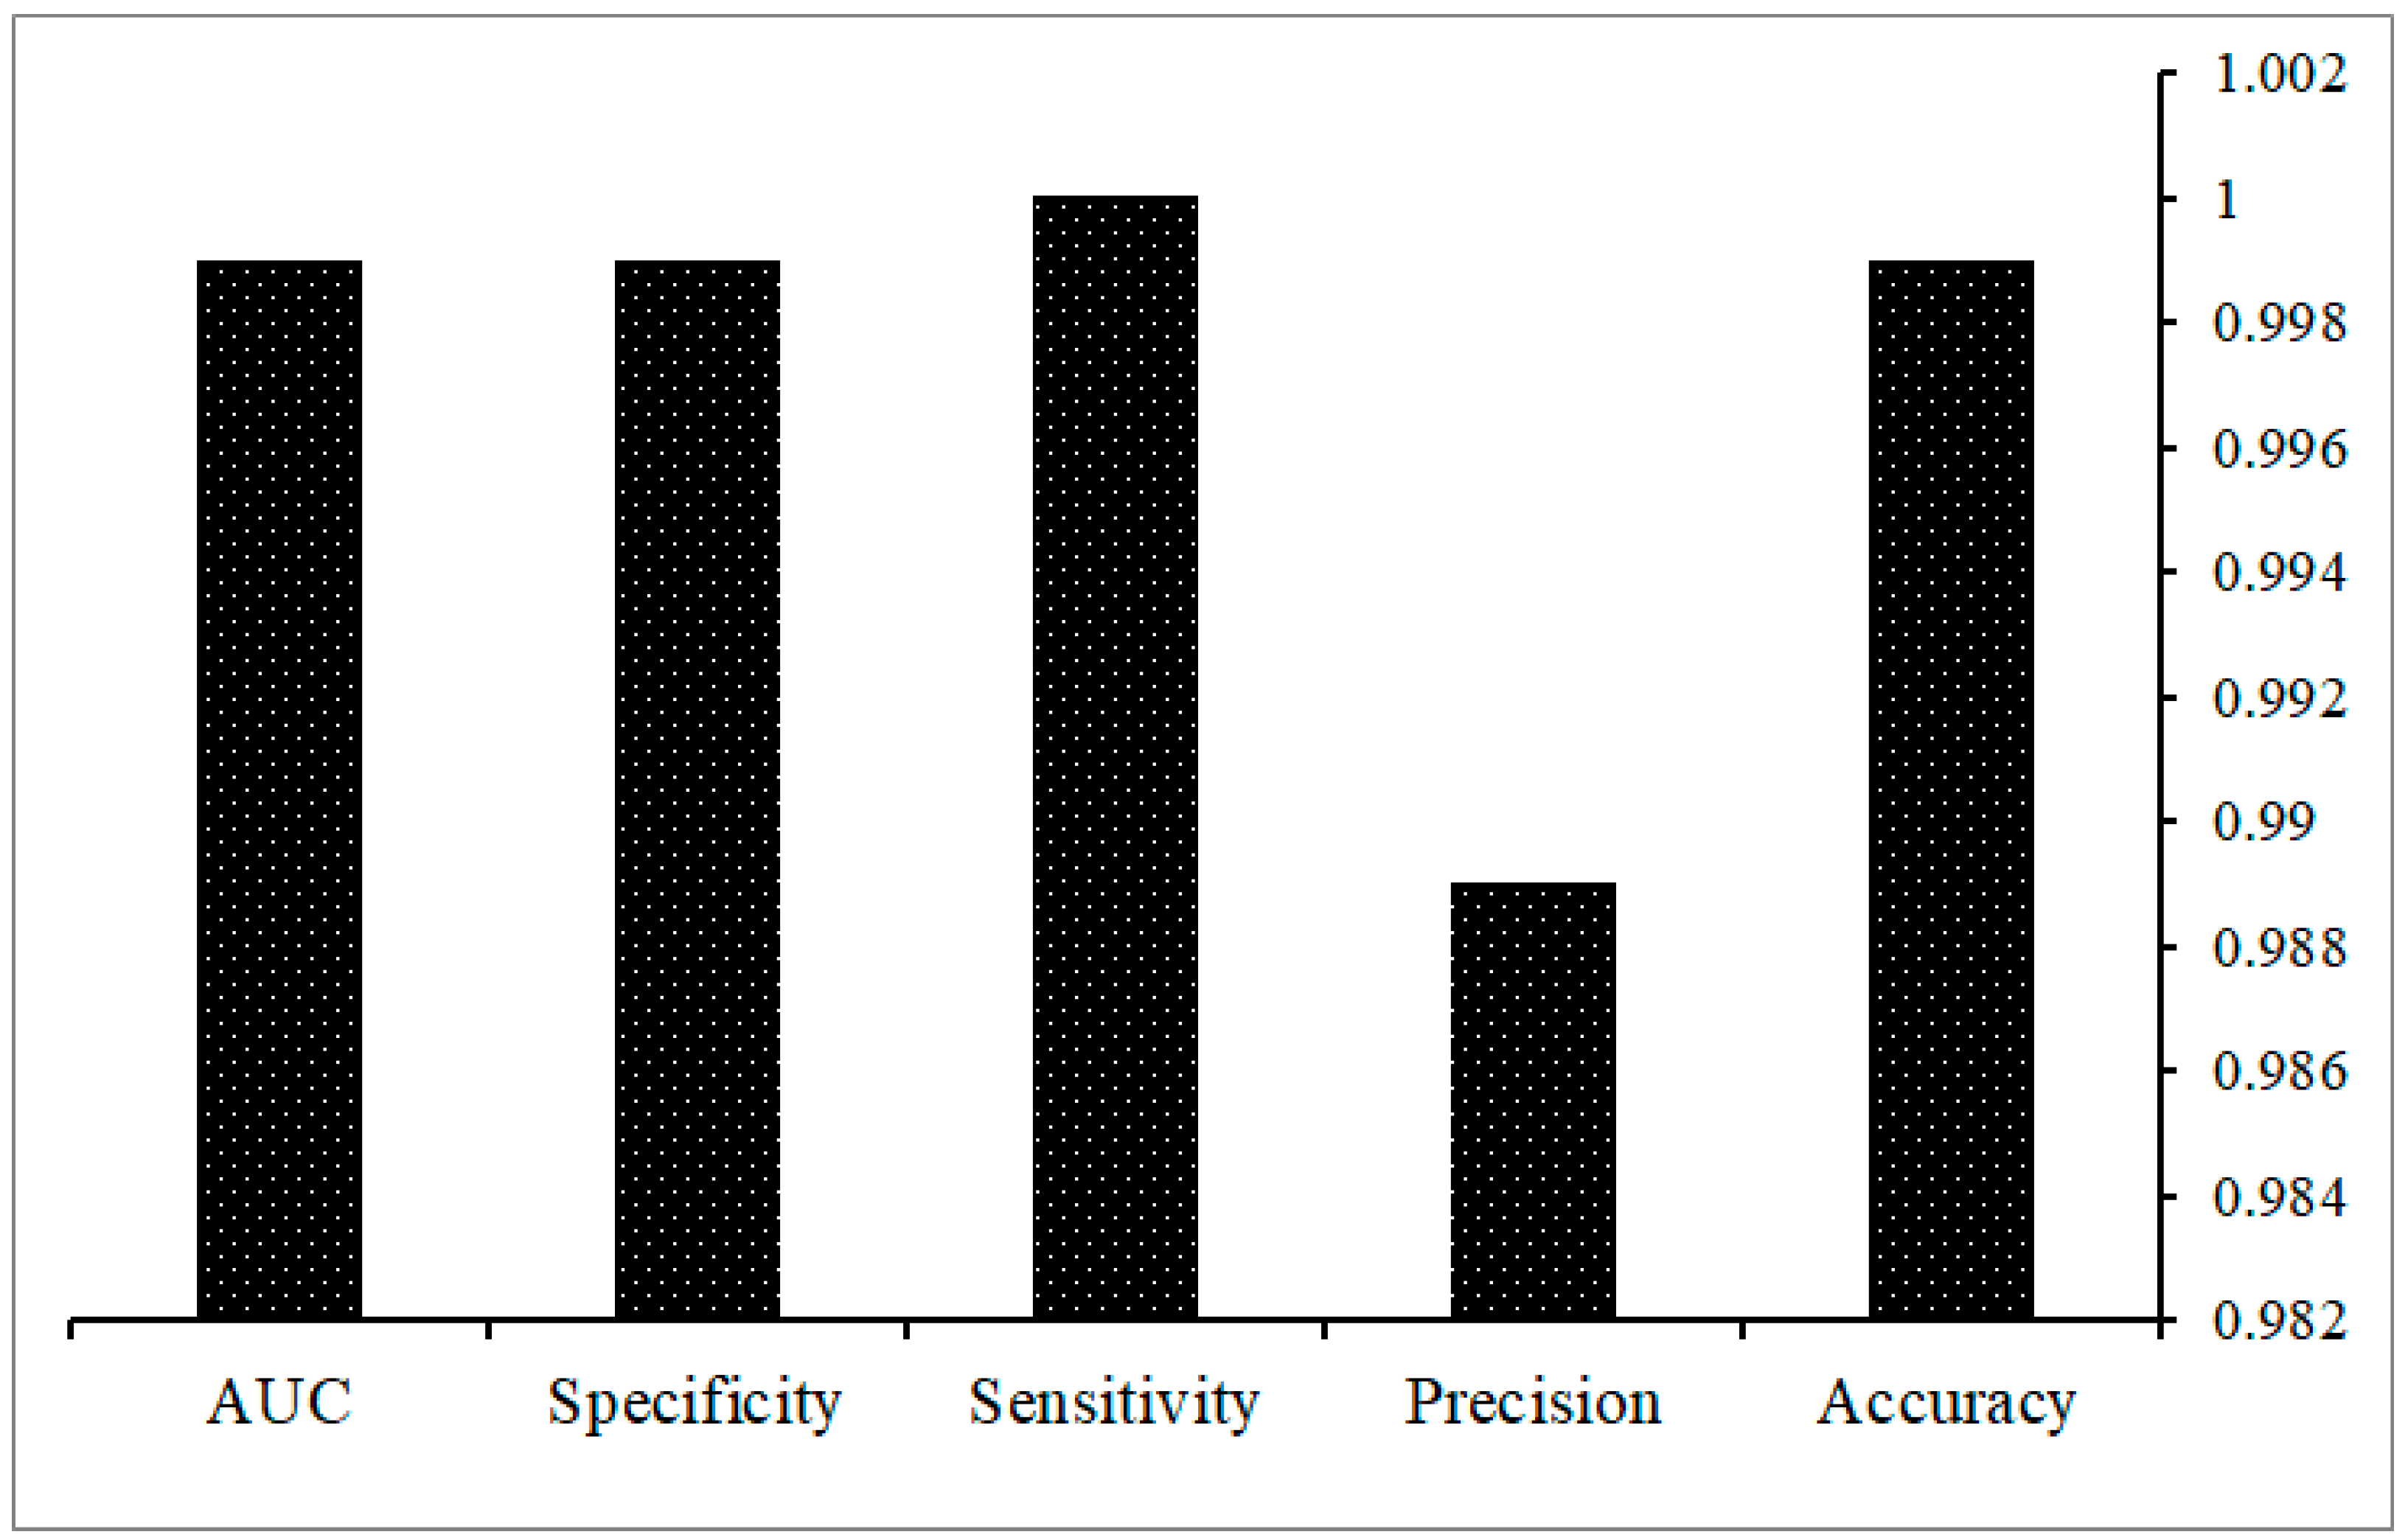
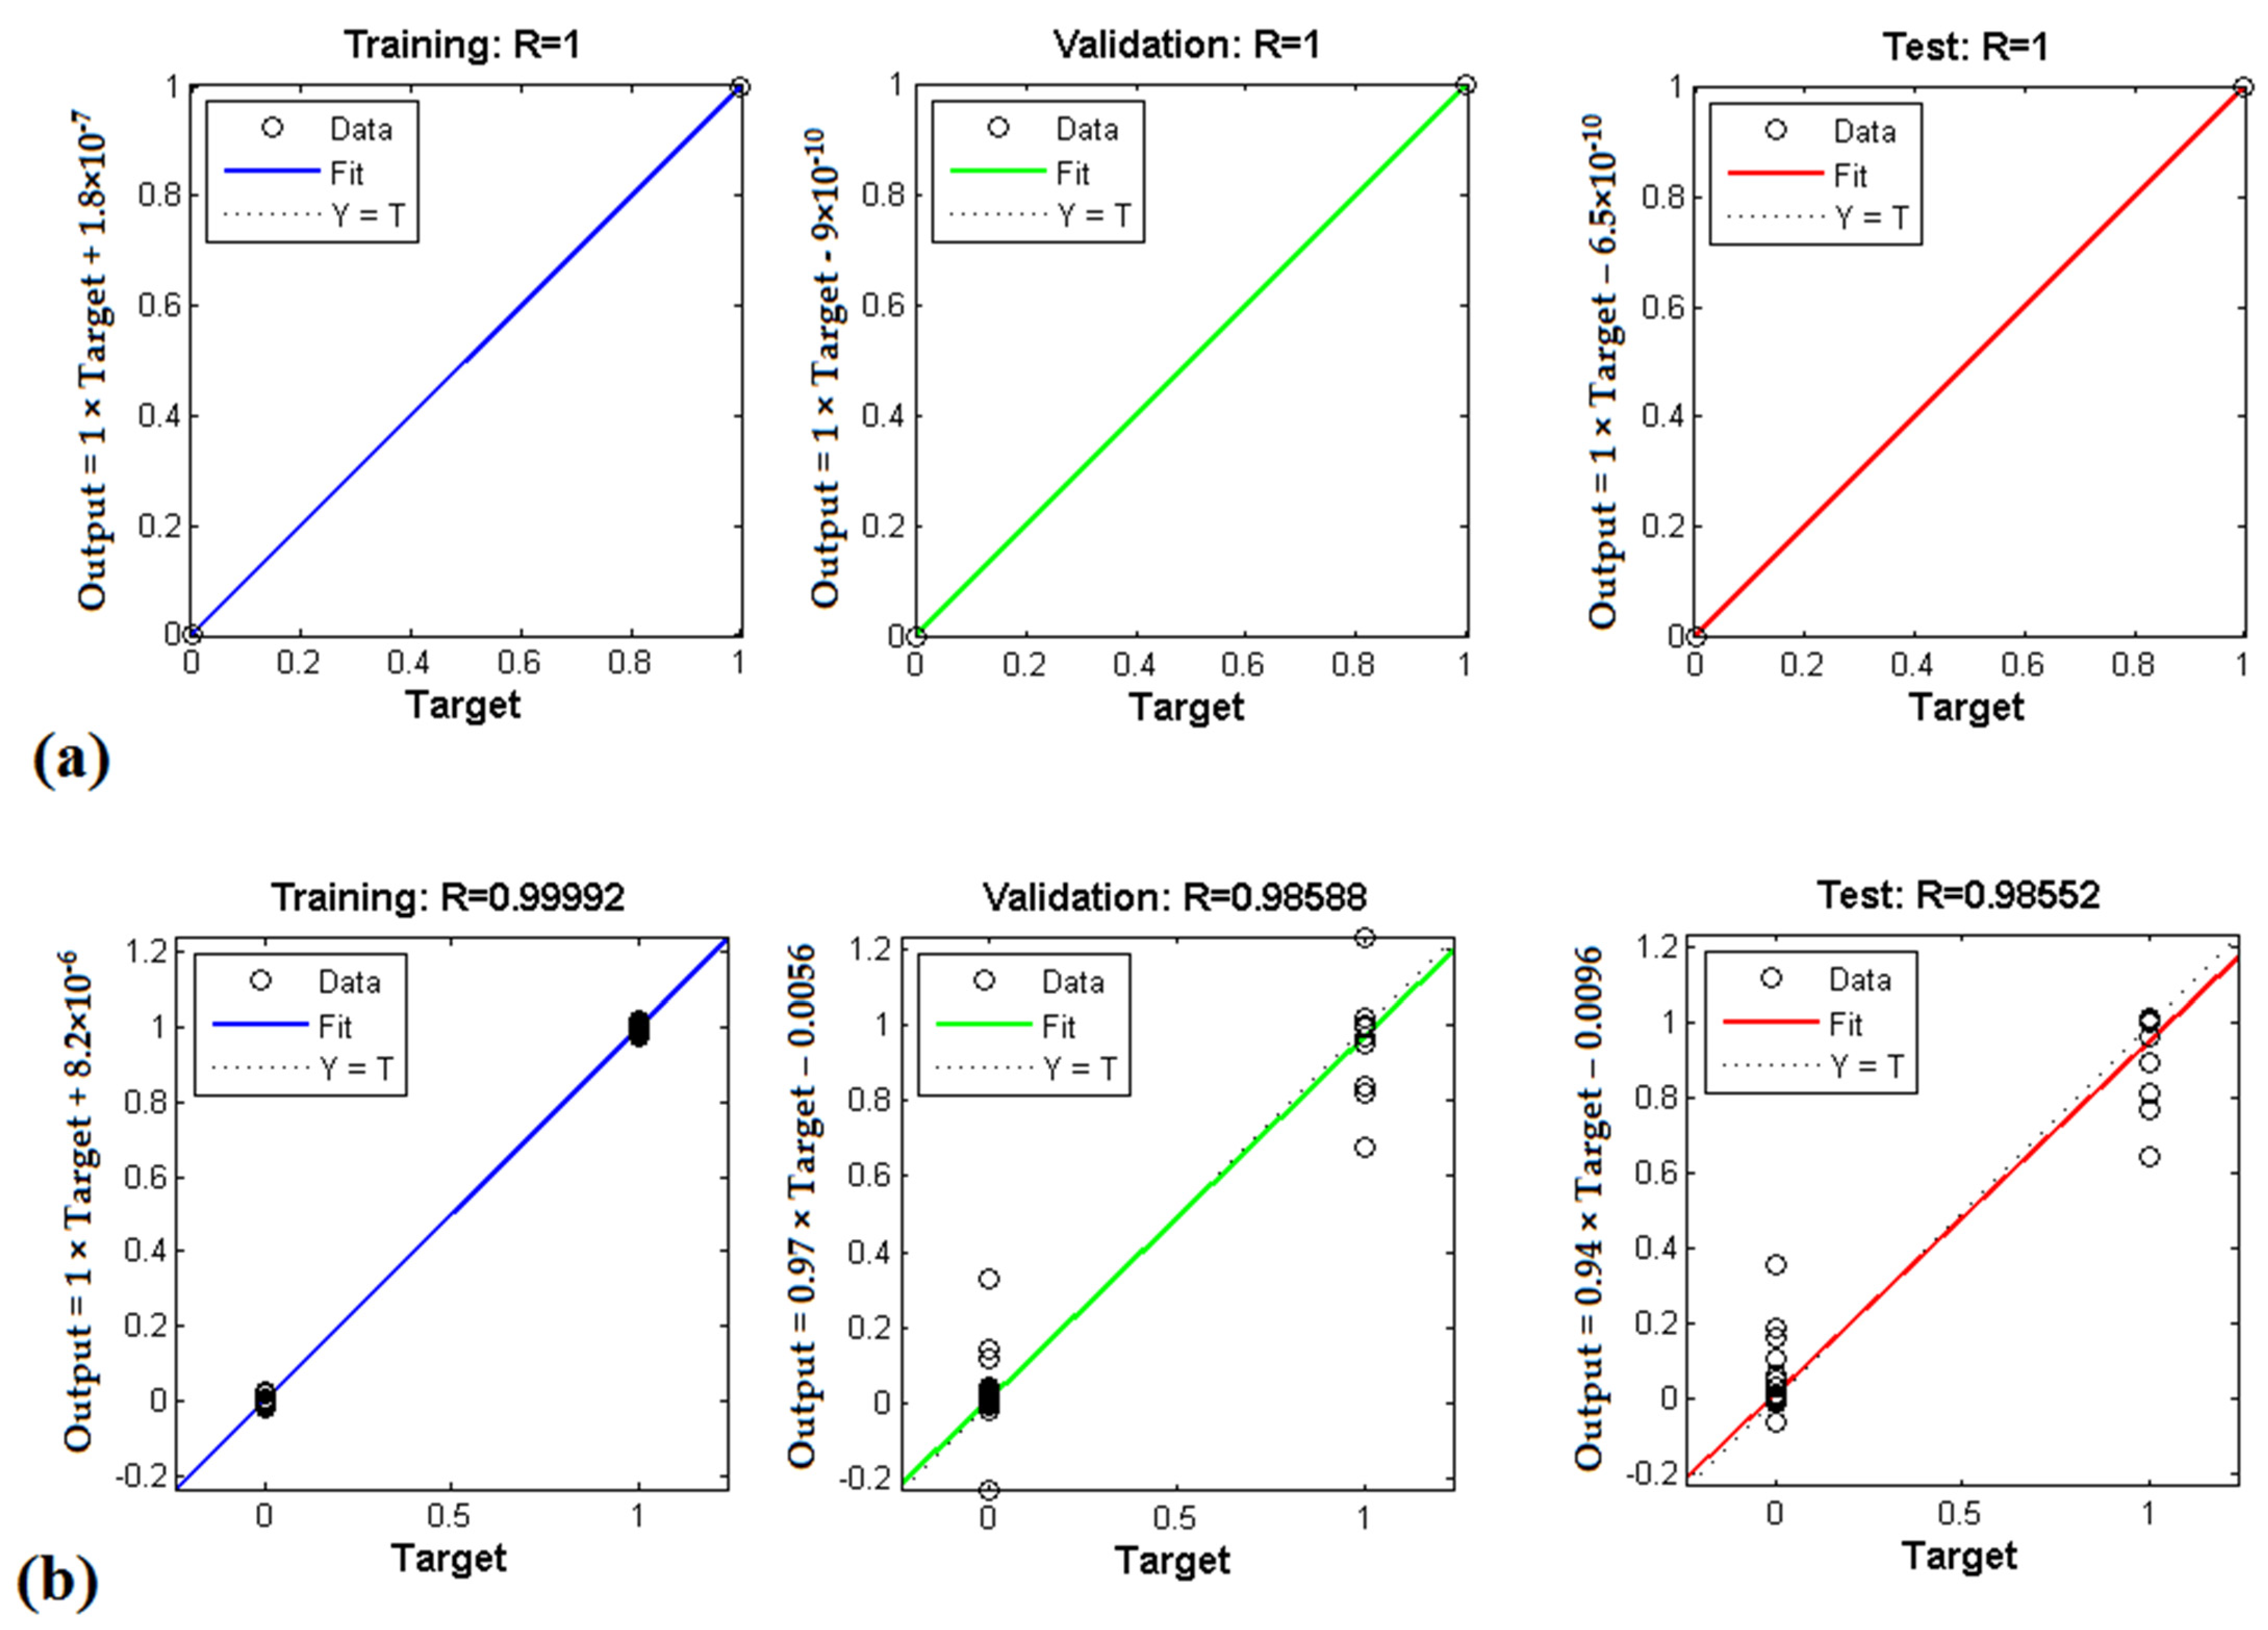
The relationship between electronic nasal signals and essential oil classification was described by PLS and PR models. PLS and PR was used to predict the classification of essential oils. That is, the classification was analyzed based on the type of essential oil, i.e., two-group classification and six-group classification. The performance of PLS and PRM models for classification prediction in terms of R2 and RMSE is shown in Table 1. The highest accuracies, obtained by the PR method (for 2-group classification), for calibration and validation data were 0.977 and 0.965, respectively. The lowest accuracies obtained by the PLS method (for six-group classification) for calibration and validation data were 0.945 and 0.938, respectively. Both PRM and PLS methods showed almost similar and acceptable results for predicting correct classification of essential oils through calibration of machine data.
Calibration data provide indications of how close data points of known samples were to established regression line models, developed using PR and PLS statistical methods. Similarly, validation data provide a measure of how data points from unknown data (sample unknowns) approximate the same classification regression models using each of the two statistical methods. Calibration data are usually more highly correlated with regression models than validation data because the former are based on data from which the model was derived. However, if validation data are only slightly less correlated than calibration data, this indicates that the regression model is an effective estimator or predictor of accurate sample-type classifications based on the subsequent analysis of sample unknowns. If calibration and validation data are not comparable in model correlations, this suggests that the model is not effective or accurate as a predictor for sample classifications.
Table 2 shows the regression models obtained from PR and PLS methods for classifying essential oils. The models are in accordance with Equation (2), in which Y indicates the predicted values (classification), B0 are the equation constant coefficients, S1 to S9 indicate the main components, and (c1 to c6) indicate the coefficients of each predictor variable (sensor signal response).
Y = B0 + c1S1 + c2S2 + c3S3 + c4S4 + c5S5 + c6S6 + c7S7 + c8S8 + c9S9
Due to the different response power of MOS sensors used to classify different samples of essential oils in this system, by selecting the most effective sensors to reduce the cost of making the olfactory machine, reduce the amount of input data, use the minimum number of sensors and class accuracy increased the rating.
The response power of the sensors to different samples of essential oil was evaluated using PRM method. The results PRM analysis and selection of the most effective sensors from the studied gas sensors are summarized in Table 3. Values of coefficient of determination (R2-values) were examined to determine the most effective sensors. This information was useful for selecting specific sensors for possible removal including sensors with R2 values smaller than or equal to 0.6 because the response of the relevant sensor has no direct or acceptable relationship with the change in the type of essential oils. Low R2 values and high RMSE values indicate that individual sensors are not contributing to effective discriminations of essential oil sample types.
Partial least squares (PLS) can efficiently resolve multiple data, correlation, and overlap problems. A comparison of MAU-9 e-nose sensor array performance in the two -group and six-group sample classifications, based on the PLS statistical model, are presented in Table 4. Applying the PLS model to essential oil sample classifications based on data from all nine sensors did not produce a very high level of correlation nor a very low RMSE to indicate high predicted sample-classification accuracy, suggesting the presence of considerable irrelevant information from underperforming sensors that reduced the model’s predictive ability.
Due to the high correlation between measured and predicted values, the PLS method has a high ability to identify the best sensors. Using PLS method, TGS813 and MQ135 show the highest correlation coefficient, corresponds to values presented in Figure 4.

3.3. ANN Analysis

The perceptron neural network was used to classify the essential oils. In the input layer of ANN analysis, preprocessed data were used to classify the essential oils. In the hidden layer for selecting the most efficient number of neurons, the learning phase started with one neuron and stopped in the fifteenth neuron, each learning phase was repeated ten times, and at the end, the average value was calculated. According to the results, the hidden layer with 6 and 8 neurons, using the mean-variance regularized t-Test (MVRT) function, had the lowest RMSE for the 6 and 8 class structure, 0.00721 and 0.0569, respectively, and the highest accuracy with the best performance for the classification of essential oils. Consequently, the neural network with 9-6-2 structure had the highest accuracy for distinguishing the essential oils of fruits from the essential oils of medicinal plants and the structure of 9-8-6 had the highest accuracy in the classification of all essential oils. The structure obtained using the best results for the classification of essential oils based on the type of essential oil (6 groups) and the essential oil family (2 groups) is shown in Figure 5. The logarithmic sigmoid transfer function and Levenberg–Marquardt [39] learning method were used to learn the network.
The results of ANN analysis may be shown as an intended perturbation matrix and the real network output representing the general performance indices of the network. A perturbation matrix displays the desired classification on rows and the predicted classification on columns. Ideally, all specimens should be in diagonal cells of the matrix. The perturbation matrix results from a total of 90 data of essential oil of all samples in the two-group classification, distinguishing essential oils of fruits from herbs, have been acquired correctly and with 100% accuracy as shown previously [33]. In the 6-group classification of all six essential oil types, only one of ninety sample was not correctly identified, indicating a total accuracy of 98.9%. These results are confirmed by the network performance indices presented in Figure 6.
The performance of the ANN models should be evaluated by previously unused test data. The results also show a very good agreement between the expected and measured data presented in Figure 7. According to the regression diagram, the proposed model had high accuracy in two-group and six-group classification. The proximity of the predicted data to the empirical ones (around the regression line) with high R2 indicates the precise evaluation of the ANN in the prediction of these indices.

4. Discussion

We investigated statistical approaches evaluating sensor array components of the MAU-9 e-nose to determine how specific information, relative to the performance and accuracy of individual sensors in providing accurate classifications and discriminations of essential oil sample types, may be used to effectively improve on overall e-nose performance. Statistical methods including PR and PLS were used to evaluate feature extraction, model performance validation, modeling method, and selection of optimal sensors. Based on performance of individual sensors using the PR method, four levels of classification effectiveness, ranging from weak to very high, were defined for assessing performance of sensors in detecting essential oils. Sensor performance also was evaluated using the PLS method. We identified two optimal MOS sensors, MQ135 and TGS813, which performed at very high levels of the sample-classification accuracy. The classification accuracy of these two sensors alone performed better than all nine sensors (collectively) in the MAU-9 sensor array. Thus, classification accuracy was greatly increased by utilizing only high-performing sensors contributing most to discrimination of essential oil sample types. The rationale for explaining this result was that by removing less accurate sensors providing irrelevant information, the accuracy of the statistical model was increased by using only optimal sensors, contributing most to sample discriminations. Fewer high-performing sensors lead to better statistical model performance in terms of accuracy and improved stability or consistency of results.
We utilized two different ANN statistical analysis methods to classify essential oils based on the type of essential oil (six-group) and the essential oil family (two-group). Topologies 2-6-2 and 8-9-6 had the highest accuracy for family and type of essential oil, respectively. Accuracy of neural network confusion matrix classification for two-group and six-group classification was 100% and 98.9, respectively. The ANN classification results presented here for essential oils were better than those obtained in other studies using ANN methods [40,41,42,43,44].
Sanaeifar et al. [35] showed that the coefficient of determination (R2) of multiple linear regression (MLR), and PLS equations in calibration and validation is relatively similar and acceptable for use in combination with the total soluble solids (TSS) index, indicating the total amount of soluble solids dissolved in an aqueous solvent. Zhang et al. [45] used olfactory signals to predict peach stiffness and pH. Their results showed that the PLS model yielded high correlation coefficients and provided strong capabilities for predicting fruit quality indicators. Karami et al. [37] detected oxidized and non-oxidized oils using the PLS method with 99% accuracy. Ghasemi-Varnamkhasti et al. [46] also utilized the PLS method to classify cultivars of caraway plant with 100% accuracy. Furthermore, Mabood et al. [47] used the PLS method to predict different percentages of fraud in commercial sweeteners in fruit juices.
Evaluations of the relationship between sample volume and sensor intensity relative to pine essential oil composition using electronic noses with discriminant function analysis (DFA) were studied previously [48]. The results indicated that the combination of 11 specific electronic nose sensors increased the RMSE value from 14.65 to 6.80% and R2 from 0.674 to 0.915, compared to single-regression prediction models. Rasekh and Karami [38] detected fraud in pure and industrial fruit juices using a MOS electronic nose and showed that this e-nose in combination with ANN could be an efficient tool for the rapid and nondestructive classification of pure and industrial juices. Borowik et al. [20] proposed solutions for odor detection using an e-nose with a reduced sensor array. Many different e-nose technologies have been used with various statistical methods to discriminate volatile emissions from a wide variety of fruit types [49].
Zou and Lv [50] optimized an electronic nose system in terms of data preprocessing and pattern recognition. They used the recurrent neural network (RNN) to identify the signature pattern and to ensure accuracy and stability. Due to the preprocessing of high-dimensional data, they used the locally linear embedding (LLE) method to reduce the dimensions. The experiments were performed based on real sensor drift data set and the results showed that the proposed optimization mechanism not only had stability and higher accuracy, but also had a shorter response time than the three baselines. The results also demonstrated the efficiency of the RNN model in terms of reminder ratio or accuracy ratio.
Previous studies have demonstrated that sensor outputs from some e-nose sensor arrays are influenced by environmental factors, particularly humidity, temperature, and air pollutants [51]. A carbon filter was used in the current study to remove any contaminating hydrocarbon pollutants in reference air that could affect sensor responses. All experiments were performed under constant temperature and humidity conditions. Consequently, the effects of ambient-air parameters on sensor array responses of the MAU-9 e-nose were considered negligible.

5. Conclusions

The process of optimizing e-nose sensor array performance, by identifying sensors that are contributing the most to aroma discriminations and eliminating sensors that do not contribute significantly to sample classifications, is an effective means of improving on the efficiency and accuracy of VOC-based aroma classifications. We have provided evidence to demonstrate that e-nose sensor-array optimization, through a statistical evaluation of individual sensor performance, based on single-sensor contributions to sample discriminations, is an effective approach to improve on overall e-nose performance and accuracy.
An electronic-nose system usually includes a gas sensor array, data preprocessing, and pattern recognition components. Most studies involving improvements of e-nose devices have focus on broadening e-nose applications and have largely disregarded potential advancements through modifications of internal components to improve on instrument accuracy and effectiveness in sample discriminations. Recent advances in olfactory machines have led to new developments in both sensor and feature extraction, as well as data-processing techniques, providing more information on the aroma properties of sample analytes. Therefore, feature selection has become essential in the development of effective e-nose applications. Statistical techniques such as PR and PLS have been used to help solve the problem of sensor optimization, based on selecting the minimal number of sensors and features required for competent sample discrimination. In this way, optimal application-specific sensor arrays can be developed within e-nose devices at lower cost [13,52], but with improved effectiveness in discriminating between samples of specific types for which new olfactory devices are designed. However, a balance must be obtained between minimizing sensor numbers for optimizing performance and reducing cost (on one side) with larger and more diverse sensor arrays required for capabilities of discriminating between a wide range of sample types consisting of VOC emissions from many chemical classes [53].
Our results indicate that the MAU-9 MOS electronic nose is a potentially useful and effective tool for classifying purified essential oils added to or used in commercial plant products. This method, based on the rapid evaluation of VOC emissions, is relatively simple and does not require the separation or identification of volatile-emission components. We have found that modifications in the MAU-9 sensor-array components through sensor removal, substitutions, or replacements of low-performing sensors can improve overall e-nose performance and accuracy in sample discriminations. Modifying e-nose sensor-array components can significantly improve the effectiveness of the instrument in facilitating enforcement of regulatory quality assurance (QA) for authentication of plant product genuineness and quality. The possibility of building special-application electronic noses for specific purposes, based on fewer sensors targeting the detection of specific aromas and VOC chemical classes, has not been a strategy commonly used by sensor manufacturers.

Author Contributions

The contributions of individual authors to this study and manuscript are as follows: individual contributions include conceptualization methodology H.K., software, statistical analysis and data validation H.K.; formal analysis, H.K.; investigation, H.K.; resources, H.K., M.R.; data curation H.K.; writing—original draft preparation, H.K.; writing—review and editing, A.D.W., M.G., funding acquisition, M.R. All authors have read and agreed to the published version of the manuscript.

Funding

This research received no external funding. All research funding was provided by the University of Mohaghegh Ardabili, Department of Biosystems Engineering.

Institutional Review Board Statement

Not applicable.

Informed Consent Statement

Not applicable.

Data Availability Statement

The data presented in this study are available on request from the corresponding author.

Acknowledgments

The authors wish to thank Guest Editor, Simonetta Capone, Institute for Microelectronics and Microsystems, National Research Council (CNR-IMM), Lecce, Italy, for the invitation to submit this article to the Chemosensors journal Special Issue, entitled “Recent Advances in Multifunctional Sensing Technology for Gas Analysis”. This has provided an opportunity to report on the capabilities of the MAU-9 experimental electronic-nose system to detect counterfeit and adulterated products in commercial markets and to further improve on the MAU-9 e-nose system performance as presented in this paper.

Conflicts of Interest

The authors declare no conflict of interest.

Appendix A. Supplementary Sensor Raw Output, Essential Oils Data from the MAU-9 MOS E-Nose System

Figure A1. The aroma signatures (smellprint patterns) resulting from nine sensor-output responses of the MAU-9 electronic-nose system to aroma VOC-emissions of purified and concentrated herb and fruit essential oil samples. Sensor-array output pattern responses to individual plant essential oil sample types are as follows: (a) tarragon, (b) mint, (c) thyme, (d) mango, (e) orange and (f) lemon.
Chemosensors 09 00243 g0a1

Appendix B. Definitions of Statistical Methods and Algorithms (with Associated Acronyms)

Artificial neural network (ANN)—Computing systems inspired by biological neural networks, composed of a collection of connected nodes (artificial neurons) which loosely model the neurons and functions of a biological brain in data analysis and classification.
Area under the curve (AUC)—Specifically refers to area under the Receiver Operating Characteristic (ROC) curve statistic, which is a graphical plot illustrating the diagnostic ability (predictability) of a binary classifier system or model (of diagnostic or classification data) as its discrimination threshold is varied.
Coefficient of determination (R2)—The proportion of the variation in the dependent variable that is predictable from the independent variable(s).
Correlation coefficient (R)—A calculated number (between −1 and +1) that represents the linear or quadratic dependence relationship of two variables or sets of data that indicates level (or correlation) of statistical-model fitness.
Discriminant function analysis (DFA)—A multivariate test of differences between defined groups used to classify unknown samples based on probabilities for classification into a certain group (aroma class).
Levenberg–Marquardt algorithm—Method used to solve non-linear, least-squares minimization problems for data-model curve fitting; also known as the damped least-squares (DLS) method.
Multiple linear regression (MLR)—A multiple regression technique that uses several explanatory variables to predict the outcome of a response variable, and to determine which of many potential explanatory variables are important predictors for a given response variable.
Mean-variance regularized t-Test (MVRT)—A mathematical function for calculating the mean-variance t-test statistic and its significance (p-Value) under sample-group homoscedasticity or heteroscedasticity assumptions.
Partial least square (PLS)—An efficient and optimal regression method based on covariance that reduces predictors to a smaller set of uncorrelated components and performs least squares regression on these components, instead of on the original data.
Pattern recognition algorithms—An automated procedure for recognition of data patterns and regularities used in statistical analysis and signal processing. In artificial olfaction (e-nose analysis), the method is applied by assigning multiple data sensor-input values (from unknown samples) to defined (known) aroma classes, previously established in an aroma (smellprint) database library.
Principal component analysis (PCA)—A method for reducing dimensionality of datasets to increasing interpretability, minimize information loss, and create new uncorrelated variables that successively maximize variance.
Principal regression (PR)—A regression analysis technique based on principal component analysis (PCA), used for estimating the unknown regression coefficients in a standard linear regression model; also known as principal component regression (PCR).
Root mean square error (RMSE)—The standard deviation of the residuals (prediction errors). Residuals are a collective measure of how far individual data points diverge from the model regression line.

References

  1. Ali, M.M.; Hashim, N.; Abd Aziz, S.; Lasekan, O. Principles and recent advances in electronic nose for quality inspection of agricultural and food products. Trends Food Sci. Technol. 2020, 99, 1–10. [Google Scholar] [CrossRef]
  2. Tan, J.; Xu, J. Applications of electronic nose (e-nose) and electronic tongue (e-tongue) in food quality-related properties determination: A review. Artif. Intell. Agric. 2020, 4, 104–115. [Google Scholar] [CrossRef]
  3. Wilson, A.D. Diverse applications of electronic nose technologies in agriculture and forestry. Sensors 2013, 13, 2295–2348. [Google Scholar] [CrossRef] [PubMed] [Green Version]
  4. Ottoboni, M.; Pinotti, L.; Tretola, M.; Giromini, C.; Fusi, E.; Rebucci, R.; Grillo, M.; Tassoni, L.; Foresta, S.; Gastaldello, S.; et al. Combining e-nose and lateral flow immunoassays (LFIAs) for rapid occurrence/co-occurrence aflatoxin and fumonisin detection in maize. Toxins 2018, 10, 416. [Google Scholar] [CrossRef] [PubMed] [Green Version]
  5. Timsorn, K.; Lorjaroenphon, Y.; Wongchoosuk, C. Identification of adulteration in uncooked jasmine rice by a portable low-cost artificial olfactory system. Measurement 2017, 108, 67–76. [Google Scholar] [CrossRef]
  6. Karami, H.; Rasekh, M.; Mirzaee-Ghaleh, E. Comparison of chemometrics and AOCS official methods for predicting the shelf life of edible oil. Chemom. Intell. Lab. Syst. 2020, 206, 104165. [Google Scholar] [CrossRef]
  7. Peris, M.; Escuder-Gilabert, L.A. 21st century technique for food control: Electronic noses. Anal. Chim. Acta 2009, 638, 1–15. [Google Scholar] [CrossRef]
  8. Wilson, A.D.; Baietto, M. Applications and advances in electronic nose technologies. Sensors 2009, 9, 5099–5148. [Google Scholar] [CrossRef]
  9. Hernández-Mesa, M.; Escourrou, A.; Monteau, F.; Le Bizec, B.; Dervilly-Pinel, G. Current applications and perspectives of ion mobility spectrometry to answer chemical food safety issues. TrAC 2017, 94, 39–53. [Google Scholar] [CrossRef]
  10. Wilson, A.D. Review of electronic-nose technologies and algorithms to detect hazardous chemicals in the environment. Proc. Technol. 2012, 1, 453–463. [Google Scholar] [CrossRef] [Green Version]
  11. Kafle, G.K.; Khot, L.R.; Sankaran, S.; Bahlol, H.Y.; Tufariello, J.A.; Hill, H.H. State of ion mobility spectrometry and applications in agriculture: A review. Eng. Agric. Environ. Food 2016, 9, 346–357. [Google Scholar] [CrossRef]
  12. Gancarz, M.; Malaga-Toboła, U.; Oniszczuk, A.; Tabor, S.; Oniszczuk, T.; Gawrysiak-Witulska, M.; Rusinek, R. Detection and measurement of aroma compounds with the electronic nose and a novel method for MOS sensor signal analysis during the wheat bread making process. Food Bioprod. Process. 2021, 127, 90–98. [Google Scholar] [CrossRef]
  13. Wilson, A.D. Applications of electronic-nose technologies for noninvasive early detection of plant, animal and human diseases. Chemosensors 2018, 9, 45. [Google Scholar] [CrossRef] [Green Version]
  14. Rusinek, R.; Gawrysiak-Witulska, M.; Siger, A.; Oniszczuk, A.; Ptaszyńska, A.A.; Knaga, J.; Malaga-Toboła, U.; Gancarz, M. Effect of supplementation of flour with fruit fiber on the volatile compound profile in bread. Sensors 2021, 21, 2812. [Google Scholar] [CrossRef] [PubMed]
  15. Wilson, A.D. Noninvasive early disease diagnosis by electronic-nose and related VOC-detection devices. Biosensors 2020, 10, 73. [Google Scholar] [CrossRef] [PubMed]
  16. Wilson, A.D.; Baietto, M. Advances in electronic-nose technologies developed for biomedical applications. Sensors 2011, 11, 1105–1176. [Google Scholar] [CrossRef]
  17. Camardo Leggieri, M.; Mazzoni, M.; Fodil, S.; Moschini, M.; Bertuzzi, T.; Prandini, A.; Battilani, P. An electronic nose supported by an artificial neural network for the rapid detection of aflatoxin B1 and fumonisins in maize. Food Control 2021, 123, 107722. [Google Scholar] [CrossRef]
  18. Zhang, L.; Tian, F.; Zhang, D. Book Review and Future Work. In Electronic Nose: Algorithmic Challenges; Springer: Singapore, 2018; pp. 335–339. [Google Scholar]
  19. Goodner, K.L.; Dreher, J.G.; Rouseff, R.L. The dangers of creating false classifications due to noise in electronic nose and similar multivariate analyses. Sens. Actuators B Chem. 2001, 80, 261–266. [Google Scholar] [CrossRef]
  20. Borowik, P.; Adamowicz, L.; Tarakowski, R.; Siwek, K.; Grzywacz, T. Odor detection using an e-nose with a reduced sensor array. Sensors 2020, 20, 3542. [Google Scholar] [CrossRef] [PubMed]
  21. Phaisangittisagul, E.; Nagle, H.T. Sensor selection for machine olfaction based on transient feature extraction. IEEE Trans. Instrum. Meas. 2008, 57, 369–378. [Google Scholar] [CrossRef]
  22. Phaisangittisagul, E.; Nagle, H.T.; Areekul, V. Intelligent method for sensor subset selection for machine olfaction. Sens. Actuators B Chem. 2010, 145, 507–515. [Google Scholar] [CrossRef]
  23. Guo, D.; Zhang, D.; Zhang, L. An LDA based sensor selection approach used in breath analysis system. Sens. Actuators B Chem. 2011, 157, 265–274. [Google Scholar] [CrossRef]
  24. Geng, Z.; Yang, F.; Wu, N. Optimum design of sensor arrays via simulation-based multivariate calibration. Sens. Actuators B Chem. 2011, 156, 854–862. [Google Scholar] [CrossRef]
  25. Zhang, L.; Tian, F.; Pei, G. A novel sensor selection using pattern recognition in electronic nose. Measurement 2014, 54, 31–39. [Google Scholar] [CrossRef]
  26. Miao, J.; Zhang, T.; Wang, Y.; Li, G. Optimal sensor selection for classifying a set of ginsengs using metal-oxide sensors. Sensors 2015, 15, 16027–16039. [Google Scholar] [CrossRef] [PubMed] [Green Version]
  27. Sun, H.; Tian, F.; Liang, Z.; Sun, T.; Yu, B.; Yang, S.X.; He, Q.; Zhang, L.; Liu, X. Sensor array optimization of electronic nose for detection of bacteria in wound infection. IEEE Trans. Ind. Electron. 2017, 64, 7350–7358. [Google Scholar] [CrossRef]
  28. Llobet, E.; Ionescu, R.; Al-Khalifa, S.; Brezmes, J.; Vilanova, X.; Correig, X.; Barsan, N.; Gardner, J.W. Multicomponent gas mixture analysis using a single tin oxide sensor and dynamic pattern recognition. IEEE Sens. J. 2001, 1, 207–213. [Google Scholar] [CrossRef]
  29. Szczurek, A.; Krawczyk, B.; Maciejewska, M. VOCs classification based on the committee of classifiers coupled with single sensor signals. Chemom. Intell. Lab. Syst. 2013, 125, 1–10. [Google Scholar] [CrossRef]
  30. Szczurek, A.; Maciejewska, M. “Artificial sniffing” based on induced temporary disturbance of gas sensor response. Sens. Actuators B Chem. 2013, 186, 109–116. [Google Scholar] [CrossRef]
  31. Hossein-Babaei, F.; Amini, A. Recognition of complex odors with a single generic tin oxide gas sensor. Sens. Actuators B Chem. 2014, 194, 156–163. [Google Scholar] [CrossRef]
  32. Herrero-Carrón, F.; Yáñez, D.J.; de Borja Rodríguez, F.; Varona, P. An active, inverse temperature modulation strategy for single sensor odorant classification. Sens. Actuators B Chem. 2015, 206, 555–563. [Google Scholar] [CrossRef]
  33. Rasekh, M.; Karami, H.; Wilson, A.D.; Gancarz, M. Classification and identification of essential oils from herbs and fruits based on a MOS electronic-nose technology. Chemosensors 2021, 9, 142. [Google Scholar] [CrossRef]
  34. Karami, H.; Rasekh, M.; Mirzaee-Ghaleh, E. Application of the e-nose machine system to detect adulterations in mixed edible oils using chemometrics methods. J. Food Process. Preserv. 2020, 44, e14696. [Google Scholar] [CrossRef]
  35. Sanaeifar, A.; Mohtasebi, S.S.; Ghasemi-Varnamkhasti, M.; Ahmadi, H. Application of MOS based electronic nose for the prediction of banana quality properties. Measurement 2016, 82, 105–114. [Google Scholar] [CrossRef]
  36. Abu-Khalaf, N. Identification and quantification of olive oil quality parameters using an electronic nose. Agriculture 2021, 11, 674. [Google Scholar] [CrossRef]
  37. Karami, H.; Rasekh, M.; Mirzaee-Ghaleh, E. Qualitative analysis of edible oil oxidation using an olfactory machine. J. Food Meas. Charact. 2020, 14, 2600–2610. [Google Scholar] [CrossRef]
  38. Rasekh, M.; Karami, H. E-nose coupled with an artificial neural network to detection of fraud in pure and industrial fruit juices. Int. J. Food Prop. 2021, 24, 592–602. [Google Scholar] [CrossRef]
  39. Ozyildirim, B.M.; Mariam, K. Levenberg-Marquardt multi-classification using hinge loss function. Neural. Netw. 2021, 143, 564–571. [Google Scholar] [CrossRef]
  40. Wei, Z.; Wang, J.; Liao, W. Technique potential for classification of honey by electronic tongue. J. Food Eng. 2009, 94, 260–266. [Google Scholar] [CrossRef]
  41. Kiani, S.; Minaee, S.; Ghasemi-Varnamkhasti, M. Integration of computer vision and electronic nose as non-destructive systems for saffron adulteration detection. Comput. Electron. Agric. 2017, 141, 46–53. [Google Scholar] [CrossRef]
  42. Lerma-García, M.J.; Simó-Alfonso, E.F.; Bendini, A.; Cerretani, L. Metal oxide semiconductor sensors for monitoring of oxidative status evolution and sensory analysis of virgin olive oils with different phenolic content. Food Chem. 2009, 117, 608–614. [Google Scholar] [CrossRef]
  43. Rasekh, M.; Karami, H. Application of electronic nose with chemometrics methods to the detection of juices fraud. J. Food Process. Preserv. 2021, 45, e15432. [Google Scholar] [CrossRef]
  44. Karami, H.; Rasekh, M.; Mirzaee–Ghaleh, E. Identification of olfactory characteristics of edible oil during storage period using metal oxide semiconductor sensor signals and ANN methods. J. Food Process. Preserv. 2021, 45, e15749. [Google Scholar] [CrossRef]
  45. Zhang, X.; Liu, F.; He, Y.; Li, X. Application of hyperspectral imaging and chemometric calibrations for variety discrimination of maize seeds. Sensors 2012, 12, 17234–17246. [Google Scholar] [CrossRef] [PubMed]
  46. Ghasemi-Varnamkhasti, M.; Tohidi, M.; Mishra, P.; Izadi, Z. Temperature modulation of electronic nose combined with multi-class support vector machine classification for identifying export caraway cultivars. Postharvest Biol. Technol. 2018, 138, 134–139. [Google Scholar] [CrossRef]
  47. Mabood, F.; Hussain, J.; Jabeen, F.; Abbas, G.; Allaham, B.; Albroumi, M.; Alghawi, S.; Alameri, S.; Gilani, S.A.; Al-Harrasi, A.; et al. Applications of FT-NIRS combined with PLS multivariate methods for the detection & quantification of saccharin adulteration in commercial fruit juices. Food Addit. Contam. Part A 2018, 35, 1052–1060. [Google Scholar] [CrossRef]
  48. Lias, S.; Mohamad Ali, N.A.; Jamil, M.; Tolmanan, M.S.Y.; Misman, M.A. A study on the application of electronic nose coupled with DFA and statistical analysis for evaluating the relationship between sample volumes versus sensor intensity of agarwood essential oils blending ratio. MATEC Web Conf. 2018, 201, 2008. [Google Scholar] [CrossRef]
  49. Baietto, M.; Wilson, A.D. Electronic-nose applications for fruit identification, ripeness, and quality grading. Sensors 2015, 15, 899–931. [Google Scholar] [CrossRef] [PubMed]
  50. Zou, Y.; Lv, J. Using recurrent neural network to optimize electronic nose system with dimensionality reduction. Electronics 2020, 9, 2205. [Google Scholar] [CrossRef]
  51. Wei, P.; Ning, Z.; Ye, S.; Sun, L.; Yang, F.; Wong, K.C.; Westerdahl, D.; Louie, P.K.K. Impact analysis of temperature and humidity conditions on electrochemical sensor response in ambient air quality monitoring. Sensors 2018, 18, 59. [Google Scholar] [CrossRef] [Green Version]
  52. Wilson, A.D. Recent progress in the design and clinical development of electronic-nose technologies. Nanobiosens. Dis. Diagn. 2016, 5, 15–27. [Google Scholar] [CrossRef] [Green Version]
  53. Wilson, A.D.; Lester, D.G.; Oberle, C.S. Development of conductive polymer analysis for the rapid detection and identification of phytopathogenic microbes. Phytopathology 2004, 94, 419–431. [Google Scholar] [CrossRef] [PubMed]
Figure 1. Schematic and photograph of an artificial olfactory (e-nose) system, arranged in tandem, for introduction of essential oil VOCs, used for gas-sample analysis. The components of this system consist of the following parts (listed in order and direction of air flow as follows). Ambient air first enters (a) air filter (activated charcoal to remove ambient-air VOC hydrocarbons), then yellow line to (b) sample headspace chamber, and (c) solenoid air valves (13), then (d) diaphragm pump, (green line) to (e) e-nose sensor array chamber, (f) data acquisition recorder and wireless transmission card, (g) personal computer (PC) and (h), air outlet (red line) from sensor array chamber (for exhaust gases). Filtered air from air filter (blue line) alternatively passes to the e-nose sensor array chamber (via Solenoid air valve) during air-cleanse purges between samples.
Chemosensors 09 00243 g001
Figure 2. Radar graph of sensor relative-intensity responses to different types of essential oils obtained from sensor array output of MAU-9 MOS e-nose.
Chemosensors 09 00243 g002
Figure 3. Example of MAU-9 e-nose sensor array output response (+/− 1-standard deviation), indicated by individual sensor responses to essential oil sample VOC emissions in headspace, to form a bar graph smellprint pattern.
Chemosensors 09 00243 g003
Figure 4. High performance of individual sensors with potential for classifying and differentiating between VOC emissions from different essential oil sample types. Linear correlation of predicted vs. actual (reference) sample classification by the best high performing and most discriminating individual sensors from the MAU-9 sensor array: (a) Sensor MQ135 and (b) Sensor TGS813 with associated linear regression statistical analysis results displayed for each sensor.
Chemosensors 09 00243 g004
Figure 5. The ANN structure developed for classification and identification of essential oil sample types from e-nose output data. Separate methods with a different number of hidden layer nodes were used for: (a) 2-group classification (for discriminating between fruit and herbal essential oil types), and (b) 6-group classification (for discriminating between all six essential oil sample types analyzed).
Chemosensors 09 00243 g005
Figure 6. Performance parameters of ANN models for 6-group essential oils classification.
Chemosensors 09 00243 g006
Figure 7. Linear regression correlation of target (expected) vs. output (actual) values from ANN-structured analyses for predicted and measured data for: (a) 2-group, (b) 6-group essential oil aroma classifications.
Chemosensors 09 00243 g007
Table 1. Results of principal regression and partial least square models for sample classification prediction based on e-nose output 2.
Sample ClassificationModel 1R 2RMSEOffset
CalibrationValidationCalibrationValidationCalibrationValidation
2-groupPR0.9770.9651.0851.1221.9752.252
PLS0.9560.9451.0051.2151.6172.325
6-groupPR0.9670.9531.9682.1382.0832.694
PLS0.9450.9382.0362.5621.9952.564
1 Statistical analysis model abbreviations: PR = principal regression; PLS = partial least square. 2 Model output statistical value abbreviations: R2 = coefficient of determination; RMSE = root mean square error.
Table 2. The regression coefficients estimated by principal regression and partial least square models.
Coefficients of Predictor Variables 3 (for Individual MOS Sensors in MAU-9 Sensor Array)
Sample ClassificationModel 1B0 2MQ9
c1
MQ4
c2
MQ135
c3
MQ8
c4
TGS2620
c5
MQ136
c6
TGS813
c7
TGS822
c8
MQ3
c9
2-groupPR0.022−10.3−4.83.24−11.7−14.7−14.9−3.5−12.1−13.6
PLS0.0929.674.3−2.7812.314.39.33.3−4.71.24
6-groupPR0.0191.681010.9−21.6−8.74.11.87−20.916.7
PLS0.0451.5717.611.7−12.710.25.801.88−11.8−7.50
1 Statistical analysis model abbreviations: PR = principal regression; PLS = partial least square. 2 Equation constant coefficients: B0 values. 3 Sensor-output variables: MQ# and TGS# = sensor names; c# = predictor variable coefficients.
Table 3. Principal-regression model analysis results for individual sensors of the MAU-9 sensor array.
Sensor No.Sensor NameR2valR2calRMSEvalRMSEcalSample Discrimination 1
(SD) Contribution
1MQ-90.8910.8930.11220.1257High
2MQ40.5250.5270.54250.5469Low
3MQ1350.9990.9990.00500.0056Very high
4MQ80.7440.7460.12350.1239Moderate
5TGS26200.8540.8550.18530.1893High
6MQ-1360.8550.8560.12010.1205High
7TGS8130.9990.9990.00500.0053Very high
8TGS8220.8550.8560.13490.1359High
9MQ30.7010.7000.19200.1934Moderate
Principal-regression model output statistical abbreviations: R2 = coefficient of determination; RMSE = root mean square error; val = validation; cal = calibration (values) 1 Sample Discrimination (SD) indicates a rating of how well an individual sensor contributed to sample discrimination.
Table 4. Comparison of MAU-9 e-nose sensor sample-classification performance based on partial least square statistical model.
Sample ClassificationAll Sensors (R1-R9) 1High-Performing Sensors (MQ135, TGS813) 1
Calibration SetPrediction SetCalibration SetPrediction Set
R2RMSER2RMSE
2-group0.9450.2150.9990.0050
6-group0.9380.1620.9990.0056
1 Model output statistical value abbreviations: R2 = coefficient of determination; RMSE = root mean square error.
Publisher’s Note: MDPI stays neutral with regard to jurisdictional claims in published maps and institutional affiliations.

