Article

Study of Photoregeneration of Zinc Phthalocyanine Chemiresistor after Exposure to Nitrogen Dioxide

1
Department of Physics and Measurements, University of Chemistry and Technology Prague, Technická 5, 166 28 Prague, Czech Republic
2
Department of Surface and Plasma Science, Faculty of Mathematics and Physics, Charles University, V Holešovičkách 2, 180 00 Prague, Czech Republic
3
Institut Matériaux, Microélectronique, Nanosciences de Provence IM2NP UMR-CNRS 7334, Aix Marseille Université, Université de Toulon, Yncréa Méditerranée, Maison du Numérique et de L’innovation, Place G. Pompidou, 83000 Toulon, France
*
Authors to whom correspondence should be addressed.
Chemosensors 2021, 9(9), 237; https://doi.org/10.3390/chemosensors9090237
Submission received: 8 July 2021 / Revised: 17 August 2021 / Accepted: 19 August 2021 / Published: 24 August 2021
(This article belongs to the Special Issue Functionalized Materials for Chemosensor Applications)

Abstract

:
In this work, we present a complex study of photoregeneration of a zinc phthalocyanine (ZnPc) sensor by illumination from light-emitting diodes (LEDs). It includes an investigation of photoregeneration effectivity for various wavelengths (412–723 nm) of incident light carried out at sensor operating temperatures of 55 °C. It is demonstrated that the efficiency of photoregeneration is increasing with a decrease in the light wavelength. In the region of longer wavelengths (723–630 nm), the regeneration degree (RD) was low and ranged from 12% to 15%. In the region of shorter wavelengths (518–412 nm), the RD rose from 35% for 518 nm to 94% for 412 nm. The efficiency of photoregeneration is also shown to be higher in comparison with the temperature regeneration efficiency. In order to understand the chemism of photoregeneration processes, the electrical measurements are supplemented with Raman and near-ambient pressure X-ray photoelectron spectroscopy (NAP-XPS) studies. The spectroscopic results showed that nitrogen dioxide bonds to the Zn atom in ZnPc in the form of NO2 and NO, i.e., partial decomposition of NO2 molecules occurs during the interaction with the surface. NAP-XPS spectra proved that light illumination of the ZnPc surface is essential for almost complete desorption of NOx species. At the same time, it is demonstrated that in case of long-time exposure or exposure of a ZnPc chemiresistor with a high concentration of NO2, the oxygen, released due to the NO2 decomposition, slowly but irreversibly oxidizes the layer. This oxidation process is most probably responsible for the sensor deactivation observed in sensor experiments with high NO2 concentrations. Based on these studies, the mechanism of nitrogen dioxide interaction with zinc phthalocyanine both under LED illumination and in dark conditions is proposed, and a special method for the sensor operation called “constant exposure dose” is established.

Graphical Abstract

1. Introduction

Metal-phthalocyanines (MPcs) belong to a class of organic frameworks hosting metallic ion in the center [1]. They consist of four isoindole groups connected by nitrogen atoms forming an 18 π-electron ring structure, with two covalent bonds and two coordination bonds chelating a metal or metalloid center [2]. By varying the valency of hosting ion, it is possible to tune the chemical properties of MPcs that result in their wide applications in different fields. They are the most frequently used colorants with broad applications in automotive paints and printing inks for textiles and paper [3]. Besides the colorant applications, they also have a great potential for many high-tech applications, including solar cells [4], catalysis [5], and gas sensors [6,7]. Phthalocyanine and metal-phthalocyanine thin films, in particular, proved many times their high sensitivity to NO2, which makes them very promising candidates for the detection or monitoring of this pollutant in real applications [8,9,10,11,12,13]. Nevertheless, several drawbacks such as long response/recovery times, low reproducibility, or short sensor lifetimes have to be mentioned, too. Consequently, these qualities led to efforts to optimize working conditions and sensor operating procedures in order to maximize the overall performance.
To overcome problems connected with the mentioned drawbacks, it is crucial to understand the mechanism of interaction between metal phthalocyanines and nitrogen dioxide. The most fundamental insights into the process were gained by studying phthalocyanine single crystals [14], mainly due to the elimination of the majority of morphological effects. The single-crystal conductivity of different metal phthalocyanines (ZnPc, MnPc, CoPc, NiPc, CuPc, PbPc, and H2Pc) is believed to be a surface phenomenon with an approximately exponential dependence on NO2 concentration (up to about 103 Pa corresponding to the concentration of 10,000 ppm (parts per million, 1 ppm = 10−6 L of NO2 diluted in one liter of air) when present in common atmosphere). The desorption of NO2 was found to be reversible for ZnPc, NiPc, CuPc, H2Pc, CoPc, and MnPc, but it required an elevated temperature (150–250 °C) and vacuum conditions [14]. Kinetics of the detection process was found to follow the Elovich equation (Equation (1)—differential form, Equations (2) and (3)—integrated form [10]), which is used for the description of adsorption phenomena on surfaces with energetically heterogeneous adsorption sites.
d θ d t = a e b θ ,
θ = 2.3 b l o g ( a · b ) + l o g ( t + t 0 ) ,
t 0 = 1 a · b e b θ 0
In these relations, θ(0) is (initial) surface coverage of phthalocyanine by NO2, and t(0) is time. The symbols a and b are constants [15]. This model is frequently used assuming that the change of surface coverage is proportional to the change of conductivity [10]. Both films and crystals of most of metal phthalocyanines were found to obey the equation. The constant a was directly proportional to the NO2 concentration in the range of 0.8–12.8 ppm. Moreover, determination of the constant required only about 1-min-long exposure time. As a result, a new methodology of sensor operation with a significantly shortened exposure time (≤2 min) was proposed. The advantages of this approach are both in the increase of measurement frequency and in the prolonged sensor lifetime. Longer lifetime also originates from the shortened exposures, which reduce a (potentially irreversible) shift of sensor properties caused by the contact with aggressive NO2.
In general, it is thought that gas detection consists of many processes that, in the end, lead to the formation of mobile charge carriers. Briefly, they include gas diffusion, physisorption, displacement of other adsorbed species, charge transfer process, and delocalization of charge carriers. The model is illustrated by Equation (4) where the abbreviation G stands for gas [16].
G ( free ) + Pc Diffusion ,   physisorption , species   displacement G ( ads . ) Pc Charge   transfer G Pc + Delocalization G Pc + hole +
As in the case of single crystals, the logarithm of the thin-film conductivity σ is a linear function of the logarithm of the NO2 concentration c (log σ = a·log c + b). However, the slope a varies significantly (0.04–1.9) with the type of the central cation(s), operating temperature and, what is more problematic, also with the exact conditions during the thin film preparation, temperature treatment, and gas exposure history. As a result, the literature brings many results that seem to be contradictory and make the revelation of the real nature of the processes very difficult [14].
The composition of gaseous desorbates that are released from heated phthalocyanine surfaces in low-pressure conditions is another question relevant for understanding the interaction between nitrogen dioxide and phthalocyanine surfaces. When monitoring the composition of desorbates by mass spectrometry, it was noticed that NO2 desorbs from phthalocyanine surface as NO2, NO, or N2O. From CuPc and H2Pc, it desorbed between 50 and 100 °C as NO2 (92%) and N2O (8%). For CoPc and FePc, the desorption occurred in two steps generating all the three above-mentioned nitrogen oxides. The first step occurred again between 50 and 100 °C, generating NO2 and NO, and the second between 100 and 250 °C, releasing NO2 (71.5%), NO (21.5%), and N2O (7.0%). Combining and comparing it with the data from NO exposures, it was suggested that NO is formed on the phthalocyanines from NO2 during the adsorption process, whereas N2O is formed during the desorption process by thermal decomposition of the adsorbed species [14]. In addition, several physicochemical spectroscopic methods such as IR, XPS, and Auger, confirmed that the phthalocyanine surfaces contain NO (bidentate nitrato), NO3, and NO2 species after being exposed to gaseous NO2 [17].
It is well known that the chemiresistive sensing is often dependent on chemiresistor morphology [18,19]. Based on the experimental evidence, it was also concluded that the gas sensing properties of Pc chemiresistors strongly depend on the degree of crystallinity, crystallite sizes and their relative orientation, character of grain boundaries and film heterogeneity [9,20,21,22,23,24]. As a result, it is supposed that the thin films have several types of active adsorption sites (on edges, corners, crystalline faces, or other structural defects) differing in binding strength [17,24]. These sites are typically referred to as the weak or strong, which reflects the binding strength and also corresponds with the time constants of the detection process. The weak sites adsorb and displace the molecules (O2 and NO2) quickly, and thus are responsible for the fast and reversible part of sensing kinetics. On the other hand, the occupation and vacation of strong sites require more time and energy, so they become significantly filled only after long and more intensive NO2 exposures (e.g., exposures to higher concentrations) [9]. However, the participation of the latter ones in the detection process is often undesirable, as the measurement cycle is either significantly prolonged or even totally blocked due to the incomplete sensor recovery.
The above-mentioned approaches for the recovery of phthalocyanine chemiresistors after interaction with nitrogen dioxide included mainly heating to significantly elevated temperature (up to 250 °C) and/or evacuation of sensor ambient. However, the latter procedure is challenging to apply for sensors operating in real conditions and monitoring a small concentration of NO2 in the ambient atmosphere. In this context, the light-stimulated desorption of gaseous species seems to be a much more promising approach. This strategy was reported, e.g., on Ti(Pc)2 optical fiber sensors with the application of ultra-violet (UV) light to stimulate the NO2 desorption [25]. The methodology was as follows: The optical sensors were exposed to NO2 for 60 min and then photoregenerated by UV light of an unknown but constant intensity applied for various times (25–40 min). Considering the repetitions of the photoregeneration treatment as well as the idle time, the overall measurement period was over 100 min long. Due to the light, the sensors were able to recover their original states before the NO2 exposures. They returned to original values of reflectance and provided identical responses in the following NO2 exposure cycles. The photoregeneration used a UV mercury lamp with a broad spectrum of wavelengths. However, such an approach brings several drawbacks. First, the phthalocyanine-sensitive layer with chemisorbed NO2 interacts simultaneously with multiple wavelengths of light, which poses the question of whether the photorecovery process needs all the wavelengths used or, to be more precise, which wavelength is essential for the process to occur. Second, if only certain wavelengths or a narrow spectrum are essential, a UV mercury lamp can be replaced by a simple light emission diode (LED) to reduce costs and to improve process efficiency. Third, the disconnection of a measurement optical fiber during the recovery process disables us to monitor its progress.
These questions and drawbacks were partially addressed in [26]. This work applied a single 365 nm UV LED to conduct the photoregeneration (of Lu(Pc)2) and provided a methodology for obtaining the data during the recovery period. The solution was to couple two LEDs: (1) a UV LED for the recovery and (2) a red LED for the measurement of a sensor state in the same fiber. Furthermore, the UV LED was periodically discontinued every 5 s for 1 s to remove the disturbing effect of UV light during the sensor state measurement (by the red LED). This work has demonstrated that a single narrow band UV LED centered around 365 nm is sufficient to promote the photoregeneration. Moreover, in this case, the illumination intensity was known and equal to 290 W/m2. The selection of the wavelength was based on the assumption that the mechanism of photoregeneration consists in the photodissociation of NO2 (Equation (5)). This photodissociation is promoted by wavelengths shorter than 420 nm.
NO 2 h ν   <   420   nm NO + O
However, this mechanism still seems to be incomplete because it does not explain what happens with the generated atomic oxygen, which could react with the sensitive material, causing sensor degradation. It is also possible that similar to the quantum dot-based chemiresistors, the light illumination might generate the electron-hole pair in the layer, and the photoexcited holes could recombine with the electrons trapped by the chemisorbed NO2(ads), causing its desorption from the surface [27]. Nevertheless, if the assumption above is right, the maximal rate of desorption should to be in the range of 360–395 nm. Furthermore, from a practical standpoint, such an experimental design resulted in unacceptably low performance in NO2 monitoring. The critical point was especially the length of a measurement period, which was over 60 min. Moreover, the practical recovery was not perfect, and the best-indicated resolution of 0.2 ppb (parts per billion) cannot be considered to be even close to the limit of detection. The limit of detection should be calculated taking into account the apparent noise in the data and possible drift of sensor parameters. Finally, there is still a disadvantage from the point of view of costs as optical fiber sensors are generally more expensive than simple chemiresistors.
Our work offers a study of the photoregeneration process of ZnPc chemiresistors carried out by “monochromatic” LED diodes. The monitoring of sensor output quantity (electrical resistance) within distinct stages of the process (exposition to reference, exposition to nitrogen dioxide, illumination by LED) is conducted in tandem with the characterization of the ZnPc surface (at the same stages) by Raman and near-ambient X-ray photoelectron (NAP-XPS) spectroscopies. These two techniques allowed us to overcome the pressure gap and investigate the NO2 sensing mechanism in conditions close to operational ones, which is essential for the correct interpretation of the processes occurring on the surface of the ZnPc-based chemiresistor. Finally, all these perspectives are compared, discussed, and some practical recommendations for sensor photoregeneration are formulated.

2. Materials and Methods

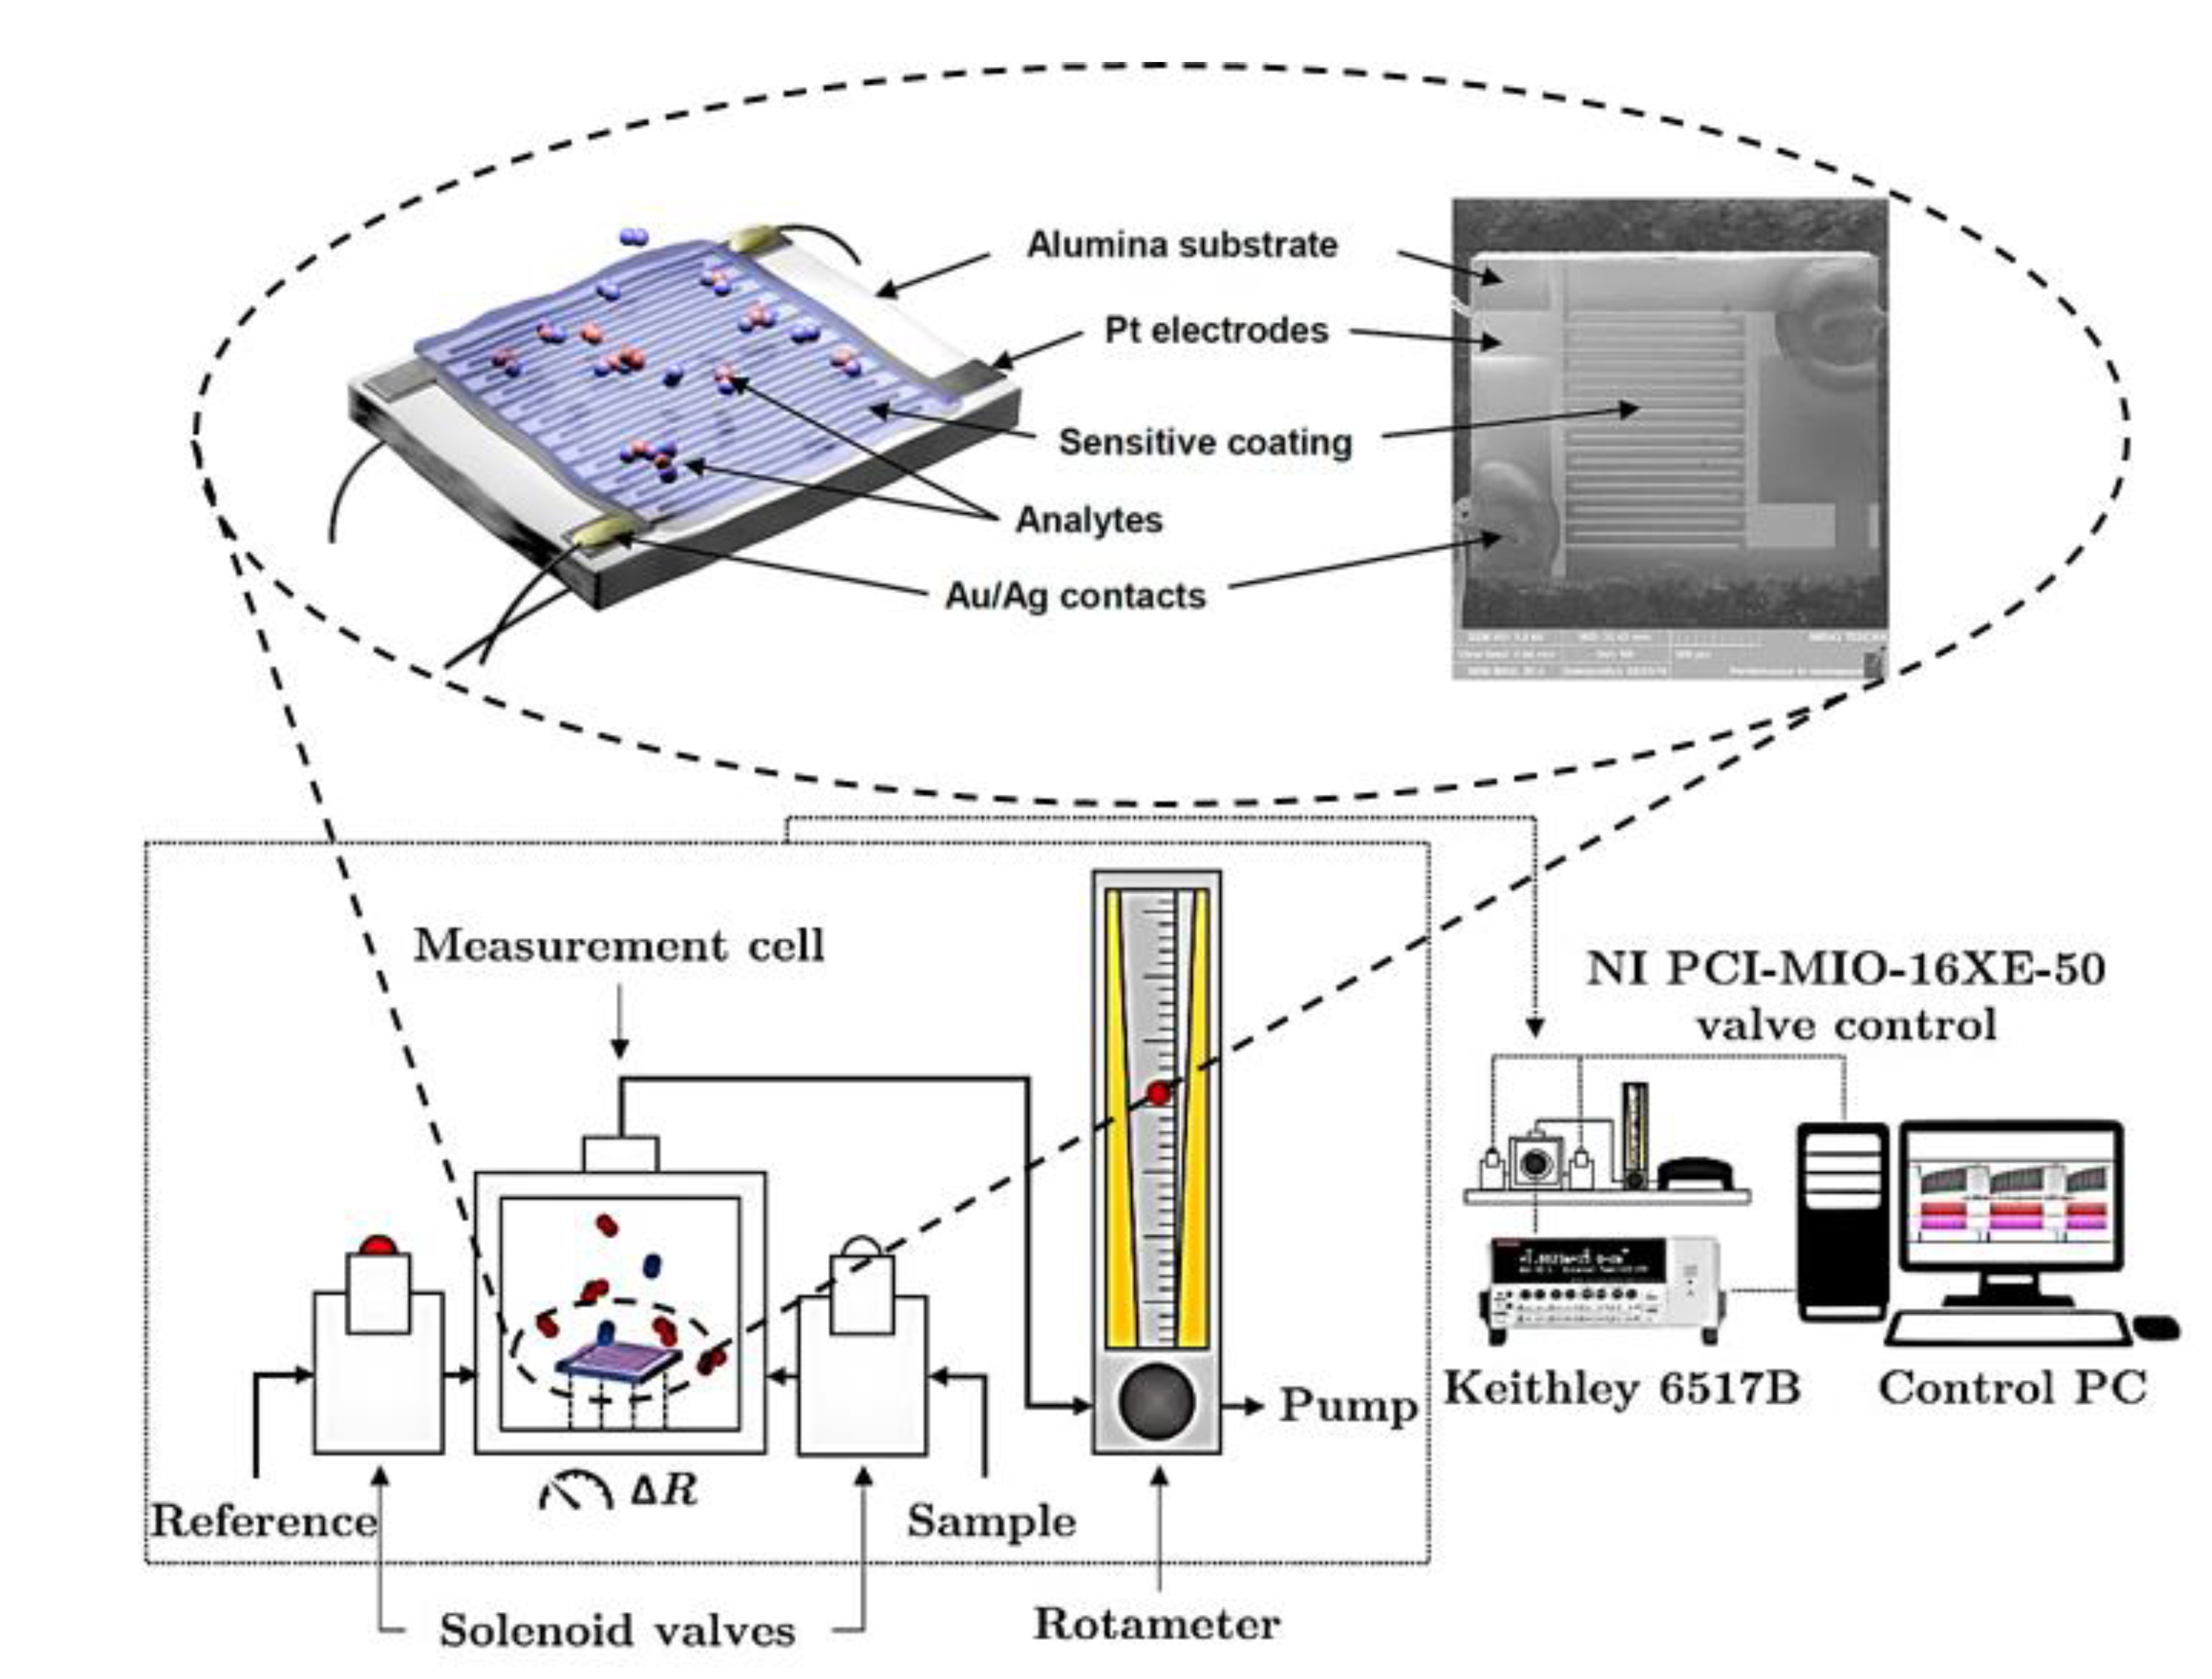
2.1. Preparation of ZnPc Chemiresistors

The chemiresistor substrates were the Pt/alumina ones. These substrates are planar and made of a thin alumina plate (2 × 2.5 mm) equipped with interdigital Pt electrodes (2 × 10 “fingers”) and a Pt heater/thermometer. The electrodes are on the top and the heater/thermometer on the bottom side. The electrode fingers are 25 μm wide and separated by 45 μm wide channels. The Pt structures are contacted by Au and Ag lacquer to thin Pt wires connecting the substrate with the measuring circuit. Its temperature operating range is 40–800 °C while being tempered by the integrated heater. The heater also serves as a resistance-based thermometer for temperature control. A schematic illustration and a scanning electron microscopy (SEM) image of the sensor presenting the front side of the sensor with the interdigital electrodes and phthalocyanine film are depicted in Figure 1. The SEM image was taken at low magnification with a 3 × 3 mm field of view using a secondary electron detector at an accelerating voltage of 5 kV.
Phthalocyanine thin films were prepared by Organic Molecular Evaporation (OME) under high vacuum conditions. The core of the OME deposition system is a stainless-steel cylindrical chamber (41 × 44 cm). An evaporator is fixed at the bottom flange of the chamber, a holder for substrates is on the top at an adjustable distance (17.5–23.5 cm). The evaporator (Creaphys DE-FR 2.2) is a hollow copper cylinder with an integrated thermocouple (K-type), radiation heater, and motorized shutter. The evaporator holds a single 2.2 cm high and 1.5 cm wide corundum crucible for source material. The minimal amount of source material is ca. 10 mg, but the typical value ranges between 20 and 200 mg, depending on the type of material and desired thickness of a film. The evaporator heats the crucible up to approximately 550 °C. Heating is controlled by a PID controller Eurotherm 2216e with autotuned PID constants. The crucible temperature for ZnPc films was set to 406 °C. Layer growth was monitored with a quartz crystal monitor Fil-Tech SQM-180. Growth of the film was stopped when a thickness of 250 nm was reached. The growth rate of the film was ~2 nm/min.

2.2. Measurement of Sensor Response to Nitrogen Dioxide

The response to nitrogen dioxide was evaluated in a DC-operation mode. The principal configuration of a measuring apparatus is illustrated in Figure 1. Its gas-distribution system with continuous flow includes: two Tedlar bags for the reference atmosphere and the measured mixture containing NO2, respectively; two solenoid switching valves; glass pipes and a Teflon measuring chamber where the sensor is placed. The constant flow rate (63 mL/min for the constant exposure dose experiments, 25 mL/min for the rest) is controlled by a needle valve equipped with a rotameter (Aalborg Instruments and Controls, model P 150 mL). The inner volume of the apparatus, including its part from the solenoid switching valves to the rotameter, is approx. 40 mL. All the measurements were made at two operating temperatures, i.e., 55 °C and 100 °C, respectively. The reference atmosphere was synthetic air, and the measured mixture contained a defined concentration of NO2 in synthetic air.

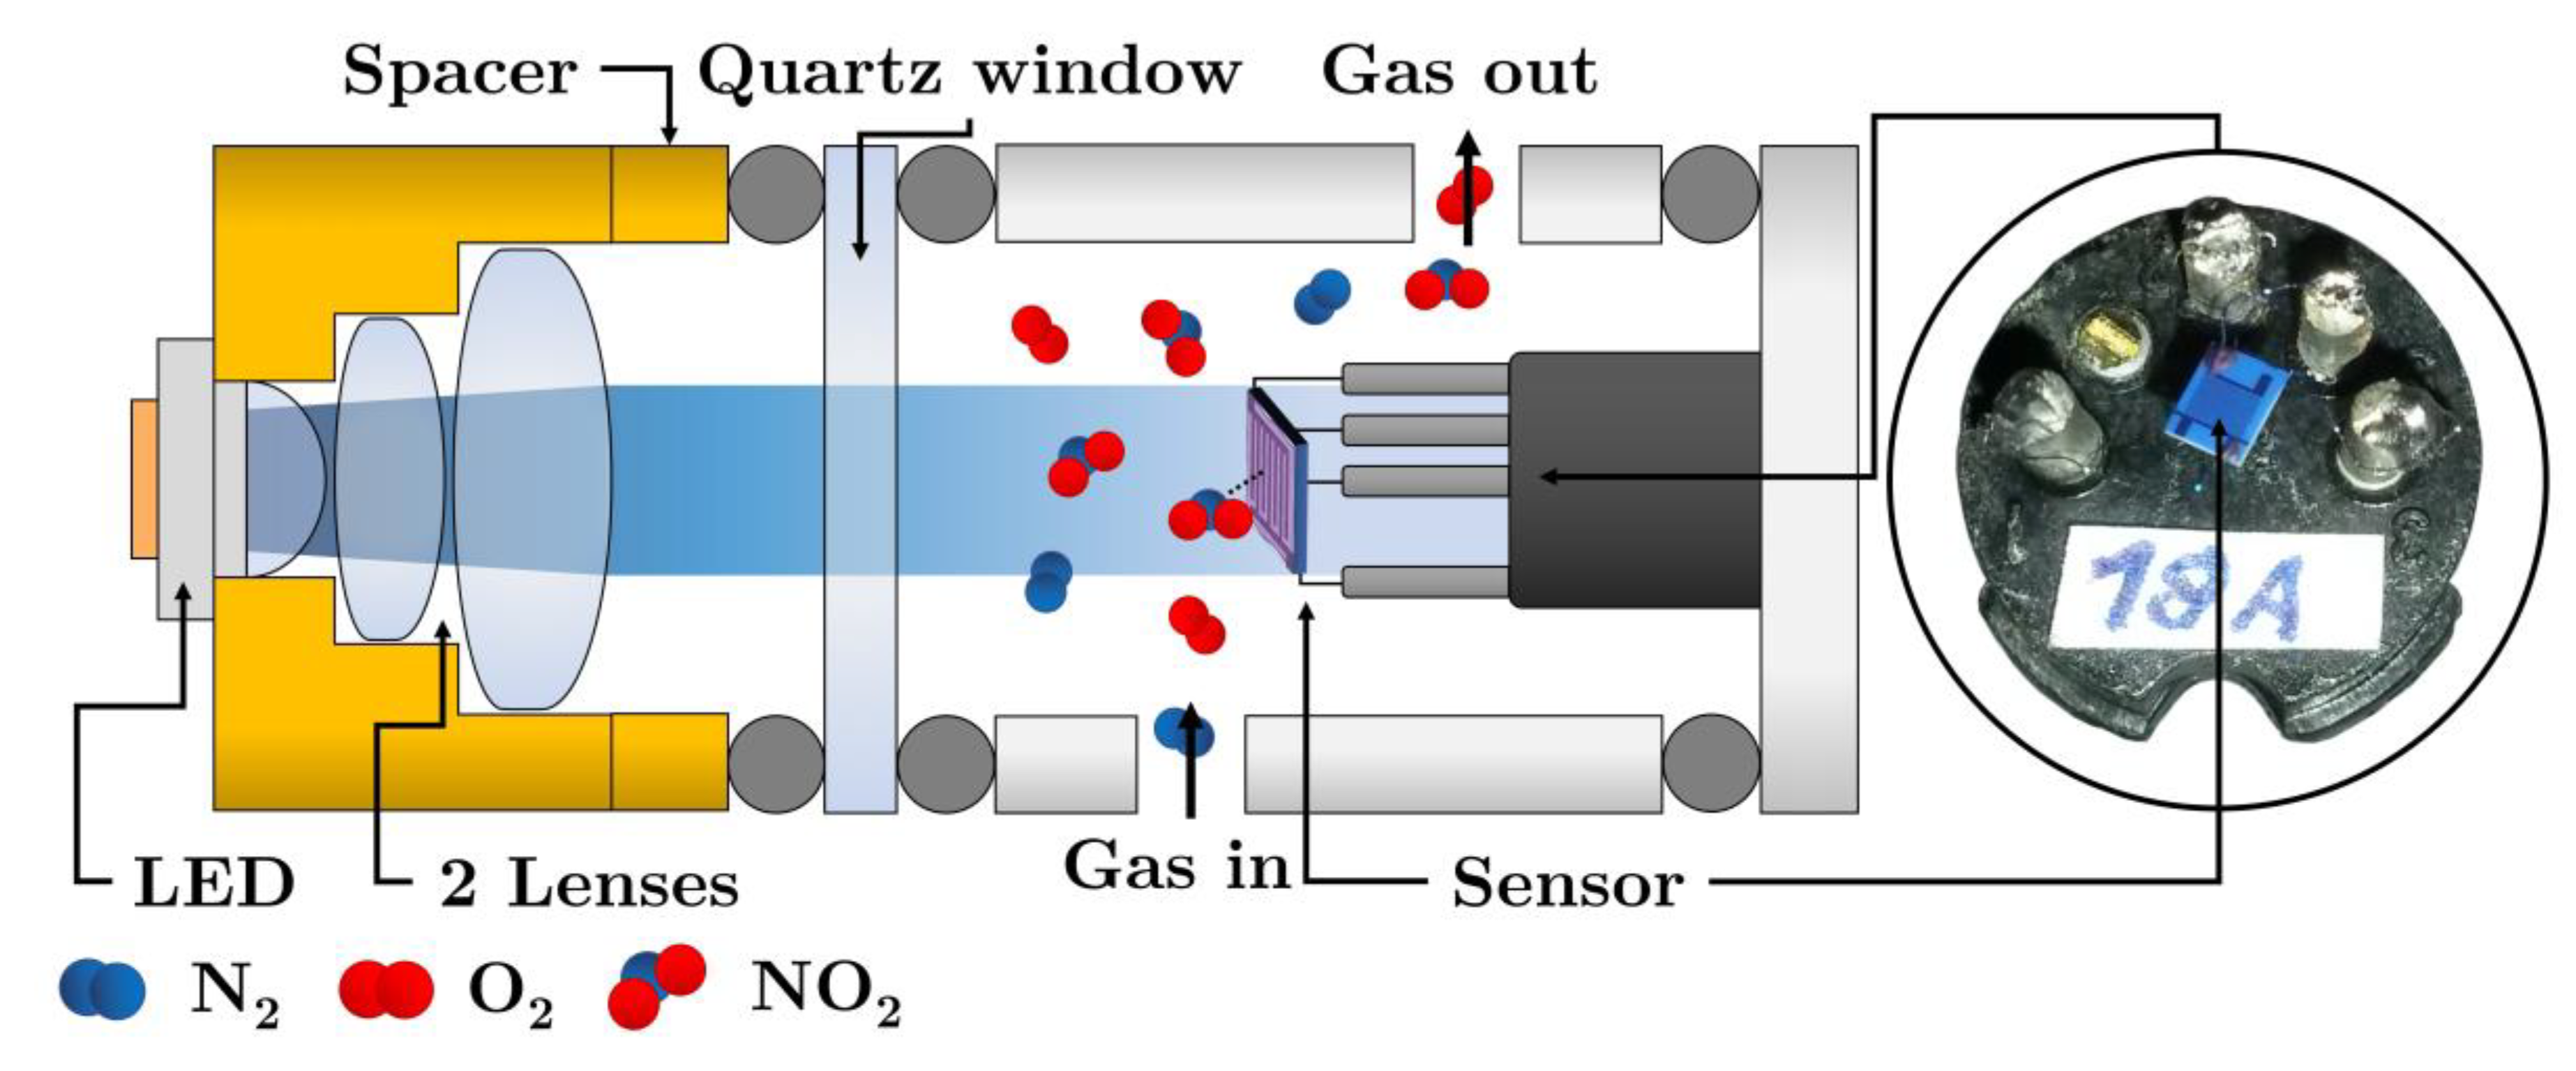
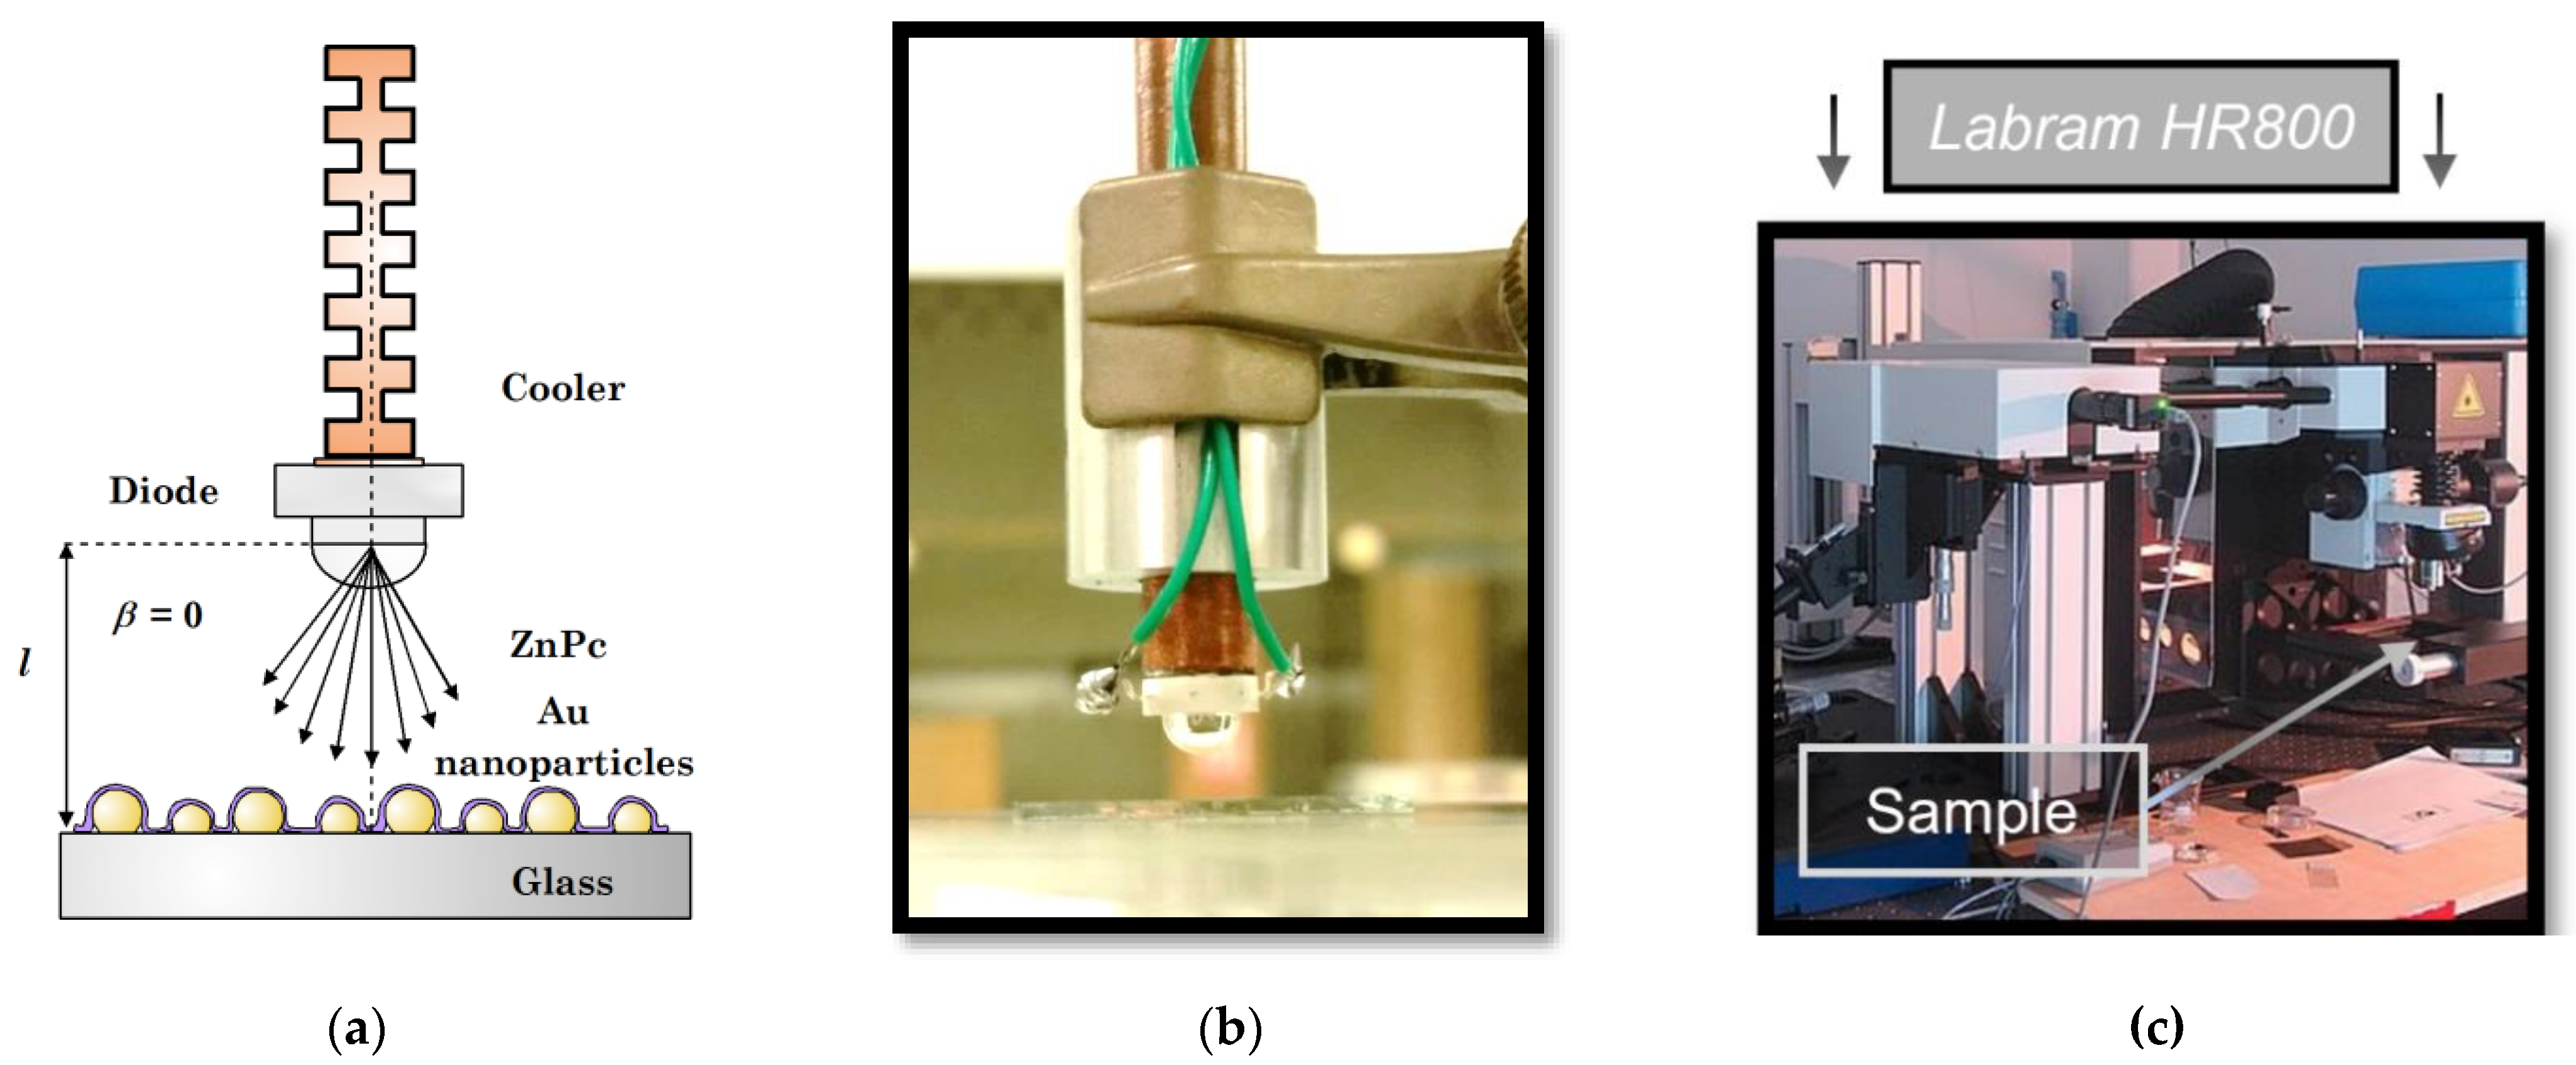
2.3. Photoregeneration of the Sensor by LED

A regime of a “constant exposure dose” was formulated and used for the measurement. This is based on the following assumptions: First, it implies (for a sufficiently low amount of NO2) that the total amount of NO2 adsorbed during an exposure period is proportional to the magnitude of the change in resistance of the sensor. Therefore, if a sensor with a fixed baseline exhibits a fixed change in its resistance, it adsorbs a constant amount of NO2. Second, this adsorption takes a certain time, which is proportional to the NO2 concentration in the gas phase. Therefore, if both of these assumptions are valid, the information concerning the NO2 concentration could be derived from a time that is necessary to induce a fixed change in sensor resistance.
In practice, a measurement begins when a sensor reaches its baseline in synthetic air and its resistance is stable. At this moment, the current value of the resistance is recorded, and the sensor is exposed to NO2. The resistance begins to decrease until it reaches a certain fixed level (defined by the fixed change in %). When the desired change is reached, the sensor is rinsed by pure synthetic air for 10 to 30 s, and subsequently, it is regenerated by a pre-optimized photoregeneration pulse. At this moment, the sensor baseline is restored, and the sensor is ready for the next measurement. The concentration of NO2 in the measured mixture is then calculated from the length of the response period (NO2 exposure time).
To verify the methodology (i.e., the “constant exposure dose” regime), several sets of measurements were carried out for various NO2 concentrations in the range 0.2–2 ppm and the wavelengths λ = 412, 441; 457; 500; 518; 630; 678 and 723 nm. The schematic set-up of photoregeneration experiments is depicted in Figure 2.

2.4. Measurement of Raman Spectra (SERS)

A SERS study was carried out as another supplement to the study of the photoregeneration mechanism. Ultra-thin ZnPc layers (1–2 nm) were prepared according to the procedure described in Section 2.1 on glass substrates with gold nanostructures/nanoparticles. The gold nanostructures were prepared using the thermal evaporation method by depositing approximately 7 nm of Au at a rate of 0.1 nm/s.
The samples were measured by a Labram HR800 spectrophotometer (for details, see Figure 3). The excitation was carried out by a laser with a wavelength of 632.8 nm and energy of 0.015 mW. The laser beam was focused on the sample through a 50x objective. In the beginning, the layers of various thicknesses were measured in a pristine state in order to obtain reference spectra. Then they were moved to a special kit and exposed to 1.2–12 ppm of NO2 for 1 min. After the exposition, the layers were reinserted to the spectrometer and re-measured to get a spectrum with chemisorbed NO2. Finally, the samples were taken out again and illuminated outside the spectrophotometer. The illumination (441 nm, 1.8–2.0 mW/mm2, 1 min) was carried out in a perpendicular geometry (Figure 3a). In the final step, the samples were reinserted and re-measured once more, so that we could see the changes that occurred. In this way, the spectra after photoregeneration were obtained.

2.5. NAP-XPS Measurements

NAP-XPS is a new type of photoemission spectrometer capable of operating up to near ambient pressure (10−10–20 mbar), which makes it possible to carry out in situ studies in the presence of gaseous analytes. The spectrometer is equipped with a PHOIBOS 150 hemispherical electron energy analyzer that is coupled with a differentially pumped electrostatic pre-lens system and a monochromatized Al Kα X-ray source of high intensity. More information about the system and its application for investigating the gas-sensing mechanism of different gas sensors can be found in [28,29,30].
This study used a sample with a thin ZnPc layer prepared on silicon substrates by thermal evaporation as described in Section 2.1. The thickness of the layers (250 nm) corresponded with the thickness of the layers on sensors. The study took the following experimental route. First, the layer was measured in an ultra-high vacuum (UHV). Then, it was measured during exposure to NO2 dissolved in synthetic air at the total pressure of 1 mbar. The NO2 partial pressure was approx. 1 × 10⁻² mbar that corresponds to the NO2 partial pressure during the measurement of sensor response to 10 ppm NO2 at ambient conditions (i.e., at 1 bar). The third measurement was conducted after the exposure to NO2, again in UHV. The fourth and the last measurement was carried out after the sample was illuminated by 405 nm laser light (100 mW, 140 s). The illumination by the laser light was required due to a significantly longer distance (~15 cm) between the illumination source and the layers in the spectrometer.

3. Results

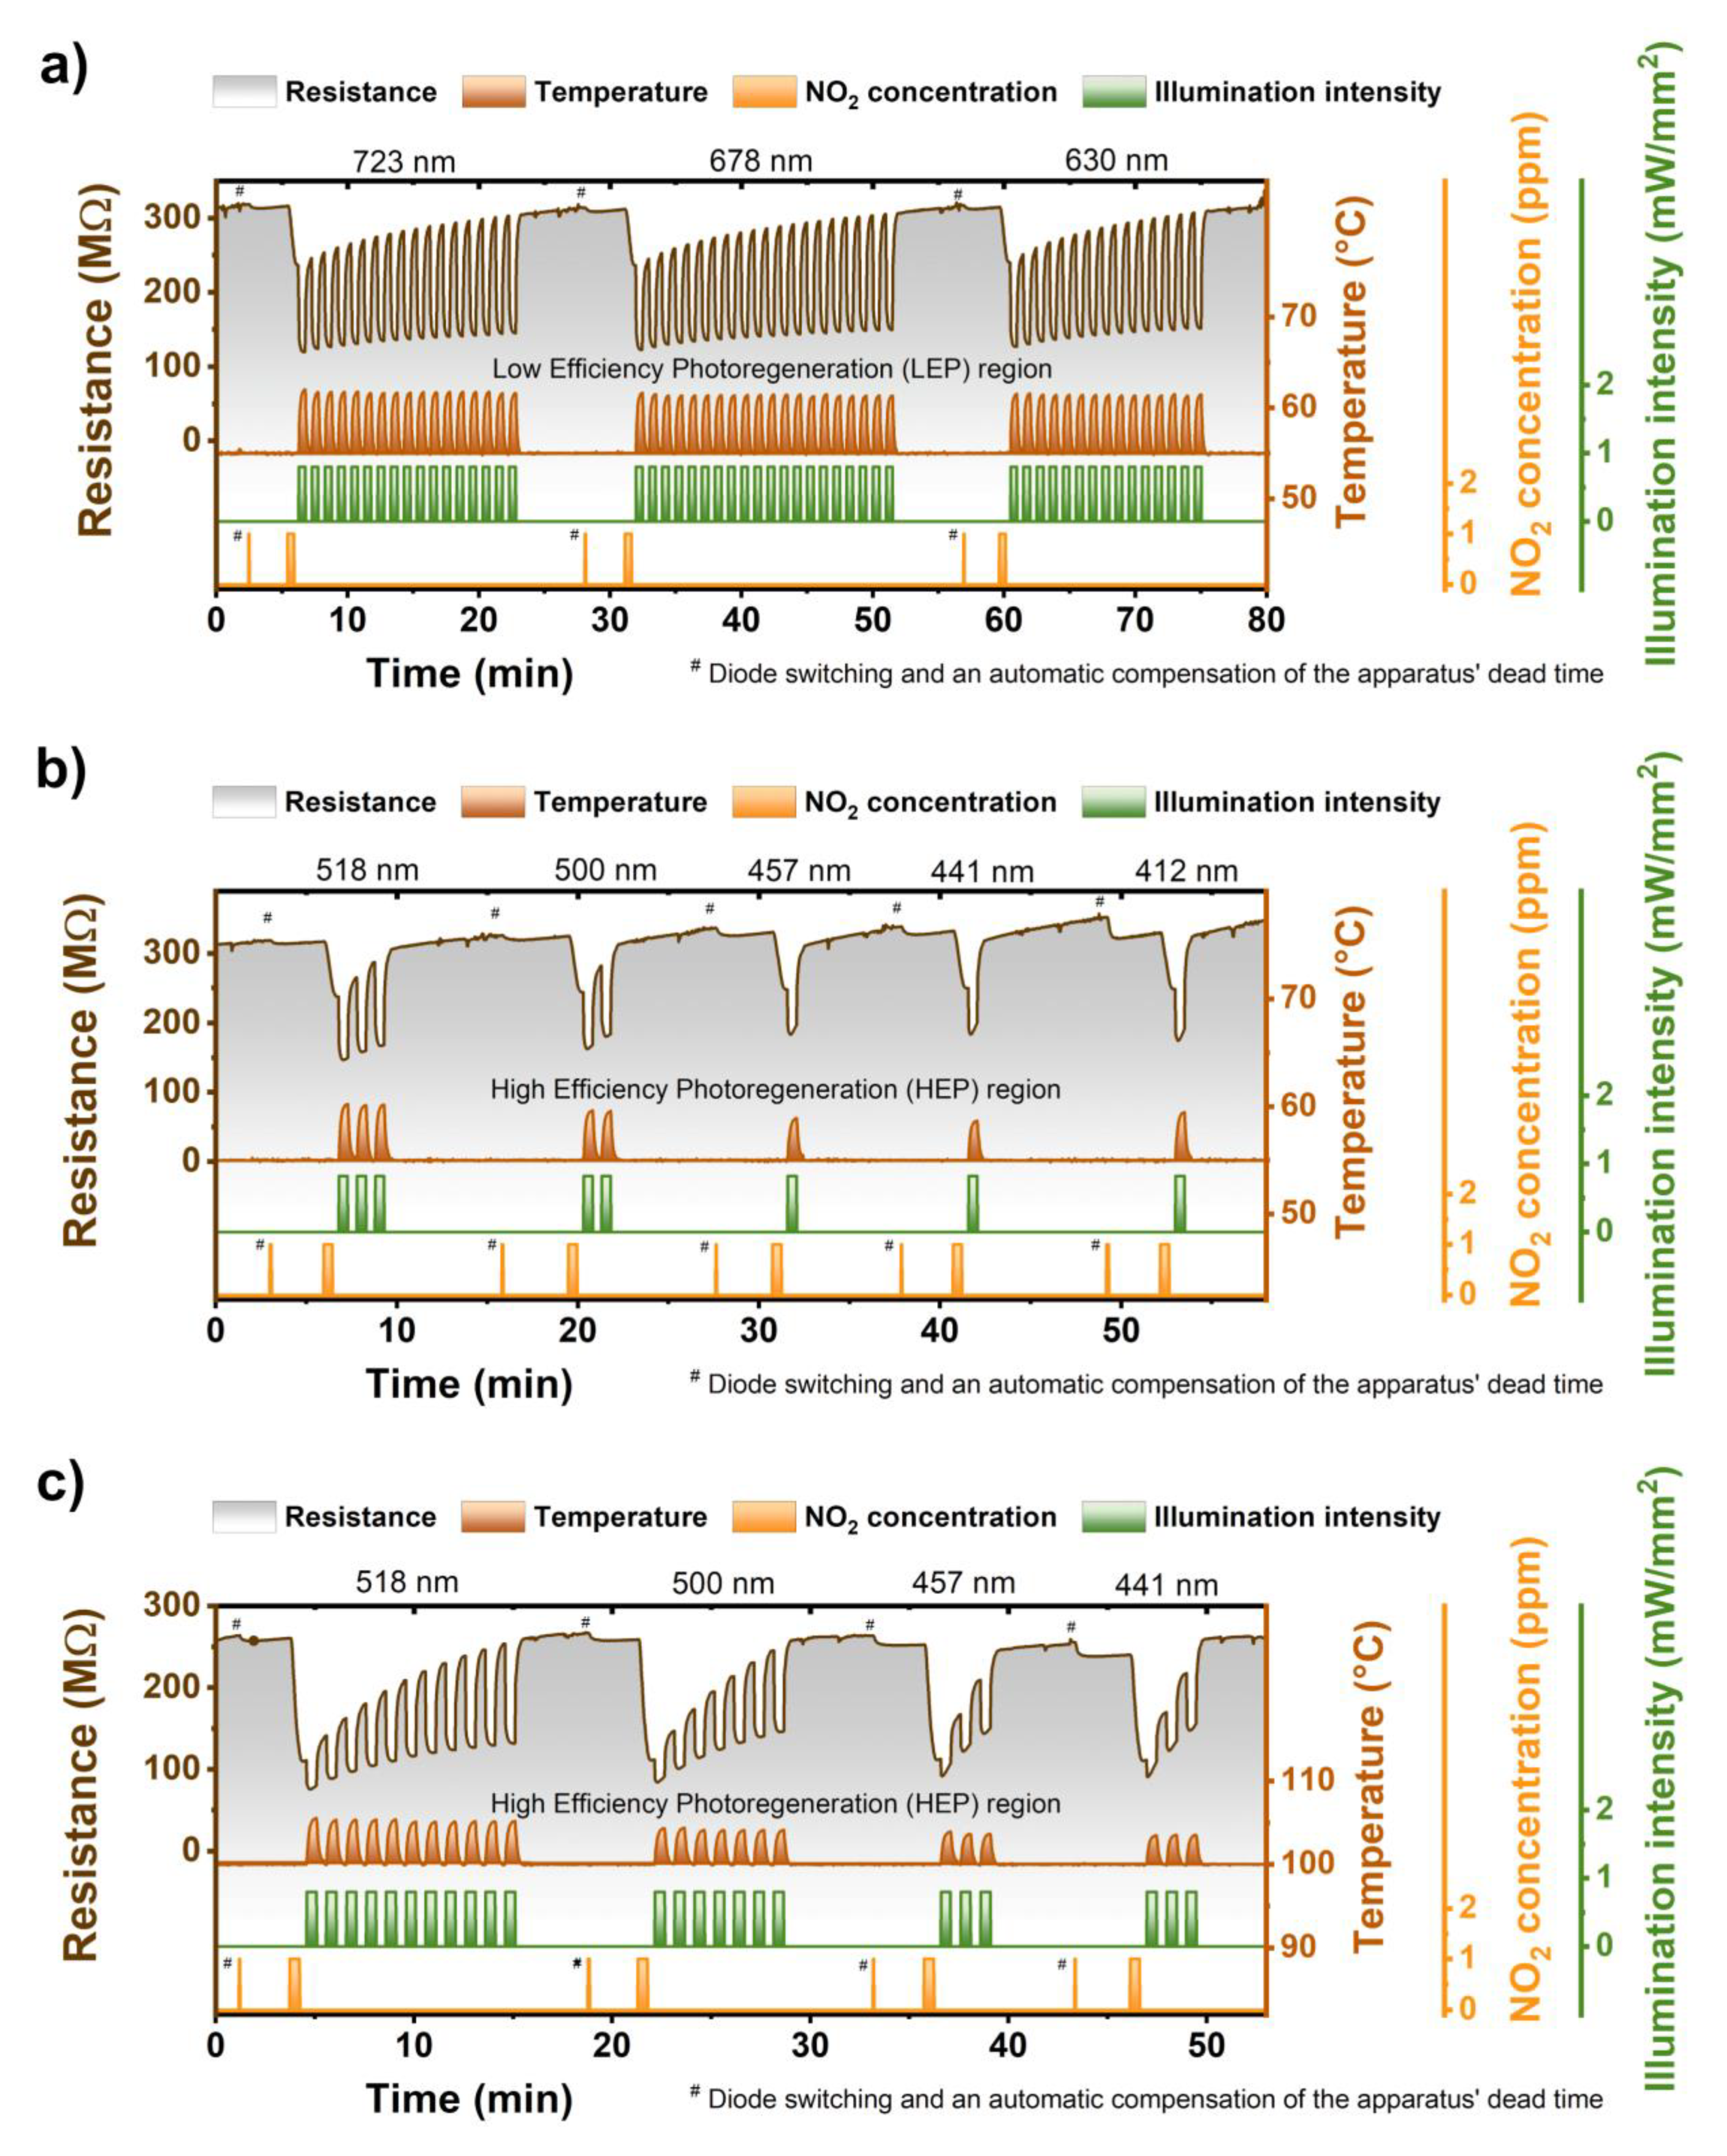
3.1. ZnPc Photoregeneration as a Function of Wavelength and Sensor Temperature

This section investigates the influence of illumination of the ZnPc sensitive layer on the sensor recovery after exposure to nitrogen dioxide. As a criterion, the sensor output quantity (=electrical resistance) was measured. Photoregeneration was studied as a function of two investigated parameters: the light wavelength and the sensor temperature.
The impact of light wavelength :Generally speaking, the ZnPc sensors were to a certain extent photoregenerated by all the wavelengths. In other words, the regeneration degree (RD) (a term firstly introduced in [31]) was always greater than 0% (with the temperature fixed at 55 °C and the intensity at 0.8 mW/mm2), see Figure 4a,b. However, the shorter wavelengths were more effective. We conditionally divided the whole region of tested wavelengths into two ranges. In the region of longer wavelengths (723–630 nm), the RD was low and ranged from 12% to 15%. Therefore, this region was named a low effectivity photoregeneration (LEP) region—Figure 5a. In the region of shorter wavelengths (518–412 nm), the RD rose from 35% for 518 nm to 94% for 412 nm. Therefore, the region was named a high effectivity photoregeneration (HEP) region—Figure 4b.
The impact of sensor operation temperature was twofold (cf. Figure 4b,c). With increasing the temperature, the normalized response magnitude (NRM) was growing, and the RD was decreasing. In the language of numbers, the NRM rose from (0.25 ± 0.01) for a temperature of 55 °C to (0.55 ± 0.02) for a temperature of 100 °C. As opposed to the NRM, the RD fell from (35%–94%) for 55 °C to (20%–49%) for 100 °C. In other words, the temperature rise (55 °C → 100 °C) approximately doubled-tripled the sensor sensitivity as well as the number of pulses necessary to reach complete photoregeneration. It thus seems that the elevated temperature leads to the fact that the sensitive layers are either cleaner or more susceptible to NO2 chemisorption. To sum it up, if more NO2 is chemisorbed, then greater responses are registered, and more time (or light) is necessary to ensure its desorption and hence recovery of the sensor surface. Except for the trends discussed, one can observe surprising stability and repeatability of responses at both investigated temperatures also illustrated in Figure 4a–c.

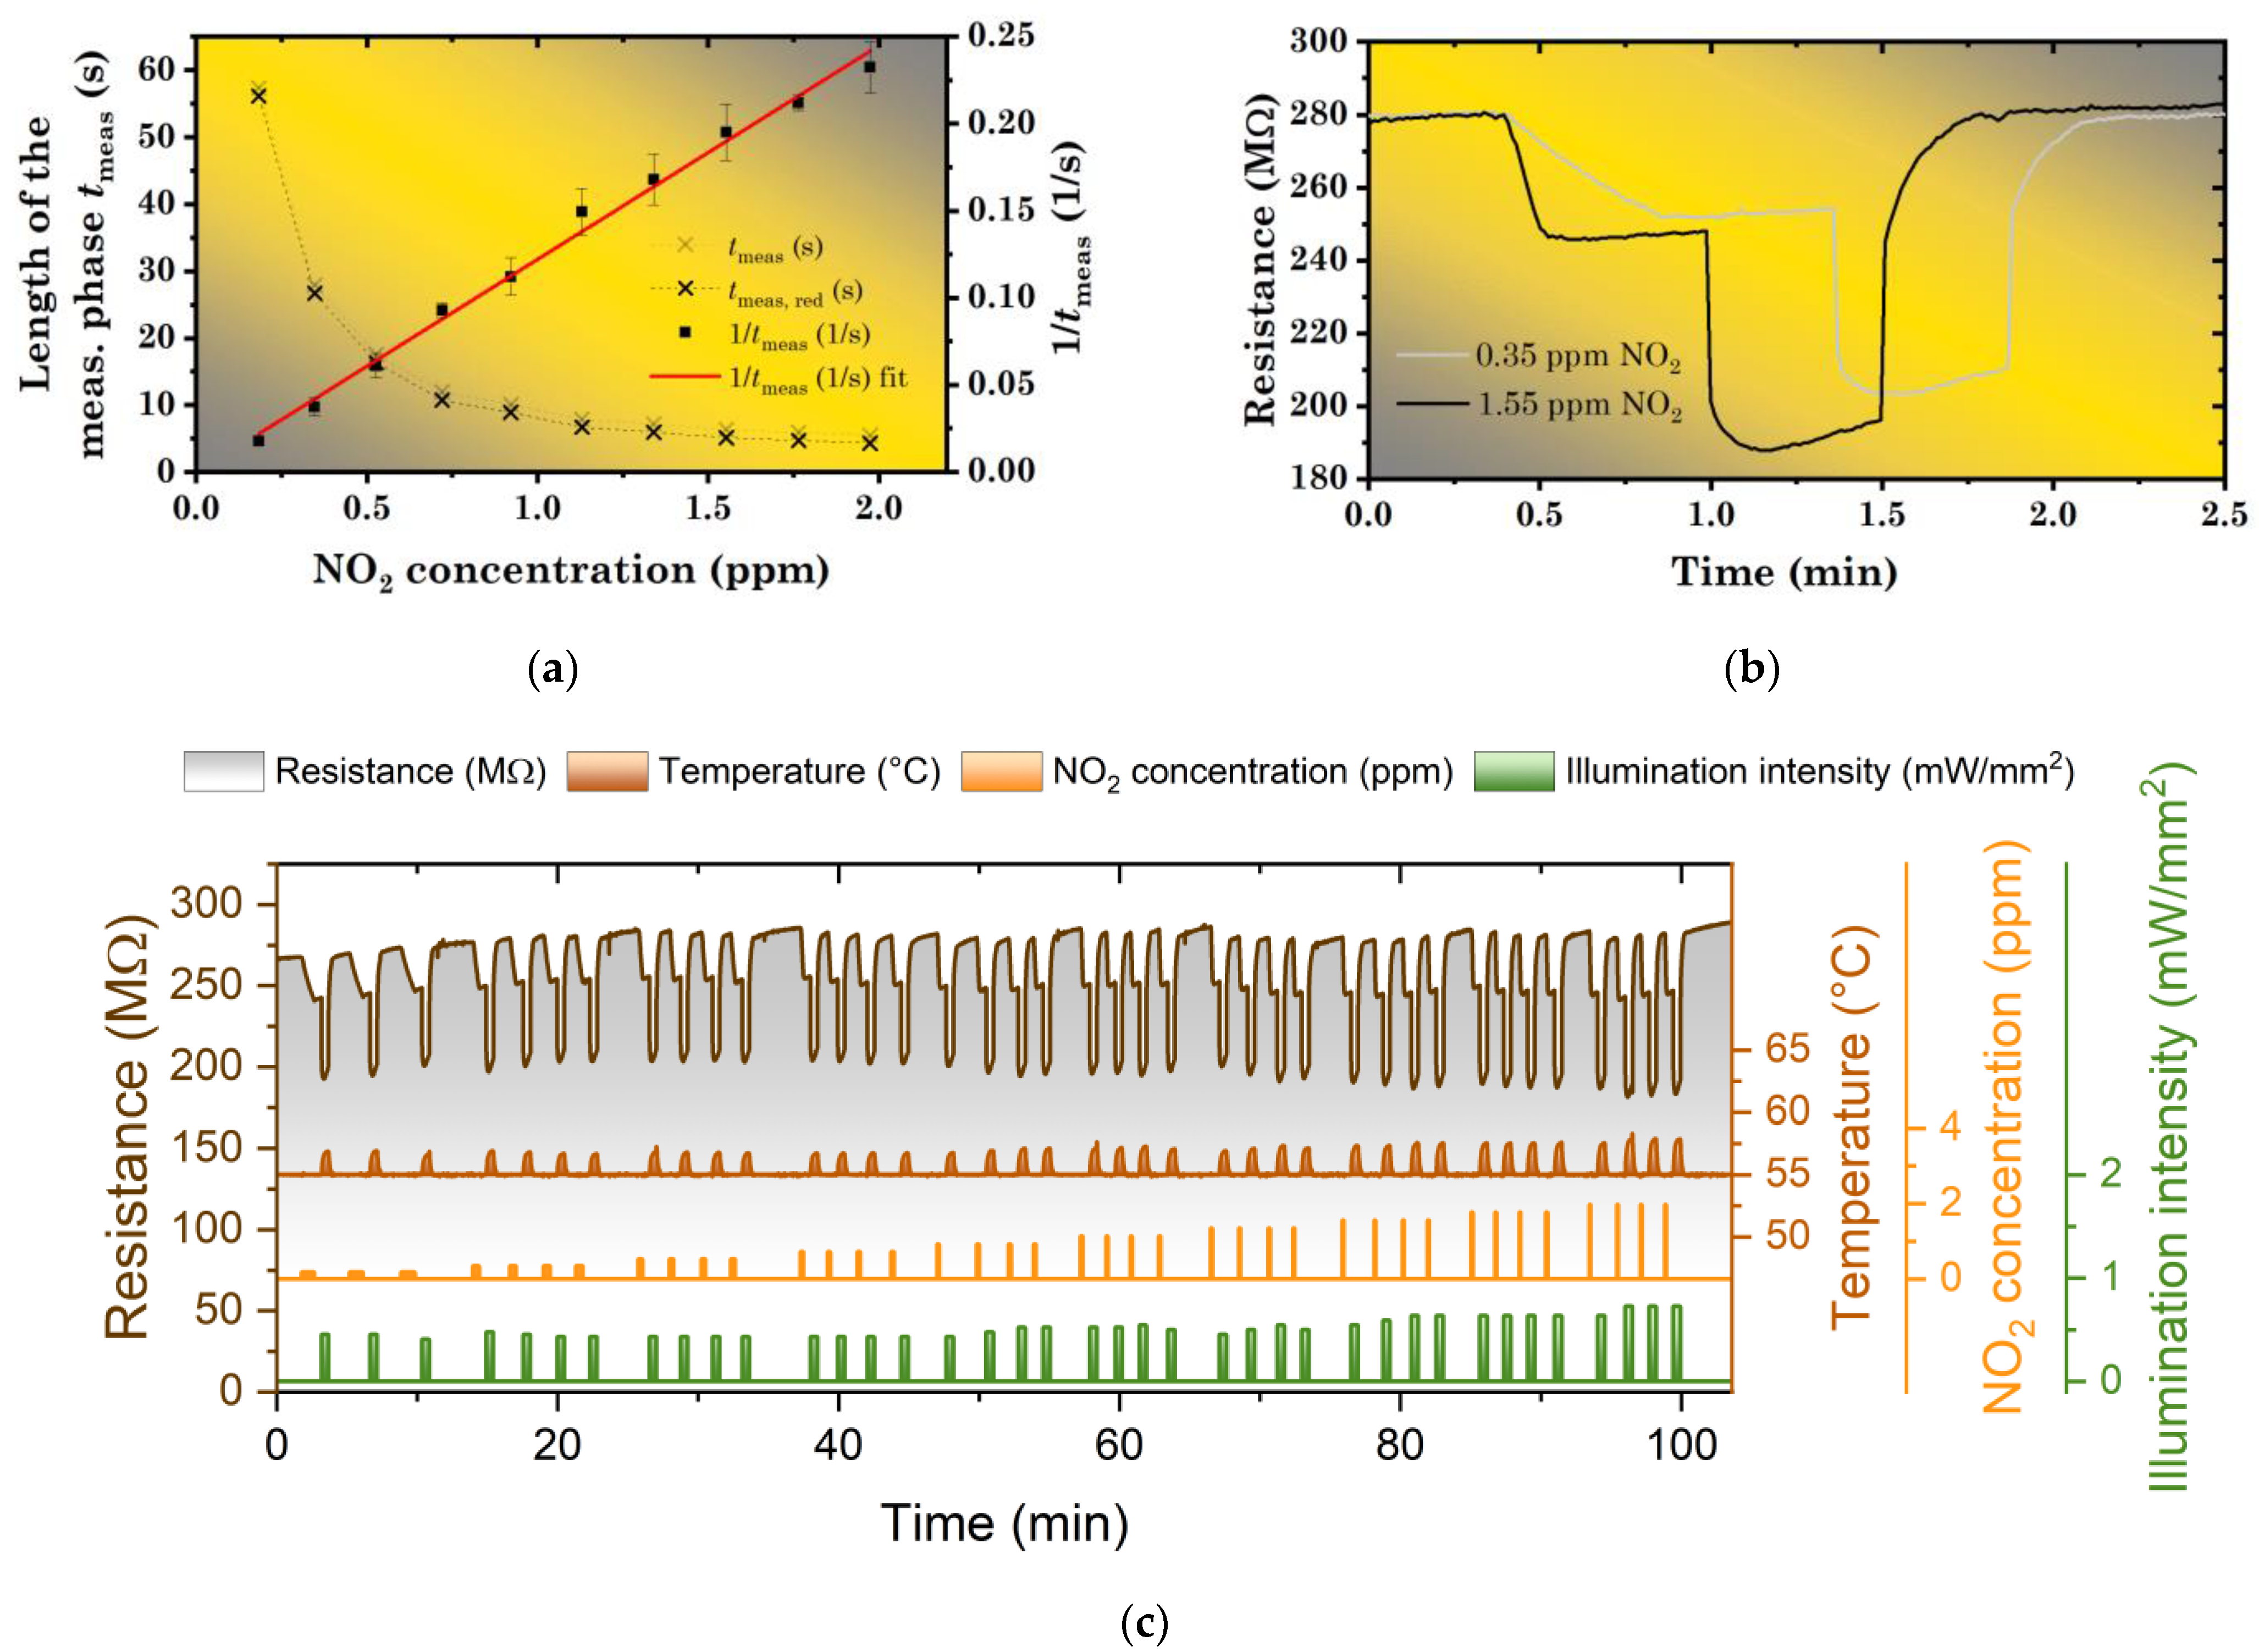
3.2. Photoregeneration of ZnPc Sensors within the Regime of a Constant Exposure Dose

Phthalocyanines exhibit the best performance characteristics (low duration of measurement, signal linearity, stability, repeatability, etc.) while detecting sufficiently low concentrations of NO2 (≤1 ppm). In practice, however, there may be situations when sensors are exposed to significantly higher concentrations of this gas. When it happens, it becomes necessary to protect the phthalocyanine-sensitive layer from irreversible changes in sensor properties [32]. To be able to do so effectively, we assembled and investigated the following operation protocol. This protocol ensures that a sensor is always exposed to a fixed small dose of NO2, which causes a fixed change of its resistance (ΔR/R0 = 10%).
The adsorption of nitrogen dioxide obeys the 1st Fick law of diffusion (Equation (6)):
d Q d t = D · A · d c d x
where Q represents an amount of NO2, D is diffusivity, A is a sensor area, and c stands for NO2 concentration. Variables t and x are time and an auxiliary coordinate in the sensor normal axis, respectively. Assuming that: (i) the time t is small (→ NO2 concentration in the layer does not change); (ii) the layer does not contain any NO2 at exposure beginning (i.e., cNO2(layer) = 0); and (iii) the amount of adsorbed NO2 is inversely proportional to the change in sensor resistance (R), the relationship (Equation (6)) can be rewritten as:
d R d t = D · A · c NO 2
where cNO2 is NO2 concentration in the gas phase. After integration over time, the relationship (Equation (7)) transforms into an almost final form. The last step is the addition of an apparatus dead time (=time, which is necessary to fill the cell with a working mixture). As a result, the length of the measurement period tmeas can be expressed as (Equation (8)):
t meas = R D · A · c NO 2 + t dead
This dependence is visualized in Figure 5a together with the experimentally determined tmeas for different NO2 concentrations (0.2–2 ppm). To verify its character, it has also been inverted (using tmeas, red = tmeastdead) and plotted versus NO2 concentration. After this transformation, a linear dependence has been obtained (Figure 5a). This 1/tmeas curve was then also used for a determination of the limit of detection (LOD) of the studied sensor (for details see the Supporting Information (SI)), which was found to be about 0.126 ppm. An example of raw data for two different NO2 concentrations is presented in Figure 5b. All raw data (for all the concentrations including the repetitions) are presented in Figure 5c.
In general, the regime of a “constant exposure dose” has shown several advantages over the intuitive approach depicted in Section 3.1 and Figure 4. First, a sensor is protected from the adsorption of an excessive amount of NO2. Second, despite the approximate linearity between the RD and illumination intensity in a small range of concentrations, for wider concentration ranges, the RD was found to be a non-linear function of the NO2 concentration (proportional to NO2 dose with a fixed exposure time). As a result, it became sometimes difficult to tailor parameters of photoregeneration by single-pulse. However, with the “constant exposure dose” regime, the regeneration always started with a layer in an approximately same state (with an approximately constant amount of chemisorbed NO2), so the tailoring became much easier (certain illumination intensity adjustments were still necessary due to a non-zero dead time of the measurement apparatus—Figure 5c). Third, with the ΔR/R = 10%, the measurement became faster for most concentrations (>0.35 ppm). The measurement period varied from 3.5 min for 0.2 ppm to 1.7 min for 2 ppm. On the other hand, the “constant exposure dose” regime became inaccurate in the region of very low concentrations (<0.2 ppm). These problems originated in the remaining drifts of sensor baseline, which are present in most cases. The typical drift rate ΔR/R was found in the range 0.5%–1.0%/min.

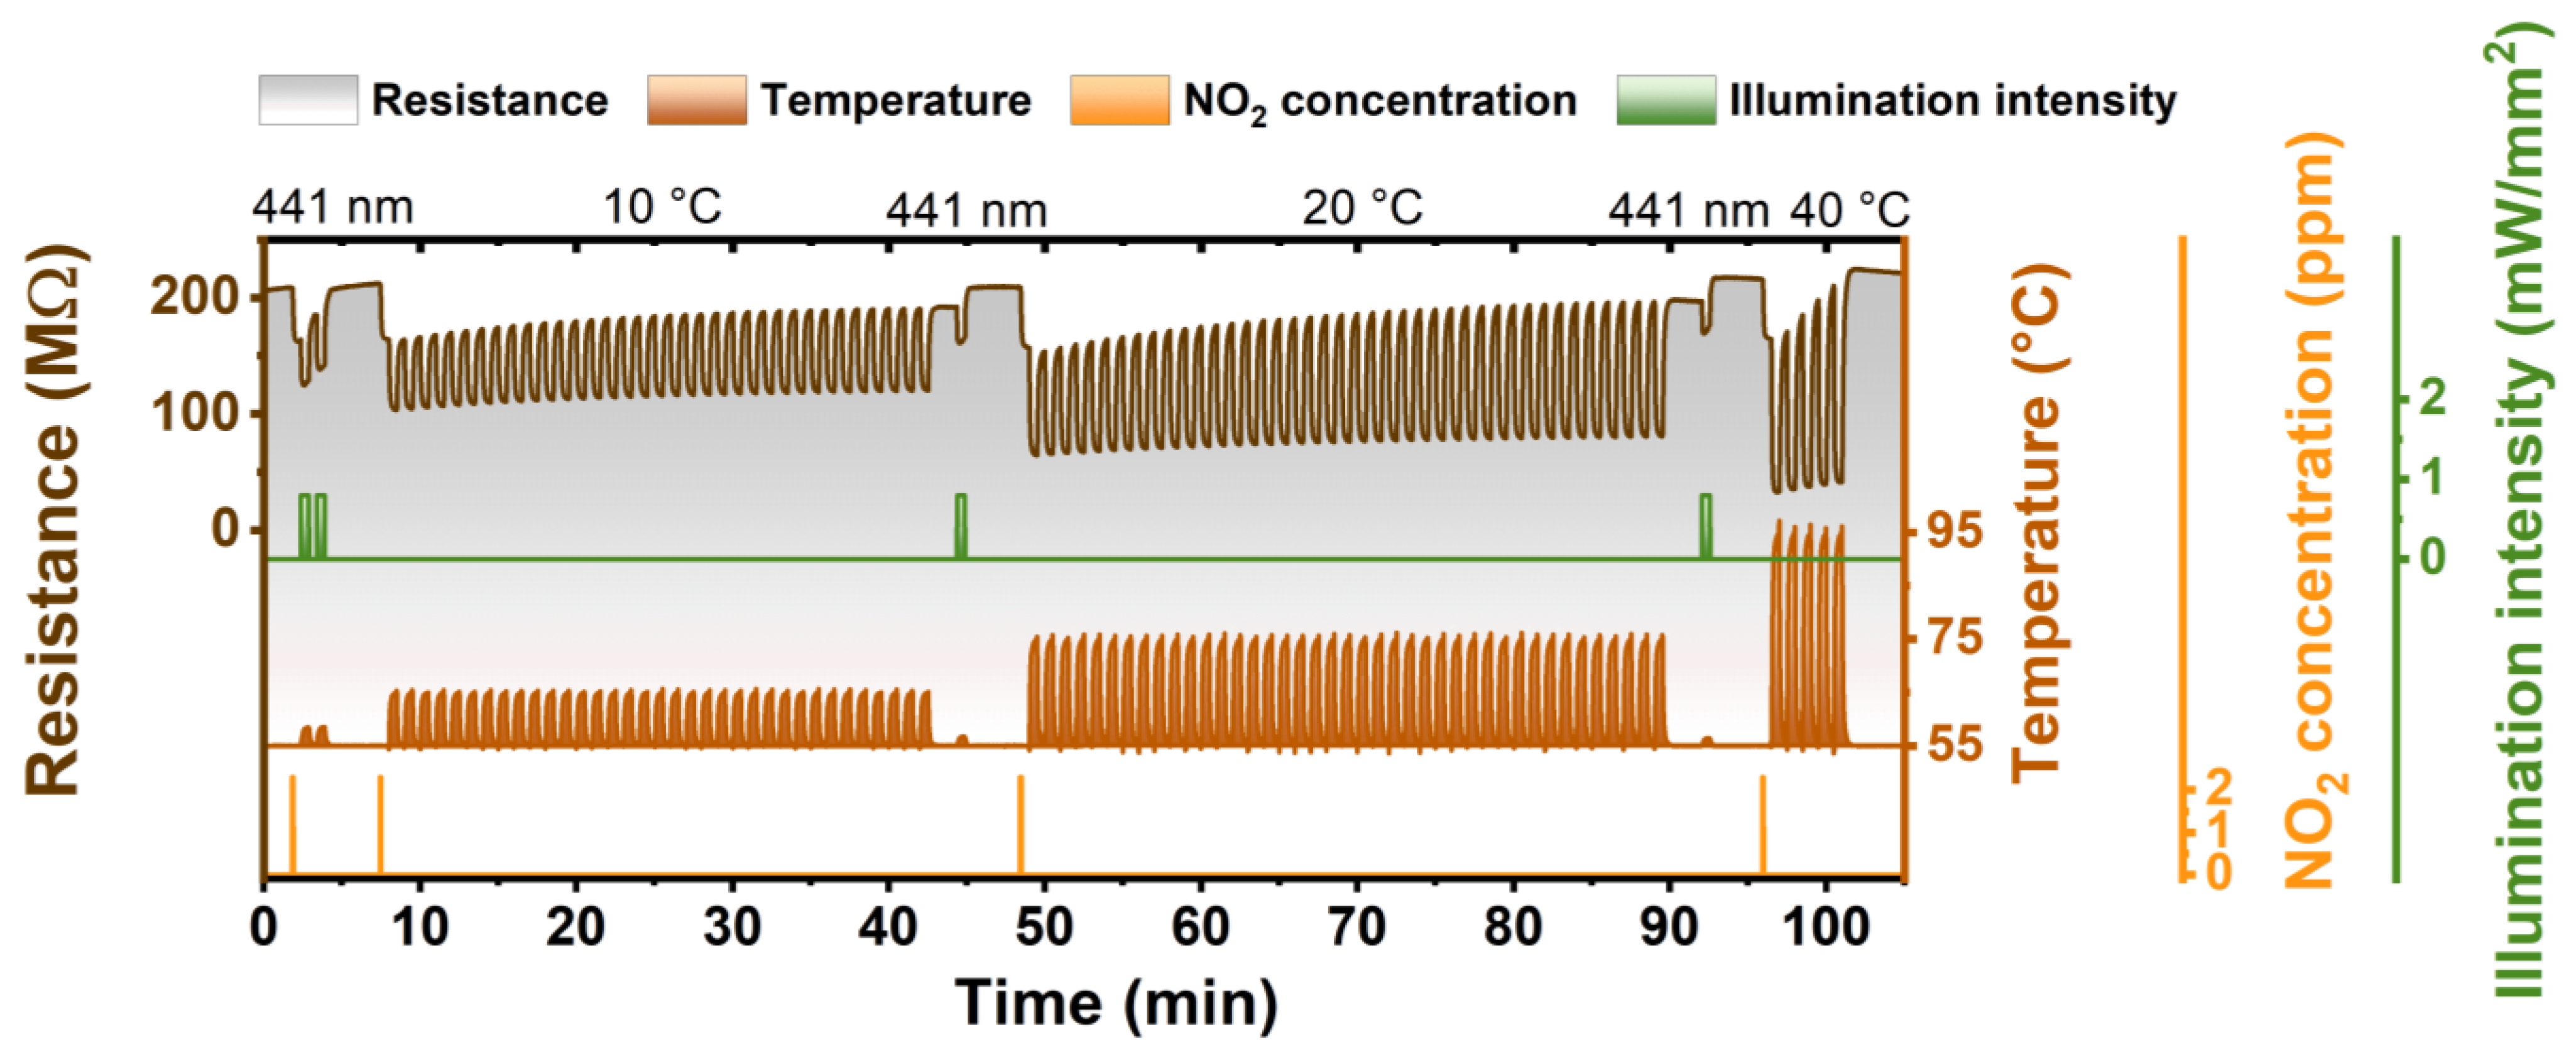
3.3. Comparison of Photoregeneration and Temperature Regeneration under Dark Conditions

In order to demonstrate the high efficiency of photoregeneration, we also performed a study of the ZnPc sensor regeneration by temperature. For this, a special methodology was developed that included the usage of temperature pulses (rising temperature for a defined time) that were acting similarly to the light pulses during the photoregeneration and allowed to compare the efficiency of each regeneration method. In this measurement, the sensor was exposed to NO2 until the value of its resistance (baseline) decreased by 10%. Then the sensor was regenerated by photo- or thermo-regeneration pulses (the 30 s of illumination/raised temperature and 30 s of waiting/stabilization) until its resistance reached initial resistance. Figure 6 shows one photoregeneration cycle and three thermo-regeneration cycles. It can be seen that after NO2 exposure, two photoregeneration pulses (λ = 441 nm) were enough to recover the sensor to the initial state. In the case of thermo-regeneration, the first two temperature regeneration cycles that included 35 temperature pulses (temperature was, respectively, increased by 10 °C or 20 °C above the sensor operational temperature of 55 °C) were not sufficient for returning the resistance to the initial value. It was needed to regenerate the sensor by one pulse of photoregeneration. Thermo-regeneration with 40 °C pulses showed better efficiency. It was enough to have five such pulses to regenerate the sensor, but, still, the thermo-regeneration efficiency remained much lower than in the case of photoregeneration.

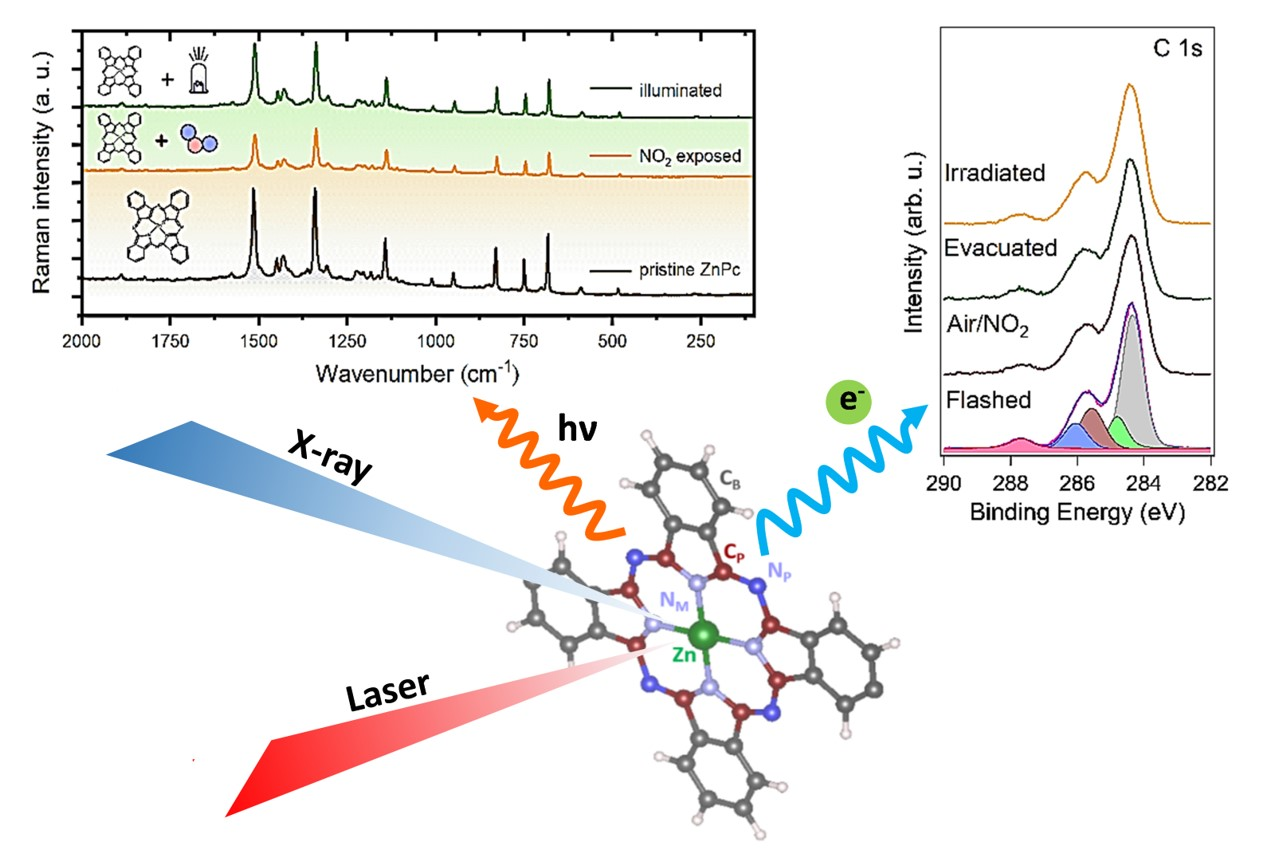
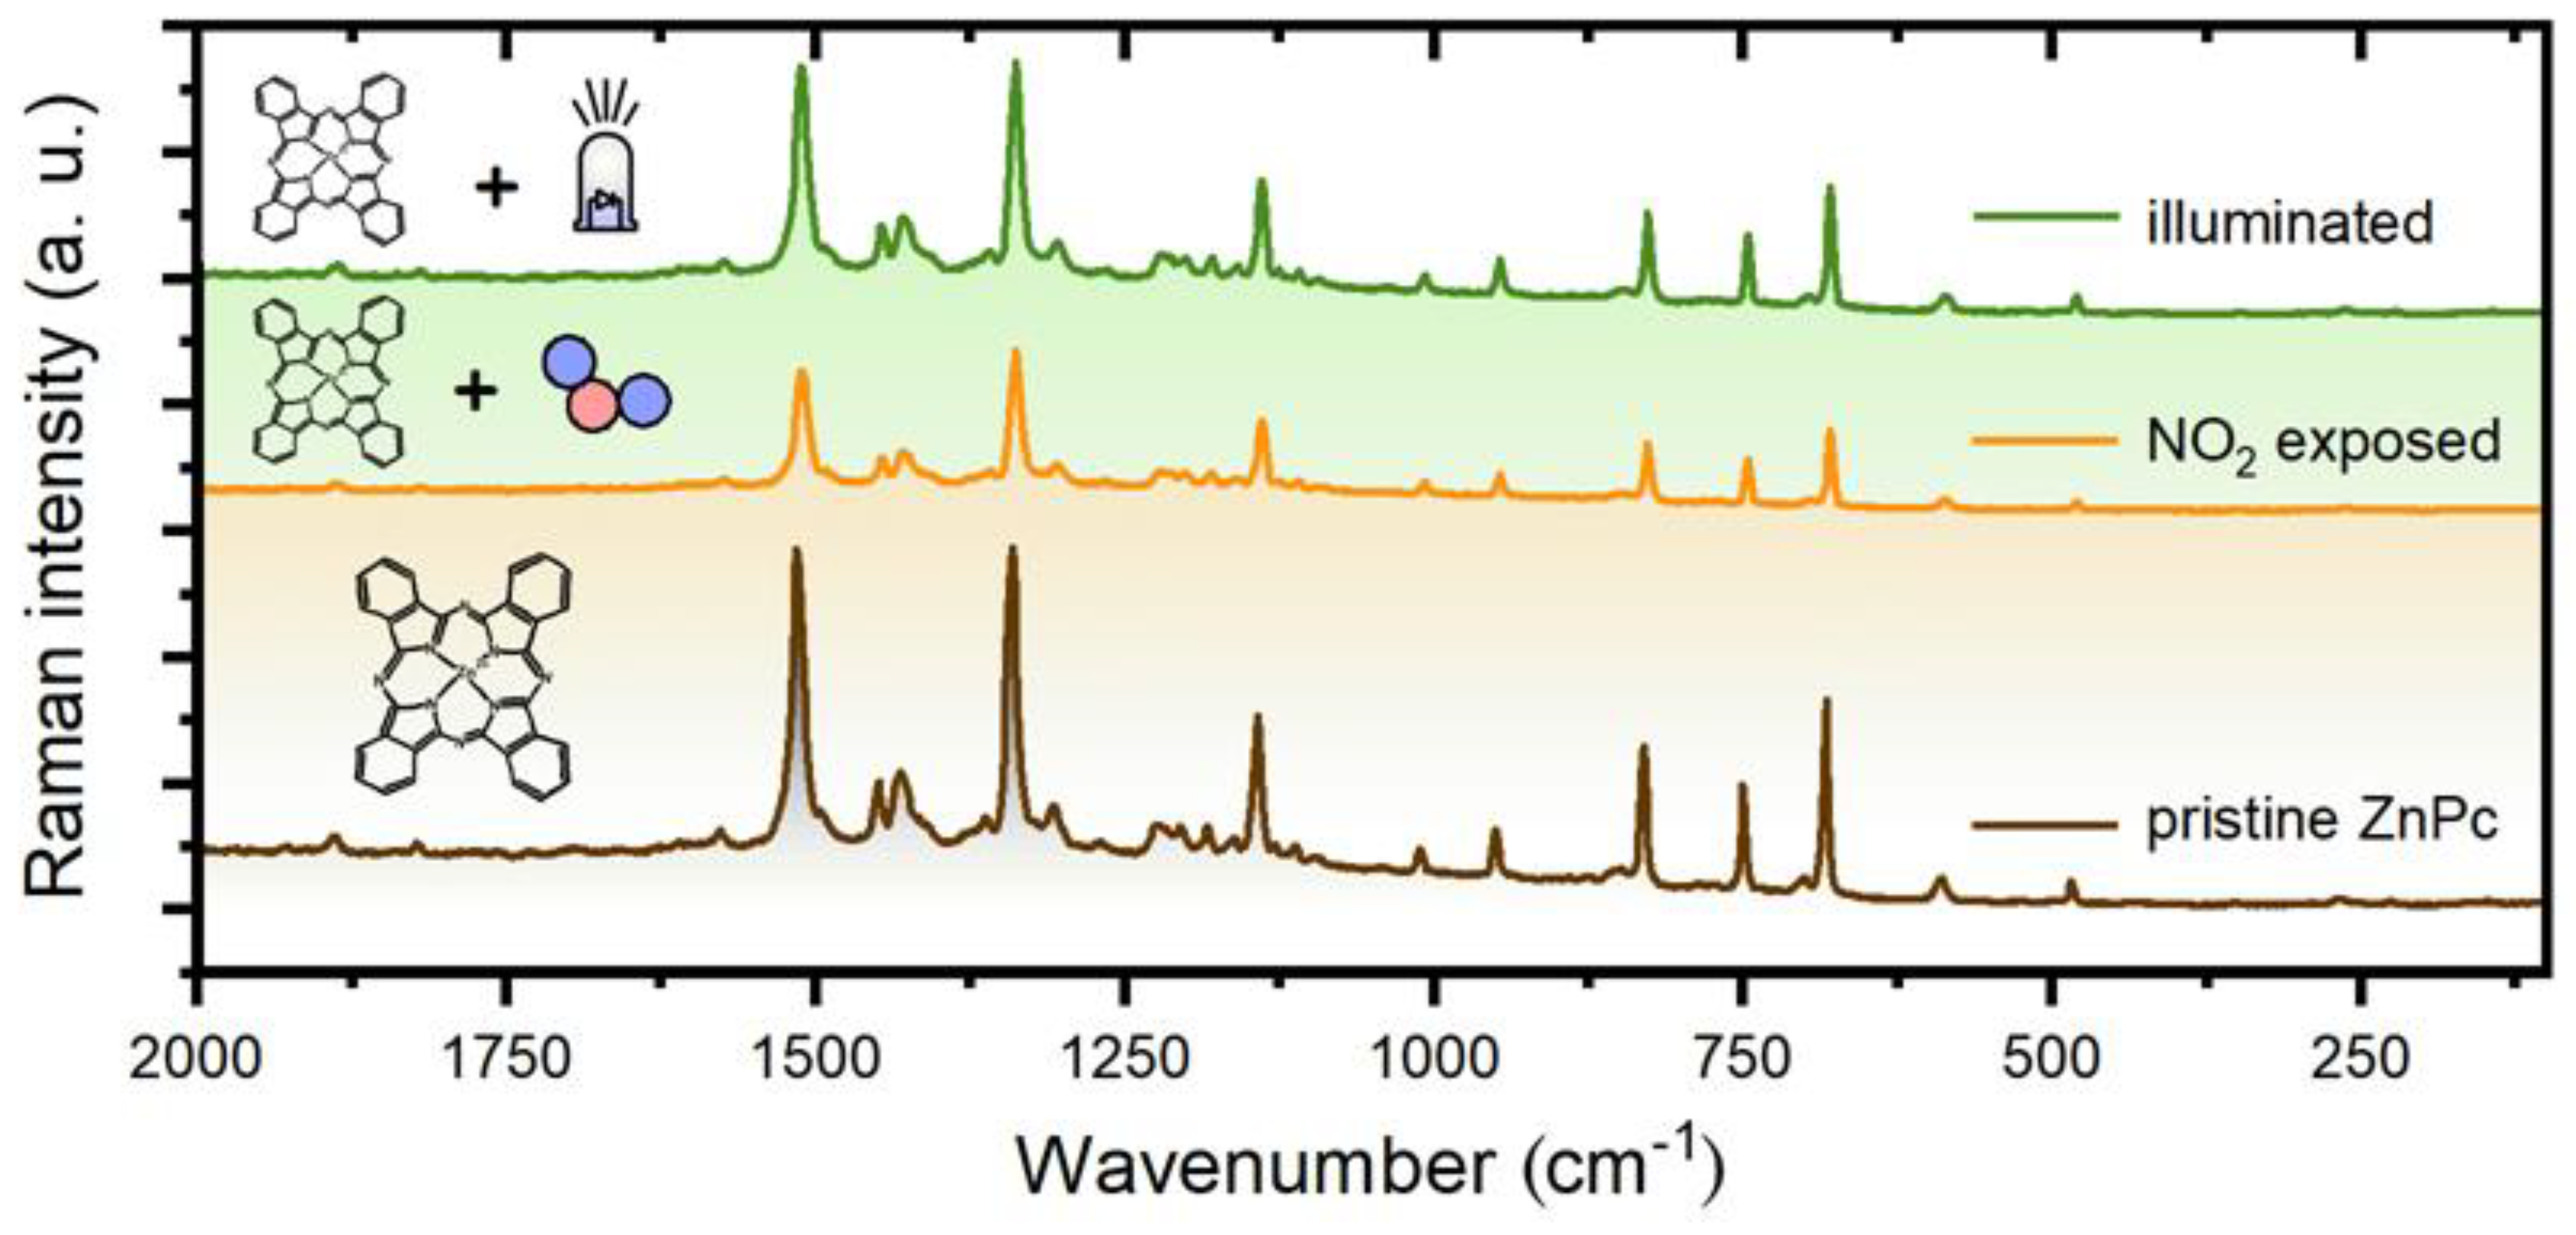
3.4. Raman (SERS) Study of Photoregeneration of ZnPc Layers

A SERS study of photoregeneration was conducted according to the methodology described in Section 2.4. Three spectra of a ZnPc layer were recorded for three different layer states: before NO2 exposure, after NO2 exposure, and after the illumination (441 nm). The spectra were analyzed and compared with each other (Figure 7).
First, we include an analysis of a “reference spectrum”, i.e., the pristine ZnPc layer. The analysis revealed a very good consistency of the measured spectrum with data in the literature. ZnPc is supposed to have 165 vibrational modes, 106 of which are expected to be Raman active [17]. However, some bands are very weak, so we restricted the attention only to the bands whose intensity reaches at least 2% of the most intensive feature (1336 cm−1). As a result, we obtained 27 peaks and compared them with reference data in [33] that were acquired for ZnPc powder in KBr disks with excitation at 1064 nm. The comparison showed a good agreement for all of these 27 peaks. In more detail, the average difference in their positions was 0.8 cm−1. The average of absolute differences was 3.6 cm−1, and the standard deviation was 6.4 cm−1.
In the next step, we compared the spectrum of the pristine layer with the spectra of NO2 exposed and illuminated layers. However, this comparison revealed only small changes that may rather be related to layer inhomogeneity and small spatial variations of a probed spot (both the exposure and illumination of ZnPc layers were conducted ex situ). On the other hand, it shows that either the NO2 exposure or the illumination do not have adverse effects on the ZnPc layer, which is essential for a long sensor lifetime.

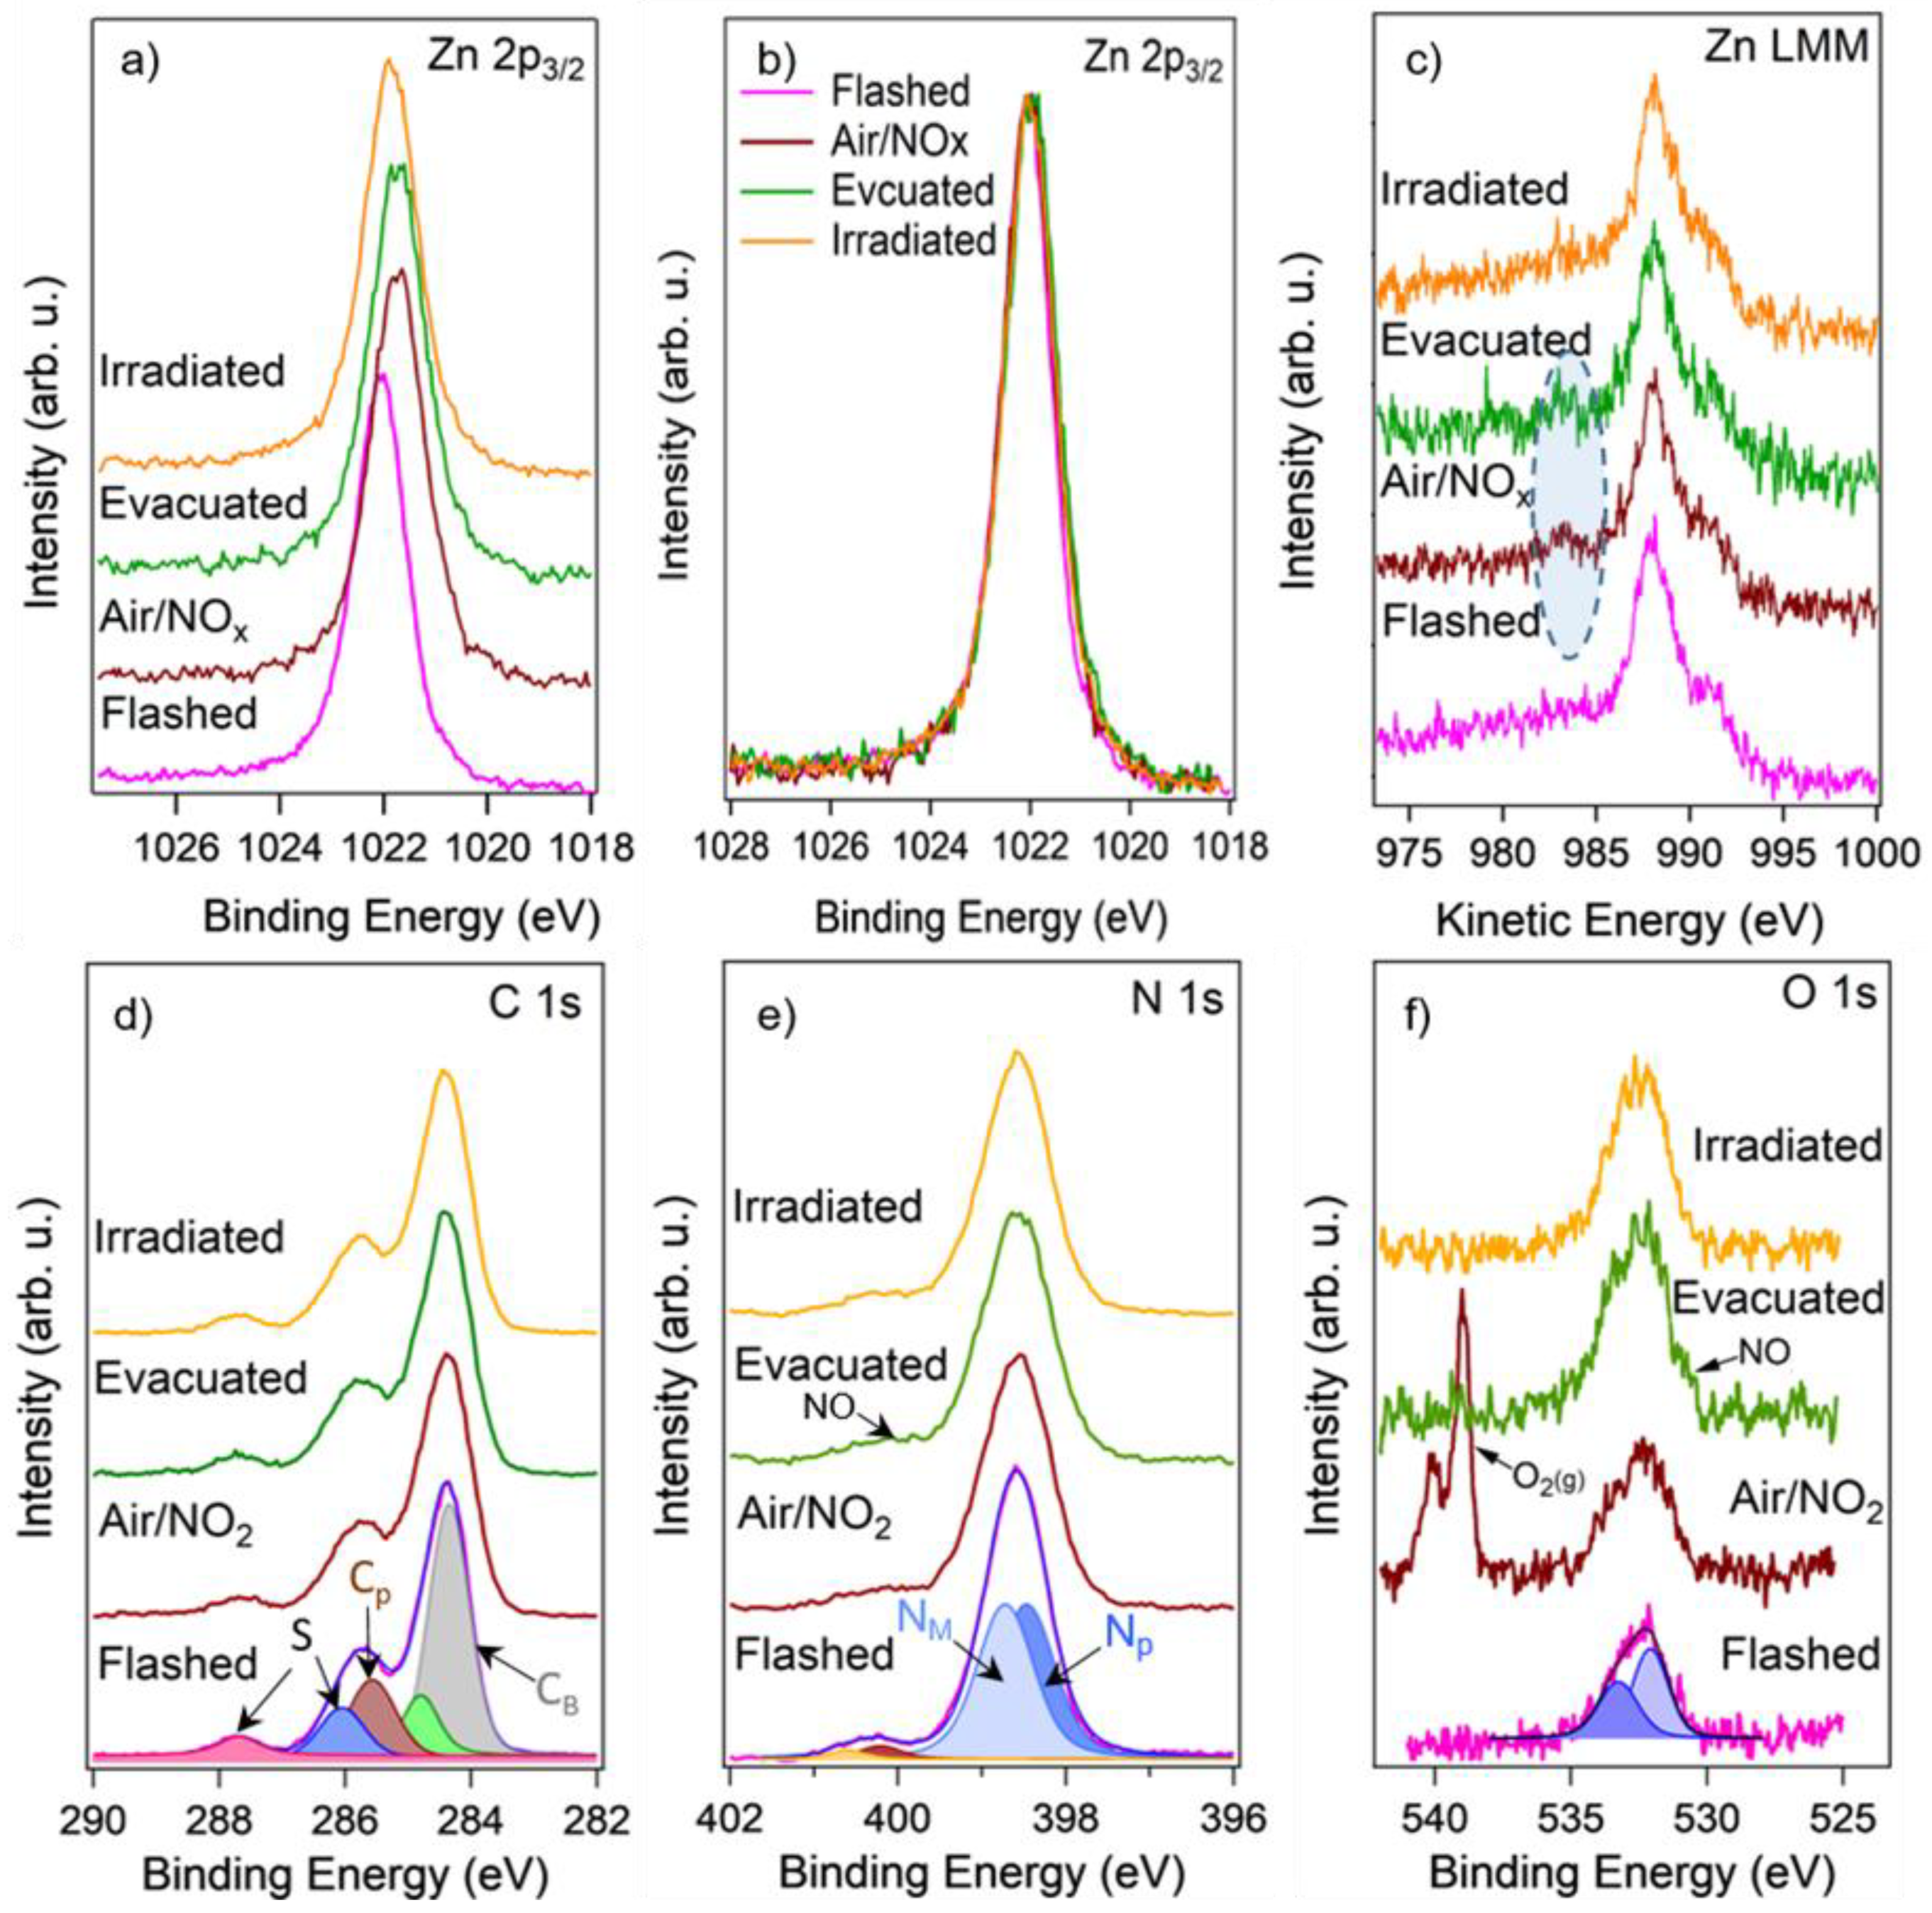
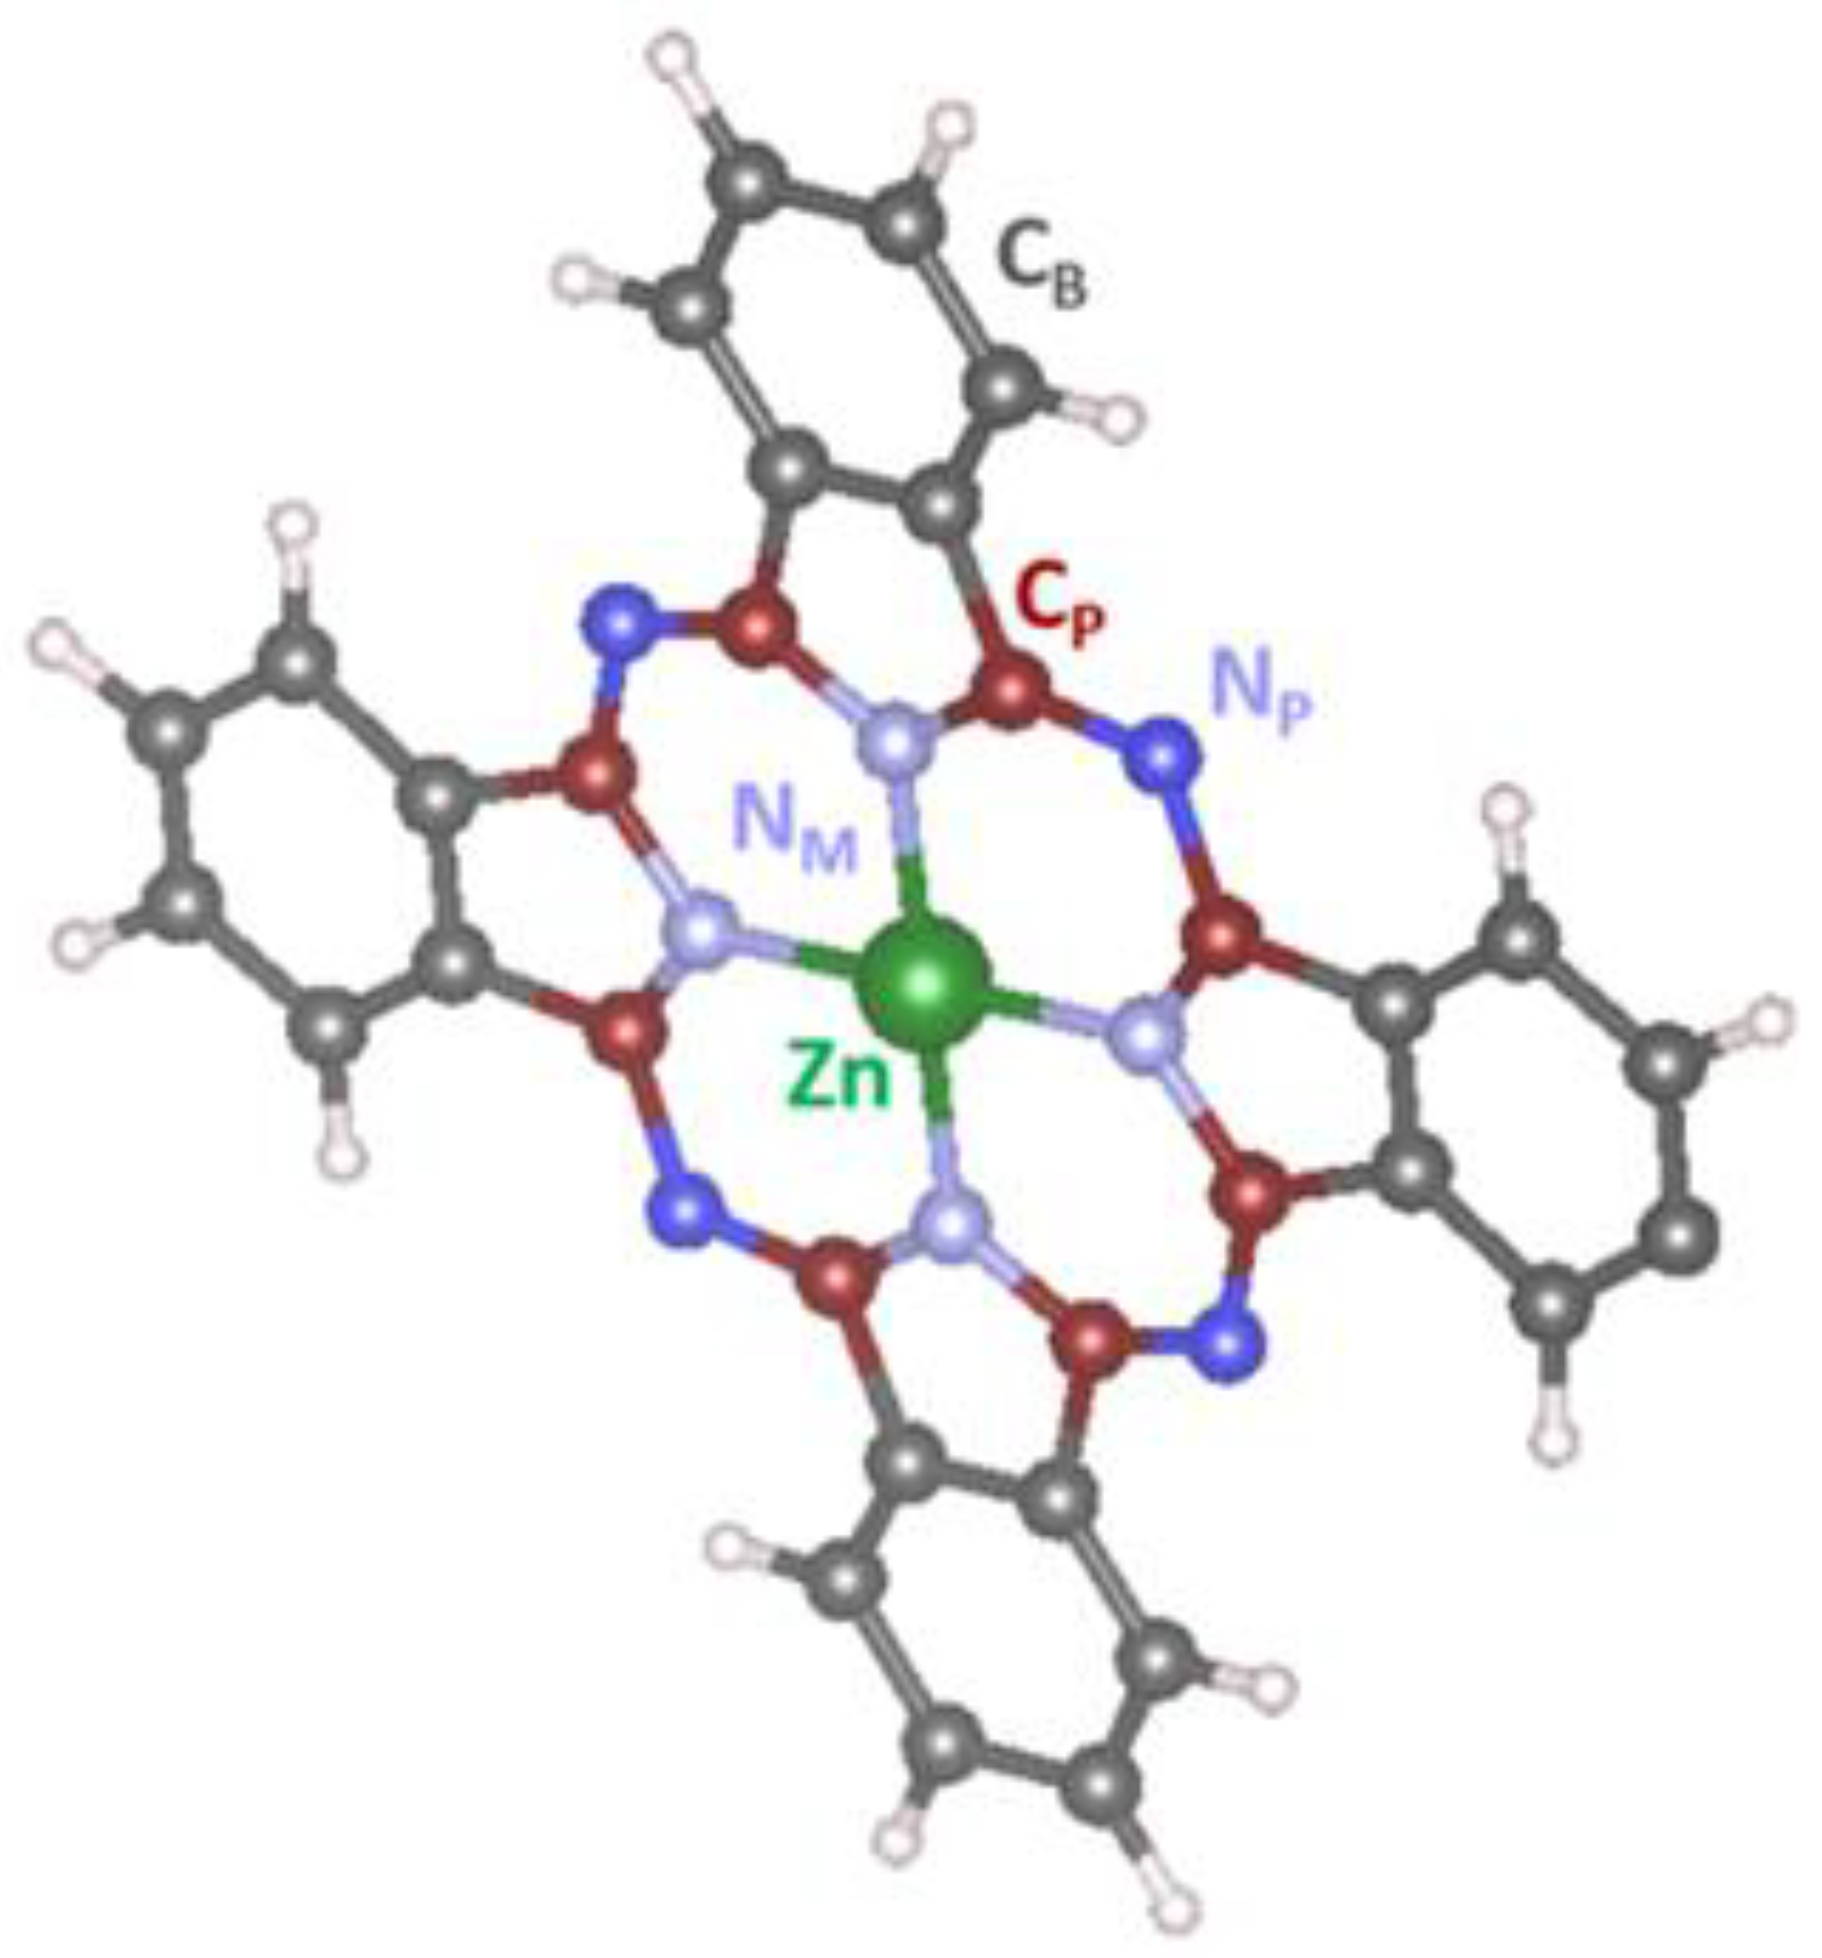
3.5. NAP-XPS Study of Photoregeneration of ZnPc Layers in the Presence of NO2

The near-ambient XPS was used to detect the chemical changes of a ZnPc layer during the NO2 exposure and the subsequent illumination. For this, the layer was first flashed to 140 °C in UHV to remove all possible contaminants and, consequently, exposed to 1 mbar of an air/NO2 gas mixture for two hours. This air/NO2 mixture contained 1% of NO2 for simulation of the sensor to be exposed to 10 ppm NO2. Indeed, the partial pressure of 10 ppm NO2 in the air at ambient conditions is 0.01 mbar that corresponds to the partial pressure of NO2 in our experiment. Such a concentration of NO2 was selected to be high enough to induce chemical changes in the ZnPc layer detectable by XPS, but still to be safe concerning the sensor degradation. After the exposure, the ambient was again evacuated to UHV, and, finally, the ZnPc layer was irradiated by the λ = 405 nm laser for 60 s. At each treatment step, a set of core-level spectra (Zn 2p, Zn LMM, C 1s, N 1s, and O 1s) was measured and presented in Figure 8.
Figure 8a demonstrates a comparison of the Zn 2p3/2 XPS spectra acquired on the ZnPc layer: right after the flash, during exposure to air/NO2, after the evacuation, and after the illumination by laser. The Zn 2p3/2 spectrum measured in UHV on the flashed layer revealed Zn atoms in Zn2+ oxidation state (~1022 eV). Exposure of the sample to 1 mbar of the air/NO2 led to attenuation of the peak intensity due to the signal absorption by the gas, and at the same time to its shift to lower binding energies (BE) by 0.3 eV that results most likely from band bending caused by adsorption of NO2 on the ZnPc surface, similarly as it is seen in case of metal oxides [29,34]. Another explanation might be that the peak shift to lower BE is connected with the Zn reduction. However, it is hardly expectable during NO2 exposure. Moreover, completely the same shift in the same direction was seen in all spectra (i.e., Zn LMM, C 1s, N 1s, and O 1s) measured together with the Zn 2p3/2 spectrum during NO2 exposure, confirming the band bending effect and excluding the reduction of phthalocyanine. This shift persisted even after the sample evacuation, indicating the persistence of the adsorbate species even after removal of the gas. Only the illumination of the sensor by laser partially restored the peak position by shifting it back by 0.15 eV. For easier comparison, the Zn 2p3/2 spectra, as well as other presented spectra, were processed according to a procedure that included spectra normalization to the same height and elimination of the band bending effects by shifting them to a higher BE (0.3 eV for the spectra measured in air/NO2 atmosphere and after the evacuation, and by 0.15 eV for the spectrum measured after the illumination by laser). The processed Zn 2p3/2 spectra are shown in Figure 8b. It can be seen that they look quite similar except for a slight broadening that appeared after the exposure to NO2, which might be related to the interaction of the Zn atoms with the NO2 molecules. The interaction of the Zn ions with NO2 can be better observed from the corresponding Zn LMM Auger spectra displayed in Figure 8c. It is known that the X-ray-induced Zn LMM Auger spectrum usually shows a much more significant shift with a change in the chemical state [35]. Indeed, it can be seen that before the air/NO2 exposure, the Zn LMM spectrum of the ZnPc layer consists of several features with the main peak at KE = 988 eV (KE–photoelectron kinetic energy), while after the exposure, a small peak appeared at about 984 eV. We could not find a reference for the Zn LMM peak at 984 eV in the literature, but this peak is probably related to those Zn2+ ions in ZnPc that adsorbed NO2 molecules. To explain this, we need to compare the Auger peaks for different Zn binding states corresponding to metallic Zn, ZnO, and ZnSO4. They appear to be at 992 eV, 988 eV, and 986 eV, respectively [36,37], and following this trend, it is reasonable to suggest that the adsorption of NO2 on ZnPc and subsequent formation of Zn-NO2 (or Zn-NO) compounds may result in the Zn LMM Auger peak at 984 eV.
Figure 8d–f shows the corresponding C 1s, N 1s, and O1s XPS spectra measured simultaneously with the Zn 2p3/2 and Zn LMM spectra. It can be seen that fitting the C 1s spectrum acquired from the flashed layer (the bottom spectrum in Figure 8d) resulted in five separated features at the energies of 284.4 eV, 284.9 eV. 285.8 eV, 286.2 eV, and 287.7 eV respectively. According to the literature [38], the most intensive peaks at 284.4 eV and 285.8 eV can be, respectively, assigned to benzene-type (Cb) and pyrrole-type (Cp) carbons in ZnPc, while the peaks at 286.2 eV and 287.7 eV to their shake-up satellites. The schematic representation of ZnPc molecule with the assignation of the benzene-type and pyrrole-type carbons and also different types of nitrogen atoms NP, NM is depicted in Figure 9. The last (fifth) peak at 284.9 eV, which is essential to obtain a good fit of the spectrum, most probably belongs to adventitious carbon usually present on the surface of most air-exposed samples. The C 1s spectra measured in air/NO2 atmosphere and after the evacuation preserved a similar shape as the one measured before the exposure. However, small changes indicating some decrease in the intensity of the Cp peak were noticed in both cases. This phenomenon is clearly visible when normalizing the spectra to the same height as revealed in Figure S2 of SI. It can be seen that the ratio between the Cp and Cb peaks in the C 1s spectra after the air/NO2 exposure decreased and started to recover only after the illumination by laser. In our opinion, this phenomenon has several explanations. First, it can result from broadening the Cp peak (and subsequently decreasing its amplitude) due to the interaction of Zn with NO2 and redistribution of the electron charge density inside the ZnPc molecule. Second, it may be caused by the direct adsorption of NO2 molecules on the pyrrole-type carbons that would also lead to a shift (or broadening) of the Cp peak position and its attenuation due to the dispersion of the Cp signal by the up-sitting NO2 molecules. However, this explanation seems less probable because numerous reports based on different experimental and theoretical investigations emphasize that the most favorable place for NO2 to adsorb on ZnPc is the central Zn atom [39]. Finally, it might be connected with the occurrence of highly active oxygen that may appear after NO2 decomposition and interact with Cp atoms. The last hypothesis came with analyzing the corresponding N 1s and O 1s spectra depicted in Figure 8e,f, respectively. It can be seen that N 1s spectrum acquired from the flashed ZnPc sample (the bottom spectrum in Figure 8e) consisted of two peaks fitted with four components at 398.5 eV, 398.8 eV, 400.3 eV, and 400.5 eV assigned to two different types of nitrogen (NP and NM) and their shake-up satellites (SNP and SNM), respectively [40]. When the sample was exposed to NO2, it is apparent that an additional small state appeared at BE of about 400 eV. According to the literature [41,42], this peak can be assigned to adsorbed NO or NO2 molecules. Based on this result, it may be concluded that NO2 molecules partially decompose into NO and O at the sensor surface and the NO molecule then most probably binds to the Zn atom and O the neighboring carbon atoms. This hypothesis is consistent with another observation: the corresponding O 1s spectra (Figure 8f) showed a substantial increase of oxygen signal after NO2 exposure and a very slight decrease after the sample illumination by the laser. It may indicate permanent oxidation of the ZnPc molecules. Indeed, the flashed sample (pink spectrum in Figure 8f) showed the presence of a certain oxygen signal on the surface that two states can fit at 532.1 eV and 533.2 eV, most probably originating from the possible partial oxidation of the ZnPc molecules during the synthesis.
The oxidation of ZnPc most probably implies oxygen binding to carbon atoms in the ZnPc structure (both Cb and Cp carbons). Upon exposure to air/NO2, both these peaks increased despite the signal attenuation by the gas phase (the O 1s spectra are presented as measured without height normalization). The real double intensity of those peaks can be assessed from the spectra measured after sample evacuation (green spectrum in Figure 8f). Moreover, a small shoulder is visible at BE of about 531.5 eV in the spectrum measured after the NO2 exposure. It can be seen much better after the evacuation of the environment. The laser irradiation slightly decreased the intensity of the peak at 533.2 eV and completely vanished the shoulder at 531.5 eV. It is thus reasonable to assume that these peaks are related to chemisorbed NOx species. The peak at 531.5 eV probably belongs to NO, while the NO2 species should have a feature at about 532.5–533 eV [42,43]. This peak overlaps with the peaks originating from the oxidized ZnPc (O-C and O=C bonds) and is difficult to identify. It is clear that strong NO2 exposure Zn-Pc results in irreversible oxidation of the carbon atoms in the metal-organic frame (oxygen remains on the surface even after the laser illumination).

4. Conclusions

The photoregeneration of ZnPc chemiresistor (previously exposed to nitrogen dioxide) by “monochromatic” LED illumination was studied as a new strategy for phthalocyanine sensor operation. This approach was demonstrated to be a reasonable alternative to drastic sensor heating or the necessity of the evacuation of ambient gas to recover the sensors from NO2 exposures.
By analyzing the NAP-XPS data, we concluded that nitrogen dioxide bonds to the Zn atom in ZnPc in the form of NO2 and NO, i.e., partial decomposition of NO2 molecules occurs during the interaction with the surface. It was also shown that the NOx species remain stacked to the ZnPc surface even after stopping the exposure and evacuation of the gas from the system. NAP-XPS spectra proved that an essential condition for the complete desorption of NOx species is the light illumination of the ZnPc surface. However, it is evident that the oxygen released due to the NO2 decomposition slowly oxidizes the ZnPc layer. Neither removing NO2 gas, nor irradiating the surface by light, removes the chemisorbed oxygen then, as it binds to carbon atoms in the phthalocyanine structure. This oxidation process is most probably responsible for the sensor deactivation observed in sensor experiments with high NO2 concentrations. To overcome this obstacle, the “constant exposure dose” method was established. The “constant exposure dose” method ensures that (1) the sensor is never exposed to a high dose of NO2 and (2) the photoregeneration always starts from a well-defined initial state with a constant small amount of chemisorbed species; thus, it can be conducted in a single fast pulse. The concentration of nitrogen dioxide is determined from the time period necessary to achieve the certain constant change of sensor resistance (in this case, it was ΔR/R = 10%). The total measurement period is inversely proportional to NO2 concentration. It was shown that the method works well for concentrations of 0.2–2.0 ppm. Considering the influence of light wavelength, it was shown that the photoregeneration requires light with a wavelength shorter than 550 nm.

Supplementary Materials

The following are available online at https://www.mdpi.com/article/10.3390/chemosensors9090237/s1, Figure S1: The determination of Limit of Detection, Figure S2: Overlapping of height-normalized C 1s XPS spectra acquired from the ZnPc layer in UHV after the flash (pink), in the presence of 1 mbar air/NO2 (brown), after the evacuation back to UHV (green), and after the illumination by laser (yellow).

Author Contributions

Conceptualization, M.V. (Mykhailo Vorokhta) and M.V. (Martin Vrňata); methodology, M.V. (Mykhailo Vorokhta); software, D.T., L.P. and M.H.; validation, P.F.; formal analysis, P.F. and V.G.; investigation, D.T., L.P., M.H. and V.G.; resources, I.M. and M.V. (Martin Vrňata); data curation, P.F.; writing—original draft preparation, M.V. (Mykhailo Vorokhta) and M.V. (Martin Vrňata); writing—review and editing, D.T., L.P., M.H. and I.M.; visualization, D.T., L.P. and M.H.; supervision, I.M.; project administration, M.V. (Mykhailo Vorokhta); funding acquisition, I.M. and M.V. (Martin Vrňata). All authors have read and agreed to the published version of the manuscript.

Funding

This research was funded by the Czech Science Foundation, grant number 19-02804S. This work was also financed by the Grant Schemes at Charles University, project registration number CZ.02.2.69/0.0/0.0/19_073/0016935. This work was also supported by the grant of Specific university research—grant No. A2_FCHI_2021_012.

Institutional Review Board Statement

Not applicable.

Informed Consent Statement

Not applicable.

Data Availability Statement

Not applicable.

Acknowledgments

We would like to thank the Central European Research Infrastructure Consortium (CERIC) for access to experimental facilities.

Conflicts of Interest

The authors declare no conflict of interest.

References

  1. Wöhrle, D.; Kreienhoop, L.; Schlettwein, D. Phthalocyanines and related macrocycles in organic phototovoltaic junctions. In Phthalocyanines, Properties, and Applications; VCH Publishers Inc.: New York, NY, USA, 1996. [Google Scholar]
  2. Cranston, R.R.; Lessard, B.H. Metal phthalocyanines: Thin-film formation, microstructure, and physical properties. RSC Adv. 2021, 11, 21716–21737. [Google Scholar] [CrossRef]
  3. Gregory, P. Industrial applications of phthalocyanines. J. Porphyr. Phthalocyanines 2000, 4, 432–437. [Google Scholar] [CrossRef]
  4. Williams, G.; Sutty, S.; Klenkler, R.; Aziz, H. Renewed interest in metal phthalocyanine donors for small molecule organic solar cells. Sol. Energy Mater. Sol. Cells 2014, 124, 217–226. [Google Scholar] [CrossRef]
  5. Vesselli, E. Tetrapyrroles at near-ambient pressure: Porphyrins and phthalocyanines beyond the pressure gap. J. Phys. Mater. 2020, 3, 022002. [Google Scholar] [CrossRef]
  6. Rydosz, A.; Maciak, E.; Wincza, K.; Gruszczynski, S. Microwave-based sensors with phthalocyanine films for acetone, ethanol and methanol detection. Sens. Actuators B Chem. 2016, 237, 876–886. [Google Scholar] [CrossRef]
  7. Rossignol, J.; Barochi, G.; De Fonseca, B.; Brunet, J.; Bouvet, M.; Pauly, A.; Markey, L. Microwave-based gas sensor with phthalocyanine film at room temperature. Sens. Actuators B Chem. 2013, 189, 213–216. [Google Scholar] [CrossRef]
  8. Brunet, J.; Garcia, V.P.; Pauly, A.; Varenne, C.; Lauron, B. An optimised gas sensor microsystem for accurate and real-time measurement of nitrogen dioxide at ppb level. Sens. Actuators B Chem. 2008, 134, 632–639. [Google Scholar] [CrossRef]
  9. Wilson, A.; Wright, J.D. Understanding and optimising NO2-sensing using semiconducting phthalocyanine films. Mol. Cryst. Liq. Cryst. Sci. Technol. A Mol. Cryst. Liq. Cryst. 1992, 211, 321–326. [Google Scholar] [CrossRef]
  10. Zhou, Q.; Gould, R.D. A study of the response rate to nitrogen dioxide exposure in metal phthalocyanine thin film sensors. Thin Solid Films 1998, 317, 436–439. [Google Scholar] [CrossRef]
  11. Jalil, A.R.; Chang, H.; Bandari, V.K.; Robaschik, P.; Zhang, J.; Siles, P.F.; Li, G.; Bürger, D.; Grimm, D.; Liu, X.; et al. Fully Integrated Organic Nanocrystal Diode as High Performance Room Temperature NO2 Sensor. Adv. Mater. 2016, 28, 2971–2977. [Google Scholar] [CrossRef] [PubMed]
  12. Newton, M.I.; Starke, T.K.H.; Willis, M.R.; McHale, G. NO2 detection at room temperature with copper phthalocyanine thin film devices. Sens. Actuators B Chem. 2000, 67, 307–311. [Google Scholar] [CrossRef]
  13. Wilson, A.; Wright, J.D.; Chadwick, A.V. A microprocessor-controlled nitrogen dioxide sensing system. Sensors Actuators B. Chem. 1991, 4, 499–504. [Google Scholar] [CrossRef]
  14. Wright, J.D. Gas adsorption on phthalocyanines and its effects on electrical properties. Prog. Surf. Sci. 1989, 31, 1–60. [Google Scholar] [CrossRef]
  15. Masel, R.I. Principles of Adsorption and Reaction on Solid Surfaces; John Wiley & Sons: New York, NY, USA, 1996. [Google Scholar]
  16. Passard, M.; Maleysson, C.; Pauly, A.; Dogo, S.; Germain, J.P.; Blanc, J.P. Gas sensitivity of phthalocyanine thin films. Sens. Actuators B Chem. 1994, 19, 489–492. [Google Scholar] [CrossRef]
  17. Guillaud, G.; Simon, J.; Germain, J.P. Metallophthalocyanines gas sensors, resistors and field effect transistors. Coord. Chem. Rev. 1998, 178–180, 1433–1484. [Google Scholar] [CrossRef]
  18. Li, J.; Liu, M.; Jiang, J.; Liu, B.; Tong, H.; Xu, Z.; Yang, C.; Qian, D. Morphology-controlled electrochemical sensing properties of CuS crystals for tartrazine and sunset yellow. Sens. Actuators B Chem. 2019, 288, 552–563. [Google Scholar] [CrossRef]
  19. Li, J.; Jiang, J.; Zhao, D.; Xu, Z.; Liu, M.; Liu, X.; Tong, H.; Qian, D. Novel hierarchical sea urchin-like Prussian blue@palladium core–shell heterostructures supported on nitrogen-doped reduced graphene oxide: Facile synthesis and excellent guanine sensing performance. Electrochim. Acta 2020, 330, 135196. [Google Scholar] [CrossRef]
  20. Padma, N.; Joshi, A.; Singh, A.; Deshpande, S.K.; Aswal, D.K.; Gupta, S.K.; Yakhmi, J.V. NO2 sensors with room temperature operation and long term stability using copper phthalocyanine thin films. Sens. Actuators B Chem. 2009, 143, 246–252. [Google Scholar] [CrossRef]
  21. Liu, C.J.; Shih, J.J.; Ju, Y.H. Surface morphology and gas sensing characteristics of nickel phthalocyanine thin films. Sens. Actuators B Chem. 2004, 99, 344–349. [Google Scholar] [CrossRef]
  22. Pizzini, S.; Timo, G.L.; Beghi, M.; Butta, N.; Mari, C.M.; Faltenmaier, J. Influence of the structure and morphology on the sensitivity to nitrogen oxides of phthalocyanine thin-film resistivity sensors. Sens. Actuators 1989, 17, 481–491. [Google Scholar] [CrossRef]
  23. Sadaoka, Y.; Jones, T.A.; Revell, G.S.; Göpel, W. Effects of morphology on NO2 detection in air at room temperature with phthalocyanine thin films. J. Mater. Sci. 1990, 25, 5257–5268. [Google Scholar] [CrossRef]
  24. Reddy, S.M. Materials for Chemical Sensing; Paixão, T.R.L.C., Ed.; Springer International Publishing AG: Cham, Switzerland, 2017. [Google Scholar]
  25. Baldini, F.; Capobianchi, A.; Falai, A.; Mencaglia, A.A.; Pennesi, G. Reversible and selective detection of NO2 by means of optical fibres. Sens. Actuators B Chem. 2001, 74, 12–17. [Google Scholar] [CrossRef]
  26. Bueno, A.; Lahem, D.; Caucheteur, C.; Debliquy, M. Reversible NO2 optical fiber chemical sensor based on LuPc2 using simultaneous transmission of UV and visible light. Sensors 2015, 15, 9870–9881. [Google Scholar] [CrossRef] [Green Version]
  27. Chizhov, A.S.; Rumyantseva, M.N.; Vasiliev, R.B.; Filatova, D.G.; Drozdov, K.A.; Krylov, I.V.; Abakumov, A.M.; Gaskov, A.M. Visible light activated room temperature gas sensors based on nanocrystalline ZnO sensitized with CdSe quantum dots. Sens. Actuators B Chem. 2014, 205, 305–312. [Google Scholar] [CrossRef]
  28. Vorokhta, M.; Khalakhan, I.; Vondráček, M.; Tomeček, D.; Vorokhta, M.; Marešová, E.; Nováková, J.; Vlček, J.; Fitl, P.; Novotný, M.; et al. Investigation of gas sensing mechanism of SnO2 based chemiresistor using near ambient pressure XPS. Surf. Sci. 2018, 687, 284–290. [Google Scholar] [CrossRef]
  29. Hozák, P.; Vorokhta, M.; Khalakhan, I.; Jarkovská, K.; Cibulková, J.; Fitl, P.; Vlček, J.; Fara, J.; Tomeček, D.; Novotný, M.; et al. New Insight into the Gas-Sensing Properties of CuOx Nanowires by Near-Ambient Pressure XPS. J. Phys. Chem. C 2019, 123, 29739–29749. [Google Scholar] [CrossRef]
  30. Piliai, L.; Tomeček, D.; Hruška, M.; Khalakhan, I.; Nováková, J.; Fitl, P.; Yatskiv, R.; Grym, J.; Vorokhta, M.; Matolínová, I.; et al. New insights towards high-temperature ethanol-sensing mechanism of ZnO-Based chemiresistors. Sensors 2020, 20, 5602. [Google Scholar] [CrossRef]
  31. Tomecek, D.; Hruska, M.; Fitl, P.; Vlcek, J.; Maresova, E.; Havlova, S.; Patrone, L.; Vrnata, M. Phthalocyanine Photoregeneration for Low Power Consumption Chemiresistors. ACS Sens. 2018, 3, 2558–2565. [Google Scholar] [CrossRef]
  32. Park, J.H.; Natesan, K. Oxidation of copper and electronic transport in copper oxides. Oxid. Met. 1993, 39, 411–435. [Google Scholar] [CrossRef]
  33. SenGupta, S.; Upadhyaya, H.P.; Kumar, A.; Dhanya, S.; Naik, P.D.; Bajaj, P. Photodissociation dynamics of nitrotoluene at 193 and 248 nm: Direct observation of OH formation. Chem. Phys. Lett. 2008, 452, 239–244. [Google Scholar] [CrossRef]
  34. Haidry, A.A.; Kind, N.; Saruhan, B. Investigating the influence of Al-doping and background humidity on NO2 sensing characteristics of magnetron-sputtered SnO2 sensors. J. Sens. Sens. Syst. 2015, 4, 271–280. [Google Scholar] [CrossRef] [Green Version]
  35. Gomez-Alvarez, M.A.; Morales, C.; Méndez, J.; del Campo, A.; Urbanos, F.J.; Díaz, A.; Reséndiz, L.; Flege, J.I.; Granados, D.; Soriano, L. A Comparative Study of the ZnO Growth on Graphene and Graphene Oxide: The Role of the Initial Oxidation State of Carbon. C J. Carbon Res. 2020, 6, 41. [Google Scholar] [CrossRef]
  36. Deroubaix, G.; Marcus, P. X-ray photoelectron spectroscopy analysis of copper and zinc oxides and sulphides. Surf. Interface Anal. 1992, 18, 39–46. [Google Scholar] [CrossRef]
  37. Dake, L.S.; Baer, D.R.; Zachara, J.M. Auger parameter measurements of zinc compounds relevant to zinc transport in the environment. Surf. Interface Anal. 1989, 14, 71–75. [Google Scholar] [CrossRef]
  38. Evangelista, F.; Carravetta, V.; Stefani, G.; Jansik, B.; Alagia, M.; Stranges, S.; Ruocco, A. Electronic structure of copper phthalocyanine: An experimental and theoretical study of occupied and unoccupied levels. J. Chem. Phys. 2007, 126, 124709. [Google Scholar] [CrossRef] [PubMed]
  39. Nguyen, T.Q.; Escaño, M.C.S.; Kasai, H. Nitric oxide adsorption effects on metal phthalocyanines. J. Phys. Chem. B 2010, 114, 10017–10021. [Google Scholar] [CrossRef]
  40. De Oteyza, D.G.; El-Sayed, A.; Garcia-Lastra, J.M.; Goiri, E.; Krauss, T.N.; Turak, A.; Barrena, E.; Dosch, H.; Zegenhagen, J.; Rubio, A.; et al. Copper-phthalocyanine based metal-organic interfaces: The effect of fluorination, the substrate, and its symmetry. J. Chem. Phys. 2010, 133, 214703. [Google Scholar] [CrossRef] [Green Version]
  41. Herranz, T.; Deng, X.; Cabot, A.; Liu, Z.; Salmeron, M. In situ XPS study of the adsorption and reactions of NO and O2 on gold nanoparticles deposited on TiO2 and SiO2. J. Catal. 2011, 283, 119–123. [Google Scholar] [CrossRef]
  42. Park, J.H.; Royer, J.E.; Chagarov, E.; Kaufman-Osborn, T.; Edmonds, M.; Kent, T.; Lee, S.; Trogler, W.C.; Kummel, A.C. Atomic imaging of the irreversible sensing mechanism of NO2 adsorption on copper phthalocyanine. J. Am. Chem. Soc. 2013, 135, 14600–14609. [Google Scholar] [CrossRef]
  43. Baltrusaitis, J.; Jayaweera, P.M.; Grassian, V.H. XPS study of nitrogen dioxide adsorption on metal oxide particle surfaces under different environmental conditions. Phys. Chem. Chem. Phys. 2009, 11, 8295–8305. [Google Scholar] [CrossRef]
Figure 1. Schematics for measurement of the sensor response to nitrogen dioxide using an alumina chemiresistor substrate equipped with Pt electrodes in an interdigital arrangement.
Chemosensors 09 00237 g001
Figure 2. The arrangement of photoregeneration experiments.
Chemosensors 09 00237 g002
Figure 3. (a) Schematic illustration of the illumination geometry for the SERS study; (b) Physical realization of the illumination (photograph); (c) Labram HR800 spectrophotometer.
Chemosensors 09 00237 g003
Figure 4. (a) Sequence of three ZnPc photoregeneration cycles (30 s sensing period + multiple 30 s illumination pulses) using wavelengths of 723, 678, and 630 nm, illustrating low efficiency of the light with the wavelengths above 550 nm; (b) Sequence of five ZnPc photoregeneration cycles carried out by the light of 518, 500, 457, 441, and 412 nm illustrating various photoregeneration efficiencies of the light used; (c) the same as (b) but at an elevated temperature (100 °C). The hashtag (#) marks the region where the diodes were changed and apparatus dead time compensated.
Chemosensors 09 00237 g004
Figure 5. (a) Length of the measurement period tmeas as a function of NO2 concentration (0.2–2 ppm); (b) Illustration of the measurement for two different NO2 concentrations (0.35 and 1.55 ppm). (c) Photoregeneration of ZnPc sensor by LED illumination (λ = 441 nm) at the operating temperature of 55 °C using single photoregeneration pulses (“constant exposure dose” regime).
Chemosensors 09 00237 g005
Figure 6. Comparison of photoregeneration and temperature regeneration under dark conditions—sequence of one photoregeneration cycle (pulses of 30 s of illumination and 30 s of waiting) and three different (10, 20, and 40 °C) temperature regeneration cycles (pulses of 30 s of raised temperature and 30 s of waiting) after NO2 exposure.
Chemosensors 09 00237 g006
Figure 7. SERS spectra of a ZnPc layer in 3 various states (pristine, after NO2 exposure, and after illumination).
Chemosensors 09 00237 g007
Figure 8. Comparison of height-normalized Zn 2p3/2 XPS spectra acquired from the ZnPc layer in UHV after the flash (pink), in the presence of 1 mbar air/NO2 (brown), after the evacuation back to UHV (green), and after the illumination by laser (orange) before (a) and after (b) the elimination of the band bending. (c) Comparison of height-normalized Zn LMM Auger spectra measured together with the Zn 2p3/2 spectra at the same conditions. (d,e) Comparison of height-normalized C 1s and N 1s XPS spectra acquired together with the Zn 2p3/2 spectra at the same conditions. (f) Non-normalized (as measured) O 1s XPS spectra acquired with the Zn 2p3/2 spectra at the same conditions.
Chemosensors 09 00237 g008
Figure 9. The schematic representation of ZnPc molecule with assignation of benzene-type and pyrrole-type carbons and also different types of nitrogen atoms NP, NM.
Chemosensors 09 00237 g009
Publisher’s Note: MDPI stays neutral with regard to jurisdictional claims in published maps and institutional affiliations.

