Article

The UV Effect on the Chemiresistive Response of ZnO Nanostructures to Isopropanol and Benzene at PPM Concentrations in Mixture with Dry and Wet Air

by
Maksim A. Solomatin
1,2,
Olga E. Glukhova
3,4,
Fedor S. Fedorov
5,
Martin Sommer
6,
Vladislav V. Shunaev
3,
Alexey S. Varezhnikov
1,
Albert G. Nasibulin
5,
Nikolay M. Ushakov
2,3 and
Victor V. Sysoev
1,*
1
Department of Physics, Yuri Gagarin State Technical University of Saratov, 410054 Saratov, Russia
2
Saratov Branch of Kotelnikov Institute of Radioengineering and Electronics of RAS, 410019 Saratov, Russia
3
Institute of Physics, Saratov State University, 410012 Saratov, Russia
4
Institute for Bionic Technologies and Engineering, I.M. Sechenov First Moscow State Medical University (Sechenov University), 119991 Moscow, Russia
5
Skolkovo Institute of Science and Technology, 121205 Moscow, Russia
6
Institute for Microstructure Technology, Karlsruhe Institute of Technology (KIT), 76344 Eggenstein-Leopoldshafen, Germany
*
Author to whom correspondence should be addressed.
Chemosensors 2021, 9(7), 181; https://doi.org/10.3390/chemosensors9070181
Submission received: 19 June 2021 / Revised: 9 July 2021 / Accepted: 12 July 2021 / Published: 14 July 2021

Abstract

:
Towards the development of low-power miniature gas detectors, there is a high interest in the research of light-activated metal oxide gas sensors capable to operate at room temperature (RT). Herein, we study ZnO nanostructures grown by the electrochemical deposition method over Si/SiO2 substrates equipped by multiple Pt electrodes to serve as on-chip gas monitors and thoroughly estimate its chemiresistive performance upon exposing to two model VOCs, isopropanol and benzene, in a wide operating temperature range, from RT to 350 °C, and LED-powered UV illumination, 380 nm wavelength; the dry air and humid-enriched, 50 rel. %, air are employed as a background. We show that the UV activation allows one to get a distinctive chemiresistive signal of the ZnO sensor to isopropanol at RT regardless of the interfering presence of H2O vapors. On the contrary, the benzene vapors do not react with UV-illuminated ZnO at RT under dry air while the humidity’s appearance gives an opportunity to detect this gas. Still, both VOCs are well detected by the ZnO sensor under heating at a 200–350 °C range independently on additional UV exciting. We employ quantum chemical calculations to explain the differences between these two VOCs’ interactions with ZnO surface by a remarkable distinction of the binding energies characterizing single molecules, which is −0.44 eV in the case of isopropanol and −3.67 eV in the case of benzene. The full covering of a ZnO supercell by H2O molecules taken for the effect’s estimation shifts the binding energies to −0.50 eV and −0.72 eV, respectively. This theory insight supports the experimental observation that benzene could not react with ZnO surface at RT under employed LED UV without humidity’s presence, indifference to isopropanol.

Graphical Abstract

1. Introduction

The increasing demand of human society for portable detectors able to effectively monitor the environment air forces plenty of research activities in the direction to the development of gas sensors with advanced characteristics which yield a promising low-cost alternative to analytical instrumentation [1]. So far, such sensors primarily rely on a change of optical [2] or electrical [3] properties of various materials interfaced with a gas media [4]. These properties and their gas-induced changes could be properly read with several transduction principles of which the conductance measurement is still retained as the simplest but powerful method [5]. Since the pioneering research by Sejama [6], the commercial chemiresistors are developed employing mostly wide-gap semiconducting metal oxides which however require an external activation to facilitate charge exchange at the surface as the interface between the solid and a gas phase [7]. Such an activation implies conventionally heating up to 250–400 °C range which makes a need in advanced energy consumption of the sensor-based measuring units [8]. The common trend in electronics to miniaturization allows one to reduce the feed power for example with micro-hotplates [9] to go down to low hundreds of mW per sensor [10] but the cost of such systems goes up, too. As a reasonable alternative, rather recently it was discovered that the UV radiation could excite a chemiresistive effect at room temperature (RT) in metal oxides whose gap is close to the radiation energy [11]; even the power of cheap light-emitting diodes (LEDs) might be enough [12]. Nowadays, LED-activated oxide sensors find considerable interest when developing low-power gas-analytical units [13,14]. From this viewpoint, zinc oxide is considered to be an extremely appropriate material because of its bandgap, equal to ca. 3.4 eV [15], which falls into the range where UV, 100–400 nm of wavelength, could excite electron transitions. Therefore, ZnO has been actively investigated, for example, in the form of polycrystalline films [16,17], nanoparticles [18], nanorods [19,20,21], microspheres [22], subµm-thick fibers [23], single-crystalline sheets [24], and various nanostructured layers [25] as promising UV-activated gas sensor versus mainly alcohol vapors. In this case, the structures which have a large surface to interact with the gaseous phase but rather a thin bulk, down to nanodomain, to be effectively modulated by surface processes are advantageous.
Here we have got a look at the ZnO nanostructures grown by electrochemical deposition under constant potential over a substrate [26] equipped with multiple electrodes to further serve as a gas sensor. We have compared the response of grown ZnO to isopropanol and benzene as two model VOC analytes in a wide temperature range from RT to 350 °C with/without UV excitation. From a practical view, the observations further support that sensing of alcohol vapors with ZnO could be effectively supported by UV, 380 nm wavelength, at RT-150 °C temperature range while benzene shows a more complicated chemiresistive performance requiring a presence of H2O or higher energies to facilitate the response. From a fundamental view, the results are explained by the density functional tight-binding method (DFTB) to be matured from the differences in the binding energies of these two VOC molecules with the ZnO surface.

2. Materials and Methods

2.1. Electrochemical Deposition of ZnO Nanostructures

Zinc oxide nanostructures were electrochemically synthesized in an aqueous solution of 0.1 M Zn(NO3)2 at potential −1 V vs a reference Ag/AgClsat electrode in the conventional three-electrode configuration as depicted in Figure 1 similar to protocols reported earlier for deposition of other oxides [27,28]. We utilized Si/SiO2 substrate, 8 × 10 mm2, whose frontside was supplied with multiple Pt strip electrodes, ca. 120 μm width, in parallel to be distanced by a gap of ca. 80 μm as a multielectrode chip following the architecture reported earlier [29]. To monitor the operating temperature over the chip, the sensing area was surrounded by two meander Pt thermoresistors, 1 μm height, deposited simultaneously with the measuring electrodes by sputtering under the shadow mask. The rare side of the chip was equipped with four heating meanders made of Pt film, 1 μm height. We consider this platform design as the most suitable one for material characterization in the framework of “lab-on-chip” paradigm. The chip was wired into a ceramic holder which allowed us to selectively connect each Pt electrode or several Pt electrodes under the synthesis process [30]. A graphite rod was employed as a counter electrode. During the synthesis, we have maintained an electrolyte at a temperature of 80 °C using a hotplate defined to be optimal for ZnO growth in preliminary experiments. The electric currents and potential were measured with the help of a potentiostat (P50 Pro, Elins, Russia) employed to run the process. We have varied the deposition time of ZnO in the range of 400–1150 s as a major parameter to have the spatially distributed oxide areas over the substrate of various densities to see the differences of properties of the synthesized layer within the same chip, subject to various external factors (gas exposure, temperature, UV).
The noted time range has been chosen based on preliminary studies which ensured the absence of percolation for a current in the layers deposited at shorter time intervals while longer time resulted in a continuous thicker layer.

2.2. Material’s Characterization

The morphology of the oxide layer deposited over the multielectrode chip has been evaluated by scanning electron microscopy (AURIGA CrossBeam, Carl Zeiss AG, Germany) at 5 kV of accelerating voltage. The layer composition has been checked with Raman spectroscopy (DXR™ xi Raman Imaging Microscope, ThermoFisher Scientific, Waltham, MA, USA) using a laser, 532 nm wavelength, at the power of 1 mW with ×50 objective. The crystal structure has been inspected by X-ray diffraction (XRD) employing Bruker D8 advance diffractometer (Bruker, Germany) with CuKα radiation source, λ = 0.15418 nm, under Bragg-Brentano geometry. Patterns were acquired in the 2Θ range from 10° to 90° at a 0.0098° step; accumulation time was 0.2 s. Soller mirrors of 2.5 mm were used. The acquired XRD patterns were processed using @Eva4.3 software. The samples were characterized following the operation of the chip in the course of reported measurements under heating up to 300 °C.

2.3. Gas-Sensing Measurements

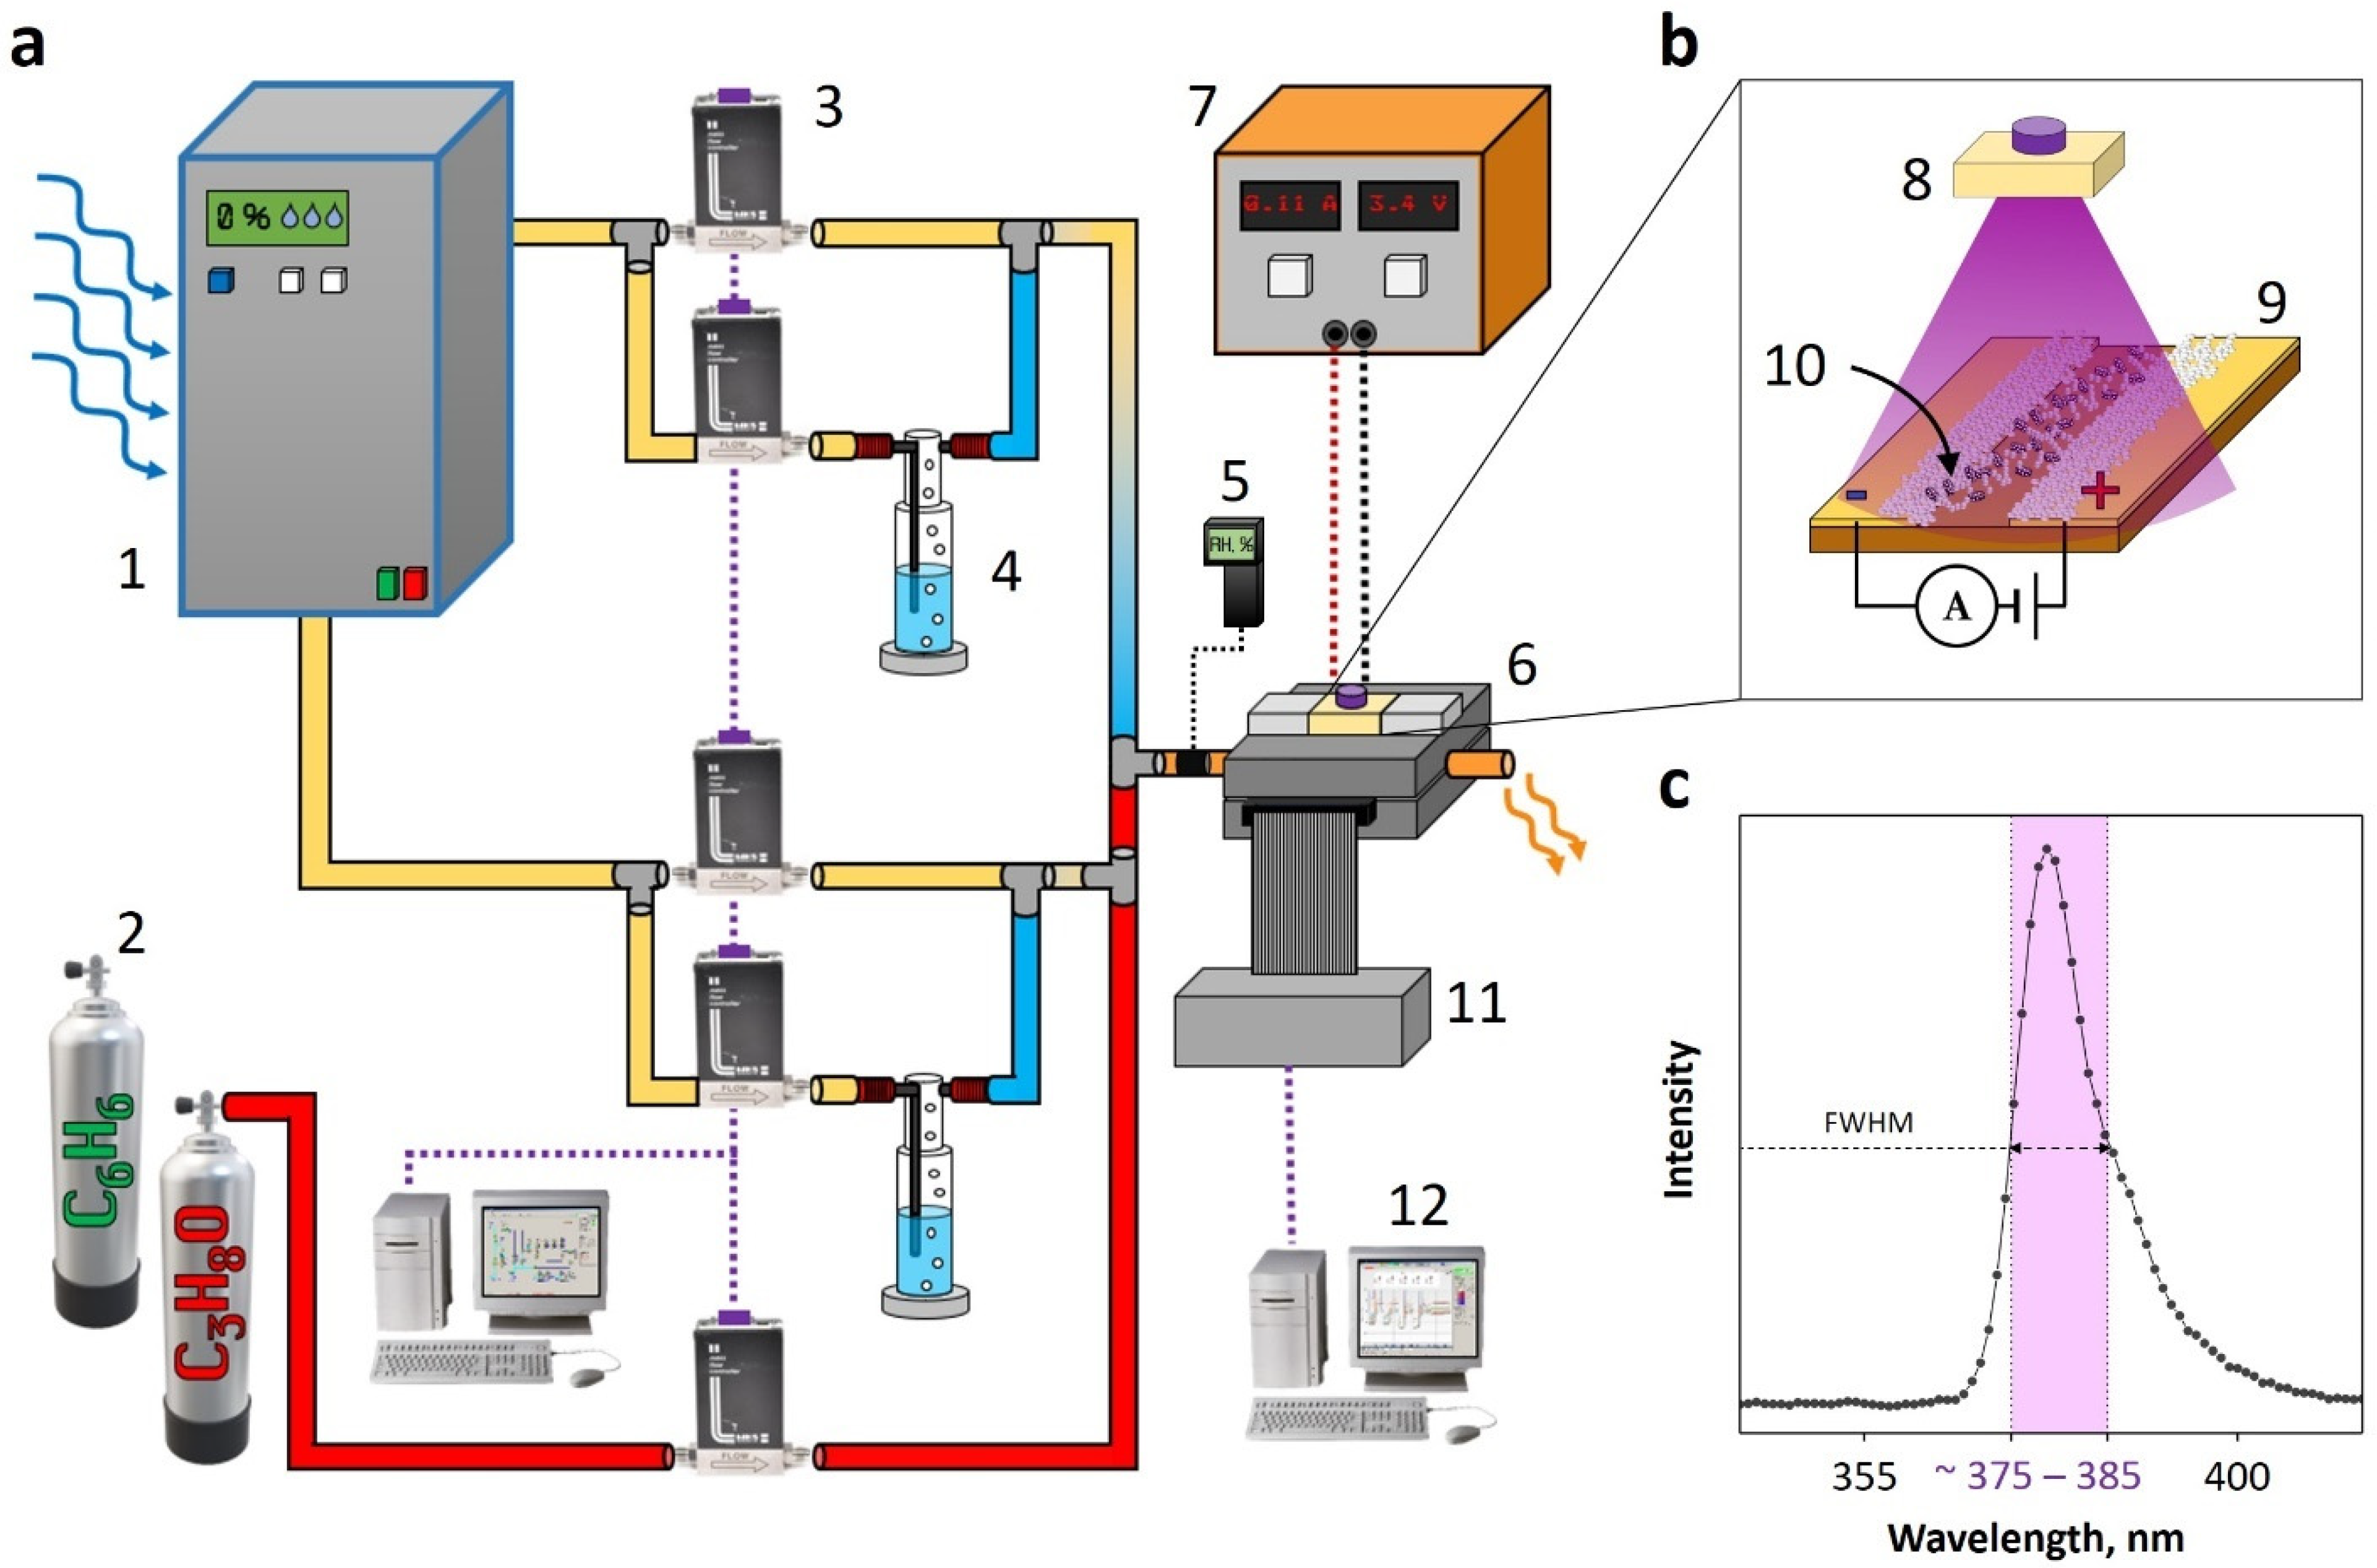
To measure the chemiresistive effect in the grown ZnO layer, the multielectrode chip has been placed into a setup shown in Figure 2 as primarily reported earlier [31]. The setup consisted of two major parts aimed both to prepare analyte gases and to deliver them to the chip as well as to read out the resistances of the ZnO layer confined between two measuring electrodes with/without UV radiation. The gaseous analytes were supplied under a dynamic flow mode with a flowrate managed by precision mass-flow controllers (MKS Instruments, Inc., Andover, MA, USA) at 500 sccm.
The analyte gas concentration in the probe, 1, 10 and 100 ppm, has been adjusted by mixing the dry filtered air from the generator (SylaTech GmbH, Walzbachtal, Germany) with source mixtures of isopropanol/synthetic air and benzene/air, each of 250 ppm concentration, at the corresponding ratio. The source analyte mixtures were contained in bottles as prepared. The measurements under humidity, 50 rel. %, enriched conditions were carried out via forking the dry air into two lines, where one line was purged through a Drexel flask containing deionized water, with further mixing at a 1:1 ratio. The chosen analyte concentrations correspond to or below the exposure limits of isopropanol and benzene vapors in the air (see, for instance [32]. Both gas pipe lines corresponding to reference air and analyte-enriched air are supplied with a humid generator (a bubbler) to vary independently the humidity content in analyte probes. The humidity content in the gas probe delivered to the chip under study has been independently monitored with a hygrometer (Testo, model 601, Titisee-Neustadt, Germany).
To perform measurements of the chemiresistive effect in the deposited ZnO nanostructured layer, the multielectrode chip was placed in a sealed measuring steel-based chamber equipped with a UV light-emitting diode installed to illuminate the front side of the chip with the layer as depicted in Figure 2b. The chip has been secured by two dielectric rings inside the chamber. The LED emission wavelength was checked with a spectrometer (BTC112 Series Fiber Coupled TE Cooled CCD Spectrometer, B&W Tek, Newark, NJ, USA). The efficient values estimated using a full width at half maximum of the LED spectrum were 375–385 nm (Figure 2c) that yields photons with energy equal to ca. 3.2–3.3 eV. The LED was powered by a supply unit (BEHA Uniwatt Labornetzteil NG 304T, Germany). To heat the multielectrode chip with temperatures up to 350 °C, four Pt meander heaters were realized at the chip backside. The temperature was independently controlled by calibrated Pt thermoresistors located at the edges of the front side of the chip [30].
We measured the resistance of the ZnO layer between each couple of Pt electrodes as a chemiresistor utilizing a KAMINA electrical measuring unit [33] with a sampling rate of 1 Hz per all the chemiresistor array located at the chip. The electrical measuring unit was controlled by a homemade software interfaced to the PC to allow one reading, storing, and visualization of the received data in real-time. The chemiresistive properties of the ZnO layer were studied in the temperature range from RT, equal to approx. 20 °C, to 350 °C towards isopropanol and benzene, 1–100 ppm of concentration, in the atmosphere of both dried and humid, 50 rel. %, air. The chip operating temperature was driven by the in-built meander heaters, with approx. 1 °C accuracy, and monitored with the thermoresistors. The total temperature in the lab during the measurements was secured by air conditioning at the given value. The temperature of gas flow going to the chamber with a chip was monitored with a thermometer combined with the hygrometer.
The time of analyte exposure to the chip was adjusted to be 90 min while air purging was 120 min accounting for preliminary studies to ensure long-term transients as observed frequently in practice. The chemiresistive response to the analytes was calculated in percent as
S = ( R a R g 1 ) · 100   % ,
where Ra, Rg are resistances of the segment of ZnO layer, confined between each couple of measuring electrodes at the chip, in pure reference air and analyte-enriched air, respectively.
The multi-dimensional signal of the array of ZnO layer segments located at the chip was processed by Linear Discriminant Analysis (LDA) technique [34]. Because of the large variation in analyte concentration in the probes, of two orders of magnitude, we have taken a logarithm of raw resistance values recorded under various impacts as a pre-processing technique to feed the LDA algorithm.

2.4. DFTB Calculations

The search for the ground state of the considered objects as well as the calculation of their band structures were performed by the self-consistent charge density-functional tight-binding method (SCC DFTB) [35]. In terms of computational speed, the SCC DFTB method is comparable to traditional semi-empirical methods, but, in general, provides the accuracy comparable to first-principal calculations. The method is based on the second-order decomposition of the total Kohn–Sham energy with respect to the charge density. The matrix elements of the unperturbed Hamiltonian H μ v 0 are represented in the minimal basis of atomic orbitals using the two-particle approximation. The total energy of the system is determined by the expression
E t o t = i μ v c μ i c v i H μ v 0 + 1 2 α β γ α β Δ q α Δ q β + E r e p + E d i s ,
where c μ i and c v i are the coefficients in the decomposition of the molecular orbitals into atomic orbitals, Δ q α and Δ q β are the charge fluctuations on the α and β atoms, respectively, γ α β is a function, that exponentially decreases with increasing a distance between the α and β atoms and directly depends on the chemical hardness [36], E r e p is the term describing the repulsive interaction at small distances, E d i s is the term responsible for the van-der-Waals interaction of unbound atoms. The Monkhorst-Pack 12 × 12 × 1 grid was used to sample the Brillouin zone in the reciprocal space. The 3-ob-3-1 basis set was applied to describe the interaction between the Zn, O, C and H atoms [37]. It should be noted that the authors successfully applied the SCC DFTB method earlier to calculate the binding energy between carbon nanostructures and various functional groups including iron oxide [38] and DNA [39]. In addition, this method accurately describes the behavior of H2O clusters [40,41] to be within the scope of the current study.
The binding energy of the 2D ZnO surface with VOCs under study, isopropanol or benzene, and with water molecules, equal to number N, was calculated utilizing the following formulas, accordingly:
E b = E ( Z n O + V O C ) E ( Z n O ) E ( V O C ) ,
E b = E ( Z n O + N H 2 O ) E ( Z n O ) N E ( H 2 O ) N   ,  
where E ( Z n O ) , E ( V O C ) and E ( H 2 O ) are the energies of isolated ZnO supercell, analytes and water structures, E ( Z n O + V O C ) is the energy of the oxide with bonded analyte at the ground state, and E ( Z n O + N H 2 O ) is the energy of the oxide with H2O molecules at the ground state.

3. Results and Discussion

3.1. The Physical Characterization of ZnO Nanostructured Layer

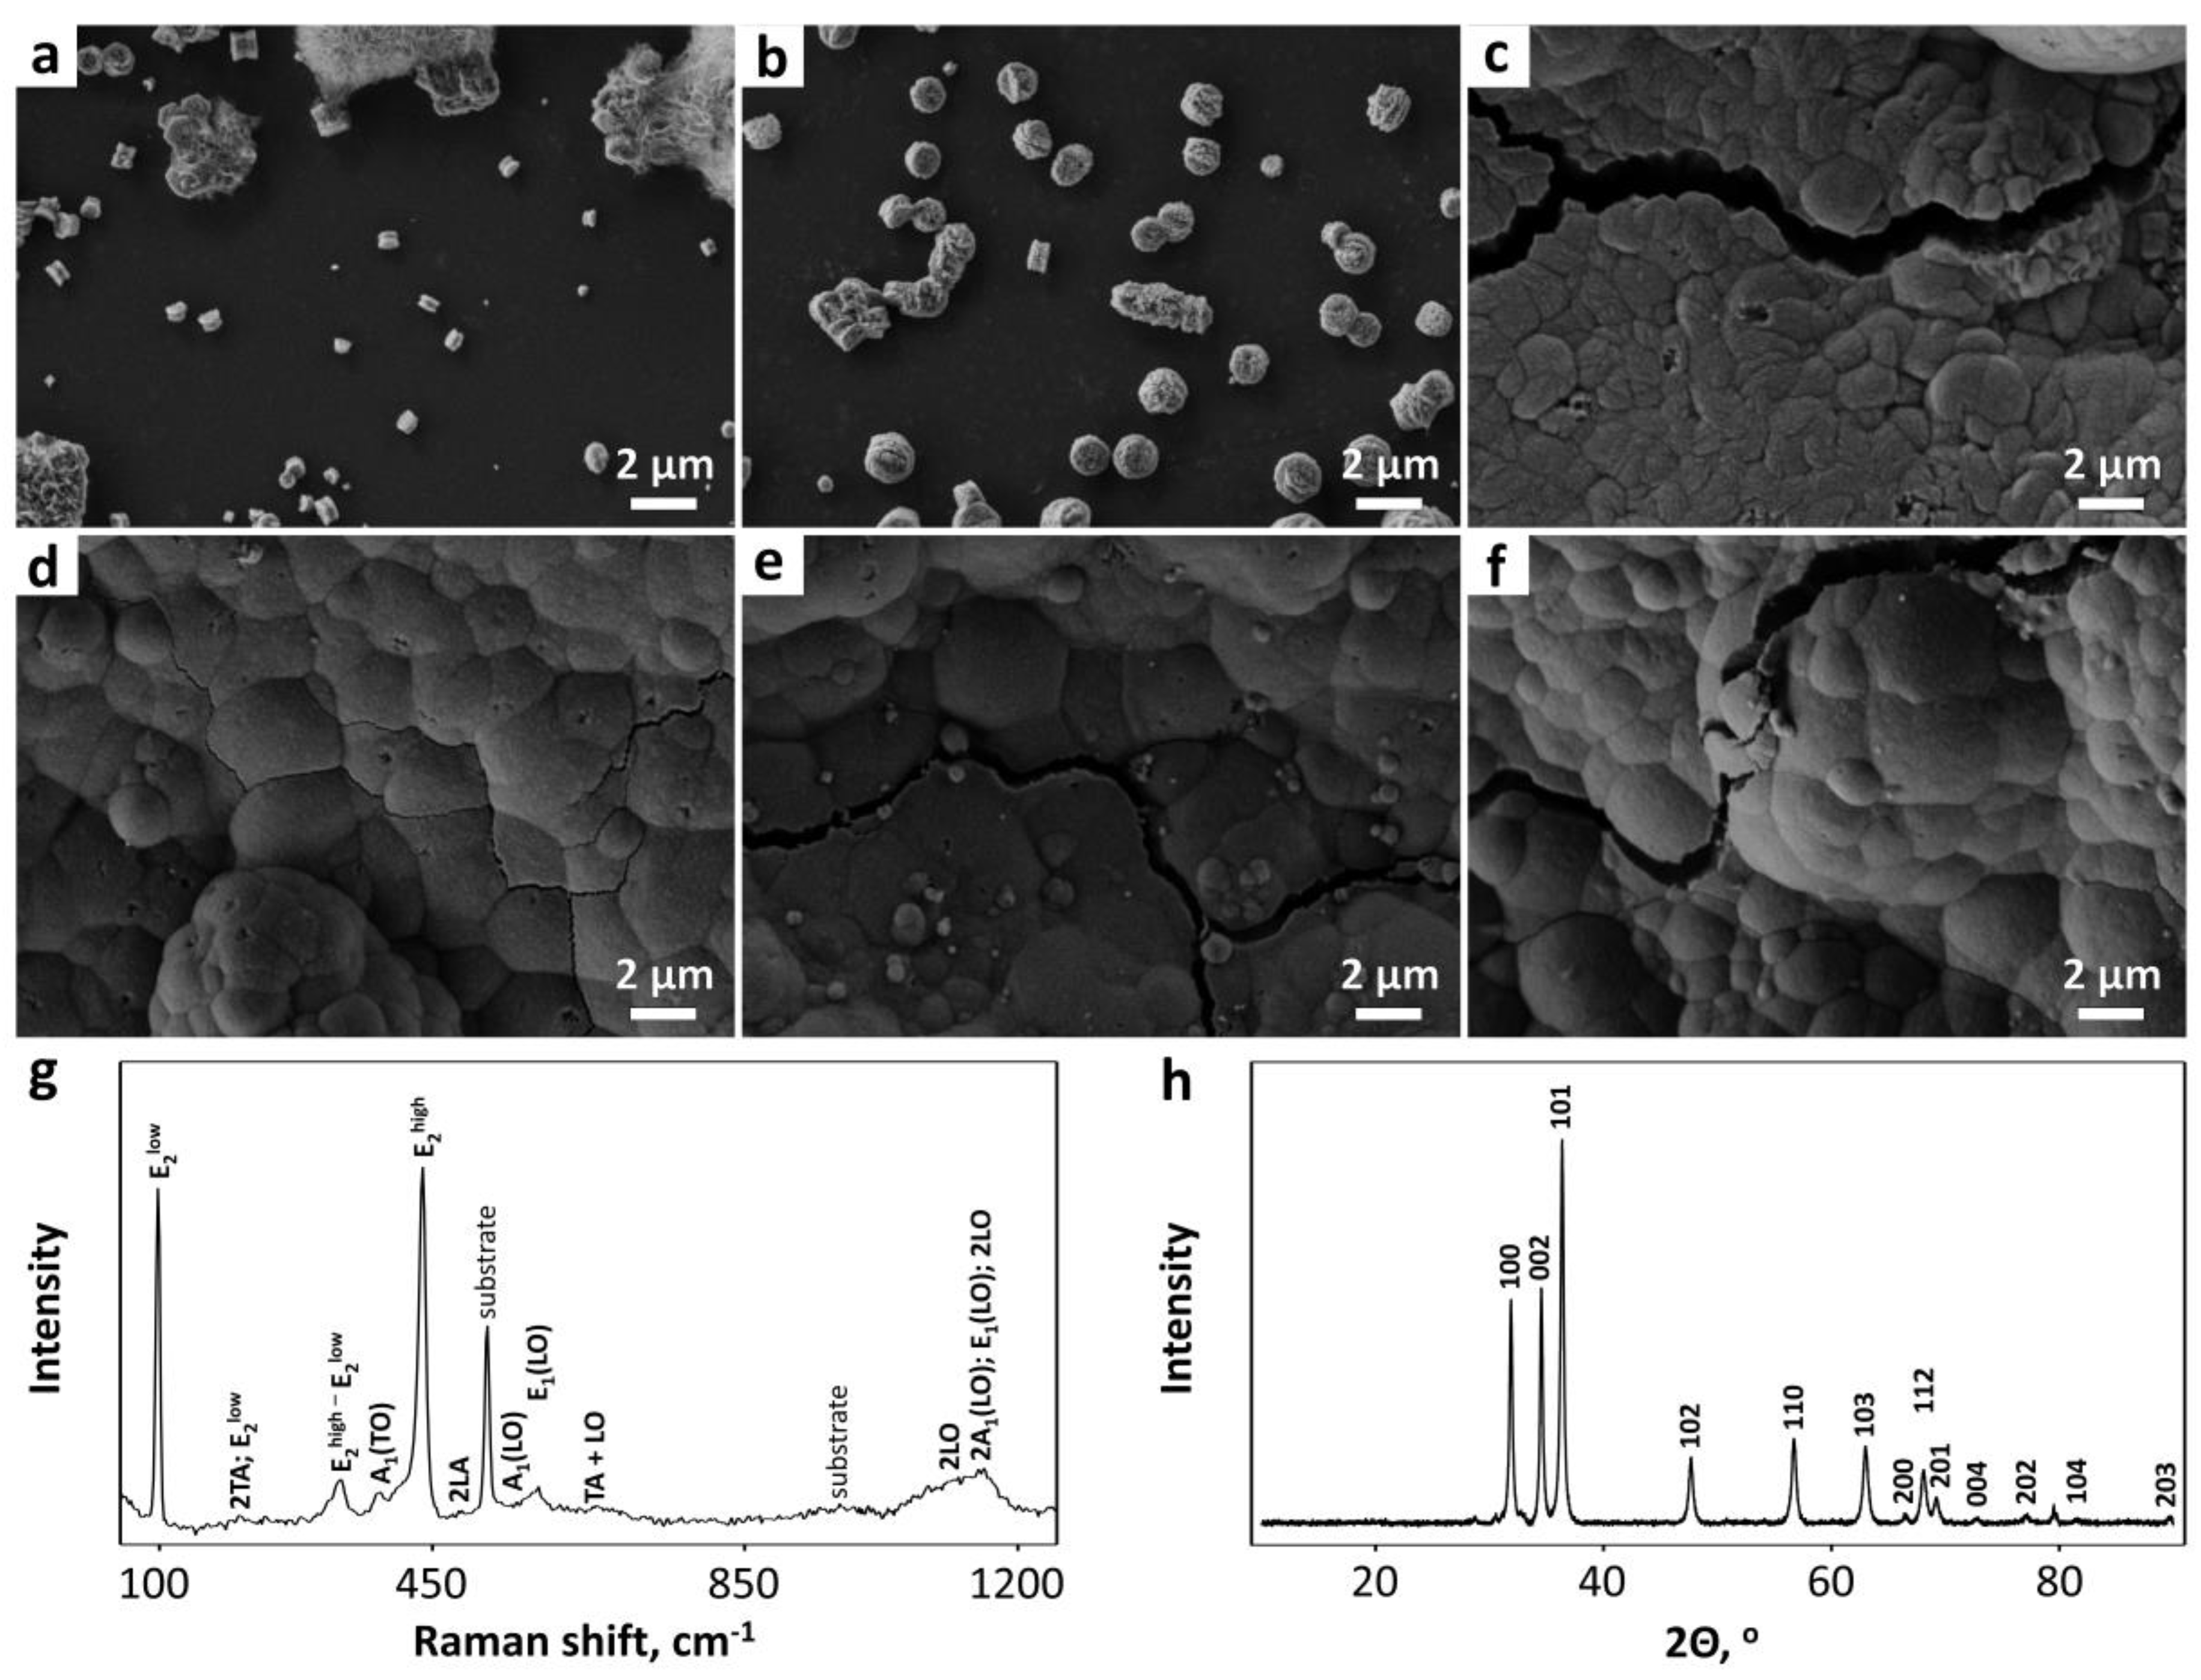
Primarily, the ZnO layer has been grown by the electrochemical deposition over Pt electrodes according to known mechanisms [42]. However, the oxide growth has appeared to occur not only over the electrode but also in the between-electrode gaps primarily in the shape of nanodimensional structures. The size and coverage of the gap by the oxide depend on deposition time leading to an electric percolation of the dielectric area between electrodes. Figure 3 yields SEM images of the oxide nanostructures which have appeared within the inter-electrode gaps. As one can see, the morphology of the ZnO nanostructured layer strongly depends on the deposition time. At 400 s (Figure 3a), the oxide structures have a minimum size, up to 500 nm, with some slight agglomeration. Enhancing the deposition time up to 550 s (Figure 3b) resulted in enlarging of individual nanostructures up to several micrometers. At 700–1150 s of deposition (Figure 3c–f), zinc oxide appears as a rather continuous layer consisting of co-grown nanostructures.
The structure of the deposited oxide layer has been verified by Raman spectroscopy; the typical spectrum is shown in Figure 3g. The data of measurements have proved the layer to grow as ZnO polycrystals with wurtzite symmetry. According to literature [43,44,45], we may note various modes characterizing this structure as A1 + E1 + 2E2 + 2B1. Raman and IR active modes A1 and E1 split into transverse optical (TO) and longitudinal optical (LO) phonons whose corresponding peaks are found at 383.6 cm−1, 568.7 cm−1, 586.1 cm−1, and 1153.0 cm−1 [46]. Raman active E2 mode includes two nonpolar modes E2low and E2high of low- and high-frequency phonons, observed at 98.2 cm−1 and 202.3 cm−1, 437.6 cm−1, and 331.5 cm−1 for E2low, E2high and E2high-E2low, respectively [47]. Phonon LO and TO peaks are identified at 661.3 cm−1, 1105.5 cm−1 and 1153.0 cm−1. High-intensity peaks of E2 confirm the wurtzite structure while the appeared LO phonons indicate the presence of oxygen defects and respective electronic states in the crystals, which have rather a crucial effect for a chemiresistive effect observation. Still, we have not found B1 mode in the spectrum similar to other works [47,48]. We also observed bands classified as 2TA, 2LA, and TA+LO at 202.3 cm−1, 483.8 cm−1 and 661.3 cm−1, respectively [44,48]. The peaks found at ca. 520.5 cm- 1 and 971.7 cm−1 seem to come from the SiO2/Si substrate [49].
The annealed ZnO layer is characterized by a hexagonal structure, space group P63mc, just according to XRD results (Figure 3h), with reflexes from (100), (002), (101), (102), (110), (103), (200), (112), (201), (004), (202), (104) and (203) crystal lattice planes (PDF 00-036-1451).

3.2. The Electrical Properties of the ZnO Nanostructured Layer

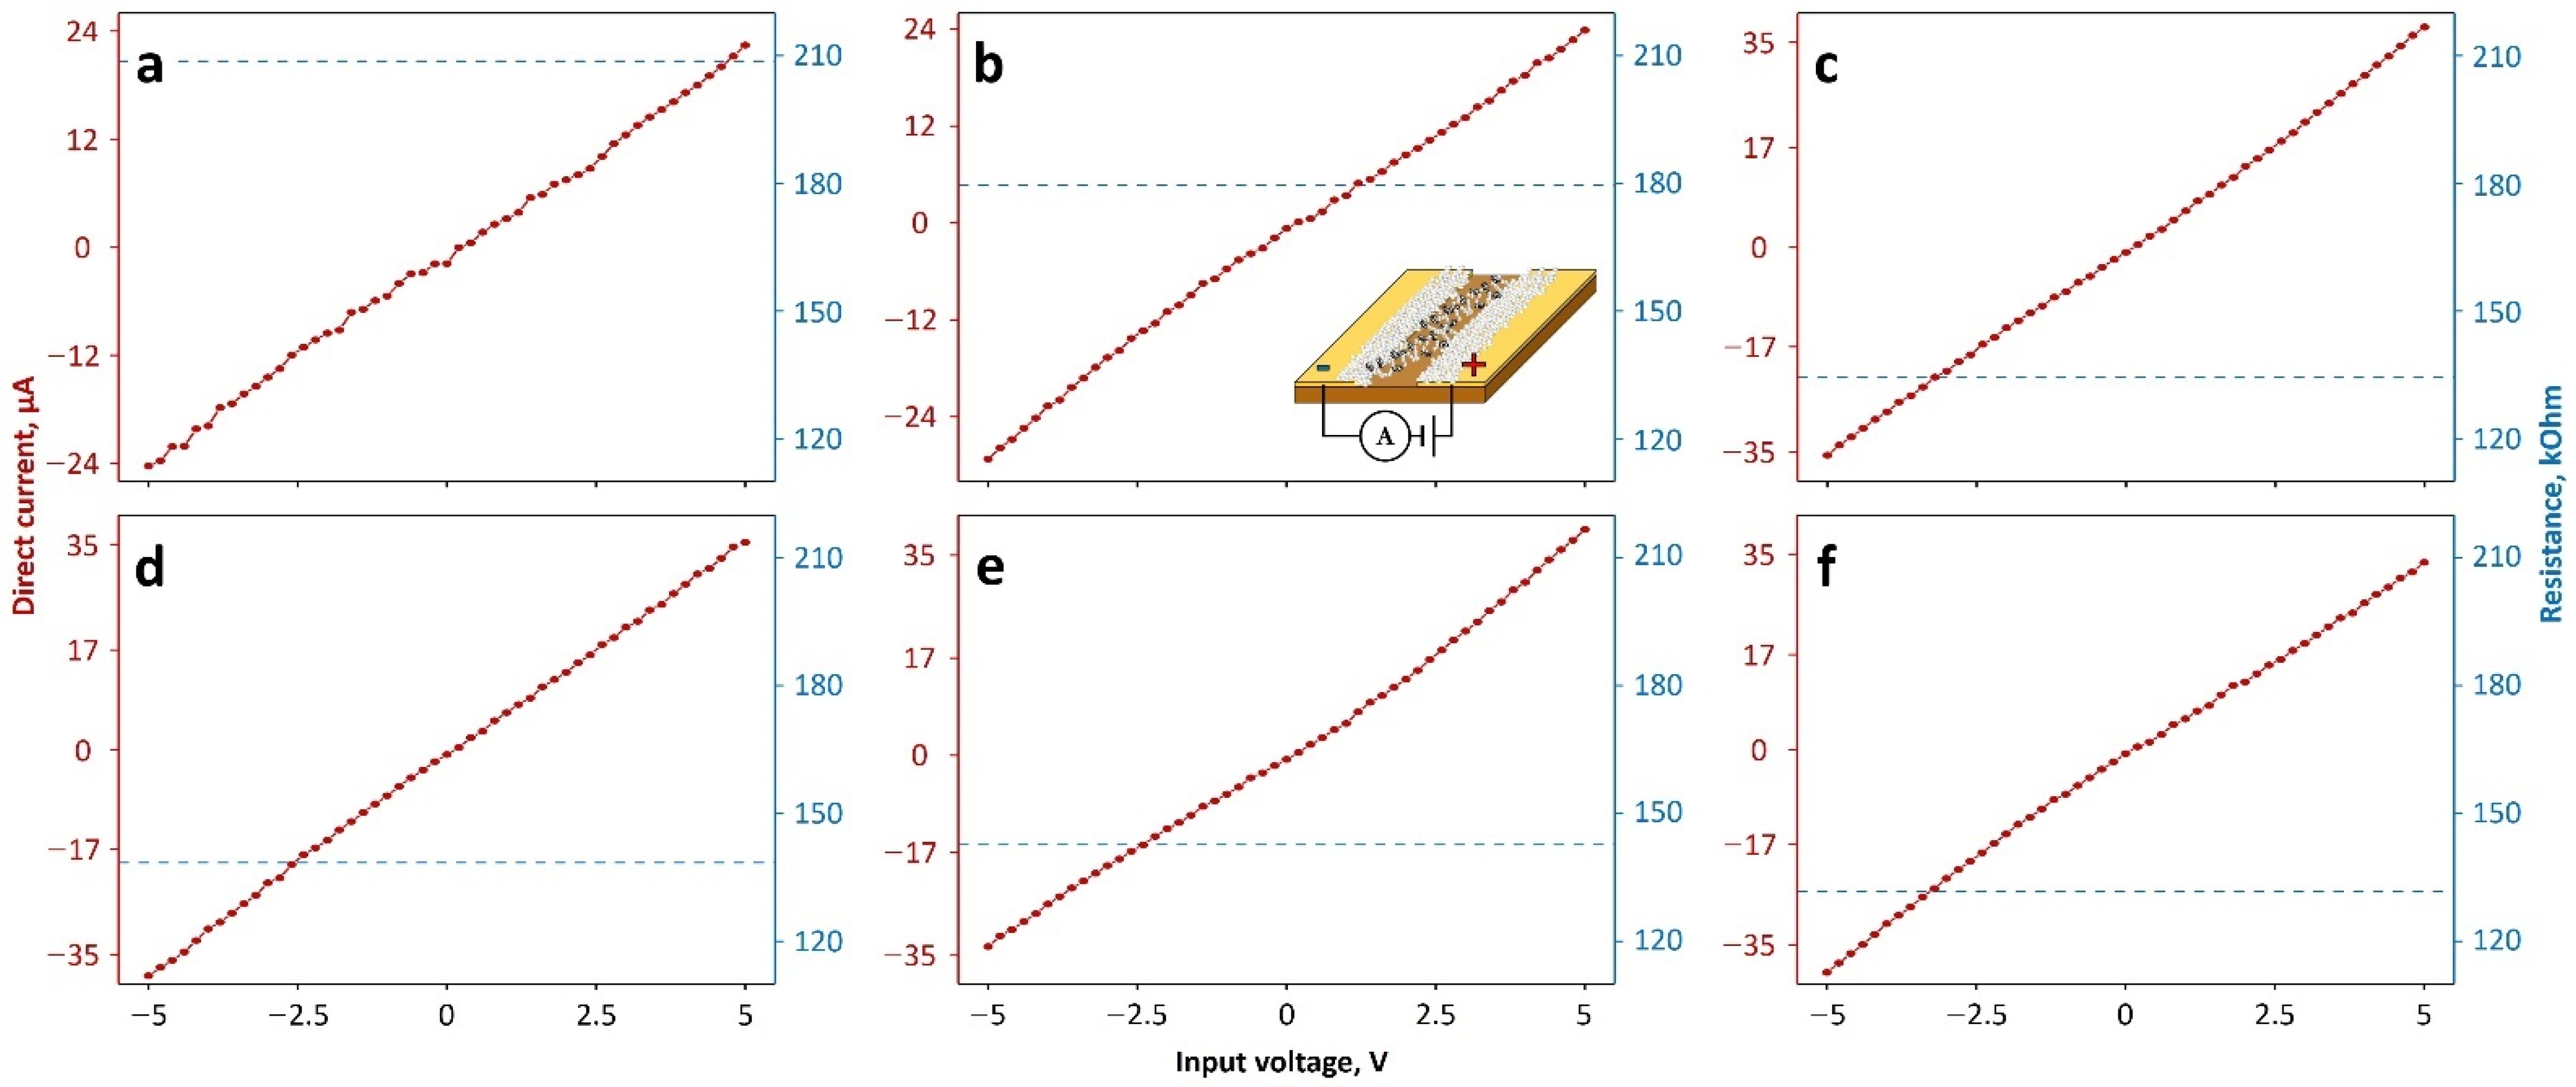
We have tested the electrical properties of the electrochemically grown ZnO layer under the application of dc electric fields. Because the interface contacts between the oxide and electrode might significantly modify the electric transport, primarily we have looked at the current–voltage (I–V) characteristics in the range of applied potentials at [−5; +5] V in two directions. We have checked the I–Vs almost in all the temperature range of operating temperatures employed in the course of studies, mainly under air conditions, to ensure its linear character. Here, for example, we show I–Vs in Figure 4 under heating to 150 °C recorded in a dry air environment. This temperature is most interesting as a “bordering” one which we show further for the gas-sensing performance of the ZnO layer.
As one can see in Figure 4, the I–V curves are quite linear, which indicates the absence of significant potential barriers at the contact interface in all the ZnO layer areas grown under different deposition times. The slope of I–V curves, which defines a resistance, depends on the deposited volume of the oxide; we have clarified it by plotting the resistance values derived from the I–Vs at the second ordinate axis. The ZnO layer segment resistance goes down with deposition time from ca. 210 kOhm observed at the area grown at 400 s to around 130–140 kOhm in the area grown at 850–1150 s. When comparing them to SEM images of Figure 3, the resistance becomes almost independent on a deposition time at these higher magnitudes of deposition time because of the formation of a rather continuous layer, though still containing mesopores.

3.3. Gas-Sensing Properties of ZnO Nanostructured Layer under UV Illumination

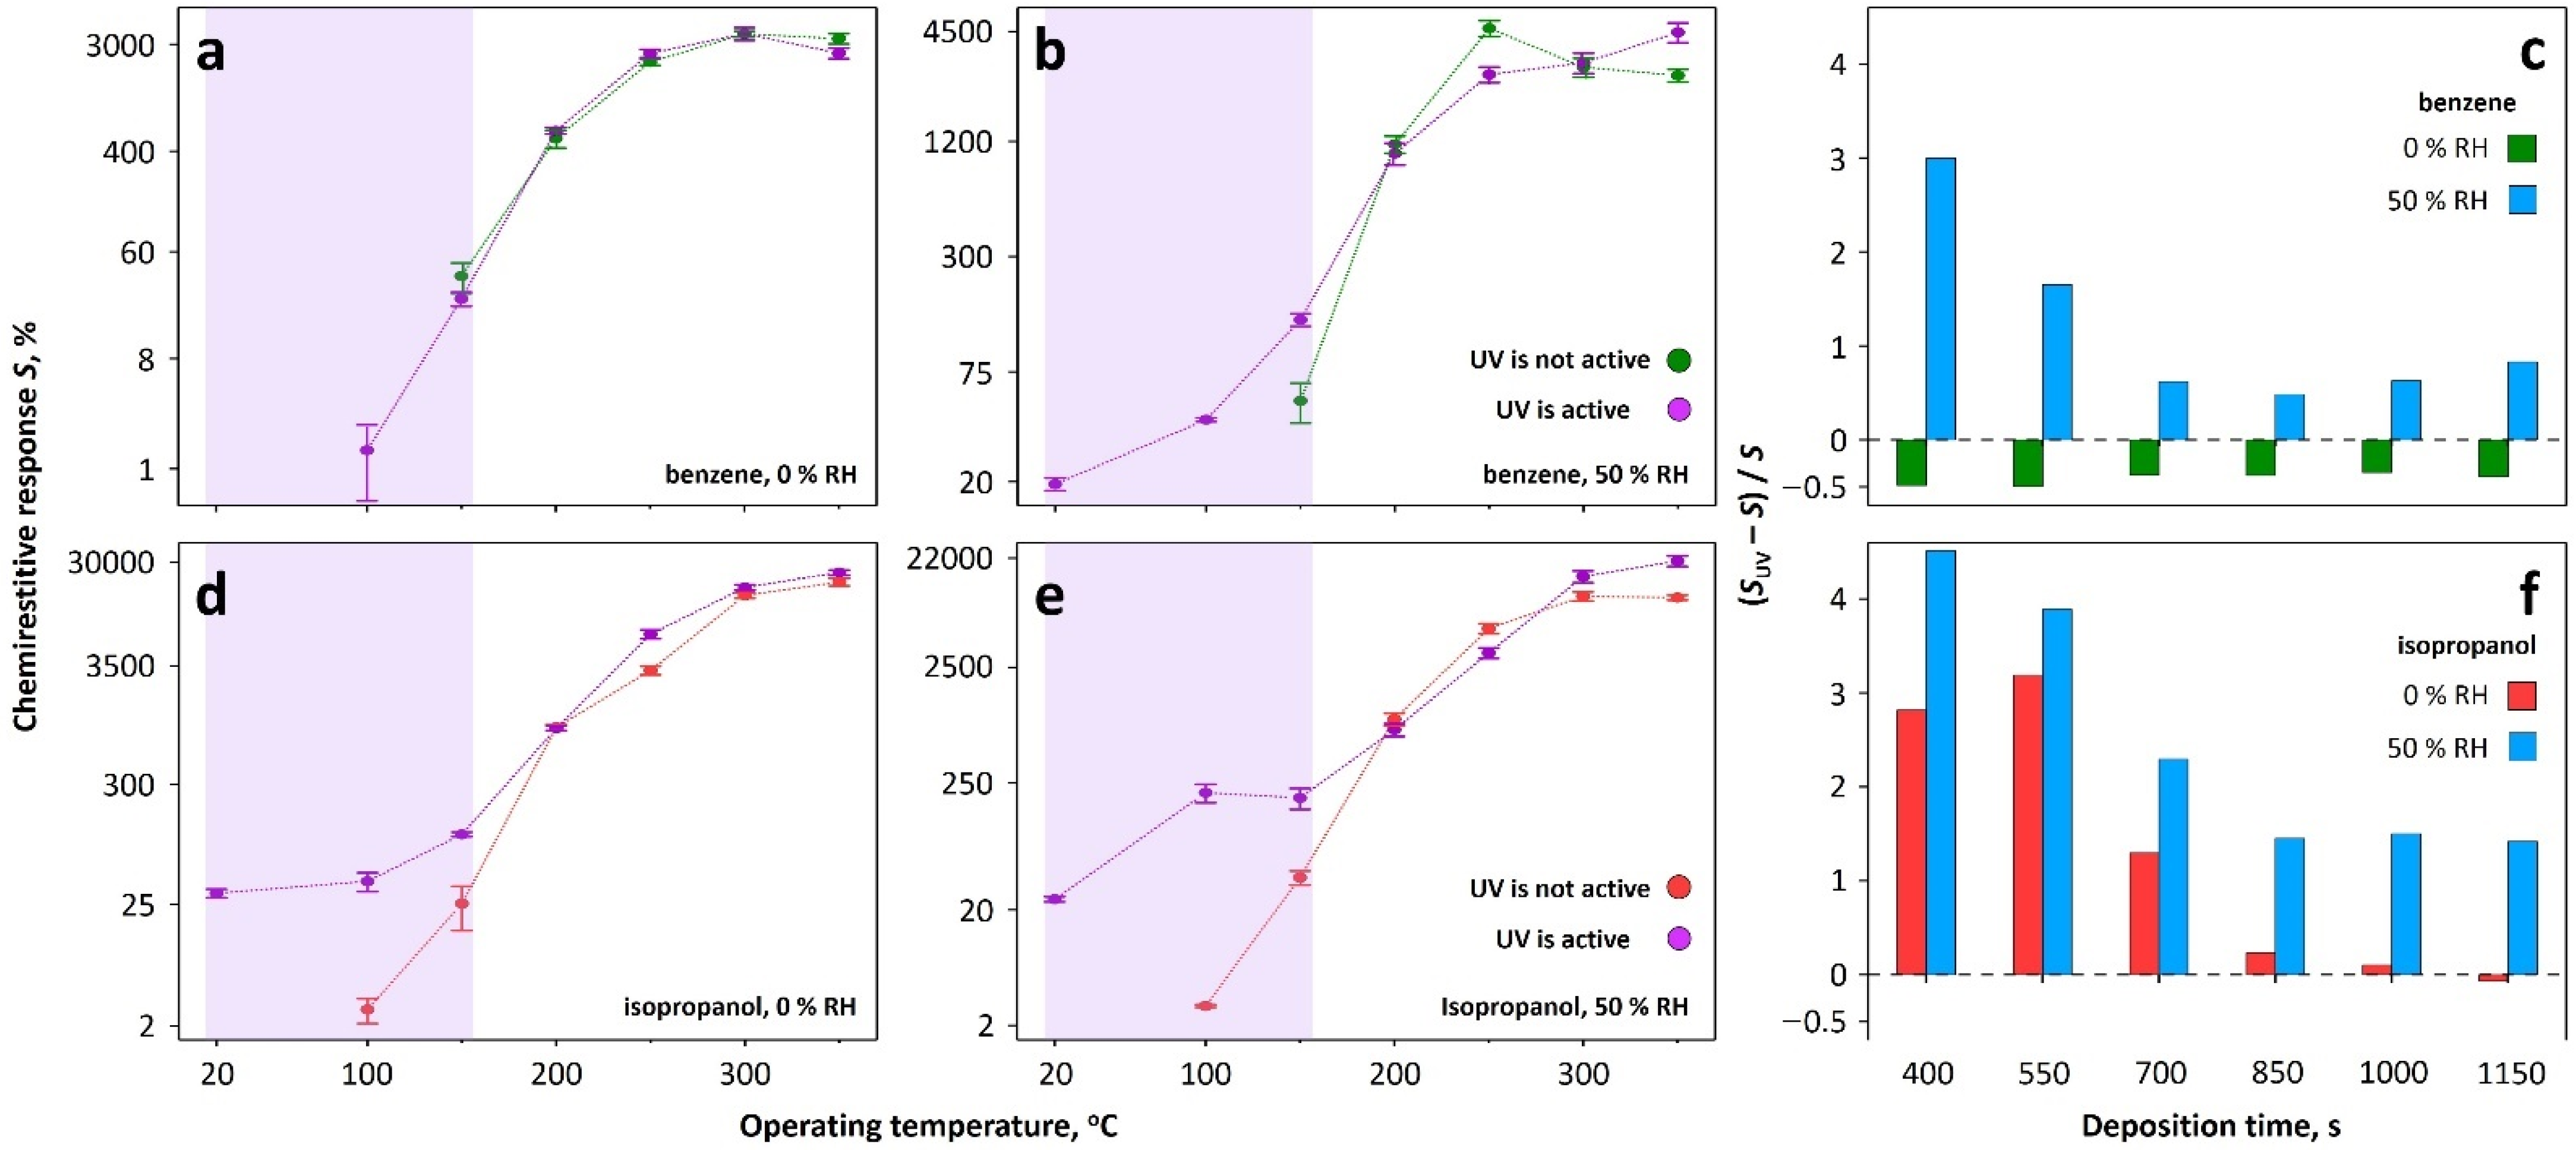
We have studied the multisensor chip with an electrochemically grown ZnO layer upon exposing to two model analytes, isopropanol and benzene, mixed with dry and wet air in a wide temperature range from RT to 350 °C. The influence of UV irradiation on the chemiresistive effect in the ZnO layer has been checked at these temperatures. These data are summarized in Figure 5, where we depict the temperature dependence of the chemiresistive response to benzene (Figure 5a,b) and isopropanol (Figure 5d,e), given in concentration of 100 ppm, where the chemiresistive response and the observed variations are more remarkable than ones in the case of lower analyte concentration. As a typical behavior, we have taken the ZnO layer segment deposited for 550 s as an example.
The data plots show that the UV radiation has a significant effect to support the appearance of the chemiresistive response in ZnO versus isopropanol at temperatures from room one to 150 °C (highlighted in the figure), no matter the humidity vapors co-exist in the atmosphere. We may see a rather significant response even at RT, about 20–25%, which enhances up to 250% at T = 150 °C. A similar effect is observed, too, when exposing the chip to benzene mixed with wet air. However, the ZnO conductivity stays almost inert if benzene vapors are supplied in a mixture with dry air under UV radiation until the temperature goes up to 150 °C. At T = 100 °C the response is ca. 1.4% which is similar to results published in other studies, see, for instance [50]. When heating goes up from 150 °C to 350 °C, the ZnO layer starts to exhibit the chemiresistive properties to be almost independent of UV irradiation. It seems at this temperature range the thermal activation is the major factor to facilitate a charge exchange between both chemisorbed analytes, isopropanol and benzene, and ZnO surface as discussed later. Still, we should note that employing operating temperatures up to 350 °C leads to a substantial enhancing of the chemiresistive response to both analytes by more than one order of magnitude when compared to one observed at T = 150 °C even under UV assistance. The response is saturated at T = 300–350 °C that fully corresponds to conventional operating temperatures known for ZnO chemiresistors [5], the UV effect is almost negligible. Due to the fine morphology of the grown ZnO nanostructures, the response is higher than the observed one in printed ZnO layers doped with Pt [51].
We have looked at how UV radiation influences the ZnO nanostructures grown in local chip areas at various deposition times. While the UV radiation dominates in the RT-100 °C of the temperature range employed to activate the chemiresistive response in this material, we considered T = 150 °C as a “border” point where to compare the UV contribution in comparison to thermal activation. In order to relatively estimate the UV effect, we have considered the change of chemiresistive response under UV, SUV, in ratio to the response, S, observed without UV, as ( S U V S 1 ) and plotted it in dependence on the ZnO deposition time for benzene (Figure 5c) and isopropanol (Figure 5f). The derived data clearly show that the ZnO nanostructures synthesized for the time in the range 400–700 s, exhibit the most pronounced influence of UV impact, which enhances the chemiresistive response up to 4 times. In the range 850–1150 s of deposition times, the UV effect is less distinct and rather stable, just doubling the response. These clear differences seem to mature from the morphology of the ZnO layers: the layer deposited at lower times has a more dispersed meso-nanostructure where the number of free electrons could be effectively facilitated by UV, as we have recently shown in the case of the TiO2 nanotubes [52]. At thicker layers, the LED power is not enough for the UV radiation to penetrate the entire depth of the oxide layer including internal meso-surfaces, and its effect on the interaction of gaseous analytes to be chemisorbed at the ZnO surface and to participate in the charge exchange is reduced.
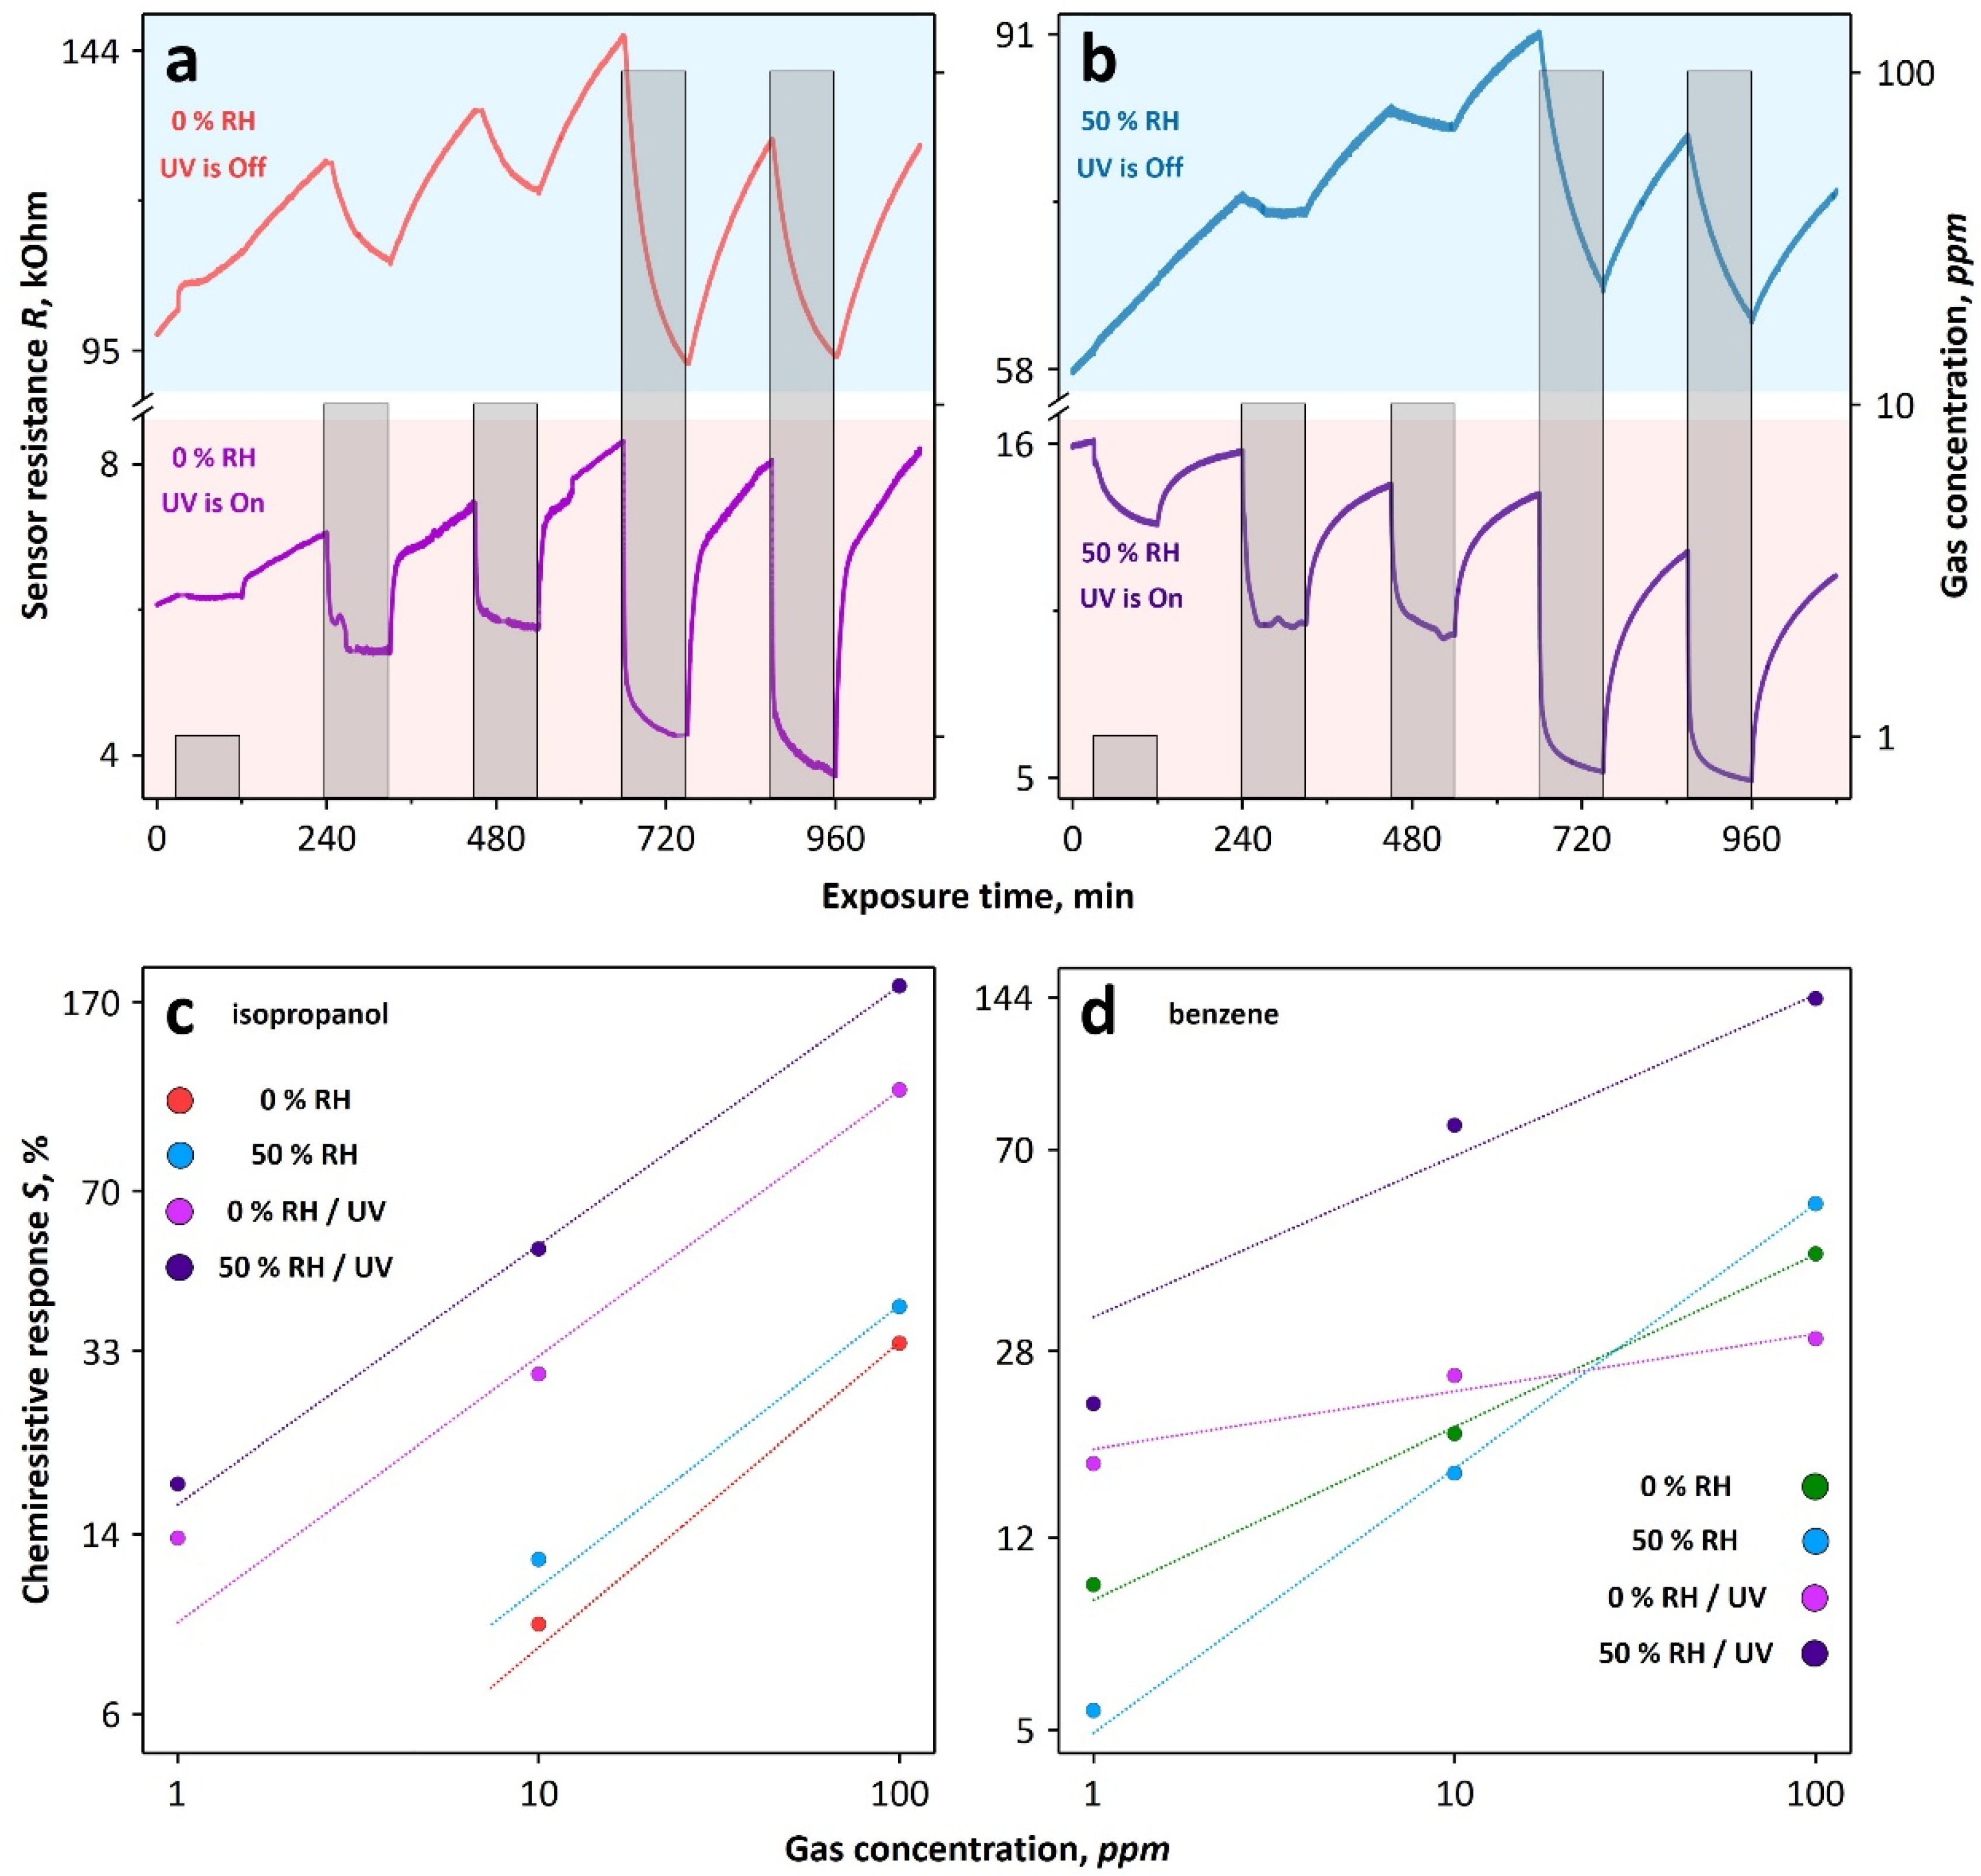
To further show the impact of UV radiation on the ZnO resistance under exposure to analytes, we have plotted the typical R(t) transients measured at the operating temperature of 150 °C in Figure 6a,b for the case of isopropanol; the dry air background is given in Figure 6a while wet, 50 rel. %, air background is given in Figure 6b. Firstly, as one can see, the resistance values of the ZnO layer significantly drop following UV exposure: in dry air, the drop is by more than ca. 20 times, while in the wet air it is about 5 times. The drop follows the known UV impact on the wide-band semiconducting oxides related to a generation of free electrons in the oxide conductance band due to inter-gap transitions that, in turn, increases the material’s conductivity; see, for instance, [52]. Furthermore, these processes reduce inter-crystal potential barriers that also promote higher conductivity [53]. The observed differences between dry and wet conditions indicate that the excessive free electrons could be partly localized at the surface by additional chemisorbed OH- species induced under a presence of humidity vapors according to the following dissociation of water molecules at the oxide surface
H 2 O + 2 e U V 2 O H ,
thus reducing the generated number of free electrons.
Secondly, the appearance of isopropanol vapors results in a further drop of ZnO resistance which constitutes, in fact, the chemiresistive effect under interest for the sensor performance. The reversible character of R(t) behavior with/without the VOC analyte confirms the functionality of the synthesized layer as a gas sensor. According to a rather conventional view [5,14], this effect seems to mature from the surface interaction between this adsorbed alcohol and chemisorbed oxygen species, O or O2, and/or OH groups according to one of the following chemical routs
C 3 H 7 O H ( a d s ) + 90 U V 3 C O 2 + 4 H 2 O + 9 e 20 H U V 3 C O 2 + 5 H 2 + 2 e 2 O H + 80 U V 3 C O 2 + 5 H 2 0 + 10 e 2 C 3 H 7 O H ( a d s ) + 13 O 2 U V 6 C O 2 + 16 H 2 O + 13 e
All these reactions lead to enhancing a free electron concentration, which increases the conductance of ZnO as an n-type semiconductor in accordance with the experimental results.
In the case of benzene, this VOC’s interaction with the ZnO surface is more complex accounting for data presented in Figure 5. It seems the employed UV energy has not been enough to facilitate the interaction of benzene directly with chemisorbed oxygen species; we discuss this phenomenon later. However, the humidity-derived species at the ZnO surface appeared due to H2O presence in the atmosphere could interact with benzene according to the next chemical routes
C 6 H 6 ( a d s ) + { 12 O H U V 6 C O 2 + 9 H 2 + 12 e 2 O H + 14 O U V 6 C O 2 + 4 H 2 O + 16 e 2 O H + 7 O 2 U V 6 C O 2 + 4 H 2 O + 9 e
Furthermore, it should be noted that comparing R(t) curves displayed in Figure 6a,b shows that the characteristic time of the chemiresistive effect is substantially reduced by UV radiation. When LED-UV is Off, 1.5 h of exposure to the isopropanol is still not enough to reach a rather stationary plateau of the resistance value of the ZnO layer. The same concerns the recovery time following other reports [22]. Altogether, the gas response looks partly irreversible within the chosen time intervals of the analyte’s exposure because of not enough activation of chemisorption processes on the ZnO surface [5]. At the same time, the ZnO resistance decreases much faster upon/after the exposure to isopropanol vapors under UV assistance. We may distinguish ca. 10–15 min of response/recovery time, which characterizes the resistance transient curves, similar to other research [54] that is already enough for practical applications. Still, the reported values could be further advanced when employing noble catalysts and heterostructures (see, for instance, [55]).
As a major sensor parameter, we have plotted the dependence of chemiresistive response (1) on the analyte’s concentration measured at 150 °C in Figure 6c,d towards isopropanol (c) and benzene (d) vapors in dry air and humid-enriched air. The curves could be well fitted by Freundlich isotherm, S ~ C α , where C is the analyte’s concentration and α is the power index which could be derived as a slope of S(C) curve at a log-log scale of the plot [29]. All the values of α are summarized in Table 1.
In general, the S(C) curves characterizing the isopropanol are steeper than the ones for benzene, the α index is rather similar to fluctuate at 0.53–0.62 range which is typical for alcohol’s interaction with ZnO [56]. In benzene vapors, the α index drops to a value equal to 0.11 in dry air that indicates a rather weak dependence of sensor signal on the analyte’s concentration; still, the sensor signal is low, too. Again, the presence of humidity significantly enhances the S(C) slope that yields α equal to 0.32–0.52. The detection limit which is frequently defined in empirical studies as the analyte concentration corresponding to 10% response [57] goes down to the sub-ppm range for both analytes under the given UV assistance.
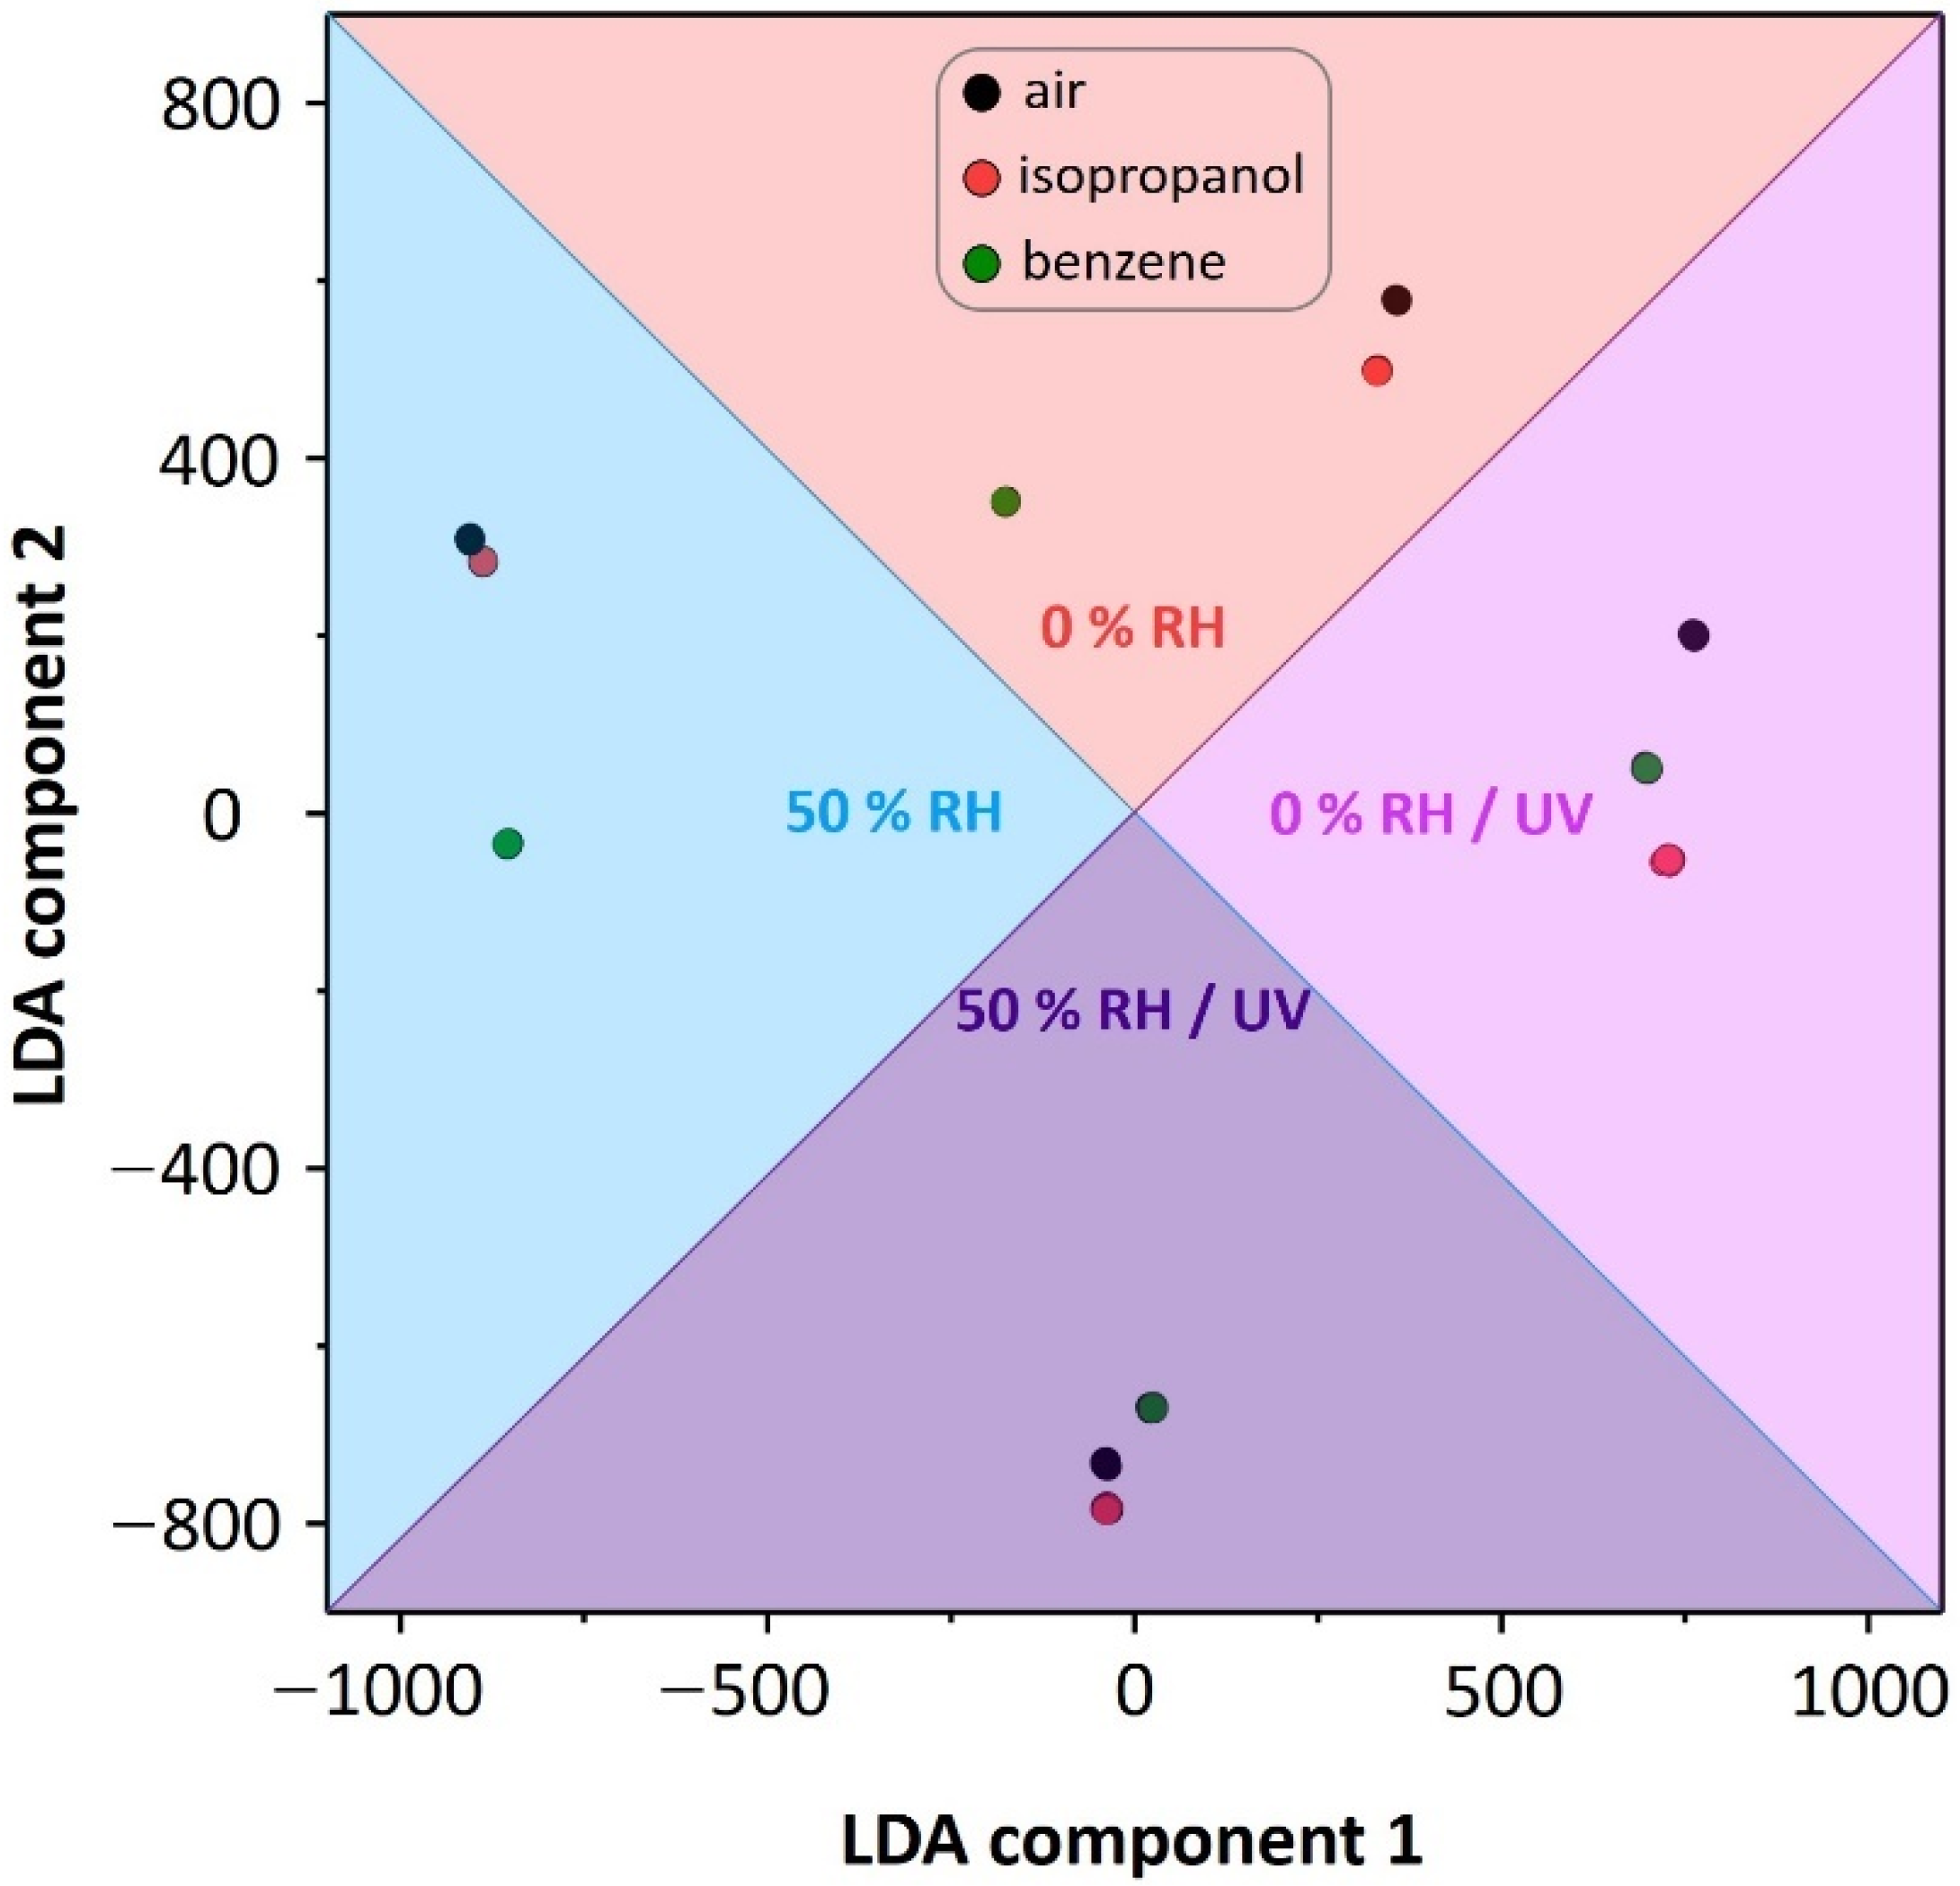
Although we may note that the ZnO layer’s response to isopropanol is higher when compared to benzene, we cannot distinguish the analyte employing just a single sensor. To advance the selectivity, we have to take a vector signal generated by a multisensor array which we fabricated on the multi-electrode chip’s substrate according to the electronic nose’s paradigm [58]. With this purpose, again we analyze the most interesting condition of heating the chip up to 150 °C where UV still contributes to the chemiresistive effect. To process the multisensor’s vector signal, we employ the LDA technique as detailed in the Materials and Methods section. This technique transfers the vector signal into the optimized coordinate system to separate the vector’s classes at the maximum degree [59]. The full dimensionality of the system is (N-1) where N is a number of classes to distinguish. In our cases, we have considered the classes which correspond to analytes, the presence of H2O vapors, and UV, altogether equal to 12 in our study. The analyte probes are taken at 10 ppm concentration, as an example. Figure 7 displays the derived LDA coordinate system, a plane of the first two components.
As one can see, the multi-dimensional array signals from the array are clustered into corresponding groups according to their class’s origin. Notably, these clusters appear in four sections defined primarily by the presence of humidity and UV (On/Off) as dominant factors for the sensor performance. Within each of the four sections, all the analyte-related clusters and reference air are further distinguished which makes it possible to selectively justify them. The higher selectivity could be attained via introducing other external modifications of the sensor signal via, for instance, a gradual surface impurity by foreign atoms [29] or applying temperature gradients [30].

3.4. DFTB Calculation of Analyte Interaction with ZnO Surface

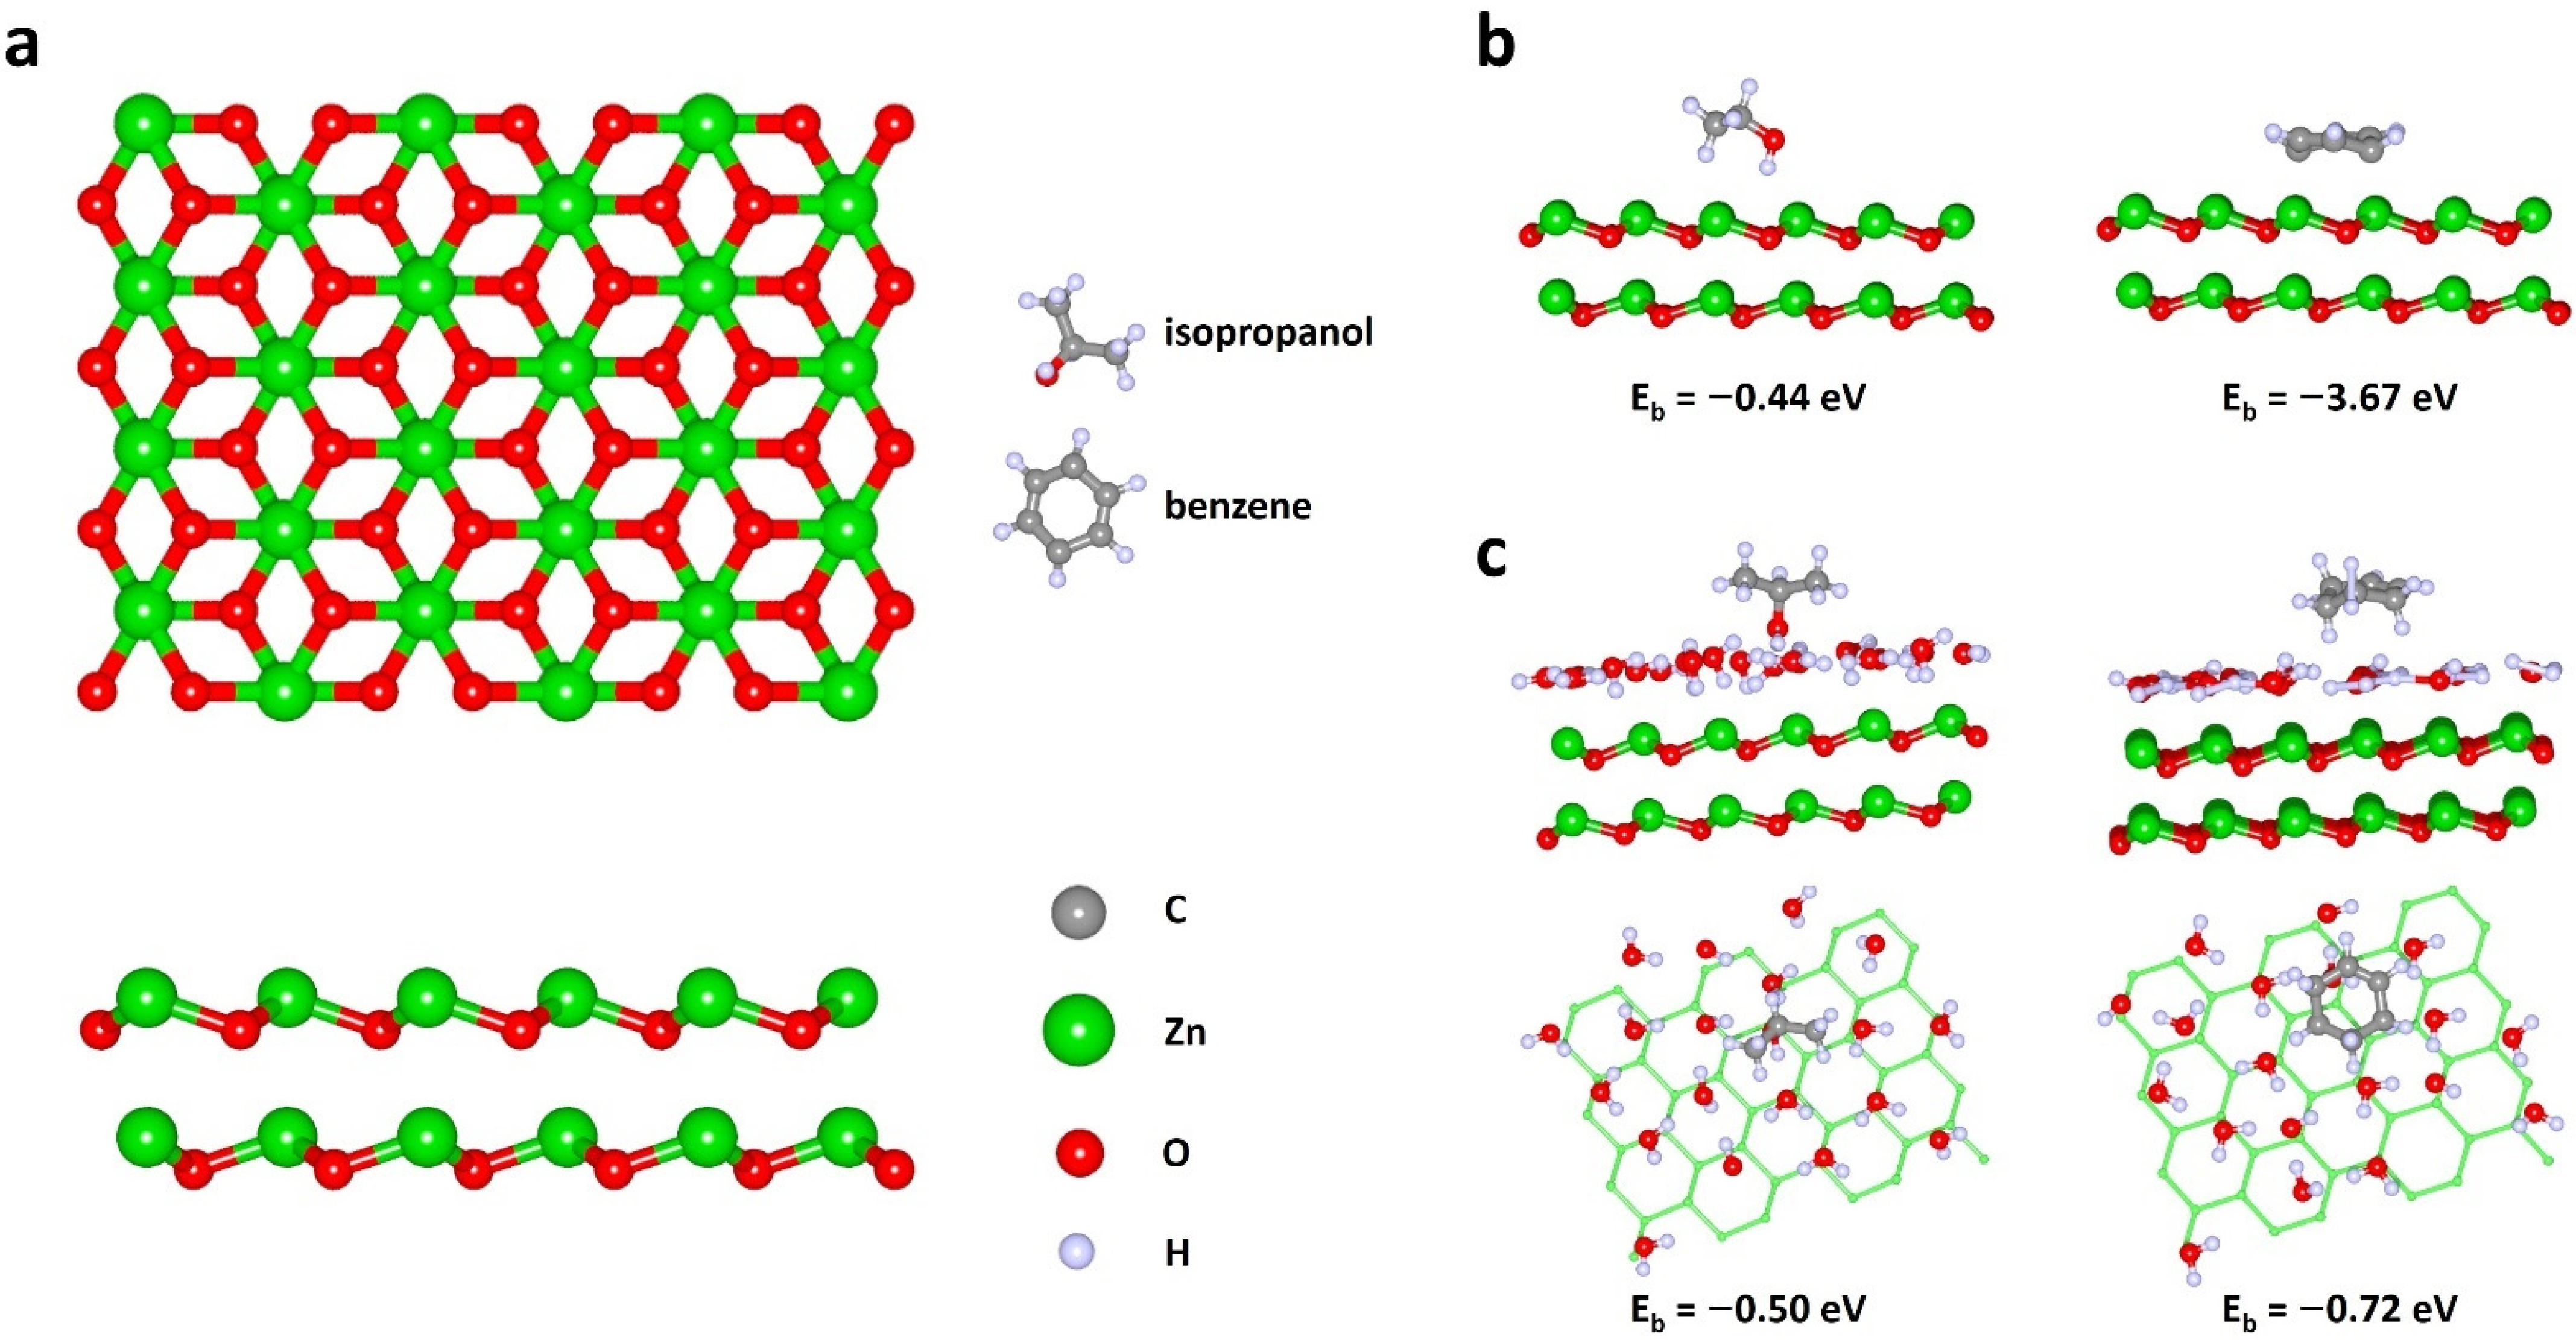
The DFTB calculations have been performed for the two-dimensional ZnO network as a supercell of 96 atoms taken from the ZnO crystal of P63mc space group [60] to be cut along the (1100) plane (Figure 8a). The translation vectors along the X- and Y-axes were 12.819 Å and 16.655 Å, respectively. Such dimensions of the ZnO supercell allowed us both to fit the isopropanol and the benzene ring molecules over the oxide surface and to exclude the interaction between analytes after the translation. At the first stage of the study, the VOC analyte molecules were approached to the pristine surface of the ZnO supercell (Figure 8b). We have found that the binding energy between isopropanol and ZnO was −0.44 eV, while the same one between ZnO and benzene was −3.67 eV. The latter rather high value is explained by a formation of chemical bonds between two zinc atoms of the supercell and two carbon atoms of the benzene ring. The length of the Zn-C bond was 2.21 Å.
Further, we have searched for a maximum number of H2O molecules to possibly set over the ZnO supercell in order to simulate the experimental conditions at humid-enriched air. The humidity molecules were sequentially placed on the ZnO surface. Following each next bonding of the H2O molecule, the total system was re-optimized and the binding energy of the ZnO supercell with the humidity molecule was calculated according to the Formula (2).
It was found that the maximum number of H2O molecules on the surface of the ZnO supercell is 19 which allows the system to have minimum total energy under the humidity adsorption. The further process of humidity adsorption is energetically unfavorable.
Finally, the VOC analytes were approached to the ZnO surface covered with 19 H2O molecules (Figure 8c). It turned out that the binding energy of the ZnO supercell with the isopropanol got changed slightly when compared to the pristine case being amounted to −0.50 eV. At the same time, the binding energy of ZnO with benzene was evaluated to be −0.72 eV that yields a dramatic reduction when compared to the situation observed with the pristine surface. It might be explained by the fact that the ZnO coating with water molecules does not allow forming of the chemical bonds between Zn and C atoms as discussed above. All these observations support the experimental data that UV irradiation of approx. 3.2 eV could stimulate the adsorption of benzene molecules in presence of humidity in the atmosphere.

4. Conclusions

Following the obtained results, we may conclude that the electrochemical deposition suggests options to grow gas-sensitive ZnO nanostructured layers directly on chip substrates, ready for preparing multisensor arrays, with a varied morphology via adjusting a growth time. Such sensors could be further activated by UV illumination powering by an LED to exhibit the chemiresistive effect at rather low temperatures, below 150 °C. The finer oxide structures grown at lower deposition times are more effectively activated by UV due to a higher surface-to-bulk ratio. We have found clear differences in the observed ZnO response under UV illumination at low operating temperatures towards two model VOCs, isopropanol and benzene. While the isopropanol yields a distinguished chemiresistive signal in dry or wet air backgrounds, the benzene appears to be inert in the absence of interfering H2O vapors. We argue that a possible reason for such an effect might be the rather higher energy required to adsorb benzene molecules over the ZnO surface which is supported by DFTB considerations. These results should be accounted for when developing low-power gas (multi)sensors activated by LEDs for environmental monitoring.

Author Contributions

Conceptualization, M.S., V.V.S. (Victor V. Sysoev) and O.E.G.; methodology, F.S.F.; software, M.S., V.V.S. (Vladislav V. Shunaev), A.S.V.; formal analysis, M.A.S., F.S.F., O.E.G.; investigation, M.A.S., M.S., F.S.F., V.V.S. (Vladislav V. Shunaev); resources, A.G.N., N.M.U.; data curation, M.A.S.; writing—M.A.S., F.S.F., O.E.G., V.V.S. (Victor V. Sysoev); writing—review and editing, all the authors; supervision, O.E.G., M.S., V.V.S. (Victor V. Sysoev); project administration, O.E.G., F.S.F., V.V.S. (Victor V. Sysoev); funding acquisition, F.S.F., A.S.V., V.V.S. (Vladislav V. Shunaev). All authors have read and agreed to the published version of the manuscript.

Funding

This research was partially funded by Russian Science Foundation, grant no. 19-72-10052 (M.A.S. and A.S.V.), to support the chip’s preparation and electrical characterization; Russian Science Foundation, grant no. 19-72-00136 (F.S.F), to cover Raman spectroscopy and XRD studies; Russ. President scholarship, project no. SP-3976.2021.1 V.V.S. (Vladislav V. Shunaev), to support DFTB calculations.

Institutional Review Board Statement

Not applicable.

Informed Consent Statement

Not applicable.

Data Availability Statement

All relevant data is contained within the article; further data are available from the corresponding author under request.

Acknowledgments

The authors thank Yuri V. Khivintsev (Saratov Branch of Kotelnikov Institute of Radioengineering and Electronics of RAS) for assistance with SEM measurements.

Conflicts of Interest

The authors declare no conflict of interest.

References

  1. Lewis, A.; Edwards, P. Validate personal air-pollution sensors. Nature 2016, 535, 29–31. [Google Scholar] [CrossRef] [PubMed] [Green Version]
  2. Vitoria, I.; Zamarreño, C.R.; Ozcariz, A.; Matias, I.R. Fiber optic gas sensors based on lossy mode resonances and sensing materials used therefor: A comprehensive review. Sensors 2021, 21, 731. [Google Scholar] [CrossRef] [PubMed]
  3. Liu, X.; Cheng, S.; Liu, H.; Hu, S.; Zhang, D.; Ning, H. A survey on gas sensing technology. Sensors 2012, 12, 9635–9665. [Google Scholar] [CrossRef] [Green Version]
  4. Chowdhury, N.K.; Bhowmik, B. Micro/nanostructured gas sensors: The physics behind the nanostructure growth, sensing and selectivity mechanisms. Nanoscale Adv. 2021, 3, 73–93. [Google Scholar] [CrossRef]
  5. Korotchenkov, G.; Sysoev, V.V. Conductometric Metal Oxide Gas Sensors: Principles of Operation and Technological Approaches to Fabrication. In Chemical Sensors: Comprehensive Sensor Technologies, Volume 4: Solid State Devices; Korotchenkov, G., Ed.; Momentum Press, LLC.: New York, NY, USA, 2011; pp. 53–186. [Google Scholar]
  6. Seiyama, T.; Kato, A.; Fujiishi, K.; Nagatani, M. A New Detector for Gaseous Components Using Semiconductive Thin Films. Anal. Chem. 1962, 34, 1502–1503. [Google Scholar] [CrossRef]
  7. Taguchi, N. Gas Detecting Device. U.S. Patent 3695848, 3 October 1972. [Google Scholar]
  8. Moseley, P.T. Progress in the development of semiconducting metal oxide gas sensors: A review. Meas. Sci. Technol. 2017, 28, 082001. [Google Scholar] [CrossRef]
  9. Cavicchi, R.E.; Semancik, S.; DiMeo, F., Jr.; Taylor, C.J. Use of microhotplates in the controlled growth and characterization of metal oxides for chemical sensing. J. Electroceram. 2002, 9, 155–164. [Google Scholar] [CrossRef]
  10. Kalinin, I.A.; Roslyakov, I.V.; Tsymbarenko, D.M.; Bograchev, D.A.; Krivetskiy, V.V.; Napolskii, K.S. Microhotplates based on Pt and Pt-Rh films: The impact of composition, structure, and thermal treatment on functional properties. Sens. Actuators A 2021, 317, 112457. [Google Scholar] [CrossRef]
  11. Camagni, P.; Faglia, G.; Galinetto, P.; Perego, C.; Samoggia, G.; Sberveglieri, G. Photosensitivity activation of SnO2 thin film gas sensors at room temperature. Sens. Actuators B 1996, 31, 99–103. [Google Scholar] [CrossRef]
  12. Espid, E.; Taghipour, F. UV-LED photo-activated chemical gas sensors: A review. Crit. Rev. Solid State Mater. Sci. 2017, 42, 416–432. [Google Scholar] [CrossRef]
  13. Bhati, V.S.; Hojamberdiev, M.; Kumar, M. Enhanced sensing performance of ZnO nanostructures-based gas sensors: A review. Energy Rep. 2020, 6, 46–62. [Google Scholar] [CrossRef]
  14. Chizhov, A.; Rumyantseva, M.; Gaskov, A. Light activation of nanocrystalline metal oxides for gas sensing: Principles, achievements, challenges. Nanomaterials 2021, 11, 892. [Google Scholar] [CrossRef]
  15. Takahashi, Y.; Kanamori, M.; Kondoh, A.; Minoura, H.; Ohya, Y. Photoconductivity of ultrathin zinc oxide films. Jpn. J. Appl. Phys. 1994, 33, 661–665. [Google Scholar] [CrossRef]
  16. Fan, S.-W.; Srivastava, A.K.; Dravid, V.P. UV-activated room-temperature gas sensing mechanism of polycrystalline ZnO. Appl. Phys. Lett. 2009, 95, 142106. [Google Scholar] [CrossRef]
  17. Fabbri, B.; Gaiardo, A.; Giberti, A.; Guidi, V.; Malagù, C.; Martucci, A.; Sturaro, M.; Zonta, G.; Gherardi, S.; Bernardoni, P. Chemoresistive properties of photo-activated thin and thick ZnO films. Sens. Actuators B 2016, 222, 1251–1256. [Google Scholar] [CrossRef]
  18. de Lacy Costello, B.P.J.; Ewen, R.J.; Ratcliffe, N.M.; Richards, M. Highly sensitive room temperature sensors based on the UV-LED activation of zinc oxide nanoparticles. Sens. Actuators B 2008, 134, 945–952. [Google Scholar] [CrossRef]
  19. Thamer, A.; Faisal, A.; Abed, A.; Khalef, W. Synthesis of gold-coated branched ZnO nanorods for gas sensor fabrication. J. Nanoparticle Res. 2020, 22, 74. [Google Scholar] [CrossRef]
  20. Vuong, N.M.; Chinh, N.D.; Hien, T.T.; Quang, N.D.; Kim, D.; Kim, H.; Yoon, S.-G.; Kim, D. Gas-sensing properties of ZnO nanorods at room temperature under continuous UV illumination in humid air. J. Nanosci. Nanotechnol. 2016, 16, 10346–10350. [Google Scholar] [CrossRef]
  21. Kumar, R.R.; Murugesan, T.; Chang, T.-W.; Lin, H.-N. Defect controlled adsorption/desorption kinetics of ZnO nanorods for UV-activated NO2 gas sensing at room temperature. Mater. Lett. 2021, 287, 129257. [Google Scholar] [CrossRef]
  22. Chen, Y.; Li, X.; Li, X.; Wang, J.; Tang, Z. UV activated hollow ZnO microspheres for selective ethanol sensors at low temperatures. Sens. Actuators B 2016, 232, 158–164. [Google Scholar] [CrossRef]
  23. Gong, J.; Li, Y.; Chai, X.; Hu, Z.; Deng, Y. UV-light-activated ZnO fibers for organic gas sensing at room temperature. J. Phys. Chem. C 2010, 114, 1293–1298. [Google Scholar] [CrossRef]
  24. Meng, F.; Zheng, H.; Sun, Y.; Li, M.; Liu, J. UV-activated room temperature single-sheet ZnO gas sensor. Micro Nano Lett. 2017, 12, 813–817. [Google Scholar] [CrossRef]
  25. Cui, J.; Shi, L.; Xie, T.; Wang, D.; Lin, Y. UV-light illumination room temperature HCHO gas-sensing mechanism of ZnO with different nanostructures. Sens. Actuators B 2016, 227, 220–226. [Google Scholar] [CrossRef]
  26. Bai, S.; Sun, C.; Guo, T.; Luo, R.; Lin, Y.; Chen, A.; Sun, L.; Zhang, J. Low temperature electrochemical deposition of nanoporous ZnO thin films as novel NO2 sensors. Electrochim. Acta 2013, 90, 530–534. [Google Scholar] [CrossRef]
  27. Fedorov, F.; Podgainov, D.; Varezhnikov, A.; Lashkov, A.; Gorshenkov, M.; Burmistrov, I.; Sommer, M.; Sysoev, V. The potentiodynamic bottom-up growth of the tin oxide nanostructured layer for gas-analytical multisensor array chips. Sensors 2017, 17, 1908. [Google Scholar] [CrossRef] [PubMed] [Green Version]
  28. Fedorov, F.S.; Solomatin, M.A.; Uhlemann, M.; Oswald, S.; Kolosov, D.A.; Morozov, A.; Varezhnikov, A.S.; Ivanov, M.A.; Grebenko, A.K.; Sommer, M.; et al. Quasi-2D Co3O4 nanoflakes as efficient gas sensor versus alcohol VOCs. J. Mater. Chem. A 2020, 8, 7214–7228. [Google Scholar] [CrossRef]
  29. Sysoev, V.V.; Kiselev, I.; Trouillet, V.; Bruns, M. Enhancing the gas selectivity of single-crystal SnO2:Pt thin-film chemiresistor microarray by SiO2 membrane coating. Sens. Actuators B 2013, 185, 59–69. [Google Scholar] [CrossRef]
  30. Sysoev, V.V.; Kiselev, I.; Frietsch, M.; Goschnick, J. The temperature gradient effect on gas discrimination power of metal-oxide thin-film sensor microarray. Sensors 2004, 4, 37–46. [Google Scholar] [CrossRef] [Green Version]
  31. Augustin, M.; Sommer, M.; Sysoev, V.V. UV-VIS sensor system based on SnO2 nanowires. Sens. Actuators A 2014, 210, 205–208. [Google Scholar] [CrossRef]
  32. Cai, Y.; Li, F.; Zhang, J.; Wu, Z. Occupational health risk assessment in the electronics industry in China based on the occupational classification method and EPA model. Int. J. Environ. Res. Public Health 2018, 15, 2061. [Google Scholar] [CrossRef] [Green Version]
  33. Goschnick, J. An electronic nose for intelligent consumer products based on a gas analytical gradient microarray. Microelectron. Eng. 2001, 57, 693–704. [Google Scholar] [CrossRef]
  34. Henrion, R.; Henrion, G. Multivariate Datenanalyse; Springer: Berlin/Heidelberg, Germany, 1995. [Google Scholar]
  35. Elstner, M.; Porezag, D.; Jungnickel, G.; Elsner, J.; Haugk, M.; Frauenheim, T. Self-consistent-charge density-functional tight-binding method for simulations of complex materials properties. Phys. Rev. B 1998, 58, 7260–7268. [Google Scholar] [CrossRef]
  36. Parr, R.G.; Pearson, R.G. Absolute hardness: Companion parameter to absolute electronegativity. J. Am. Chem. Soc. 1983, 105, 7512–7516. [Google Scholar] [CrossRef]
  37. Lu, X.; Gaus, M.; Elstner, M.; Cui, Q. Parametrization of DFTB3/3OB for magnesium and zinc for chemical and biological applications. J. Phys. Chem. B 2015, 119, 1062–1082. [Google Scholar] [CrossRef] [PubMed] [Green Version]
  38. Shunaev, V.V.; Slepchenkov, M.M.; Glukhova, O.E. Single-shell carbon nanotubes covered with iron nanoparticles for ion-lithium batteries: Thermodynamic stability and charge transfer. Top. Catal. 2018, 61, 1716–1720. [Google Scholar] [CrossRef]
  39. Shunaev, V.V.; Glukhova, O.E. Pillared graphene structures supported by vertically aligned carbon nanotubes as the potential recognition element for DNA biosensors. Materials 2020, 13, 5219. [Google Scholar] [CrossRef] [PubMed]
  40. Choi, T.H.; Liang, R.; Maupin, C.M.; Voth, G.A. Application of the SCC-DFTB method to hydroxide water clusters and aqueous hydroxide solutions. J. Phys. Chem. B 2013, 117, 5165–5179. [Google Scholar] [CrossRef]
  41. Choi, T.H. Simulation of the (H2O)8 cluster with the SCC-DFTB electronic structure method. Chem. Phys. Lett. 2012, 543, 45–49. [Google Scholar] [CrossRef]
  42. Izaki, M.; Omi, T. Electrolyte optimization for cathodic growth of zinc oxide films. J. Electrochem. Soc. 1996, 143, L53. [Google Scholar] [CrossRef]
  43. Zhang, R.; Yin, P.-G.; Wang, N.; Guo, L. Photoluminescence and Raman scattering of ZnO nanorods. Solid State Sci. 2009, 11, 865–869. [Google Scholar] [CrossRef]
  44. Cuscó, R.; Alarcón-Lladó, E.; Ibáñez, J.; Artús, L.; Jiménez, J.; Wang, B.; Callahan, M.J. Temperature dependence of Raman scattering in ZnO. Phys. Rev. B 2007, 75, 165202. [Google Scholar] [CrossRef]
  45. Damen, T.C.; Porto, S.P.S.; Tell, B. Raman effect in zinc oxide. Phys. Rev. 1966, 142, 570–574. [Google Scholar] [CrossRef]
  46. Calleja, J.M.; Cardona, M. Resonant Raman scattering in ZnO. Phys. Rev. B 1977, 16, 3753–3761. [Google Scholar] [CrossRef]
  47. Chen, Y.W.; Liu, Y.C.; Lu, S.X.; Xu, C.S.; Shao, C.L.; Wang, C.; Zhang, J.Y.; Lu, Y.M.; Shen, D.Z.; Fan, X.W. Optical properties of ZnO and ZnO:In nanorods assembled by sol-gel method. J. Chem. Phys. 2005, 123, 134701. [Google Scholar] [CrossRef]
  48. Šćepanović, M.; Grujić-Brojčin, M.; Vojisavljević, K.; Bernikc, S.; Srećković, T. Raman study of structural disorder in ZnO nanopowders. J. Raman Spectrosc. 2010, 41, 914–921. [Google Scholar] [CrossRef]
  49. Yang, H.; Zhou, W.; Yu, B.; Wang, Y.; Cong, C.; Yu, T. Uniform decoration of reduced graphene oxide sheets with gold nanoparticles. J. Nanotechnol. 2012, 2012, 328565. [Google Scholar] [CrossRef] [Green Version]
  50. Kim, J.-H.; Lee, J.-H.; Park, Y.; Kim, J.-Y.; Mirzaei, A.; Kim, H.W.; Kim, S.S. Toluene- and benzene-selective gas sensors based on Pt- and Pd-functionalized ZnO nanowires in self-heating mode. Sens. Actuators B 2019, 294, 78–88. [Google Scholar] [CrossRef]
  51. Mokrushin, A.S.; Nagornov, I.A.; Simonenko, T.L.; Simonenko, N.P.; Gorobtsov, P.Y.; Khamova, T.V.; Kopitsa, G.P.; Evzrezov, A.N.; Simonenko, E.P.; Sevastyanov, V.G.; et al. Chemoresistive gas-sensitive ZnO/Pt nanocomposites films applied by microplotter printing with increased sensitivity to benzene and hydrogen. Mater. Sci. Eng. B Solid State Mater. Adv. Technol. 2021, 271, 115233. [Google Scholar] [CrossRef]
  52. Zimnyakov, D.A.; Vasilkov, M.Y.; Yuvchenko, S.A.; Varezhnikov, A.S.; Sommer, M.; Sysoev, V.V. Light-tuned dc conductance of anatase TiO2 nanotubular arrays: Features of long-range charge transport. Nanomaterials 2018, 8, 915. [Google Scholar] [CrossRef] [PubMed] [Green Version]
  53. Mishra, S.; Ghanshyam, C.; Ram, N.; Bajpai, R.P.; Bedi, R.K. Detection mechanism of metal oxide gas sensor under UV radiation. Sens. Actuators B 2004, 97, 387–390. [Google Scholar] [CrossRef]
  54. Zheng, Z.Q.; Yao, J.D.; Wang, B.; Yang, G.W. Light-controlling, flexible and transparent ethanol gas sensor based on ZnO nanoparticles for wearable devices. Sci. Rep. 2015, 5, 11070. [Google Scholar] [CrossRef] [PubMed]
  55. Kim, J.-H.; Kim, H.W.; Kim, S.S. Ultra-sensitive benzene detection by a novel approach: Core-shell nanowires combined with the Pd-functionalization. Sens. Actuators B 2017, 239, 578–585. [Google Scholar] [CrossRef]
  56. Bobkov, A.; Varezhnikov, A.; Plugin, I.; Fedorov, F.S.; Trouillet, V.; Geckle, U.; Sommer, M.; Goffman, V.; Moshnikov, V.; Sysoev, V. The multisensor array based on grown-on-chip zinc oxide nanorod network for selective discrimination of alcohol vapors at sub-ppm range. Sensors 2019, 19, 4265. [Google Scholar] [CrossRef] [Green Version]
  57. Sysoev, V.V.; Goschnick, J.; Schneider, T.; Strelcov, E.; Kolmakov, A. A gradient microarray electronic nose based on percolating SnO2 nanowire sensing elements. Nano Lett. 2007, 7, 3182–3188. [Google Scholar] [CrossRef] [PubMed]
  58. Persaud, K.; Dodd, G. Analysis of discrimination mechanisms in the mammalian olfactory system using a model nose. Nature 1982, 299, 352–355. [Google Scholar] [CrossRef] [PubMed]
  59. Jurs, P.C.; Bakken, G.A.; McClelland, H.E. Computational methods for the analysis of chemical sensor array data from volatile analytes. Chem. Rev. 2000, 100, 2649–2678. [Google Scholar] [CrossRef] [PubMed]
  60. The Materials Project. Materials Data on ZnO by Materials Project. United States. 2020. Available online: https://doi.org/10.17188/1349869 (accessed on 1 March 2021).
Figure 1. The scheme for deposition of ZnO nanostructured layer over multi-electrode chip employing a three-electrode electrochemical cell: 1—a potentiostat interfaced with PC, 2—a simplified circuit diagram of electric potential application by the potentiostat, 3—electrolyte, 0.1 M Zn(NO3)2, 4—graphite rod, 5—Ag/AgClsat electrode, 6—a hotplate, 7—a multi-electrode chip wired in a ceramic holder.
Chemosensors 09 00181 g001
Figure 2. The experimental setup to measure the chemiresistive effect in electrochemically deposited ZnO nanostructured layer under variable gas exposure and UV activation: (a) drawing of the setup, 1—dry air generator, 2—bottles with calibrated analyte gases, 3—mass flow meters; 4—deionized water bubblers; 5—hygrometer/thermometer; 6—a sealed chamber containing the multielectrode chip, 7—UV power supply unit, (b) the scheme of UV irradiation the chip surface, 8—UV LED, 9—measuring Pt electrodes confining the deposited ZnO layer (10), 11—KAMINA unit, 12—PC; (c) the measured spectrum of LED emission.
Chemosensors 09 00181 g002
Figure 3. Morphology and structure of the electrochemically deposited ZnO layer: (af) SEM images of the oxide structures to appear in the inter-electrode space in dependence on various time: 400 s (a), 550 s (b), 700 s (c), 850 s (d), 1000 s (e), 1150 s (f); (g) the characteristic Raman spectrum; (h) XRD pattern. The characterization has been carried out for the chip which was a subject of heating at 300 °C in course of measurements.
Chemosensors 09 00181 g003
Figure 4. I-V characteristics of exemplary sensor segments of ZnO layer electrochemically grown at different deposition time t: (a) t = 400 s; (b) t = 550 s; (c) t = 700 s; (d) t = 850 s; (e) t = 1000 s; (f) t = 1150 s. The I–Vs were recorded under dry air conditions at a temperature of 150 °C. The right Y-axis in the plots yields the resistance values extracted from the I-Vs. The inset at (b) shows the electrical scheme to measure I–Vs over the segment at the chip.
Chemosensors 09 00181 g004
Figure 5. The temperature dependence of chemiresistive response to benzene (ac) and isopropanol (df), 100 ppm, mixed with dry (a,d) and wet, 50 rel. % (b,e), air; the data are given for the segments deposited for t = 550 as an example. The diagrams (c,f) show the relative difference of the chemiresistive response, Suv, observed to the analytes (c—benzene, f—isopropanol) at 150 °C and UV radiation and the same response, S, observed without UV distributed over the chip with local areas deposited for various time, 400–1150 s.
Chemosensors 09 00181 g005
Figure 6. The gas-sensor performance of ZnO nanostructured layer upon exposing to VOCs of varied concentration under the operating temperature of 150 °C: (a,b) exemplary R(t) transients recorded versus isopropanol vapors, 1–100 ppm, in a mixture with dry air (a) and humid-enriched, 50 rel. %. air (b) when the LED-UV illumination is On and Off; (c,d) the dependence of chemiresistive response calculated according to (1) on the VOC concentration of isopropanol (c) and benzene (d). The data are shown for the layer grown electrochemically for 550 s.
Chemosensors 09 00181 g006
Figure 7. The LDA diagram of primary two components related to multi-dimensional sensor signals of ZnO nanostructured layer-based chip upon exposure to isopropanol and benzene vapors, 10 ppm, in dry and humid air conditions when UV is On and Off. The clusters of the vector signals related to reference air backgrounds are given for clarity, too. The chip operating temperature is 150 °C. The cluster ellipses are built under the Gaussian distribution of signals within each class at 0.99 confidence probability. The number of vector signals related to each class under study is equal to 50.
Chemosensors 09 00181 g007
Figure 8. The results of DFTB calculation on ZnO surface’s interaction with isopropanol and benzene molecules: (a) the considered supercell, 96 atoms, taken from the crystal of ZnO P63mc; (b) the adsorption of analytes over pristine ZnO surface; (c) the adsorption of analytes over ZnO surface covered primarily with 19 H2O molecules.
Chemosensors 09 00181 g008
Table 1. The power index α of the S(C) curve for exemplary ZnO layer grown electrochemically for 550 s when exposed to isopropanol and benzene vapors at 150 °C.
UVIsopropanolBenzene
Dry AirHumid AirDry AirHumid Air
Off0.620.570.340.52
On0.540.530.110.32
Publisher’s Note: MDPI stays neutral with regard to jurisdictional claims in published maps and institutional affiliations.