Article

Expediting Disulfiram Assays through a Systematic Analytical Quality by Design Approach

1
Faculty of Pharmacy, University of Coimbra, 3000-548 Coimbra, Portugal
2
Coimbra Chemistry Centre, Department of Chemistry, University of Coimbra, 3004-504 Coimbra, Portugal
3
iBiMED—Department of Medical Sciences, University of Aveiro, 3810-193 Aveiro, Portugal
4
UnIC—Cardiovascular Research & Development Centre, Department of Surgery and Physiology, Faculty of Medicine, University of Porto, 4200-319 Porto, Portugal
5
QOPNA & LAQV-REQUIMTE, Chemistry Department, University of Aveiro, 3810-193 Aveiro, Portugal
6
Coimbra Institute for Biomedical Imaging and Translational Research, University of Coimbra, 3000-548 Coimbra, Portugal
*
Author to whom correspondence should be addressed.
Chemosensors 2021, 9(7), 172; https://doi.org/10.3390/chemosensors9070172
Submission received: 30 April 2021 / Revised: 29 June 2021 / Accepted: 3 July 2021 / Published: 6 July 2021
(This article belongs to the Collection Recent Trend in Chromatography for Pharmaceutical Analysis)

Abstract

:
An Analytical Quality by Design (AQbD) approach is presented, aiming at the development and validation of an HPLC method for the quantification of disulfiram and copper diethyldithiocarbamate in lipid nanoparticles. Following the definition of the analytical target profile (ATP), encompassing the critical analytical attributes (CAA), a two-level risk assessment strategy (Ishikawa diagram—failure mode and effect analysis (FMEA)) was employed to identify the critical method parameters (CMPs) with an extensive impact on method performance. The behavior of the CMPs (flow rate and mobile phase composition) was further characterized by experimental design, resorting to a face-centered central composite design (FcCCD). Statistical modeling, response surface analysis, and Monte Carlo simulations led to the definition of the Method Operable Design Region (MODR), associated with a negligible risk of failing the predefined CAA specifications. The optimal method was validated according to international regulatory recommendations. Apart from guaranteeing linearity, accuracy, precision, specificity, robustness, and stability, these conditions were found to be suitable for analysis using a different HPLC column and equipment. In a nutshell, the development and optimization strategies, under the comprehensive framework of AQbD, provided an effective, simple, rapid, reliable, and flexible method for routine analysis of the compounds in research or industrial environments.

1. Introduction

Disulfiram (DSF) is a dithiocarbamate derivative with clinical application to treat alcohol addiction. It blocks ethanol metabolism by inhibiting hepatic aldehyde dehydrogenases 1 and 2, thus increasing acetaldehyde blood levels. Consequently, alcohol consumers experience nausea, sweating, hypotension, respiratory difficulties, and other alcoholic intoxication symptoms, thereby rejecting additional beverages [1]. In parallel, DSF shows promising in vitro/in vivo results against several types of neoplastic diseases, as it may act over 19 different targets/pathways to reduce cancer cell viability [2]. DSF is also a chelating compound, producing copper (II) diethyldithiocarbamate (Cu(DDC)2) in the presence of endogenous or exogenous copper (II) ions. Alternatively, Cu(DDC)2 can be synthesized by chelating copper with sodium diethyldithiocarbamate (Figure 1) [3,4]. Interestingly, this complex has shown a more pronounced activity over several types of malignant tumors, prompting the repositioning of DSF to clinical cancer treatment [2].
However, there is a lack of clinical evidence that supports the efficacy of DSF as an anticancer drug due to the extensive degradation and/or metabolism (reduced half-time) of the drug. The reduced aqueous solubility of DSF (0.2 g/L) also impairs its intravenous administration. As for Cu(DDC)2, its intrinsic solubility is even lower, estimated as 0.700 µg/L [5]. Their inclusion in nanosystems for cancer drug delivery is thus highly anticipated.
The increasing interest in these compounds prompts the need for developing appropriate analytical methods, with chromatography remaining the standard approach for quantification in the pharmaceutical industry. Curiously, neither DSF nor Cu(DDC)2 possess ionizable groups that can modify their partition between the stationary and the mobile phases during chromatography. There are also no reports in the literature for their simultaneous quantification by reversed-phase high-performance liquid chromatography (RP-HPLC). An exception is presented by Irth et al. [6], dated from 1988, who used post-column derivatization for spectrophotometric analysis. Furthermore, reported chromatographic methods for DSF or Cu(DDC)2 focus on the quantification of the compounds in nanotechnological platforms, without indication of Analytical Quality by Design (AQbD) development or formal validation.
Similarly to Quality by Design (QbD), one can say that AQbD major goal is an in-depth understanding of the method. Additionally, the method is well understood when all sources of critical variability are identified and characterized, with the method operable design region (MODR) accurately and successfully predicting the critical analytical attributes (CAAs) [7]. This translation to analytical procedures gained increasing attention over the last decade. Contrary to QbD, it is still scarcely evidenced in the literature, with only 86 references in the period of 2010 to 2018 [8].
AQbD includes the identification of the Analytical Target Profile (ATP) and CAAs, as well as the critical method parameters (CMPs) that significantly affect method performance [9]. The identification of these parameters is often conducted through risk assessment, either using Ishikawa diagrams, risk matrices, failure mode and effect analysis (FMEA), or failure mode, effects, and criticality analysis (FMECA), although other tools can be used [10]. In every case, there is a strong contribution from previous knowledge and experience. CMPs are then systematically explored by Design of Experiments (DoE), an AQbD statistical tool for mathematical modeling that characterizes the factor-response (CMPs-CAAs) relationships through simultaneous variations of the CMP conditions. When several CMPs are identified, one should consider two-level designs, such as 2k full factorial designs (FFD), fractional factorial designs (FrFD), and Placket-Burman designs (PBD). Moreover, also known as screening designs, these have proved their usefulness in confirming the criticality of the CMPs, often leading to their disregard for further studies. The three-level designs (response surface methodology), including 3k FFDs, Box-Behnken designs (BBD), and central composite designs (CCD), are used for method optimization. Other two- and three-level designs can be used under the AQbD umbrella for method development and optimization, including Taguchi, I-optimal, D-optimal, and Doehlert designs [11].
Ultimately, AQbD defines a multidimensional region of robustness within the knowledge space, the MODR, in which the chromatographic conditions (in terms of CMPs) satisfy the criteria defined in the ATP [12,13]. This region can be constructed by overlaying the independent 2D contour plots that model CAA parameters in function of the variation of the CMPs. Nonetheless, Bayesian and stochastic approaches, supported by the determination of the risk of failing the specifications, have demonstrated superiority [8]. The MODR is also subject to validation, often by Monte Carlo simulations and/or experimental validation, in order to guarantee its authenticity and robustness. The definition of the MODR encompasses various advantages. Apart from increasing method knowledge, it indicates a range of values in which the method provides quality results, thus being suitable for analysis. In fact, the method parameters can be varied anywhere within the MODR, in opposition to a fixed condition, without the need for revalidation, but only for an adjustment [8,14]. Note that an appropriate control strategy must be implemented to control all sources of variability that might occur, always aiming at the continual improvement of the method [14]. An overview of the AQbD workflow is presented in Figure 2.
Here, an AQbD strategy is set for the quantification of DSF and its anticancer metabolite, Cu(DDC)2, in nanostructured lipid carriers (NLCs), the second generation of solid lipid nanoparticles.

2. Materials and Methods

2.1. Materials

Disulfiram (DSF, tetraethylthiuram disulfide, 97%) and sodium diethyldithiocarbamate trihydrate (DDC, cupral, 99%) were purchased from Sigma-Aldrich. Copper (II) sulfate pentahydrate, gradient grade acetonitrile (ACN), and ethanol were obtained from Panreac, Honeywell, and Labchem, respectively. Water (Ω = 18.2 MΩ.cm, TOC < 1.5 µg/L) was ultrapurified (Sartorius®) and filtered through a 0.22 µm nylon filter prior to use.

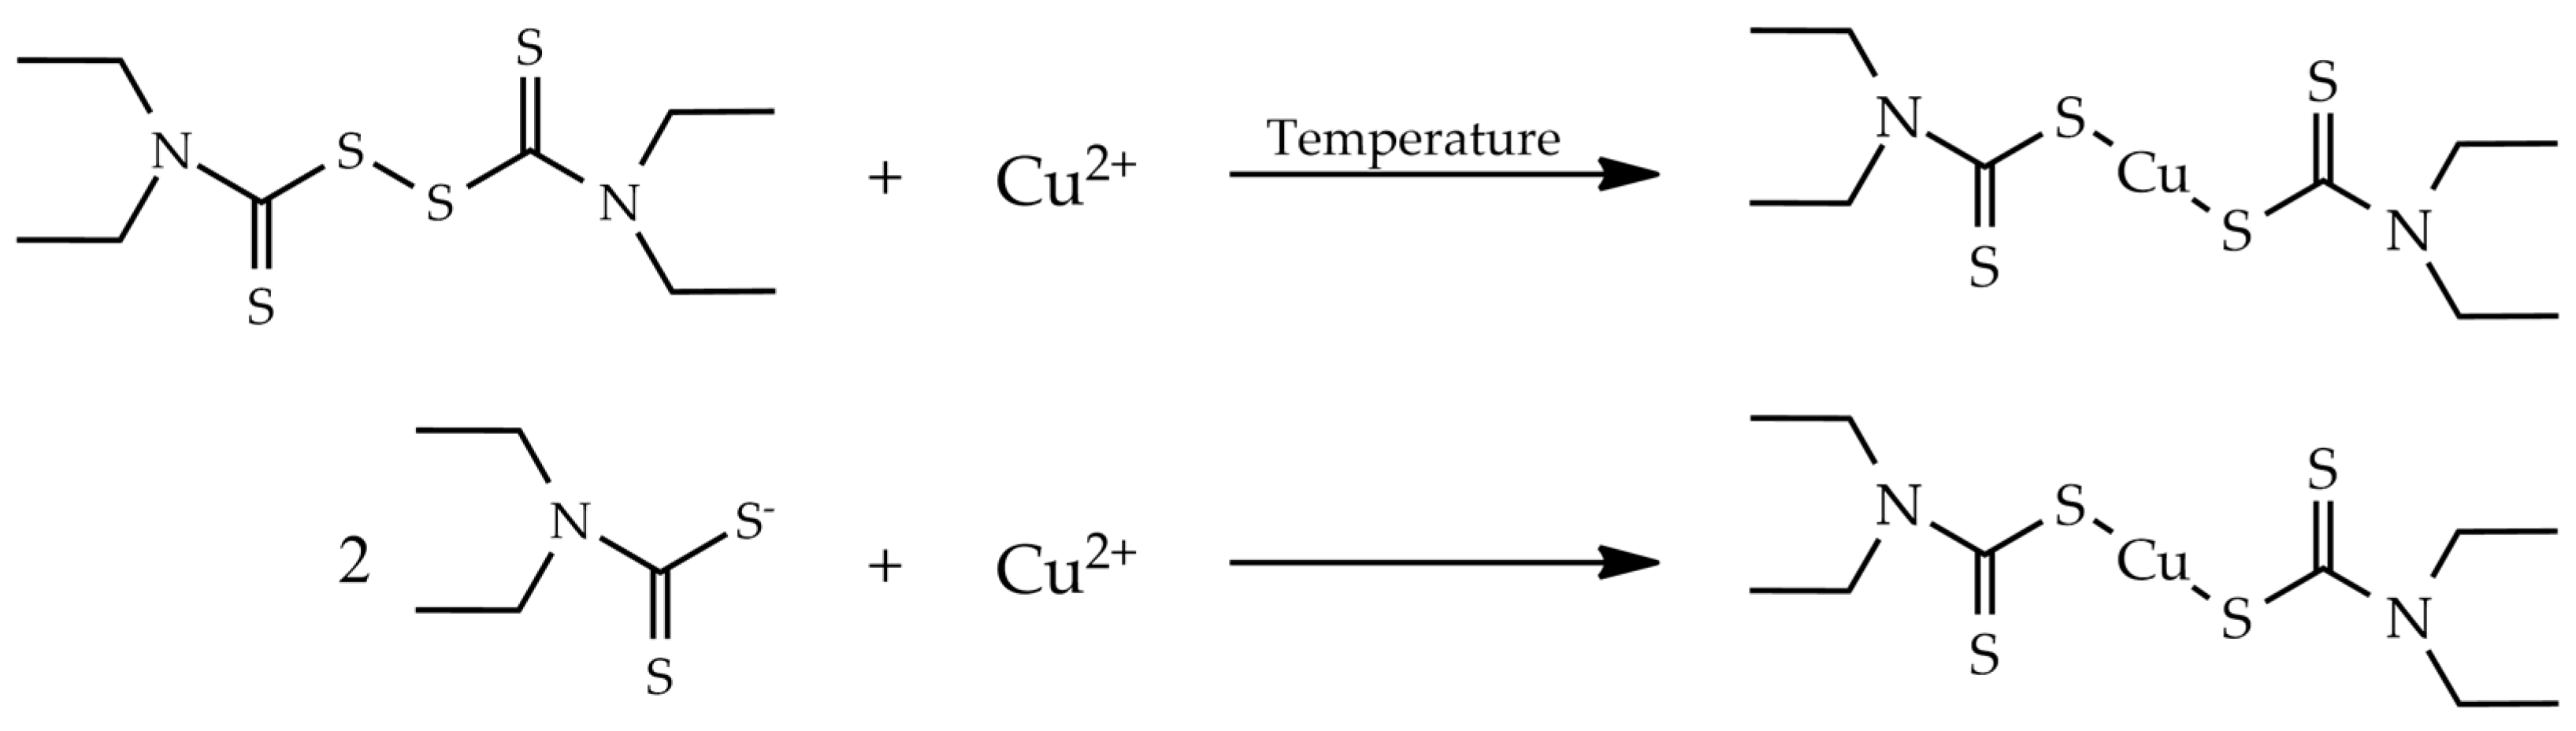
2.2. Copper (II) Diethyldithiocarbamate Synthesis

The synthesis of Cu(DDC)2 was achieved through the chelation of copper ions by sodium diethyldithiocarbamate in an aqueous environment, as described by Liu et al., with modifications [15]. Briefly, copper (II) sulfate (1 mmol, 0.253 g) and sodium diethyldithiocarbamate (2 mmol, 0.456 g) were mixed in a 1:2 molar ratio, under stirring, at room temperature, for 1 h. Following the spontaneous reaction, the solid brown precipitate was filtered under reduced pressure, washed with ultrapurified water, recrystallized with ethanol to eliminate salts and unreacted products, and dried under vacuum (91% yield). Structural analysis was confirmed by 1H and 13C NMR (Supplementary Material, Figures S1 and S2).

2.3. Chromatographic Instrument and Conditions

The chromatographic analysis was carried out in a Shimadzu LC-2010HT system, equipped with a quaternary pump (LC-20AD), an autosampler (SIL-20AHT), an oven (CTO-10AS), and a photodiode array detector (SPD-M2OA). The separation was achieved utilizing a reversed-phase ACE® 5 C18 column, with 5 µm of particle size, 4.6 mm of internal diameter, and 150 mm of length (Advanced Chromatography Technologies Ltd., UK), supported by a SecurityGuard cartridge under the following conditions: isocratic mode, at 40 °C, with a mobile phase composed of ACN:H2O in various ratios and different flow rates. Using an injection volume of 10 µL, DSF and Cu(DDC)2 were determined at their maximum absorption wavelength, 217 nm and 270 nm, respectively.

2.4. Calibration Standards and Quality Control Solutions

DSF (5 mg in 5 mL) and Cu(DDC)2 (2.5 mg in 5 mL) stock solutions were prepared independently in ACN and sonicated to guarantee a complete dissolution. Note that methanol, tetrahydrofuran, dimethyl sulfoxide, and dichloromethane led to an accelerated degradation of the compounds or showed insufficient solvent abilities. Two working standards containing both compounds at 100 and 10 µg/mL were prepared by dilution of the stock solutions. Calibration standards (0.1, 0.25, 0.5, 1, 5, 10, 25, 50, 75, and 100 µg/mL) were prepared by sequential dilutions of the working solutions with mobile phase and filtered through 0.2 µm PTFE filters prior to the injection. Calibration curves were constructed by linear regression of the peak area against the nominal concentration after weighting correction. Quality controls were prepared similarly to calibration standards, at intermediate concentrations (0.2, 20, and 90 µg/mL).

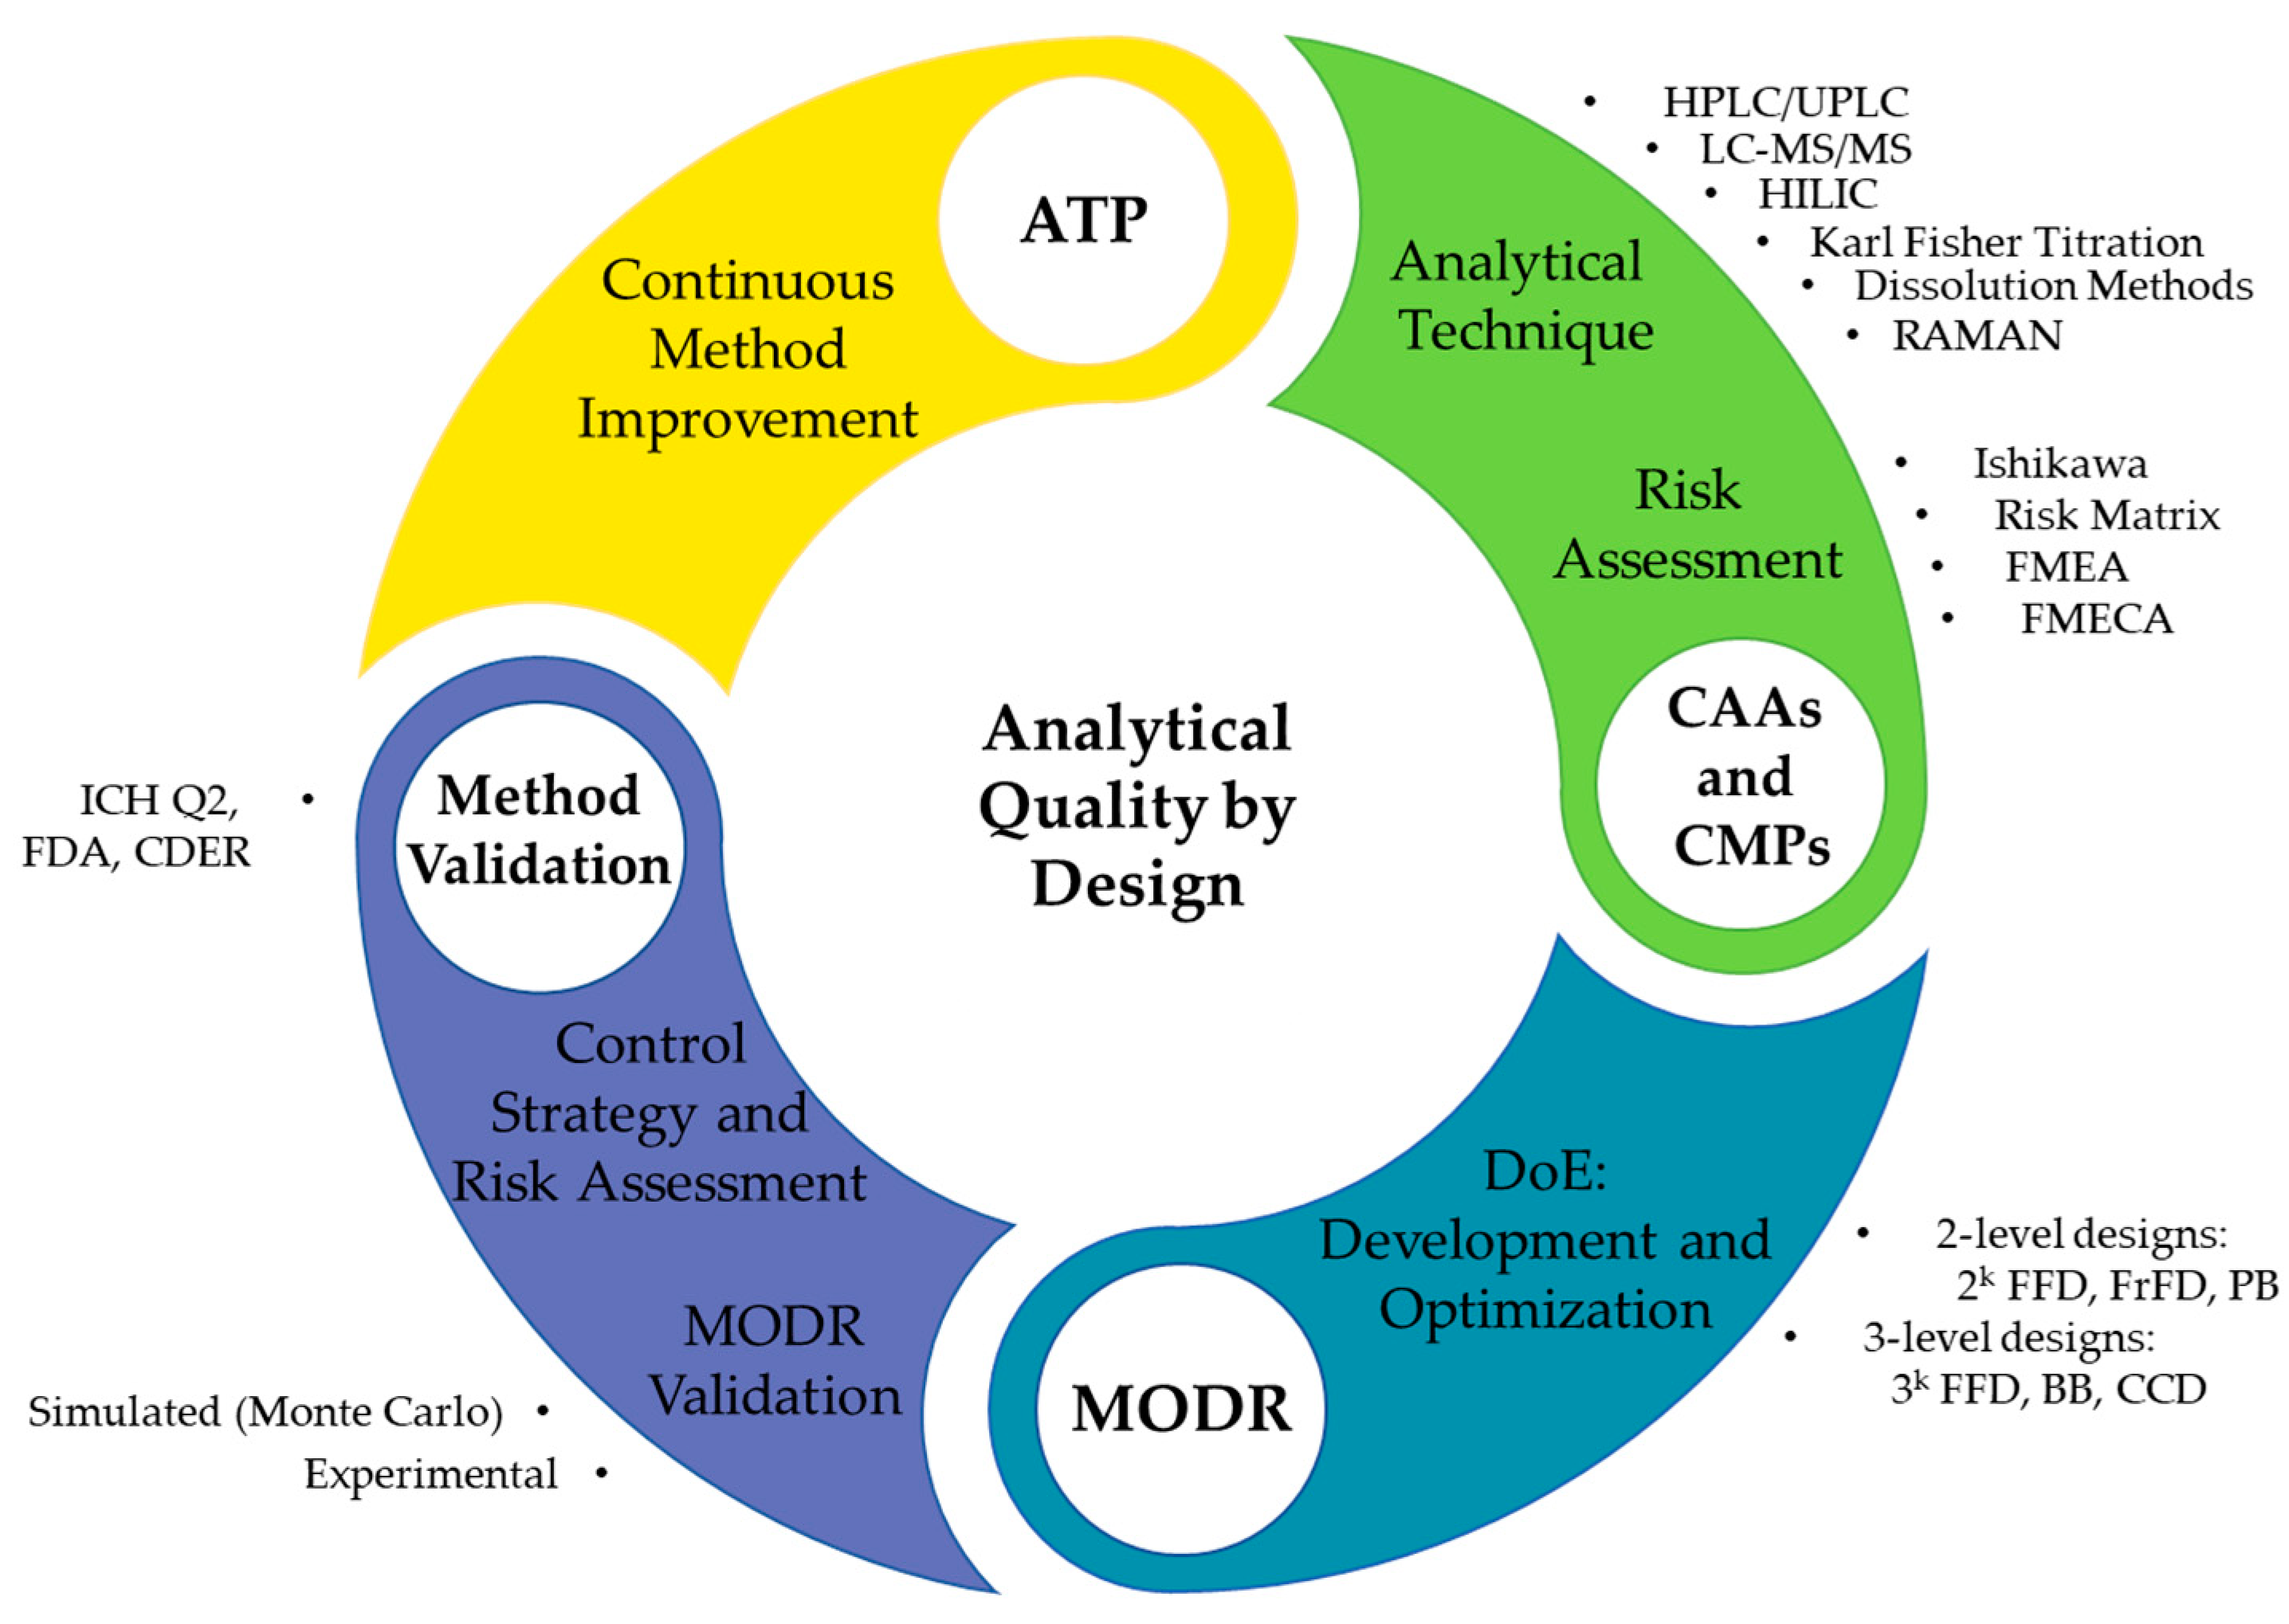
2.5. AQbD HPLC Method Development

2.5.1. Analytical Target Profile Definition

The establishment of an analytical QbD approach assumes the establishment of an analytical target profile (ATP), a prospective summary of the quality characteristics of the method, similarly to the quality target product profile (QTPP) in pharmaceutical development. Table 1 indicates various ATP elements taken into consideration for the development and optimization of the chromatographic method for the quantification of DSF and its anticancer metabolite, Cu(DDC)2. Considering their relevance in liquid chromatography, the number of theoretical plates (N), retention time (Rt), tailing factor (Tf), critical peak resolution (Res), and capacity factor (k’) of the analytes were selected as critical analytical attributes (CAAs), and should be consistent with formal or commonly acceptable validation criteria.

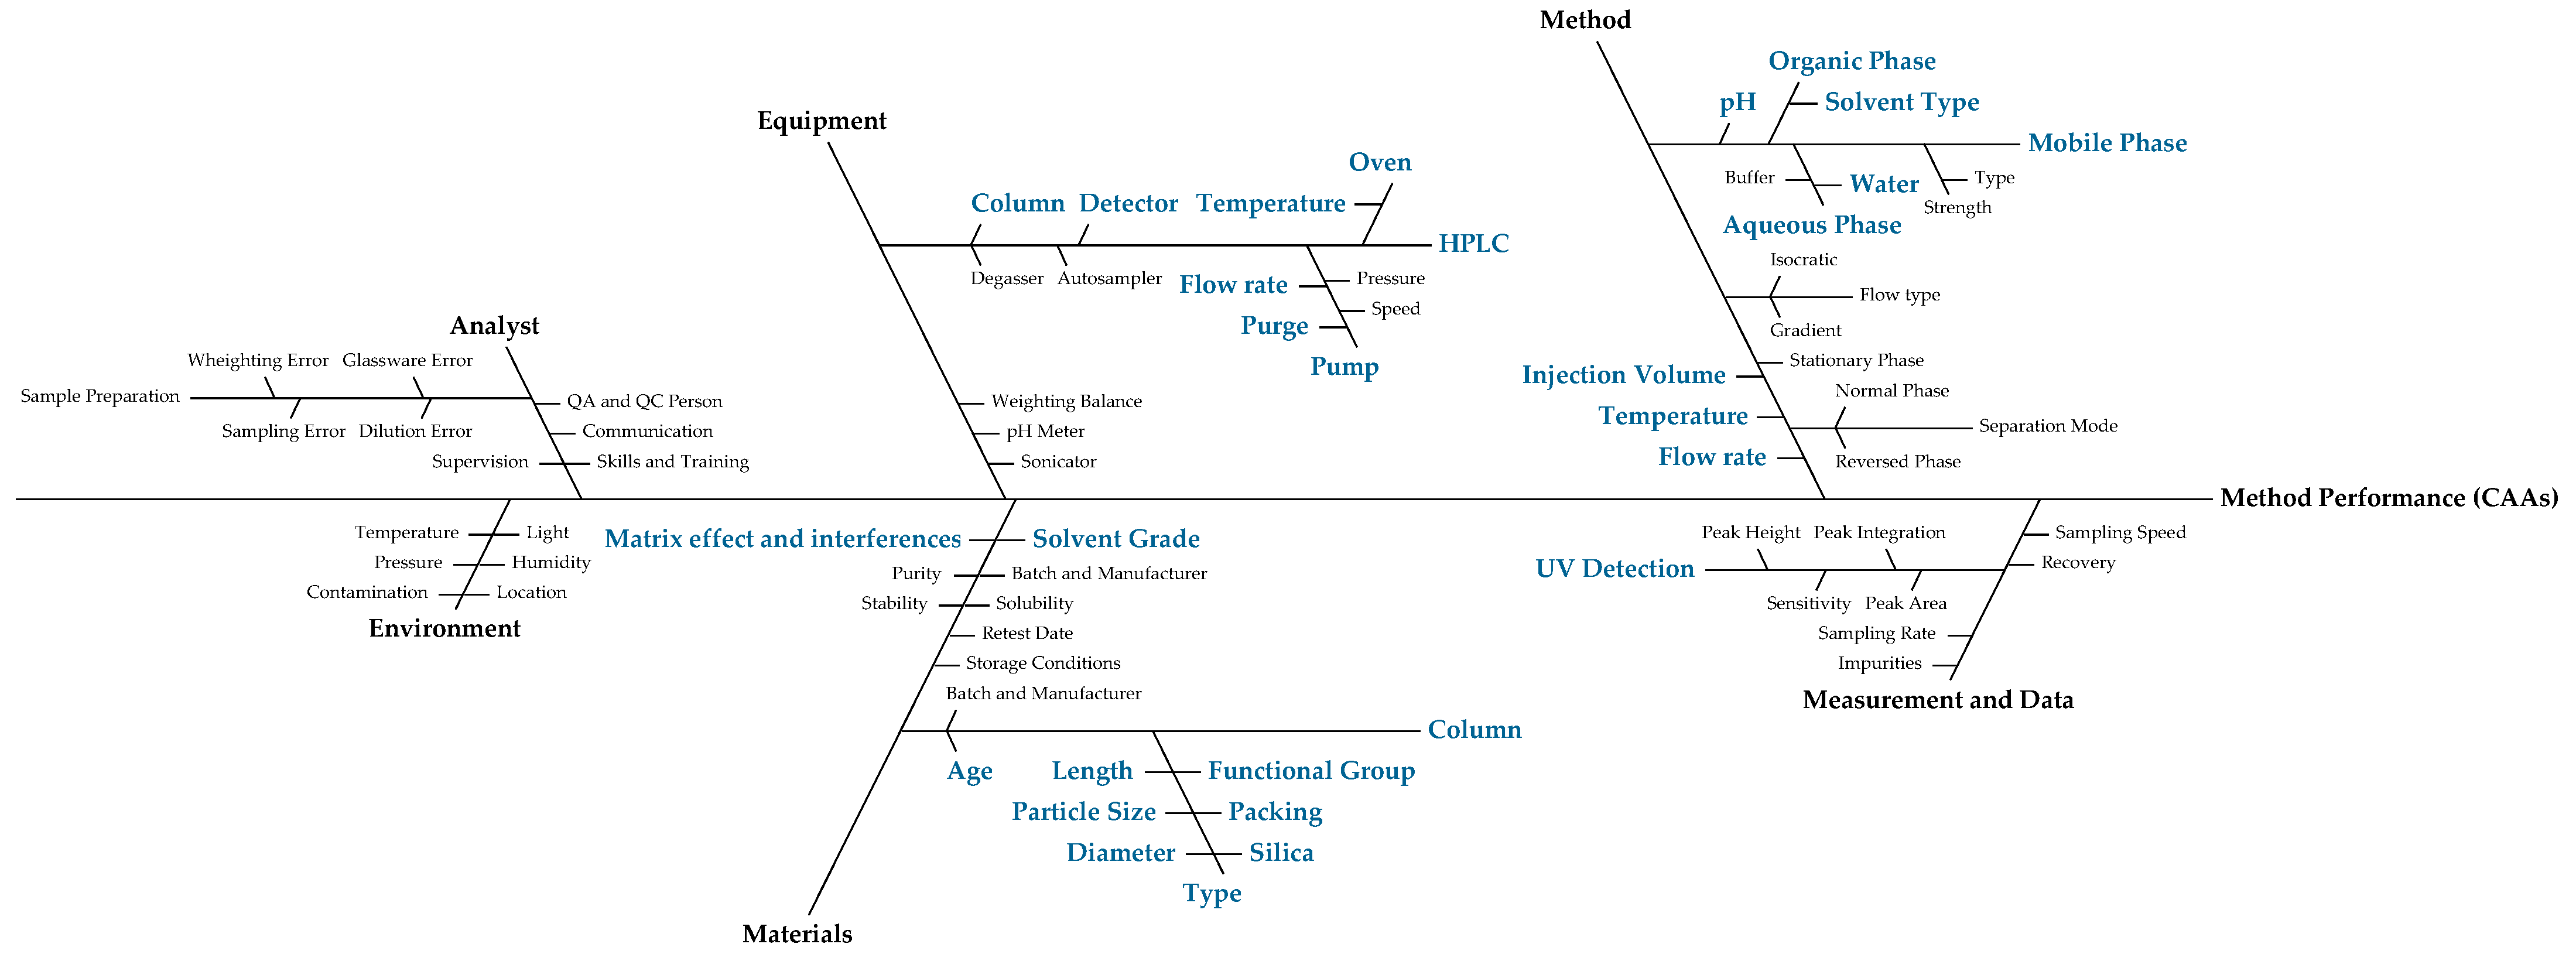
2.5.2. Risk Assessment

Risk assessment approaches are useful to identify potential analytical parameters, such as method parameters, equipment, and measurements that may have an impact on method development and performance. The simplest approach is the conceptualization of Ishikawa (also known as fishbone and cause-and-effect) diagrams that outline the relationship between possible critical method parameters and the critical analytical attributes established in the ATP. Based on the analytical parameters identified in the Ishikawa diagram, a failure mode and effect analysis (FMEA) was used to evaluate and select the critical ones to be further studied. Risk priority number (RPN) was determined based on,
RPN = Severity (S) × Occurrence (O) × Detectability (D)
where an RPN above 100 was considered of high risk and failure mode and therefore submitted to a systematic evaluation using a response surface method optimization [16]. The criteria considered for the determination of the RPN are displayed in Table 2.

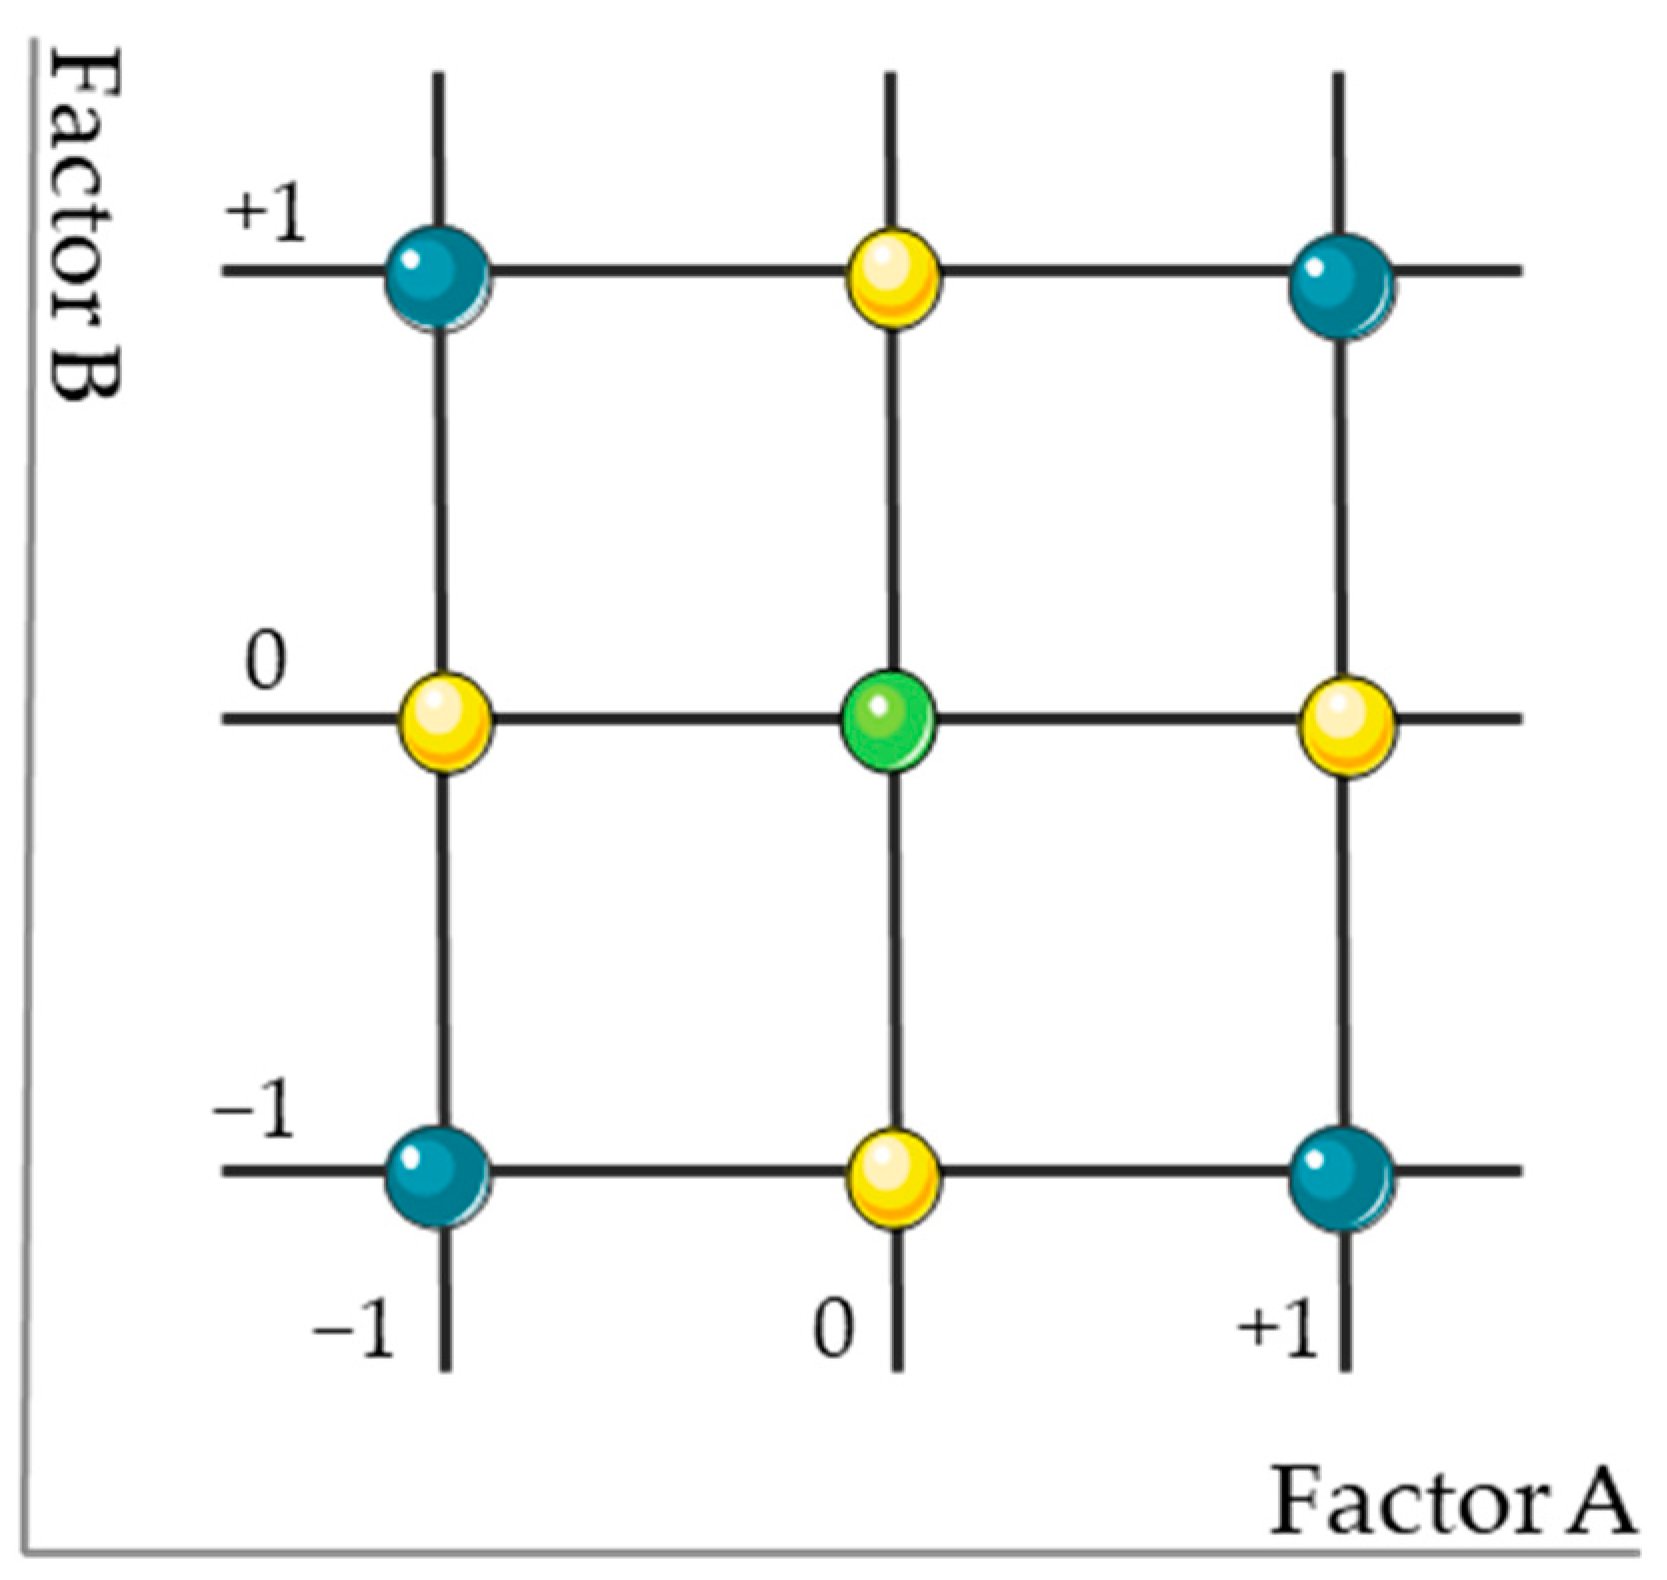
2.5.3. Method Development and Optimization

The chromatographic method was developed and optimized using a face-centered central composite design (FcCCD), an effective second-order model that combines a two-level factorial design (2n) or fractional factorial design (2n−k), one central point and 2n outer points, denoted as axial or star points (along with the coordinate axes, at ± α). In the case of an FcCCD, with two factors, both factorial and star points present the same negative and positive distance from the central point, i.e., the star points are at the center of each face of the experimental domain (α = 1), at (±α, 0) and (0, ±α), thus being identical to a 32 FD with a rectangular experimental domain (Figure 3) [17].
The proposed models for each CAA are explained by the quadratic polynomial function:
Y = β0 + β1 X1 + β2 X2 + β12 X1 X2 + β11 X112 + β22 X222
where Y is the evaluated response associated with each factor level combination, β0 is the response in the absence of effects, β1 and β2 are the linear coefficients of the factors X1 and X2, respectively, β12 is the interaction coefficient between X1 and X2, and β11 and β22 are the quadratic terms that allow the prediction of the curvature of the model. The statistical significance of the parameters in the regression model was evaluated using Student’s t-test (95% confidence level, α = 0.05) and ANOVA (p-value < 0.05). Non-significant terms were removed by backward selection, in which higher p-value terms are sequentially removed (p-value > 0.05 threshold). FcCCD models were built and analyzed in JMP® Pro 15.0.0.

2.5.4. MODR Design and Validation

The MODR was designed using Monte Carlo simulations, considering the specifications of each CAA. This operable region provides several conditions that fulfill the chromatographic requirements set in the ATP, expressed as the probability of failure (%), assuming a normal distribution of the method parameters associated with a certain random standard deviation [18]. Random variation for each CAA was also considered in a total of 10,000 experimental runs across the range of parameters. In addition, experimental validation, using 4 additional chromatographic conditions was also performed.

2.6. Method Validation

The validation of the optimized chromatographic method was performed according to ICH and FDA regulations, taking into account the system suitability, limits of detection and quantification, linearity, accuracy, precision, robustness, ruggedness, specificity, and stability [19,20,21,22].

2.6.1. System Suitability

System suitability parameters of the method were determined by injecting six times the same quality control solutions and compared to the specifications and recommendations of the FDA [21]. Accordingly, theoretical plate number (N) > 2000, tailing factor (Tf) < 2.0, critical peak resolution (Res) > 2.0, relative standard deviation (RSD) of peak area and of retention time (Rt) < 2.0% and capacity factor (k’) > 2.0.

2.6.2. Detection and Quantification Limits

The limits of detection (LOD) and quantification (LOQ) were determined with a calibration curve obtained from specific calibration standards (0.1, 0.25, 0.5, 1, and 5 µg/mL). Subsequently, LOD and LOQ were calculated according to LOD = 3.3 σ/S and LOQ = 10 σ/S, where σ is the standard deviation of the response and S the calibration curve slope [19].

2.6.3. Linearity

The linearity of the method was evaluated using six calibration curves containing DSF and Cu(DDC)2, simultaneously ranging from 0.1 to 100 µg/mL. Linearity was determined through the plotting of peak area as a function of the nominal concentration of the standards, using a least squares regression method. Since homoscedasticity (condition of equal variance throughout the points) is not frequently observed, in particular, using wide x-value ranges, a 1/x2 weighting factor was employed (bias < 15%) [23]. According to regulatory guidelines, a determination coefficient, R2 > 0.999 was considered [21].

2.6.4. Accuracy and Precision

Accuracy and precision were evaluated intra and interdaily for three consecutive days. Six independent samples of each quality control solution were prepared and analyzed. To demonstrate accuracy, i.e., the agreement between the nominal concentration (true) and the measured value, a limit of bias < 15% was established. As for intraday (repeatability) and interday (intermediate) precision, i.e., the degree of scatter among several determinations of the same homogeneous sample, a limit of RSD < 15% was imposed [22].

2.6.5. Robustness and Ruggedness

Robustness, as per the ICH definition, is a “measure of (the analytical procedure) capacity to remain unaffected by small, but deliberate variations in method parameters and provides an indication of its reliability during normal usage” [19]. As per that definition and validation of the MODR, the compliance to this parameter is empirically met. According to the USP, ruggedness is seen as a measure of the reproducibility of the results under various conditions met when changing the laboratory and the analyst [24]. Therefore, six quality control solutions were analyzed, for accuracy and precision, in a different HPLC column (Kinetex® EVO C18 column, with 5 µm of particle size, 4.6 mm of internal diameter and 150 mm of length) and HPLC instrument (Shimadzu LC-10AD, quaternary pump LC10-AD, autosampler unit Sil-10ADVP, CTO-10AVP oven and a CBM-20A UV detector). System suitability, according to Section 2.6.1 was also evaluated.

2.6.6. Specificity

Specificity, termed as the ability to accurately measure the analytes in the presence of potential interferents, was visually analyzed in terms of peak Rt [19]. A representative chromatogram of a quality standard solution and of the supernatant of lipid nanoparticles was compared to the supernatant obtained from a blank formulation [25]. The main goal of specificity is to ensure that the integrity of each analyte is not compromised by any formulation excipient (including the combination of lipids and surfactants).

2.6.7. Stability

In order to evaluate stability, quality control samples were analyzed for short-term stability, following 24 h at room temperature (approx. 25 °C, in the autosampler) and 72 h at 4 °C. Furthermore, stock solutions were also evaluated for three freeze-thaw cycles and intermediate-term stability, at −20 °C, for 7 days, by preparing and evaluating the respective quality control solutions [21,22].

2.7. Method Applicability: Nanostructured Lipid Carriers

2.7.1. NLC Production

NLCs were prepared by high shear homogenization followed by high-pressure homogenization, as described elsewhere [26]. Briefly, 2% (w/w) DSF was dissolved in the molten lipid phase, containing the solid and the liquid lipids (mono-, di- and triglyceride esters of fatty acids (C10 to C18), oleic acid and propylene glycol mono- and diesters of caprylic acid) as well as the dissolved salt of copper. Note that Cu(DDC)2 was formed in situ, during the production method, through the reaction of DSF and copper ions. Subsequently, the mixture was added to 30 mL of a hot aqueous surfactant solution and emulsified for 5 min at 19,000 rpm (Ultra-Turrax X 10/25, Ystral GmbH, Dottingen, Germany). The pre-emulsion was further processed in a high-pressure homogenizer for 10 min at 1500 bar (150 MPa) (EmulsiFlex-C3; Avestin, Inc., Ottawa, Canada). The resulting dispersion was then stored at 4 °C to form the NLCs. Colloidal properties, in particular, particle size and distribution, and zeta potential, were determined following a 100-fold dilution in ultrapurified water by dynamic and electrophoretic light scattering (Zetasizer Nano ZS, Malvern Instruments, Malvern, UK).

2.7.2. Entrapment Efficiency and Drug Loading Determination

The entrapment efficiency (EE) and drug loading (DL) of DSF and CU(DDC)2 in the NLCs were calculated according to
%EE = (Wtotal drug − Wfree drug)/Wtotal drug × 100
%DL = (Wtotal drug − Wfree drug)/Wlipid × 100
where Wtotal drug is the amount of drugs encapsulated in the NLCs, Wfree drug is the amount of free drugs determined in the aqueous phase after ultrafiltration-centrifugation (Sartorius® Vivaspin 500 filter unit, 100 kDa molecular weight cut-off), and Wlipid is the weight of the lipid phase of the nanosystems [25]. For the total drug quantification, a specific volume of NLCs was suitably diluted in the mobile phase and heated at 60 °C, under sonication, for 15 min. The solution was further centrifuged for 5 min at 11,740× g, at 4 °C, and the supernatant was filtered and analyzed by HPLC. For the determination of free drugs, NLCs were diluted with cold ACN in order to dissolve potential drug crystals, submitted to ultrafiltration-centrifugation, and the collected aqueous phase analyzed by HPLC.

3. Results and Discussion

3.1. Risk Assessment

Narrowing down to a few most critical method parameters for experimental evaluation can be challenging, considering the multitude of factors that potentially affect the development of a chromatographic method. A systematic risk assessment analysis not only identifies CMPs but also prioritizes them according to their severity. Here, a two-stage study was conducted, contemplating an Ishikawa diagram followed by a failure mode effect analysis (FMEA). The Ishikawa diagram was designed based on prior knowledge, both experimental and theoretical. This diagram outlines several factors that may contribute to method performance, in particular, considering the analyst, environment, equipment, method and measurement, and data (Figure 4). Nonetheless, it does not consider their risk or criticality.
In order to efficiently categorize and identify the critical method parameters to be systematically studied, an FMEA approach was conducted. FMEA focuses on minimizing potential failures prior to their occurrence and aids in developing a strategy to reduce the risk of a future failure by changing the process appropriately [27]. Several factors identified in the Ishikawa diagram were evaluated for their severity, occurrence, and detectability (Table 3). Accordingly, flow rate and mobile phase composition were the method parameters with the highest RPN score, determined using Equation (1). The remaining failure modes, with ranging severity, occurrence, and detectability, were considered to be non-critical and can be easily resolved by the corresponding strategy. For example, line purging-related risks can be tackled by guaranteeing purge prior to the analysis, whereas UV detection (with respect to λmax, signal/noise ratio, and sensitivity) can be defined a priori, in the ATP.

3.2. Method Development and Optimization: Critical Analytical Attributes

Taking into consideration the RPN > 100 threshold, flow rate (X1) and mobile phase ratio (in % of ACN) (X2) were defined as the CMPs and, consequently, systematically evaluated following the design matrix of Table 4. Their impact on CAAs (N, Tf, Res, Rt, and k’) was characterized. The chromatographic conditions were set after preliminary studies, where other mobile phase compositions (in particular, with methanol and various pH values) were evaluated at different flow rates.
According to the FcCCD, a total of 18 experimental runs were performed (nine chromatographic conditions, with two calibration standards, 1 and 100 µg/mL), at three levels: for X1, 0.8, 1.0 and 1.2 mL/min; for X2, 55, 70 and 85% of ACN. The influence of each factor and their combination in the CAAs was determined using the polynomial coefficients of Equation (2). Higher coefficient magnitudes indicate stronger main effects on the corresponding CAA. Additionally, the signal of the coefficient also has an important significance. When the coefficient sign is negative, an increase in the factor decreases the response. On the contrary, if the sign is positive, an increase in the factor increases the response. The interaction coefficient indicates how the variation of one factor modulates the effect of the other factor. Note that the main effect may be impacted by the interaction terms. Lastly, the quadratic terms, whenever statistically significant, provide curvature to the models [25]. Note that non-significant coefficients were removed by backward selection, as mentioned in Section 2.5.3. Therefore, only statistically significant terms (p-value < 0.05) are presented in the subsequent sections. The ANOVA parameters for the characterization of the model fitting per CAA are presented in Supplementary Material, Table S1.

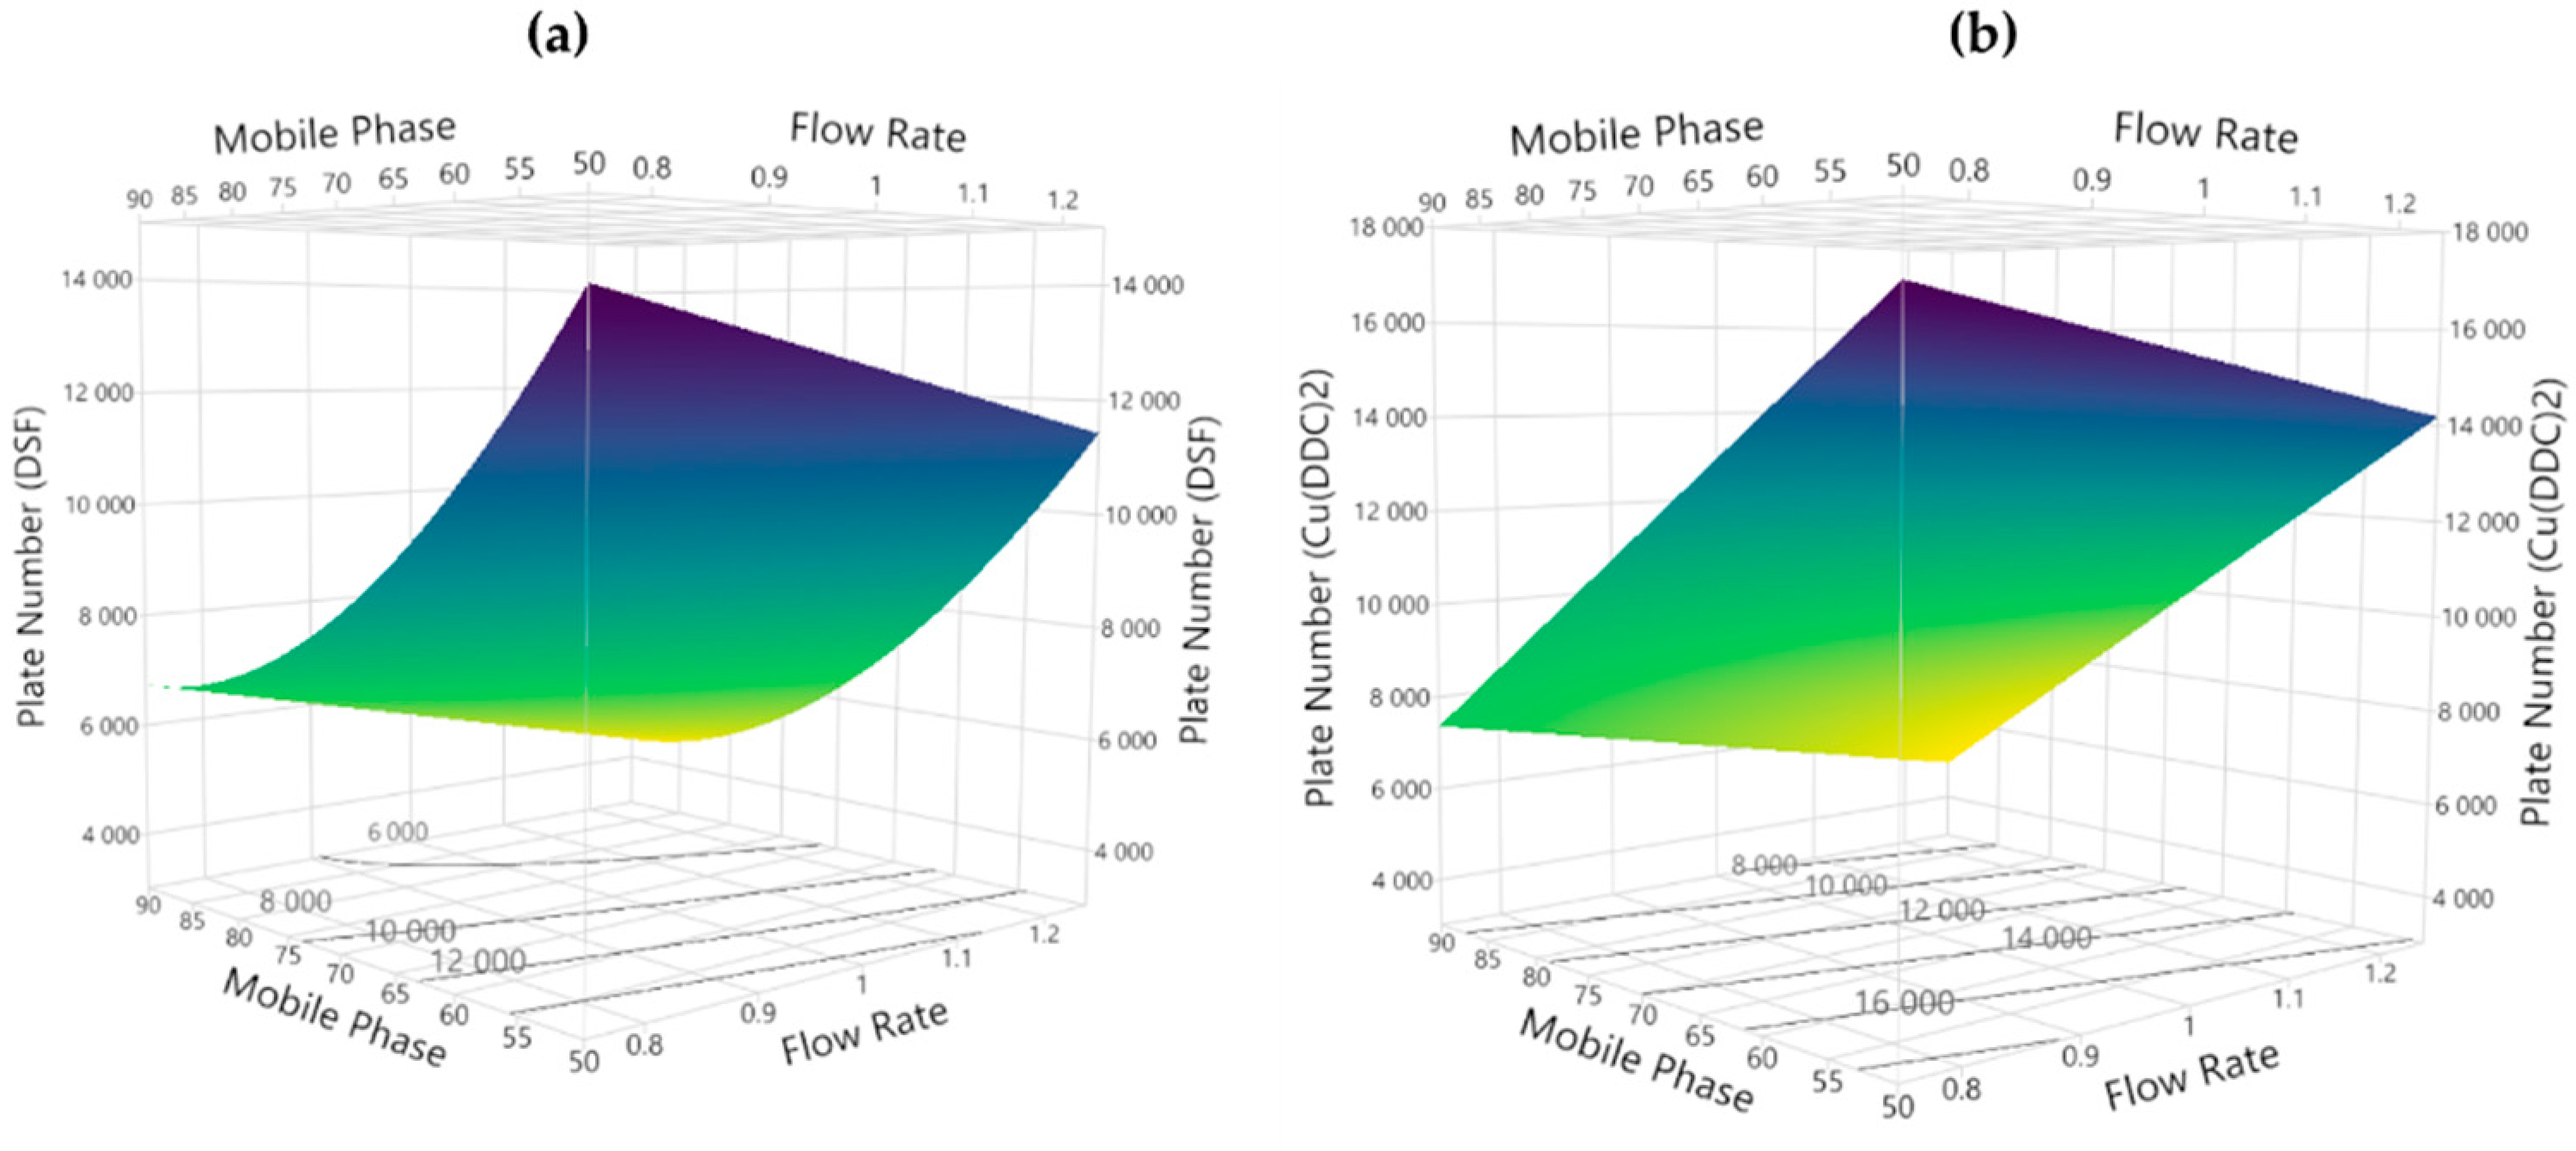
3.2.1. Theoretical Plates

Theoretical plates are a measure of column efficiency, indicating the number of peaks located per run-time unit on a chromatogram [28]. Regardless of the conditions evaluated under the experimental design, N was always above the minimum required by regulatory guidelines (N > 2000) and can be estimated using:
NDSF = 7390 − 939 X1 − 2637 X2 + 951 X222, R2 = 0.946, R2adj = 0.935
NCu(DDC)2 = 10,768 − 985 X1 − 3484 X2, R2 = 0.903, R2adj = 0.890
Considering the coefficients of Equations (5) and (6), both factors present a negative impact on this response, although with a higher extent for the % ACN (X2). In addition, the β22 coefficient provides curvature to the DSF model. In fact, as graphically evidenced by Figure 5, an increase in flow rate (X1) and/or the percentage of the organic phase (X2) reduces the number of theoretical plates for both analytes. This trend is also verified for other compounds under different chromatographic conditions [25].

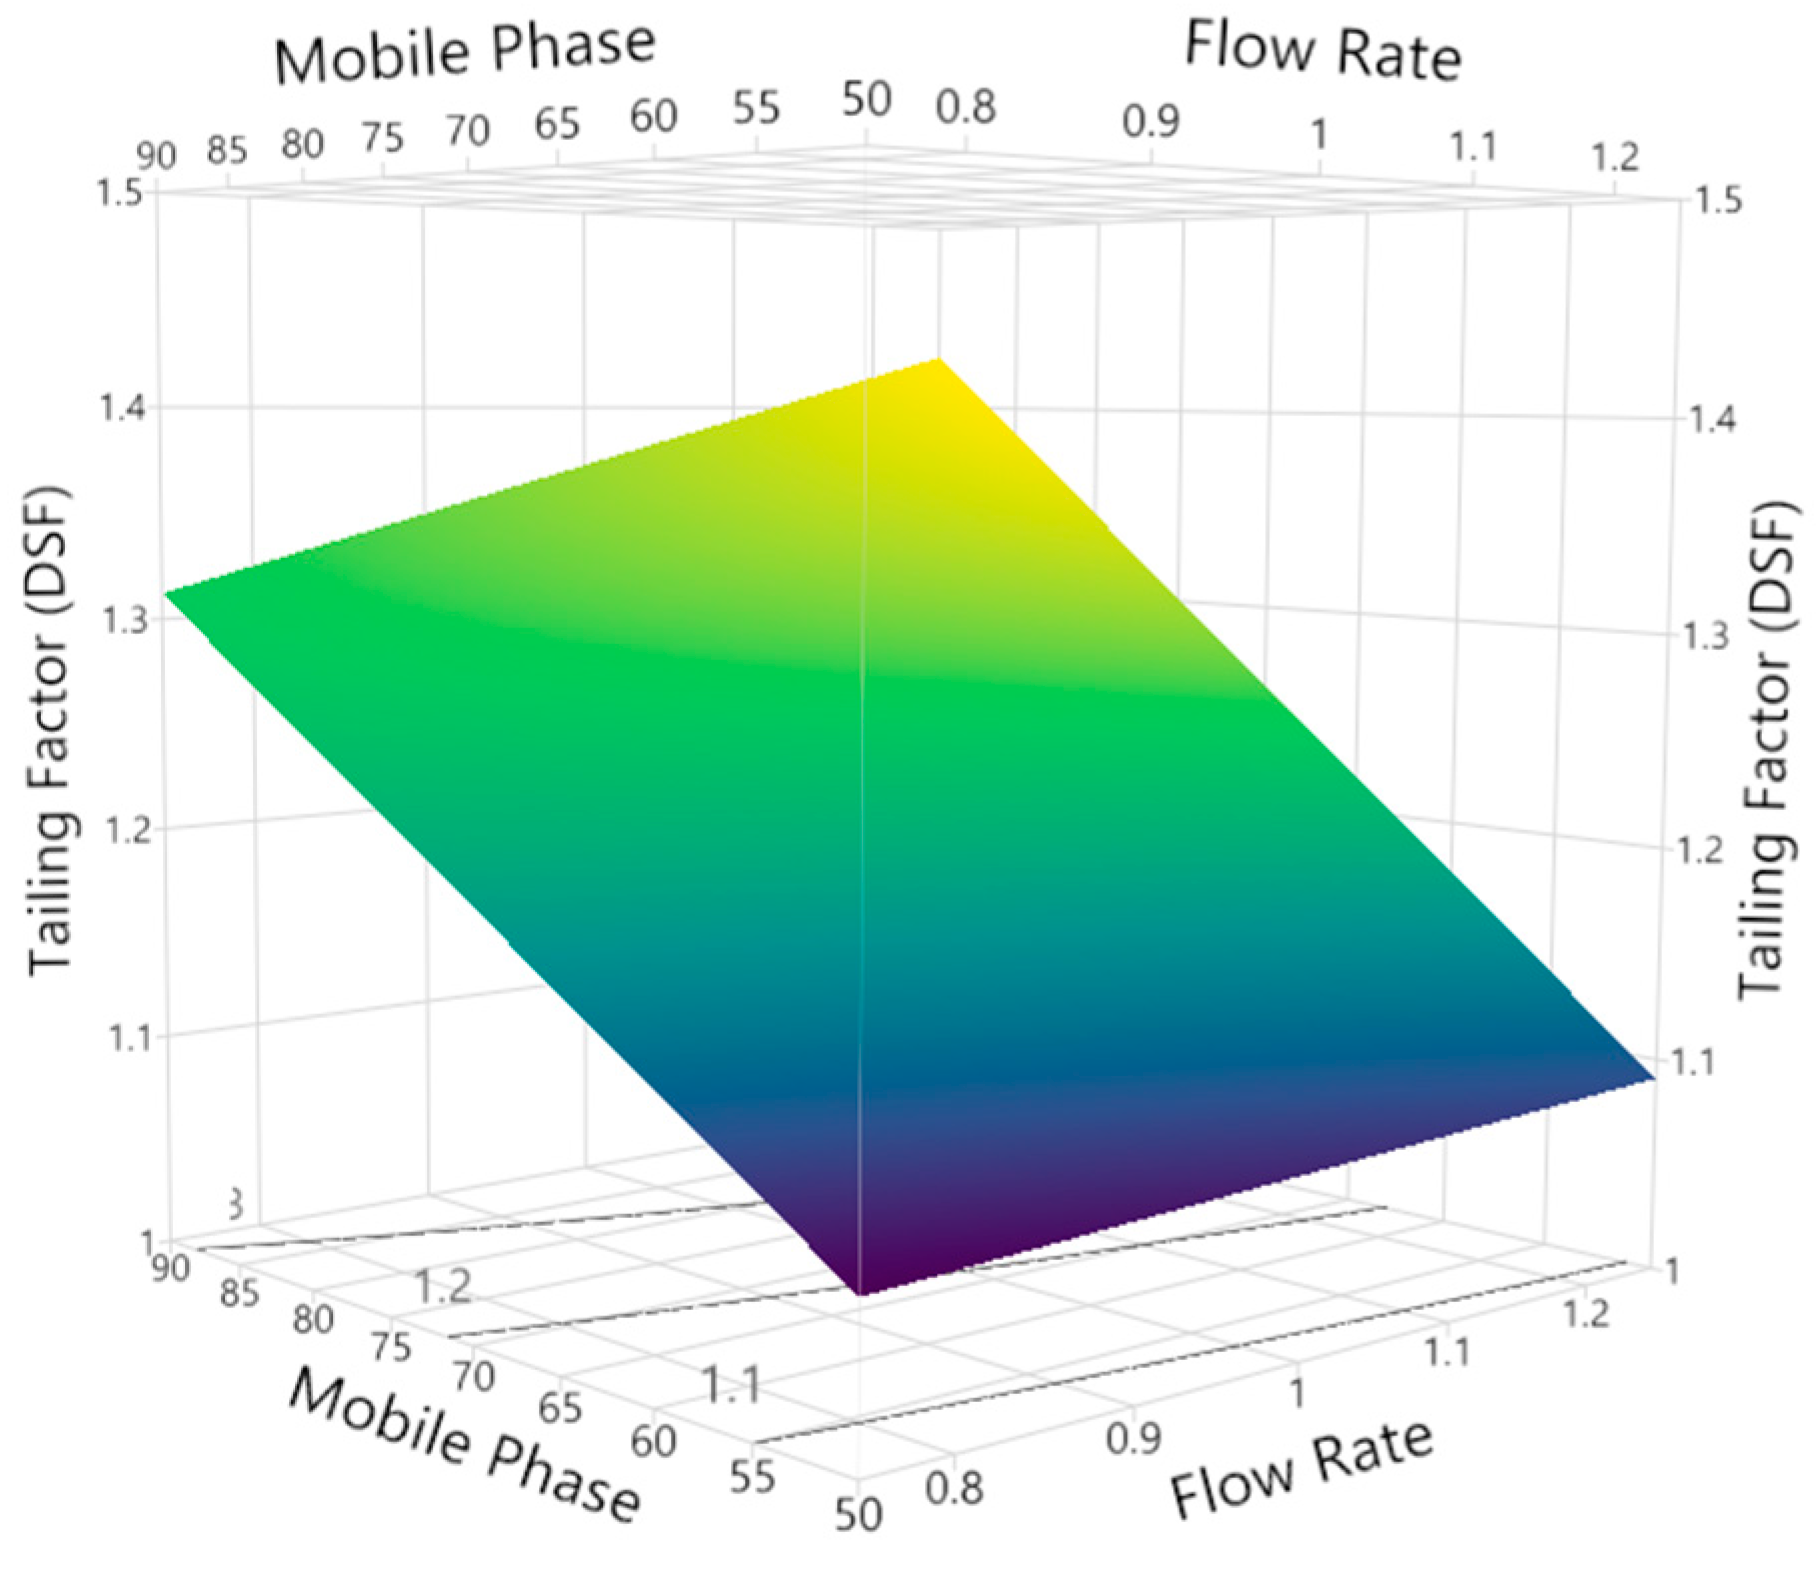
3.2.2. Tailing Factor

Chromatographic peaks are ideally represented by Gaussian curves. However, in practice, they are usually asymmetrical due to the interaction of the analytes and the stationary phase. Thus, Tf is a measure of peak symmetry [28]. According to official guidelines, and to reduce peak integration variability, Tf < 2.0. For each analyte, Tf can be determined by
Tf DSF = 1.225 + 0.027 X1 + 0.108 X2 + 0.014 X1X2, R2 = 0.996, R2adj = 0.995
Tf Cu(DDC)2 = 1.188 − 0.127 X2, R2 = 0.793, R2adj = 0.780
The low magnitude of the coefficients (β1, β2, and β12) of Equations (7) and (8) suggests a minor impact of flow rate (X1) and mobile phase composition (X2) on this response. In fact, for Cu(DDC)2, the flow rate (X1) did not have a statistically significant impact. Subsequently, this response is shaped by a linear function and not characterized by a surface response model. As for DSF, the model (Figure 6) shows a linear behavior. Overall, taking into consideration the β0 coefficient magnitude for both analytes, the criteria of this ATP specification are always met, regardless of the experimental conditions. This behavior is also reported for other compounds evaluated under different chromatographic methods [25].

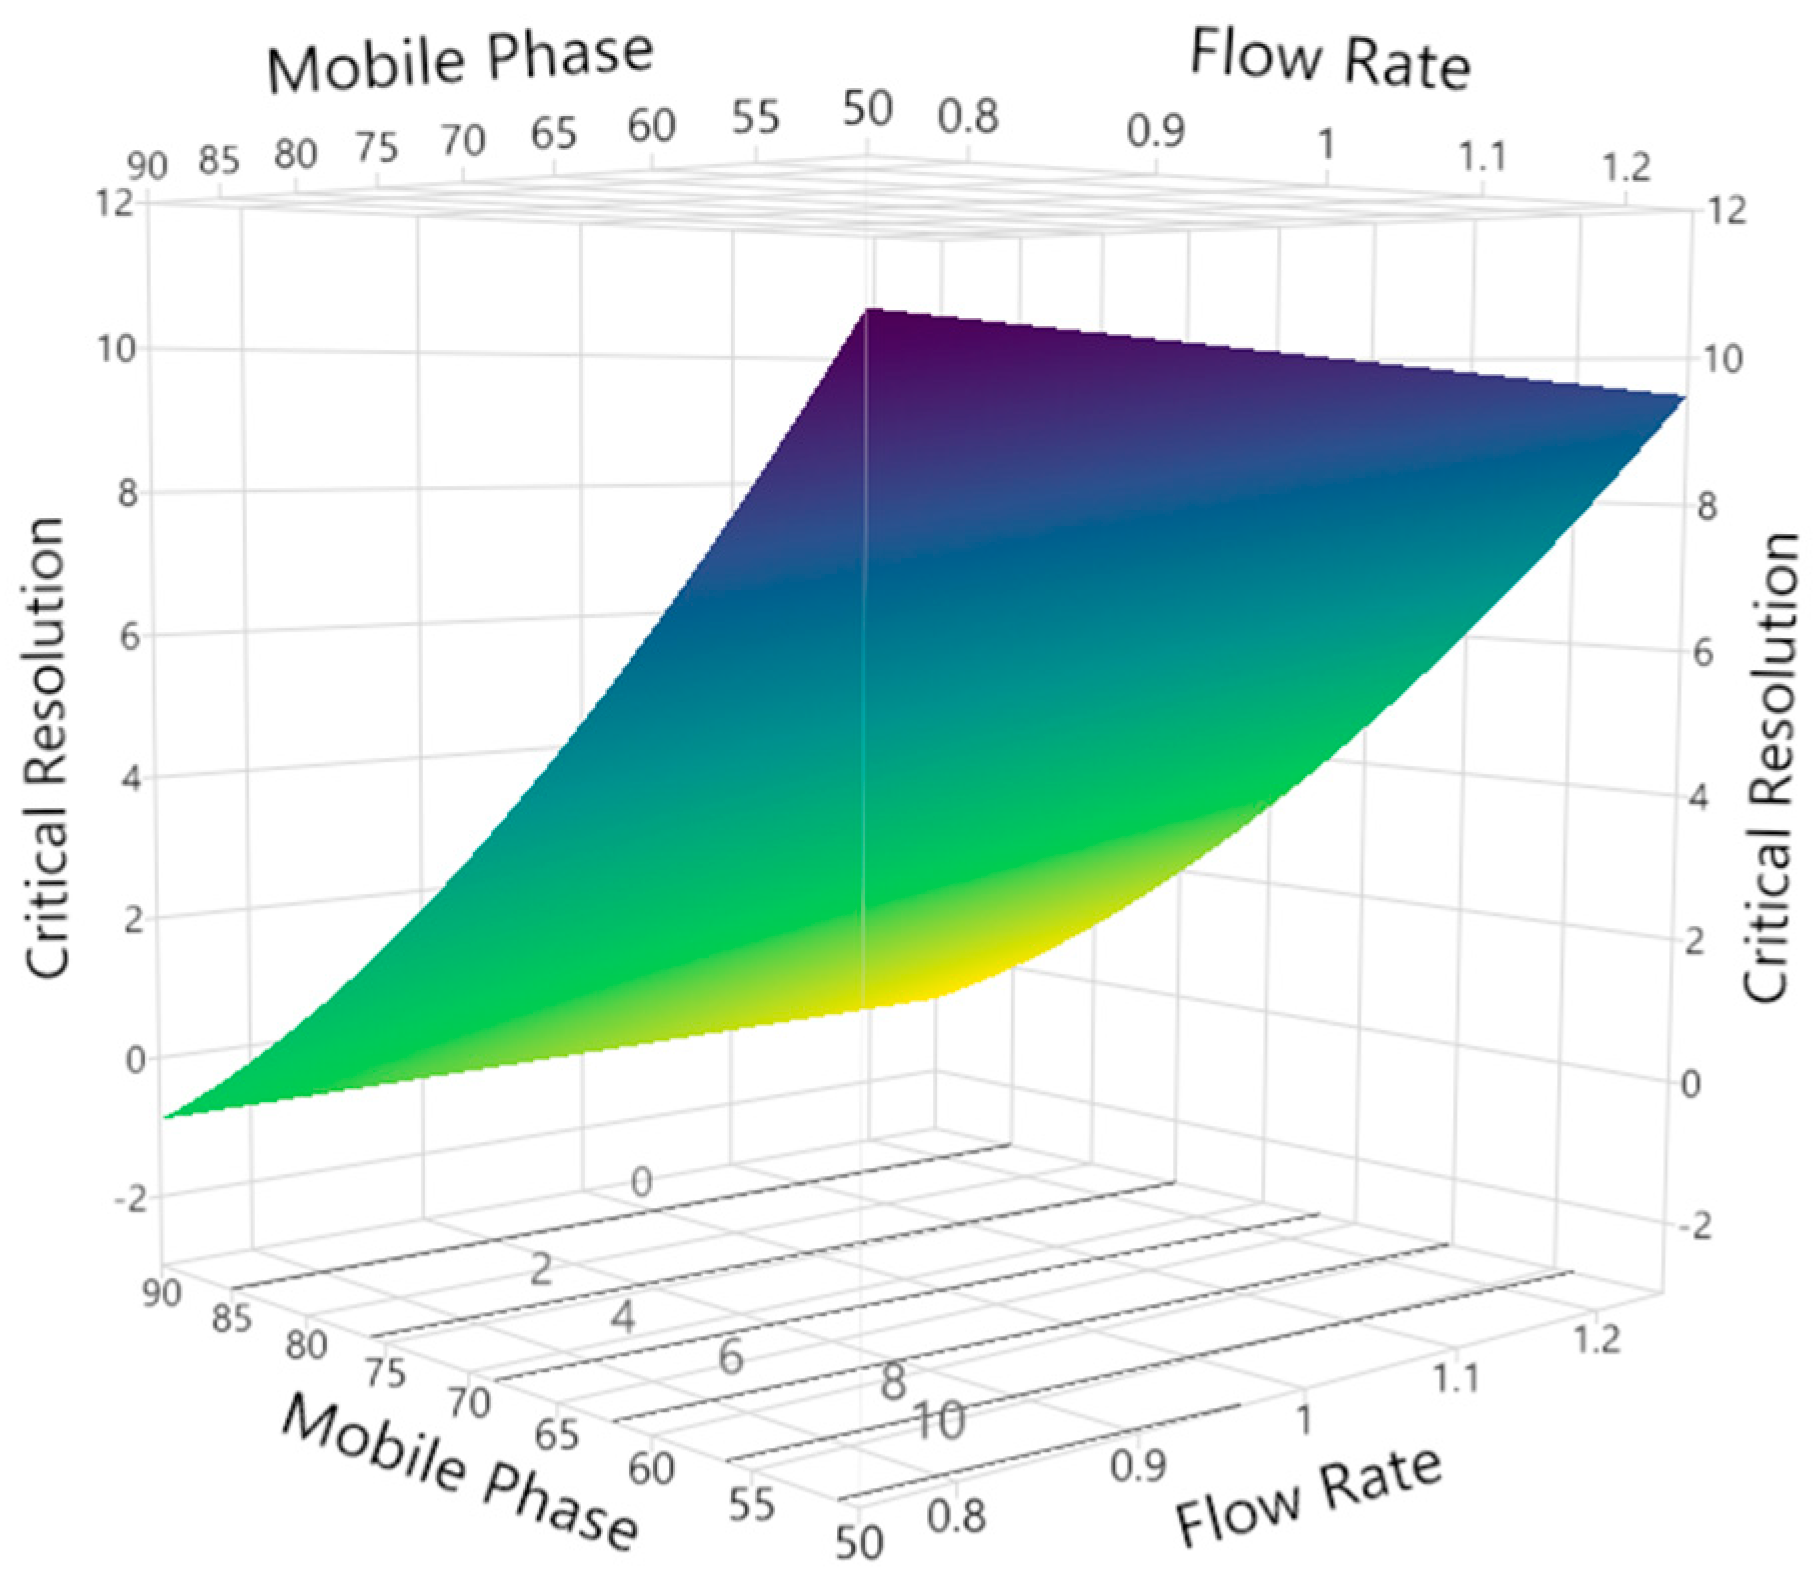
3.2.3. Critical Peak Resolution

Peak resolution assesses the degree of separation between two adjacent peaks. A resolution value of zero pinpoints a complete peak co-elution, whereas a resolution value of 1.5 is the minimum for baseline separation [28]. As per FDA recommendations, Res > 2.0. The selection of this variable arises from the visual inspection of chromatograms at 217 nm which indicates critical peak proximity between DSF and its impurities, that can be determined using:
Res DSF = 3.367 − 0.15 X1 − 4.033 X2 + 0.15 X1X2 + 0.667 X222, R2 = 0.999, R2adj = 0.999
According to the coefficients of Equation (9), this CAA is mainly governed by the mobile phase composition (X2). As expected, an increase in the % of ACN strongly reduces peak Res due to the lower interaction between the analytes and the stationary phase, promoted by the stronger nonpolar conditions of the mobile phase. The remaining terms are not relevant due to their reduced magnitude. Nonetheless, the model shows some degree of curvature (Figure 7). This trend is also observed for other compounds evaluated under different chromatographic conditions [25].

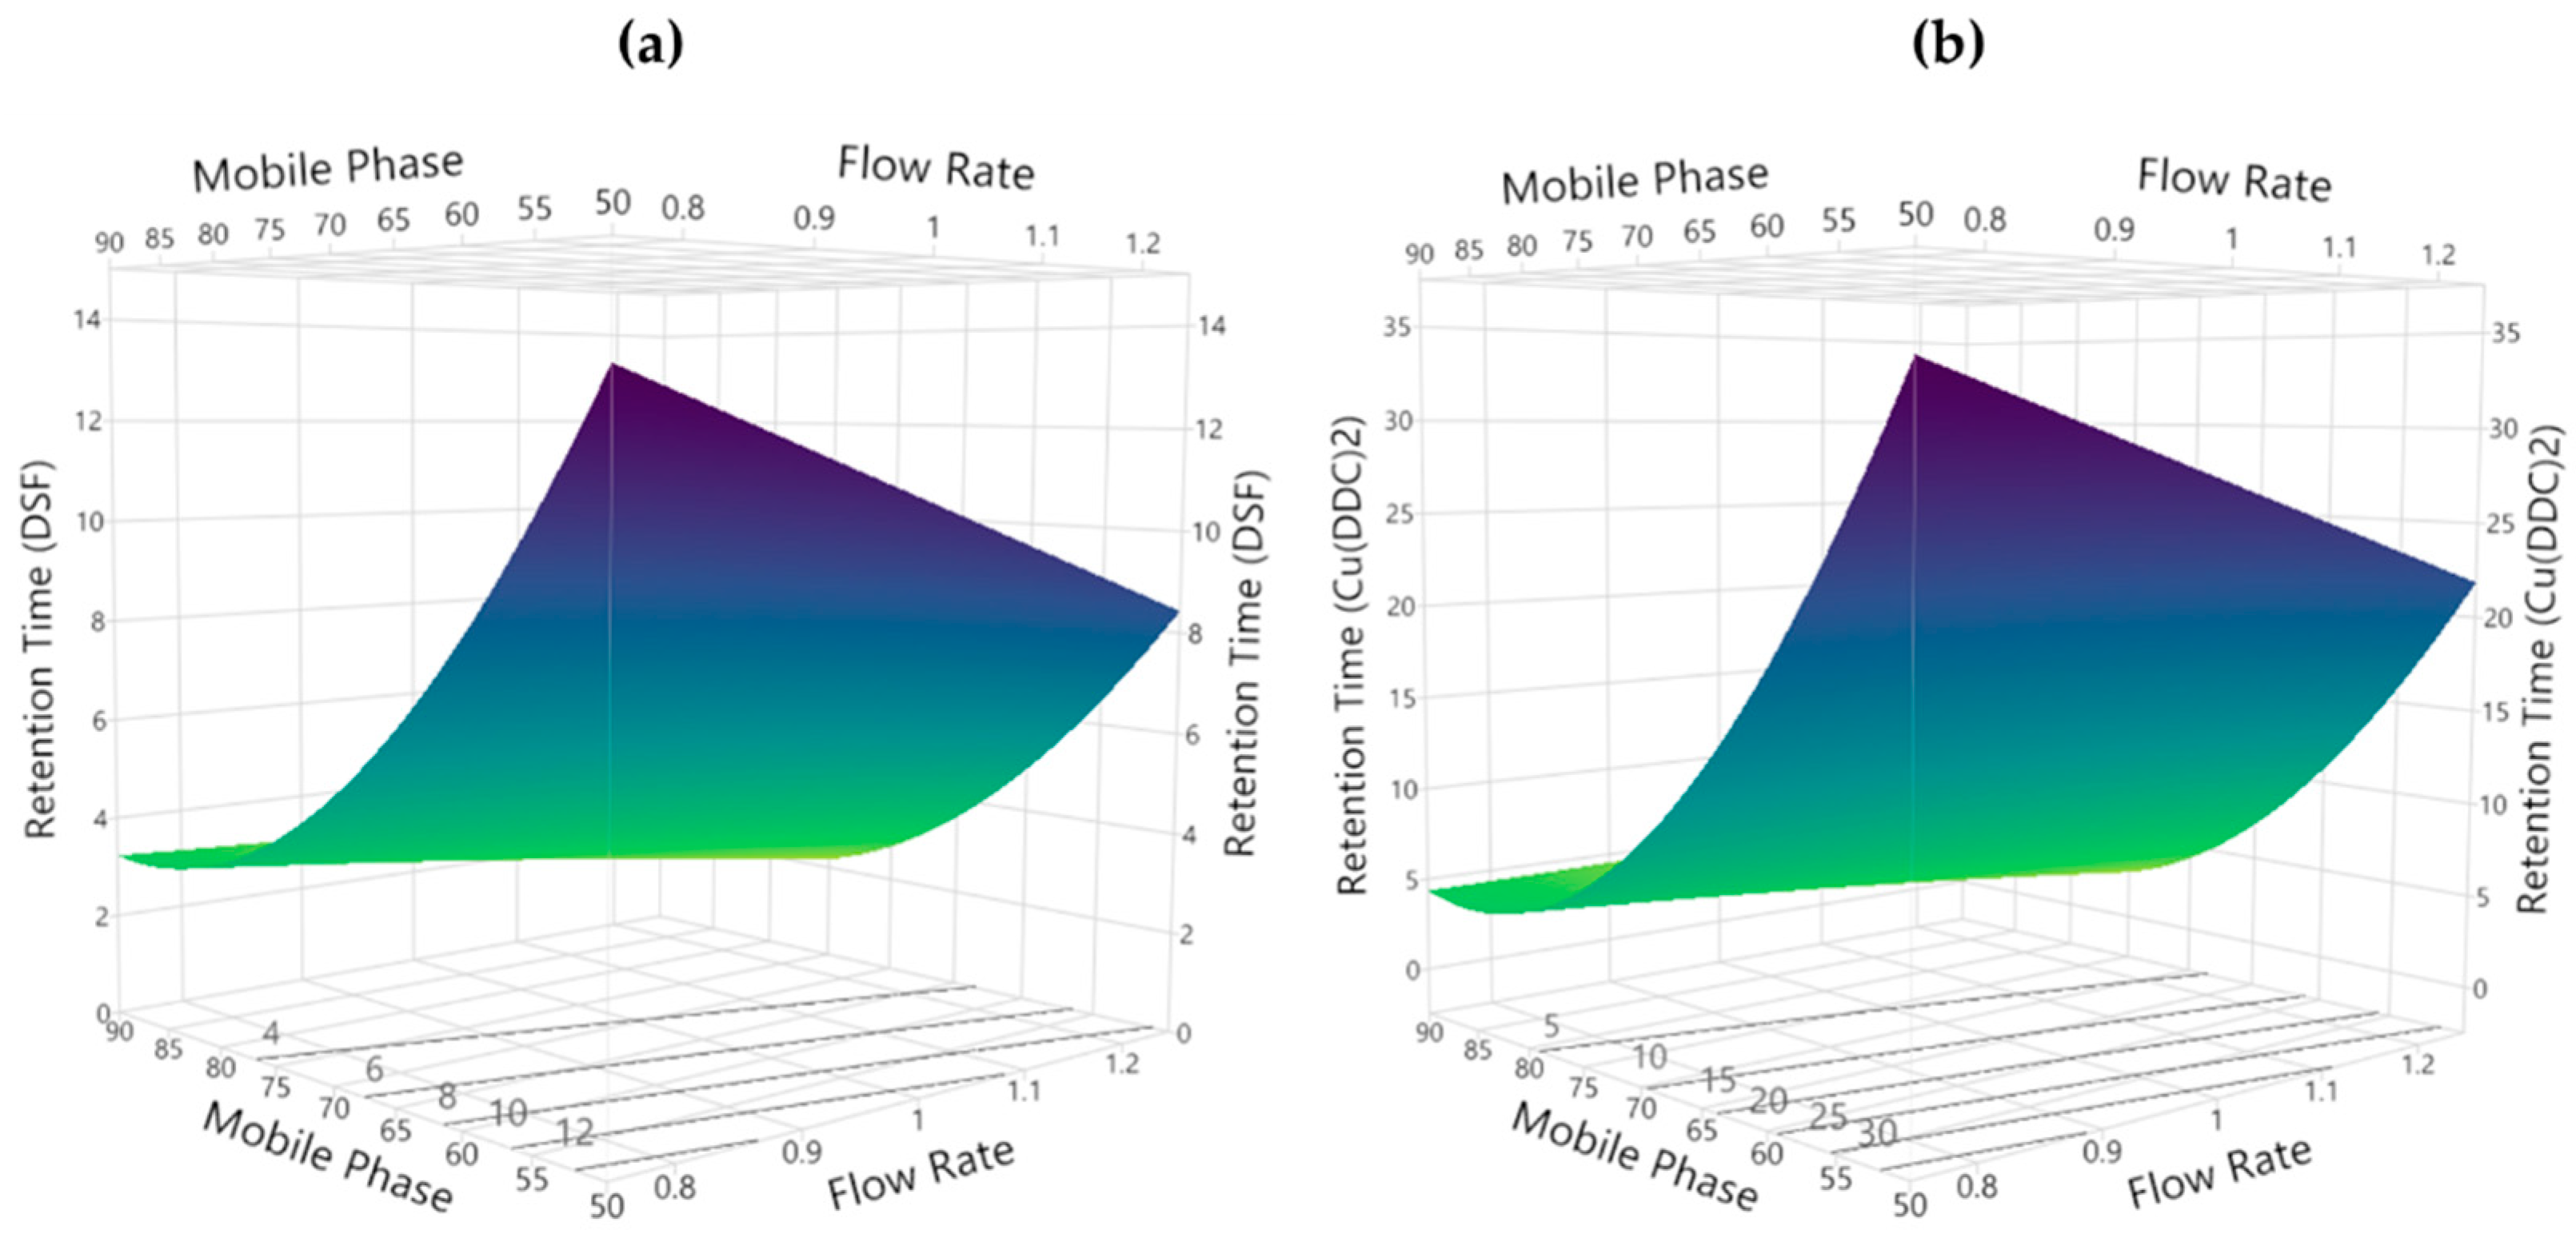
3.2.4. Retention Time

Retention time is a measure of the time each analyte spends in the stationary and in the mobile phase [28]. Generally, it should be as low as possible in order to reduce the analysis time and costs of organic solvents. For each analyte, Rt can be determined by
Rt DSF = 4.028 − 1.036 X1 − 2.92 X2 + 0.61 X1X2 + 1.585 X222, R2 = 0.996, R2adj = 0.995
Rt Cu(DDC)2 = 6.95 − 2.127 X1 − 8.557 X2 + 1.763 X1X2 + 5.115 X222, R2 = 0.996, R2adj = 0.995
According to Equations (10) and (11), both critical method parameters have a negative impact on this parameter, as indicated by the negative β1 and β2 coefficients. Although flow rate (X1) has a strong influence in reducing drug Rt, an increase in the organic phase (X2) is the main factor that reduces the interaction of the analytes with the stationary phase, as indicated by the highest magnitude of β2 coefficients. In addition, according to the β22 coefficient, the surface response models display curvature (Figure 8). This behavior is also seen for other compounds and chromatographic methods [25].

3.2.5. Capacity Factor

Although similar to the drug Rt, the capacity factor, or retention factor, represents the degree of retention of the analyte in the column and takes into consideration the void time (i.e., the retention of an unretained analyte) [28]. Usually, when using isocratic conditions, 1 < k’ < 20, as higher k’ values lead to extensive peak broadening. This parameter becomes particularly relevant when using increased proportions of organic solvents, as they reduce the retention of the analytes. As per FDA, k’ > 2, and can be determined using:
k’DSF = 2.817 − 2.762 X2 + 1.416 X222, R2 = 0.996, R2adj = 0.996
k’Cu(DDC)2 = 5.463 − 8.067 X2 + 4.655 X222, R2 = 0.997, R2adj = 0.996
According to Equations (12) and (13), flow rate (X1) does not have an impact on the capacity factor. In fact, k’ is independent of flow rate and column length [28]. Therefore, this parameter is explained by a simpler polynomial function and not characterized by a surface response model. The negative sign of the β2 coefficient indicates that an increase in the organic phase (X2) strongly reduces the capacity factor, thus eluting the analytes in less time.

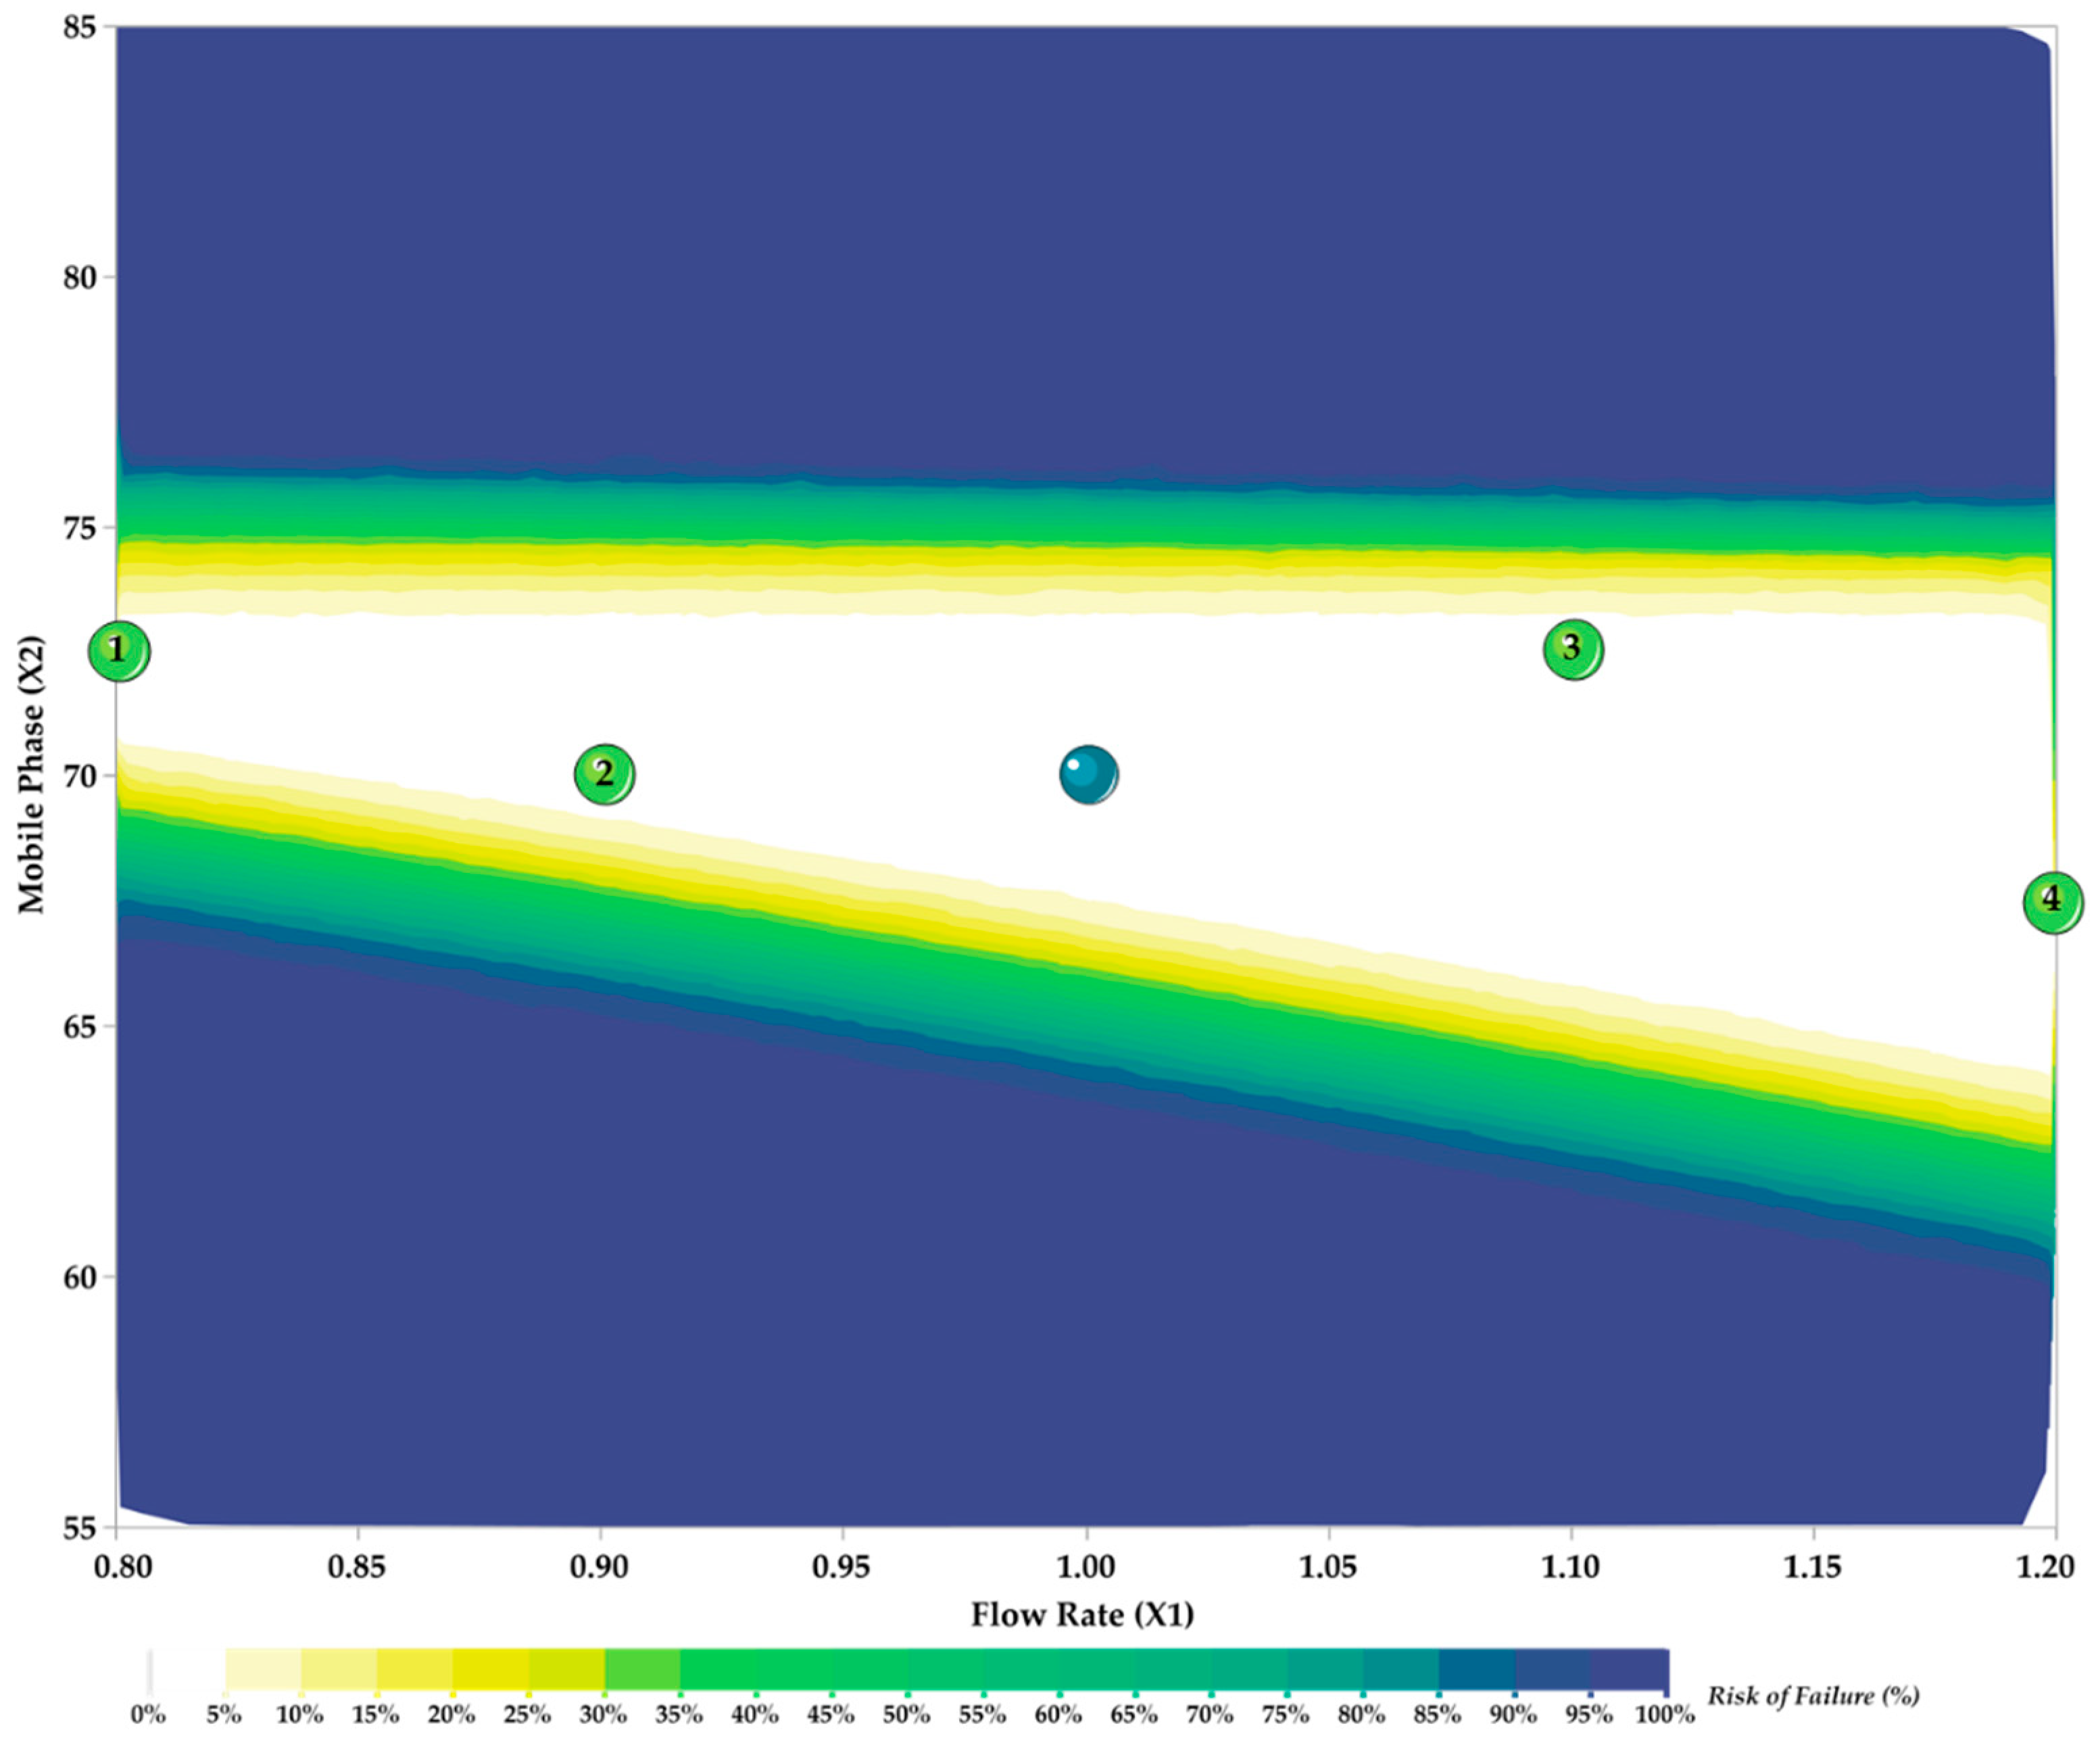
3.3. Method Development and Optimization: MODR

Aiming at obtaining a validated method, as per ICH and FDA guidelines, i.e., a chromatographic method that complies with the established requirement for the CAAs, it is necessary to determine the method operable design region (MODR). Every condition is associated with a certain level of failure risk, expressed as the probability of failure (%), calculated using Monte Carlo simulations. This risk arises not only from the method parameters and their variation but also from unexpected and random sources. As such, a random standard deviation of 0.05 and 0.5 for X1 and X2, respectively, was assumed. The identification of this region is depicted in white, in Figure 9, based on the criteria defined in Table 5. Each point of the white region of the MODR represents a possible chromatographic method (in terms of flow rate (X1) and mobile phase composition (X2)), compliant with the ATP (Table 1), and with a risk of failure below 5%.
In order to validate the predictability of the operable region, four random conditions (Figure 9, green dots) were experimentally evaluated and compared to the predicted CAA responses by the models (Table 5). For these levels, the MODR also complies with the ATP (Table 1), supporting the good predictability of the models. For convenience, the chosen method parameters to proceed for formal validation were set as being 70:30 (v/v) ACN:H2O, at a flow rate of 1.0 mL/min (Figure 9, blue dot). These conditions guarantee the suitability of the chromatographic method and are potentially associated with a better ruggedness, i.e., present a lower probability of failure when used at another laboratory. Moreover, regions close to the limits of X1 or X2 should be avoided, as they are on the edge of the knowledge space.

3.4. Method Validation

3.4.1. System Suitability

System suitability testing aims at assessing if the chromatogram and the HPLC equipment are able to produce accurate and precise results [21]. For that, several parameters, including the previously identified CAAs, are evaluated. The precision of the retention times and peak areas were compliant for both analytes, according to the RSD ≤ 2.0% for the three quality control standards, thus supporting the system’s ability for their detection and quantification (Table 6). Furthermore, the efficiency of the column is also evidenced for all parameters. According to the ATP of the established AQbD strategy (Table 1), compliance with these CAAs was a pre-validation requisite.

3.4.2. Detection and Quantification Limits

The lowest concentration at which each analyte can be detected or identified with good accuracy and precision was determined according to the standard deviation of the response and slope of the linear regression of the calibration curve. The estimated LOD for DSF and Cu(DDC)2 were 0.034 and 0.028 µg/mL, respectively. Additionally, the LOQ for DSF and Cu(DDC)2 were 0.10 and 0.09 µg/mL, respectively.

3.4.3. Linearity

Linearity of the calibration standards was observed over the range of 0.1 to 100 µg/mL, according to the regression equations and correlation coefficients obtained through the least squares method. The mean equations for both analytes are presented below (Equations (14) and (15), n = 6). A 1/x2 weighting factor was employed due to the heteroscedasticity of the samples.
[DSF] = 41,488 + 124 X, R2 = 0.9999
[Cu(DDC)2] = 50,047 − 1480 X, R2 = 0.9997
According to the R2 values over 0.999, compliant with FDA recommendations and the good precision amongst the curve slopes and intercepts (RSD ≤ 2.0%), the chromatographic method is considered to be linear over the studied range.

3.4.4. Accuracy and Precision

The evaluation of the accuracy and precision of the method is a further guarantee of the quality of the calibration curves and should be observed at intra- and interday levels. According to Table 7, both parameters are verified since the deviations to nominal concentration and among independent samples did not exceed 15. As such, these results corroborate the accuracy, reliability, and reproducibility of the method.

3.4.5. Robustness and Ruggedness

The assessment of the robustness and ruggedness of chromatographic methods aims at ensuring the reliability of the results. To study the method’s robustness, the ICH suggests the evaluation of small method variations, such as modifications to the mobile phase composition, pH, different columns, oven temperature, and flow rate [19,29]. According to the risk assessment (Figure 4 and Table 3), mobile phase composition and flow rate were identified as critical process parameters due to their potential high criticality. The systematic study, using Design of Experiments (Section 2.5.3) and the wide MODR region, support the robustness of the method. In order to study the method’s ruggedness, the FDA takes into consideration the expected variations occurring between different laboratories. Consequently, the optimized method was evaluated in a different apparatus and column. Despite the expected minor variations, the different conditions met the CAA criteria for system suitability, including a good critical peak resolution, capacity factor, theoretical plate number, and tailing factor (Table 8). Additionally, the method complies with the requirements for repeatability (intraday precision) and accuracy (Table 9).

3.4.6. Specificity

The specificity of the method is a parameter that ensures the correct determination of the analytes in the presence of possible interferents. For that, the supernatant of blank nanoparticles was analyzed using the optimized chromatographic method conditions and compared to a representative chromatogram of a 0.2 µg/mL quality control solution (Figure 10a). No peaks were observed at the retention times of the analytes, indicating the method can be regarded as specific.

3.4.7. Stability

Stability testing, as part of the chromatographic method validation, aims at ensuring there is no degradation or adhesion to glassware during sampling procedures and laboratory analysis. As such, stability studies were performed at two levels: stock solution (freeze-thaw and intermediate-term stability) and quality control solutions testing (autosampler and 72 h stability, at 4 °C). According to the results (Table 10), both analytes met the established accuracy and precision criteria in these conditions. Consequently, the quality of the data is guaranteed.

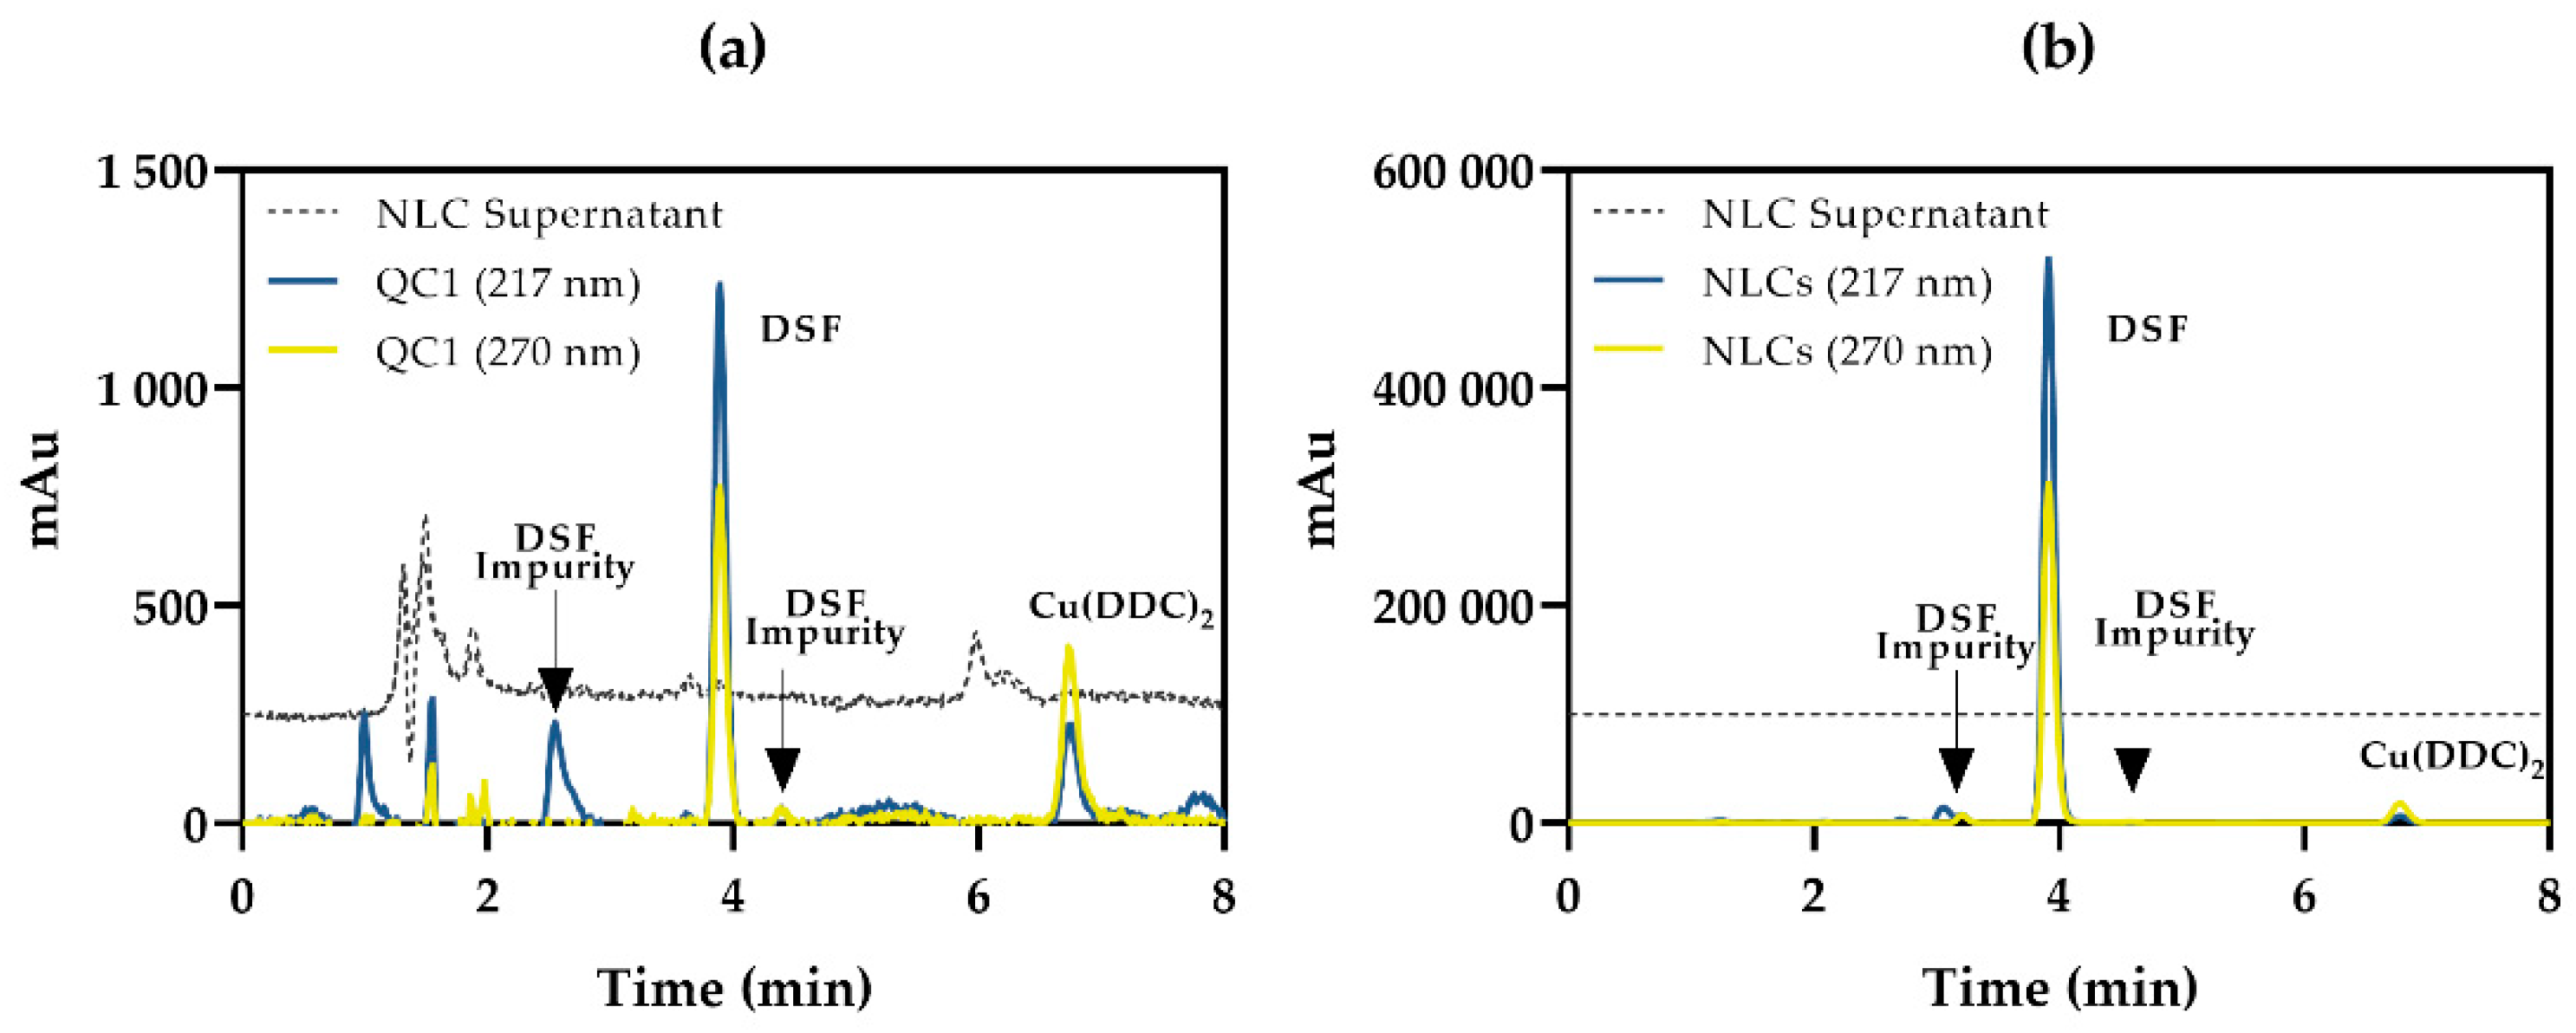
3.5. Method Applicability: Nanostructured Lipid Carriers

The optimized method was applied to determine the content of DSF and Cu(DDC)2 in lipid nanoparticles, with a mean particle size of 140 ± 4 nm, a polydispersity index of 0.131, and a zeta potential of −40 mV ± 2 mV. Overall, the entrapment efficiency values of DSF and Cu(DDC)2 were found to be 99.7 ± 0.2% and ca. 100%, as no peak was identified in the aqueous phase of the NLCs corresponding to Cu(DDC)2 (Figure 10b). The determined loadings of DSF and Cu(DDC)2 were 2.10 ± 0.04% and 6.6 ± 0.2 ‰. Despite the reduced DL of Cu(DDC)2, this compound has been described as highly potent at decreasing cancer cell viability, displaying activity in nanomolar concentrations against glioblastoma, breast and lung cancer [4]. This method may also be used for other routine tests that include the use of these analytes.

4. Conclusions

An AQbD strategy was implemented for the simultaneous quantification of disulfiram and its anticancer compound, copper (II) diethyldithiocarbamate, by liquid chromatography. According to risk assessment, the method parameters with a high impact on method performance (by means of the theoretical plate number, critical resolution, retention time, tailing factor, and capacity factor) were evaluated. Under the umbrella of AQbD, the application of a face-centered central composite design allowed the characterization of these parameters. As such, the multidimensional region that includes the method parameters that best describe the suitability of the chromatographic method (with a negligible risk of failure) was defined using Monte Carlo simulations and experimentally validated. The ideal conditions (a mobile phase containing acetonitrile:water (70:30, v/v) at 1 mL/min) were validated according to regulatory guidelines in terms of linearity, accuracy, precision, specificity, robustness, and stability. In addition, the method was evaluated for ruggedness, using different HPLC equipment and column, meeting the criteria for system suitability, intraday accuracy, and precision (repeatability). Overall, the validation of the method supports the implementation of AQbD in defining chromatographic conditions for research or industrial applications, exemplified here with the quantification of the analytes in nanostructured lipid carriers.

Supplementary Materials

The following are available online at https://www.mdpi.com/article/10.3390/chemosensors9070172/s1, Figure S1. 1H NMR spectra of (a) sodium diethyldithiocarbamate trihydrate in D2O, (b) disulfiram in CDCl3, and (c) copper (II) diethyldithiocarbamate in DMSO. Figure S2. 13C NMR spectra of (a) sodium diethyldithiocarbamate trihydrate in D2O, (b) disulfiram in CDCl3, and (c) copper (II) diethyldithiocarbamate in DMSO. Table S1. ANOVA parameters for the characterization of the model fitting per CAA.

Author Contributions

Conceptualization, J.B. and C.V.; methodology, J.B. and C.V.; software, J.B.; validation, J.B and C.V.; formal analysis, J.B., A.P. and C.V.; investigation, J.B.; data curation, J.B.; writing—original draft preparation, J.B.; writing—review and editing, M.L.R., A.F., R.V. and C.V.; visualization, J.B.; supervision, A.F., R.V. and C.V.; funding acquisition, A.P. and C.V. All authors have read and agreed to the published version of the manuscript.

Funding

This research was funded by the Portuguese Foundation for Science and Technology (FCT), European Union, QREN, FEDER, COMPETE and PIDDAC for funding the iBiMED (UIDB/04501/2020, POCI-01-0145-FEDER-007628), Unidade de Investigação Cardiovascular (UID/IC/00051/2019), the projects LAQV-REQUIMTE (UIDB/50006/2020), CENTRO-01-0145-FEDER-03075 and the Coimbra Chemistry Center, CQC (UID/QUI/00313/2020). Rui Vitorino and João Basso also acknowledge FCT for the individual fellowship grant (IF/00286/2015) and PhD research grant (SFRH/BD/149138/2019), respectively. NMR data were collected at the UC-NMR facility, which is supported in part by FEDER—European Regional Development Fund through the COMPETE Programme (Operational Programme for Competitiveness) and by National Funds through FCT grants REEQ/481/QUI/2006, RECI/QEQ-QFI/0168/2012, CENTRO-07-CT62-FEDER-002012, and Rede Nacional de Ressonância Magnética Nuclear (RNRMN).

Institutional Review Board Statement

Not applicable.

Informed Consent Statement

Not applicable.

Data Availability Statement

All data generated and analyzed are included in the published article, supplementary material, and upon reasonable request to the corresponding author, C.V.

Conflicts of Interest

The authors declare no conflict of interest.

Abbreviations

ACN—Acetonitrile; AQbD—Analytical Quality by Design; ATP—Analytical Target Profile; BBD—Box-Behnken Designs; CAAs—Critical Analytical Attributes; CCD—Central composite designs; CMPs—Critical Method Parameters; Cu(DDC)2—Copper (II) Diethyldithiocarbamate; DoE—Design of Experiments; DSF—Disulfiram; FcCCD—Face-Centered Central Composite Design; FFD—Full Factorial Design; FMEA—Failure Mode and Effect Analysis; FMECA—Failure Mode, Effects and Criticality Analysis (FMECA); FrFD—Fractional Factorial Designs; k’—Capacity Factor; LOD—Limit of Detection; LOQ—Limit of Quantification; MODR—Method Operable Design Region; N—Number of Theoretical Plates; NLCs—Nanostructured Lipid Carriers; PBD—Placket-Burman Design; QbD—Quality by Design; Res—Critical Peak Resolution; RPN—Risk Priority Number; Rt—Retention Time; Tf—Tailing Factor

References

  1. Mihic, S.J.; Koob, G.F.; Mayfield, J.; Harris, R.A. Chapter 23: Ethanol. In Goodman & Gilman’s: The Pharmacological Basis of Therapeutics, 13 ed.; Brunton, L.L., Hilal-Dandan, R., Knollmann, B.C., Eds.; McGraw-Hill Education: New York, NY, USA, 2018. [Google Scholar]
  2. Basso, J.; Mendes, M.; Fortuna, A.; Vitorino, R.; Sousa, J.; Pais, A.; Vitorino, C. Nanotechnological approaches in cancer: The role of celecoxib and disulfiram. In Drug Repurposing in Cancer Therapy; Elsevier: Amsterdam, The Netherlands, 2020; pp. 353–393. [Google Scholar] [CrossRef]
  3. Cen, D.; Brayton, D.; Shahandeh, B.; Meyskens, F.L.; Farmer, P.J. Disulfiram Facilitates Intracellular Cu Uptake and Induces Apoptosis in Human Melanoma Cells. J. Med. Chem. 2004, 47, 6914–6920. [Google Scholar] [CrossRef] [PubMed] [Green Version]
  4. Wehbe, M.; Anantha, M.; Backstrom, I.; Leung, A.; Chen, K.; Malhotra, A.; Edwards, K.; Bally, M.B. Nanoscale reaction vessels designed for synthesis of copper-drug complexes suitable for preclinical development. PLoS ONE 2016, 11, e0153416. [Google Scholar] [CrossRef] [PubMed] [Green Version]
  5. Said Suliman, A.; Khoder, M.; Tolaymat, I.; Webster, M.; Alany, R.G.; Wang, W.; Elhissi, A.; Najlah, M. Cyclodextrin Diethyldithiocarbamate Copper II Inclusion Complexes: A Promising Chemotherapeutic Delivery System against Chemoresistant Triple Negative Breast Cancer Cell Lines. Pharmaceutics 2021, 13, 84. [Google Scholar] [CrossRef] [PubMed]
  6. Irth, H.; De Jong, G.; Brinkman, U.T.; Frei, R. Determination of disulfiram and two of its metabolites in urine by reversed-phase liquid chromatography and spectrophotometric detection after post-column complexation. J. Chromatogr. B 1988, 424, 95–102. [Google Scholar] [CrossRef]
  7. Houson, I. Process Understanding: For Scale-up and Manufacture of Active Ingredients; John Wiley & Sons: Hoboken, NJ, USA, 2011. [Google Scholar]
  8. Tome, T.; Zígart, N.; Cásar, Z.; Obreza, A. Development and optimization of liquid chromatography analytical methods by using AQbD principles: Overview and recent advances. Org. Process Res. Dev. 2019, 23, 1784–1802. [Google Scholar] [CrossRef] [Green Version]
  9. Rozet, E.; Ziemons, E.; Marini, R.; Boulanger, B.; Hubert, P. Quality by design compliant analytical method validation. Anal. Chem 2012, 84, 106–112. [Google Scholar] [CrossRef] [PubMed]
  10. International Conference on Harmonization. Quality Risk Management Q9; ICH: London, UK, 2005; pp. 1–23. [Google Scholar]
  11. Sahu, P.K.; Ramisetti, N.R.; Cecchi, T.; Swain, S.; Patro, C.S.; Panda, J. An overview of experimental designs in HPLC method development and validation. J. Pharm. Biomed. Anal. 2018, 147, 590–611. [Google Scholar] [CrossRef] [PubMed]
  12. International Conference on Harmonization. Pharmaceutical Development Q8 R2; ICH: London, UK, 2009; pp. 1–28. [Google Scholar]
  13. Rozet, E.; Lebrun, P.; Hubert, P.; Debrus, B.; Boulanger, B. Design spaces for analytical methods. Trends Analyt Chem 2013, 42, 157–167. [Google Scholar] [CrossRef]
  14. Peraman, R.; Bhadraya, K.; Padmanabha Reddy, Y. Analytical quality by design: A tool for regulatory flexibility and robust analytics. Int. J. Anal. Chem. 2015, 2015. [Google Scholar] [CrossRef] [PubMed]
  15. Liu, W.; Duan, H.; Wei, D.; Cui, B.; Wang, X. Stability of diethyl dithiocarbamate chelates with Cu (II), Zn (II) and Mn (II). J. Mol. Struct. 2019, 1184, 375–381. [Google Scholar] [CrossRef]
  16. Panda, S.S.; Ravi Kumar Bera, V.V.; Beg, S.; Mandal, O. Analytical quality by design (AQbD)-oriented RP-UFLC method for quantification of lansoprazole with superior method robustness. J Liq. Chrom. Relat. Tech. 2017, 40, 479–485. [Google Scholar] [CrossRef]
  17. Singh, B.; Kumar, R.; Ahuja, N. Optimizing drug delivery systems using systematic “design of experiments.” Part I: Fundamental aspects. Crit. Rev. Ther. Drug Carrier Syst. 2005, 22. [Google Scholar] [CrossRef] [PubMed]
  18. Zhang, X.; Hu, C. Application of quality by design concept to develop a dual gradient elution stability-indicating method for cloxacillin forced degradation studies using combined mixture-process variable models. J. Chromatogr. A 2017, 1514, 44–53. [Google Scholar] [CrossRef] [PubMed]
  19. International Conference on Harmonization. Validation of Analytical Procedures: Text and Methodology Q2(R1); ICH: London, UK, 2005; pp. 1–17. [Google Scholar]
  20. Food and Drug Administration. Analytical Procedures and Methods Validation for Drugs and Biologics; FDA: Silver Spring, MD, USA, 2015; pp. 1–18. [Google Scholar]
  21. Center for Drug Evaluation and Research. Validation of Chromatographic Methods; FDA: Silver Spring, MD, USA, 1994; pp. 1–33. [Google Scholar]
  22. Food and Drug Administration. Bioanalytical Method Validation; FDA: Silver Spring, MD, USA, 2018; pp. 1–44. [Google Scholar]
  23. Almeida, A.M.D.; Castel-Branco, M.M.; Falcao, A. Linear regression for calibration lines revisited: Weighting schemes for bioanalytical methods. J. Chromatogr. B 2002, 774, 215–222. [Google Scholar] [CrossRef]
  24. USP Validation of Compendial Methods. In United States Pharmacopeia and National Formulary; US Pharmcopeia: Rockville, MD, USA, 2005; pp. 2748–2751.
  25. Basso, J.; Mendes, M.; Cova, T.F.; Sousa, J.J.; Pais, A.A.; Vitorino, C. Analytical Quality by Design (AQbD) as a multiaddressable platform for co-encapsulating drug assays. Anal. Methods 2018, 10, 5659–5671. [Google Scholar] [CrossRef]
  26. Mendes, M.; Basso, J.; Silva, J.; Cova, T.; Sousa, J.; Pais, A.; Vitorino, C. Biomimeting ultra-small lipid nanoconstructs for glioblastoma treatment: A computationally guided experimental approach. Int. J. Pharm. 2020, 587, 119661. [Google Scholar] [CrossRef] [PubMed]
  27. Stamatis, D.H. Failure Mode and Effect Analysis: FMEA from Theory to Execution; American Society for Quality, Quality Press: Seattle, WA, USA, 2003. [Google Scholar]
  28. Dong, M.W. HPLC and UHPLC for Practicing Scientists; John Wiley & Sons: Hoboken, NJ, USA, 2019. [Google Scholar]
  29. González, O.; Blanco, M.E.; Iriarte, G.; Bartolomé, L.; Maguregui, M.I.; Alonso, R.M. Bioanalytical chromatographic method validation according to current regulations, with a special focus on the non-well defined parameters limit of quantification, robustness and matrix effect. J. Chromatogr. A 2014, 1353, 10–27. [Google Scholar] [CrossRef] [PubMed]
Figure 1. Synthesis of copper (II) diethyldithiocarbamate.
Chemosensors 09 00172 g001
Figure 2. Analytical Quality by Design (AQbD) Workflow.
Chemosensors 09 00172 g002
Figure 3. Face-centered central composite design (FcCCD) with a rectangular domain. Blue dots indicate the two-level factorial design, green represents the central point, and yellow points out the axial points.
Chemosensors 09 00172 g003
Figure 4. Ishikawa diagram highlighting potential parameters that influence method performance. Parameters further evaluated by FMEA are outlined in blue. QA: Quality assurance; QC: Quality control.
Chemosensors 09 00172 g004
Figure 5. Three-dimensional response surface plot for the effect of flow rate (X1) and mobile phase composition (X2) on DSF (a) and Cu(DDC)2. (b) Theoretical plates number.
Chemosensors 09 00172 g005
Figure 6. Three-dimensional response surface plot for the effect of flow rate (X1) and mobile phase composition (X2) on DSF tailing factor.
Chemosensors 09 00172 g006
Figure 7. Three-dimensional response surface plot for the effect of flow rate (X1) and mobile phase composition (X2) on critical resolution (DSF and impurity).
Chemosensors 09 00172 g007
Figure 8. Three-dimensional response surface plot for the effect of flow rate (X1) and mobile phase composition (X2) on DSF (a) and Cu(DDC)2 (b) retention time.
Chemosensors 09 00172 g008
Figure 9. Method Operating Design Region (MODR) definition for the simultaneous determination of DSF and Cu(DDC)2, according to the face-centered central composite design (FcCCD) conditions.
Chemosensors 09 00172 g009
Figure 10. Representative chromatogram of (a) QC1 (0.2 µg/mL) solution of DSF and Cu(DDC)2 (solid lines) and supernatant from blank NLCs (dashed line) and of (b) loaded (solid lines) and blank NLCs supernatant (dashed line).
Chemosensors 09 00172 g010
Table 1. Analytical Target Profile (ATP) postulated for the chromatographic analysis of DSF and Cu(DDC)2.
ATP ElementTargetJustification
AnalyteDSF, Cu(DDC)2Development of an analytical method for the estimation of the analytes in solution or co-encapsulated in nanosystems for routine and stability analysis.
SampleLiquidAnalytes must be suitably dissolved, with complete solvent miscibility.
AnalyticaltechniqueRP-HPLCHighly lipophilic analytes are better separated and eluted in RP-HPLC methods due to the increased retention with the non-polar C18 stationary phase. Apart from the increased resolution, RP-HPLC provides a fast analysis with small sample volume and organic solvent consumption.
InstrumentHPLC with a quaternary pump, autosampler, and PDA detectorA quaternary pump allows an improved mixing of the mobile phase solvents and higher resolution, whereas the PDA detector allows the detection of several compounds at their λmax, thus maximizing sensitivity (DSF, λmax = 217 nm, Cu(DDC)2, λmax = 270 nm).
MethodSpecific, accurate, precise, linear, reproducible, robust, cost-effective, and simpleThe method should comply with formal validation criteria, presenting a short run time and reduced use of organic solvents.
ApplicationAssayMethod should be able to determine DSF and Cu(DDC)2 in solution or co-encapsulated in nanosystems for routine and stability analysis.
CAAsNumber of theoretical plates, retention time, tailing factor, critical peak resolution, capacity factor Chromatographic parameters that allow a robust and reliable determination of the analytes. Should meet their formal and commonly accepted quality criteria.
CAA: Critical Analytical Attribute; PDA: Photodiode Array.
Table 2. Failure mode and effect analysis (FMEA) score criteria for establishing critical method parameters.
S and O ScoreCriteria
1Negligible risk that does not require attention
2–3Minor effect that can be easily corrected inline
4–5Moderately severe effect that requires attention
6–7Highly severe effect that requires particular attention
D ScoreCriteria
1Easily detectable, negligible risk that does not require attention
2–3Detectable, with a minor effect that can be easily corrected inline
4–5Not easily detectable, presents a moderate risk that requires immediate attention
6–7Difficult to detect, presents a severe effect that requires the utmost attention
S: Severity; O: Occurrence; D: Detectability.
Table 3. Failure mode and effect analysis (FMEA) for establishing critical method parameters (CMPs).
Failure ModeEffectSODRPNStrategy
Mobile Phase CompositionMultiple757245Evaluate through RSM
Column ageNon-selectivity63354Monitor column use
Column equilibrationExtraneous peaks33327Guarantee equilibration prior to analysis
Column typeRetention variation55250Guarantee ATP compliance
Flow RateMultiple effects656180Evaluate through RSM
Injection VolumeSensitivity42324Guarantee method compliance
Matrix effectExtraneous peaks33218Guarantee ATP compliance
Mobile Phase pHRetention variation21612Low risk, no actions taken
Oven TemperatureColumn pressure32212Low risk, no actions taken
PurgeMultiple32424Guarantee purge prior to analysis
Solvent GradeExtraneous peaks33218Guarantee ATP compliance
UV DetectionSensitivity4218Guarantee ATP compliance
S: Severity; O: Occurrence; D: Detectability; RPN: Risk Priority Number; RSM: Response Surface Methodology; ATP: Analytical Target Profile.
Table 4. Face-centered central composite design (FcCCD) matrix for the evaluation of flow rate (X1) and mobile phase composition (X2). For each condition, two calibration standard solutions were considered (1 and 100 µg/mL) in order to inspect the impact of impurities on the critical analytical attributes (CAAs).
Run CodeX1
(Flow Rate, mL/min)
X2
(Mobile Phase, % ACN)
1Factorial Design Points− −0.855
2− +0.885
3+ −1.255
4+ +1.285
5Central Point0 01.070
6Axial Points−α 00.870
70 −α1.055
8+α 01.270
90 +α1.085
Table 5. MODR definition criteria and experimental validation.
CAAN DSFN Cu(DDC)2Tf DSFTf Cu(DDC)2ResRt DSFRt Cu(DDC)2k’ DSFk’ Cu(DDC)2
Specification
Conditions
>2000>2000<2.0<2.0>2.0<6.0<10.0>2.0>2.0
Predicted 1791611,1731.211.212.834.527.502.404.25
2786011,2601.211.193.444.558.012.825.46
3650796941.261.212.653.124.752.404.25
4743610,9431.211.154.593.947.663.898.67
Confidence Interval (CI, 95%)1[7251, 8580][10,323, 12,023][1.21, 1.22][1.18, 1.24][2.80, 2.89][4.32, 4.72][6.92, 8.08][2.26, 2.53][3.89, 4.60]
2[7276, 8443][10,635, 11,886][1.21, 1.22][1.16, 1.22][3.41, 3.48][4.37, 4.72][7.51, 8.52][2.68, 2.95][5.10, 5.83]
3[5935, 7080][9060, 10,329][1.25, 1.26][1.18, 1.24][2.62, 2.68][2.94, 3.29][4.25, 5.24][2.26, 2.53][3.89, 4.60]
4[6797, 8075][10,073, 11,814][1.21, 1.22][1.12, 1.18][4.55, 4.62][3.74, 4.14][7.09, 8.22][3.77, 4.02][8.33, 9.00]
Experimental1805110,4401.221.222.864.457.322.354.17
2735611,7211.221.203.494.427.462.775.47
3683789961.261.192.623.245.032.364.14
4720511,5451.221.154.563.997.633.798.42
Conditions (X1, X2): 1—(0.8, 72.5); 2—(0.9, 70); 3—(1.1, 72.5); 4—(1.2, 65).
Table 6. System suitability testing, considering the reinjection of quality control samples (n = 6).
AnalyteConc. (µg/mL)Rt (min)Peak AreaNResTfk’
MeanRSD (%)MeanRSD (%)
DSF0.23.890.088334163365.991.232.80
203.90.1716,5850.0763193.351.242.66
903.890.083,673,9640.0262733.291.242.72
Cu(DDC)20.26.750.0784970.810,83812.51.175.46
206.710.081,086,1840.0310,1518.281.155.19
906.710.094,359,9380.799578.351.135.37
Acceptance Criteria-≤2.0%-≤2.0%>2000>2.0≤2.0>2.0
Table 7. Intraday and interday accuracy and precision. Results are expressed as mean ± SD.
AnalyteConc.
(µg/mL)
Intraday (n = 6)Interday (n = 18)
Measured Conc. (µg/mL)Accuracy
(%)
Precision
(%)
Measured Conc. (µg/mL)Accuracy
(%)
Precision
(%)
DSF0.20.201 ± 0.001−0.30.70.196 ± 0.0041.92.0
2020 ± 10.95.521 ± 2−7.07.3
9090.8 ± 0.5−0.90.690 ± 1−0.21.1
Cu(DDC)20.20.21 ± 0.01−2.85.30.22 ± 0.02−8.011.4
2021 ± 1−3.12.919 ± 10.95.7
9091 ± 2−1.12.87 ± 23.82.8
Table 8. System suitability testing for ruggedness evaluation, considering the reinjection of quality control samples (n = 6).
AnalyteConc. (µg/mL)Rt (min)Peak AreaNResTfk’
MeanRSD (%)MeanRSD (%)
DSF0.23.480.0686310.980414.451.182.24
203.460.06791 9790.0480834.401.152.23
903.460.043,808,9290.0478504.361.152.21
Cu(DDC)20.26.3000.0047038112,75514.871.244.84
206.2240.002948,9100.211,71110.281.034.17
906.250.013,977,4650.411,38810.181.024.75
Acceptance Criteria-≤2.0%-≤2.0%>2000>2.0≤2.0>2.0
Table 9. Intraday accuracy and precision for ruggedness evaluation. Results are expressed as mean ± SD.
AnalyteConc.
(µg/mL)
Intraday (n = 6)
Measured Conc. (µg/mL)Accuracy
(%)
Precision
(%)
DSF0.20.21 ± 0.01−7.55.3
2020 ± 2−1.67.9
9092.0 ± 0.3−2.20.3
Cu(DDC)20.20.176 ± 0.00212.21.4
2020.6 ± 0.7−3.13.5
9088 ± 32.42.9
Table 10. Stability studies of quality control solutions (n = 6) in different conditions (stock: freeze-thaw and 7 days at −20 °C; quality controls: autosampler, 24 h and 72 h at 4 °C).
AnalyteConc.
(µg/mL)
Freeze-Thaw7 Days, −20 °C
Measured Conc. (µg/mL)Accuracy
(%)
Precision
(%)
Measured Conc. (µg/mL)Accuracy
(%)
Precision
(%)
DSF0.20.196 ± 0.0072.03.70.198 ± 0.0080.93.9
2019.9 ± 0.20.20.920.0 ± 0.40.21.8
9088.3 ± 0.81.90.8±20.52.4
Cu(DDC)20.20.22 ± 0.01−7.64.60.212 ± 0.003−6.21.6
2018.5 ± 0.37.41.719.6 ± 0.52.22.7
9093 ± 2−3.72.395. ± 2−6.02.1
AnalyteConc.
(µg/mL)
Autosampler (24 h)Short term (72 h, 4 °C)
Measured Conc. (µg/mL)Accuracy
(%)
Precision
(%)
Measured Conc. (µg/mL)Accuracy
(%)
Precision
(%)
DSF0.20.197 ± 0.0061.32.80.197 ± 0.0081.44.1
2020.9 ± 0.9−4.54.223 ± 2−16.57.3
9093 ± 3−3.23.191 ± 2−1.51.7
Cu(DDC)20.20.197 ± 0.0051.62.70.19 ± 0.014.96.7
2019.0 ± 0.54.82.718.4 ± 0.77.94.0
9091 ± 2−1.62.292 ± 4−2.44.6
Publisher’s Note: MDPI stays neutral with regard to jurisdictional claims in published maps and institutional affiliations.

