Abstract
A novel pyridylhydrazone-tethered BODIPY (BODIPY-PH) was synthesized, fully characterized via nuclear magnetic resonance (NMR), Fourier transform infrared spectroscopic (FTIR), and single-crystal X-ray diffraction (SC-XRD) techniques, and developed for the selective detection of Fe3+ through fluorescent enhancement process. This derivative showed 1:1 binding with Fe3+ in an acetonitrile-water mixture (1:9 v/v) with the binding constant (K) of 5.4 × 10⁴ M−1 and the limit of detection of 0.58 µM. The Fe3+ complexation reaction has been proved to be a reversible process and could be effectively repeated up to three cycles. The electronic properties of BODIPY-PH and its Fe3+ complex modeled by the density functional theory (DFT) method suggested the presence of chelation-enhanced fluorescence (CHEF) effect in the Fe3+ binding reaction. The X-ray absorption spectroscopy (XAS) probed at Fe K-edge confirmed the complex formation between BODIPY-PH and the Fe3+ in an octahedral geometry. Finally, bioimaging against human embryonic kidney (Hek293) cell, through confocal fluorescence microscopic technique indicated that the BODIPY-PH displayed good permeability and low toxicity toward the tested cell lines and showed enhanced fluorescent signal in the cells incubated with Fe3+ proving its capability for Fe3+ analysis in cellular matrix.
1. Introduction
Iron is one of the most important transition metals due to its vital roles in oxygen metabolism and electron transfer processes in numerous biological systems [1,2,3,4]. It catalyzes oxygen-related reactions in several enzymes and involves in DNA and RNA synthesis [5,6]. However, excessive iron in live cells can induce the generation of reactive oxygen species (ROS) leading to cellular toxicity. This phenomenon has been linked to serious neurological disorders, such as Alzheimer’s, Wilson’s, and Parkinson’s disease [7,8,9]. In addition, immoderate iron uptake could cause detrimental diseases, including kidneys, pancreas, and liver failures as well as certain cancers [10,11,12,13]. Therefore, the development of efficient sensors for iron detections in clinical, environmental, and industrial samples is highly needed for safety issues.
Nowadays, standard methods for ferric ion (Fe3+) detection rely on sophisticated instruments, such as atomic absorption spectrometry (AAS) [14], inductively coupled plasma mass spectroscopy (ICP-MS) [15], and inductively coupled plasma-atomic emission spectrometry (ICP-AES) [16]. These techniques are expensive, time-consuming, and not suitable for both on-site and cellular analysis. On the other hand, fluorescence technique cooperating with appropriate molecular sensors or carbon dots is a simple and cost-effective detection method and it can be applicable for the detections in field tests, cellular samples, as well as on paper substrates [17,18,19,20,21].
As part of our continuing interest in the development of boron-based imaging agents [22,23,24], we decided to synthesize a novel fluorescence compound based on boron difluoride dipyrromethene (BODIPY) and functionalize it with a pyridylhydrazone (PH) unit acting as a metal-binding site (Figure 1). Although the capability of PH unit in Fe3+ complexation has been demonstrated in pyrene-based compounds (I), the sensing properties of the PH-functionalized fluorescent probe toward ferric ions have not been systematically reported elsewhere [25]. Apart from metal binding, the PH moiety is involved in reaction-based fluorescence turn-on sensor for Au3+ ions and hypochlorous acid (HOCl) in BODIPY (II) and rhodamine (III) backbones, respectively (Figure 1) [26,27]. Herein, we reported the synthesis of pyridylhydrazone-tethered BODIPY compound (BODIPY-PH) and its systematic sensing properties toward ferric ions in aqueous solutions using UV-Vis/fluorescence spectroscopic, nuclear magnetic resonance (NMR), Fourier transform infrared spectroscopic (FTIR), and X-ray absorption spectroscopic (XAS) techniques. The latter technique was operated through high-energy synchrotron radiation which can give in-depth details on metal coordination environment. Furthermore, fluorescence imaging experiments have been carried out in living Hek293 cells to prove the biocompatibility and capability in mapping Fe3+ concentrations in the cellular matrix of the synthesized compound.
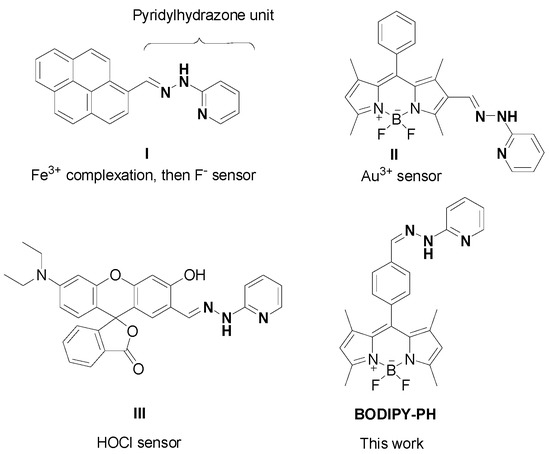
Figure 1.
Structures of pyridylhydrazone-based fluorescent sensors in the literature and the BODIPY-PH in this work.
2. Experimental Section
2.1. Materials and Instruments
The aldehyde-functionalized BODIPY (BODIPY-CHO) shown in Scheme 1 was synthesized according to the reported procedures [28,29]. 2-Hydrazinopyridine, Dess–Martin periodinane, 2,3-dichloro-5,6-dicyanoquinone (DDQ), 2,4-dimethylpyrrole, and glacial acetic acid were purchased from Tokyo Chemical Industry (TCI), Tokyo, Japan; boron trifluoride diethyl etherate purified by redistillation, and 4-(hydroxymethyl)benzaldehyde dimethyl acetal were purchased from Sigma-Aldrich, St. Louis, MO, USA; ethanol (ACS grade) was purchased from Honeywell, Charlotte, NC, USA. Standard buffer solutions pH 1 to 12 were purchased from Merck, Darmstadt, Germany (glycine/NaCl/HCl for pH 1, Citric acid/NaOH/HCl for pH 2–6, Na2HPO4/KH2PO4 for pH 7, boric acid/KCl/NaOH for pH 8–11, Na3PO4/NaOH for pH 12). All chemicals were used without further purification. Electrospray mass spectra were obtained from a Bruker micrOTOF spectrometer (Bruker, Billerica, MA, USA). NMR spectra were recorded on a Bruker Avance 500 MHz NMR spectrometer (Bruker, Billerica, MA, USA) at ambient temperature. Chemical shifts are given in ppm and are referenced to residual 1H and 13C solvent signals. Fourier transform infrared spectroscopy (FTIR) spectra were acquired from an IRTracer-100 spectrophotometer (SHIMADZU, Kyoto, Japan). The crystallographic measurement was performed using a Bruker D8 Venture diffractometer (Bruker, Billerica, MA, USA). UV-VIS absorption and fluorescence spectra were acquired from a Cary Series UV-Vis-NIR spectrophotometer (Agilent Tech, Santa Clara, CA, USA) and a Perkin Elmer LS55 fluorescence spectrometer (PerkinElmer, Waltham, MA, USA), respectively.
Scheme 1.
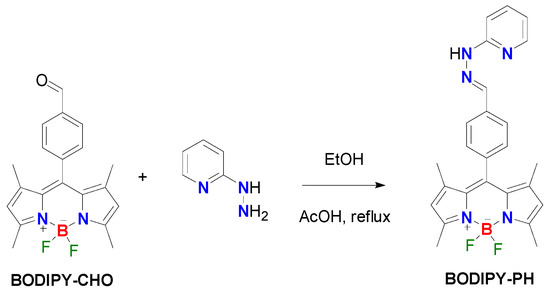
The synthesis of BODPY-PH.
2.2. Synthetic Procedures
Synthesis of (E)-5,5-difluoro-1,3,7,9-tetramethyl-10-(4-((2-(pyridin-2-yl)hydrazono)methyl) phenyl)-5H-dipyrrolo [1,2-c:2′,1′-f][1–3]diazaborinin-4-ium-5-uide (BODIPY-PH). BODIPY-CHO (438 mg, 1.24 mmol) and 2-hydrazinopyridine (160 mg, 1.49 mmol) were dissolved in ethanol (10 mL). A few drops of glacial acetic acid were then added to the mixture. The reaction mixture was refluxed at 90 °C for 4 h. After solvent evaporation, the red solid was obtained. The solid was then washed with DI water (2 × 30 mL), filtered, and dried under reduced pressure. The BODIPY-PH was obtained in 58.2% yield (75.5 mg). 1H NMR (500 MHz, DMSO) δ 10.98 (s, 1H), 8.08 (d, J = 4.2 Hz, 1H), 8.06 (s, 1H), 7.80 (d, J = 8.0 Hz, 2H), 7.61 (t, J = 7.6 Hz, 1H), 7.35 (d, J = 8.0 Hz, 2H), 7.25 (d, J = 8.4 Hz, 1H), 6.74 (t, 1H), 6.15 (s, 2H), 2.42 (s, 6H), 1.37 (s, 6H). 13C NMR (126 MHz, DMSO) δ 157.38, 155.38, 148.23, 143.14, 142.09, 138.40, 138.20, 136.71, 134.23, 131.08, 128.73, 127.06, 121.86, 115.67, 106.89. HRMS (ESI), m/z calcd for C25H24BF2N5 [M + H]+, 444.2170; found, 444.2165.
2.3. Crystallographic Measurements
A single crystal of BODPY-PH was grown by slow diffusion of pentane vapor into its solution in tetrahydrofuran for 5 days. The diffraction spots were collected on a Bruker D8 Venture diffractometer controlled by APEX3 software [30]. Absorption correction was carried out by the multi-scan method using SADABS [31]. Cell refinement and data reduction were carried out by SAINT [30]. The structure solution was performed on Olex2 software [32] using the intrinsic phasing method of SHELXT package [33]. The structure after structure solution process was then refined on F2 by a full-matrix least-squares method using the SHELXL program package [34]. All non-hydrogen atoms were treated anisotropically, while the N-bound H (N4) atom was located in a difference map, and their positions were freely refined. The C-bound H atoms were placed in idealized positions (C—H = 0.95–1.00 Å depending on hybridization) and refined as riding atoms. The solvent mask command was employed in order to remove the contribution of the electron scattering from the disordered solvents [32]. The constraint Uiso(H) = 1.2Ueq(carrier) was applied in all cases. The software package used to prepare molecular graphics and materials for publication was Mercury [35].
2.4. General Details for UV-Vis and Fluorescence Measurements
Preparation of the stock solutions: The stock solutions of BODIPY-PH compounds was prepared by dissolving 20 mg of BODIPY-PH with 50 mL of acetonitrile in standard volumetric flasks (0.9 mM). The stock solution of Fe(NO3)3.9H2O was prepared by dissolving 50 mg of Fe(NO3)3.9H2O with 25 mL water in standard volumetric flasks (5 mM). UV-Vis and fluorescence measurements were performed by taking appropriate amount of these stock solutions.
UV-Vis absorption measurement: The suitable amount of stock solution of BODIPY-PH was added to acetonitrile:water (1:9) solution (3 mL) in a 3.5 mL quartz cuvette (final concentration = 10 µM). The UV-Vis absorption spectra were recorded before and after 15 min incubation time upon addition of appropriate amounts of Fe(NO3)3.9H2O.
Fluorescence measurement: The suitable amount of stock solution of BODIPY-PH was added to acetonitrile:water (1:9) solution (3 mL) in a 3.5 mL quartz cuvette (final concentration = 10 µM). The fluorescence spectra were recorded before and after 15 min incubation time upon addition of appropriate amounts of Fe(NO3)3.9H2O, using the following parameters: excitation wavelength = 475 nm, excitation slit = 10 nm, and emission slit = 10 nm.
The solvent system, acetonitrile:water = 1:9 v/v, was used for UV-Vis and fluorescence measurements throughout the manuscript as we aim to compare the Fe3+-sensing performance of our probe with the reported BODIPY-based sensor in the literature [36] using the same solvent system.
2.5. Fluorescence Quantum Yields Calculations
Fluorescence quantum yields of the BODIPY-PH and its iron complex were measured in acetonitrile-water mixture (1:9 v/v) using fluorescein in 0.1M NaOH solution as a standard (Qstd = 0.95) and were calculated based on the Equation (1) [37]:
where Q denotes the fluorescence quantum yields, A is the peak area of emission spectra, I stands for absorption intensities at the excitation wavelength, and ŋ is the solvent reflective index.
2.6. Binding Stoichiometry and Binding Constant Determination
The binding stoichiometry of the complexes between BODIPY-PH and ferric ions (Fe3+) was determined by Job’s plot experiments [38]. The samples for Job’s plot were prepared by mixing BODIPY-PH with Fe3+ at different ratios of BODIPY-PH over total concentration of BODIPY-PH and Fe3+ ([BODIPY-PH]/[ BODIPY-PH] + [Fe3+]) in acetonitrile-water solution (1:9 v/v), while keeping the overall concentration of BODIPY-PH and Fe3+ ([BODIPY-PH] + [Fe3+]) at 50 µM. The emission intensities of the samples were recorded at 518 nm (excitation wavelength = 475 nm) and plotted against molar fractions of BODIPY-PH ([BODIPY-PH]/[ BODIPY-PH] + [Fe3+]).
The binding constant values were determined from emission intensities of BODIPY-PH (10 µM) at 518 nm upon the constant addition of Fe3+ from 1 molar equivalent (10 µM) to 16 molar equivalent (160 µM) (10 µM increment). The data were fitted to the modified Benesi-Hildebrand Equation (2) [39]:
where Fmin denotes the emission intensities of BODIPY-based dyes in the absence of ferric ions, F is the emission intensities of the dyes at intermediate Fe3+ concentrations, Fmax stands for the emission intensities of the dyes at the complete interaction with ferric ions, and K is the binding constant values.
2.7. Theoretical Calculations
To understand the geometry of BODIPY-PH and the formation of a complex system of BODIPY-PH and Fe3+, BH and HLYP function [40] was performed in implicit aqueous solution using conductor-like polarized continuum model (C-PCM) framework [41,42]. The basis set of 6-311G* was applied for all atoms, except for the Fe atom which the LANL2DZ effective core potential was applied to describe the Fe core electrons to reduce computational cost. The electronic properties based on optimized structure of this system were then explored. The frontier molecular orbitals (FMOs) and HOMO-LUMO energy diagrams of BODIPY-PH and its Fe3+ complex were also calculated. All calculations were performed by the Gaussian 16 program package [43].
2.8. X-ray Absorption Spectroscopy (XAS)
To investigate the binding and complexation between the BODIPY-PH ligand and the Fe3+ ions, the mixture in acetonitrile-water (1:9 v/v) was characterized by employing X-ray absorption spectroscopy (XAS) in both X-ray absorption near edge structure (XANES) and extended X-ray absorption fine structure (EXAFS) regions. The XANES and EXAFS at Fe K-edge were collected at Beamline 1.1W: Multiple X-ray Techniques, Synchrotron Light Research Institute (SLRI), Thailand. The XAS measurements were simultaneously conducted in both transmission and fluorescence modes at ambient atmosphere. The Fe foil was simultaneously measured together with the sample solutions and was further used as a standard reference for an in-line calibration of the energy shift during the synchrotron-operating period. The XAS data of the 100 mM solutions of Fe2+ and Fe3+ in acetonitrile-water (1:9 v/v) were also collected for comparing with the mixture of BODIPY-PH ligand and the Fe3+ ions. The XANES data were proceeded by using ATHENA software and were analyzed to examine the oxidation state and chemical speciation of the mixture between BODIPY-PH ligand and Fe3+ ions with respect to the standards. The EXAFS fitting was carried out by ARTEMIS software using the DFT-calculated structural model to clarify the structural information of the binding and complexation between BODIPY-PH ligand and Fe3+ ions.
2.9. Cell Viability and Imaging Experiments
Cell viability assay: Human embryonic kidney 293 (HEK-293) cells were cultured on a 75 cm2 culture flask in Dulbecco’s modified Eagle medium/high glucose (DMEM/HIGH GLUCOSE, GE healthcare Life Sciences HyClone Laboratories) supplemented with 10% fetal bovine serum (FBS, Gibco) and 1% penicillin streptomycin solution 100X (CORNING). All cells were cultured in a humidified incubator at 37 °C with 5% CO2. For cell viability assay, HEK-293 cells were seeded into 96-well cell culture plates at density 7 × 10³ cells/well and incubated for 24 h at 37 °C under humidified air containing 5% CO2. After that, cell culture media were replaced with BODIPY-PH in DMEM at various concentrations (0, 5, 10, 20, 30, 40, and 50 µM). After 24 h incubation, the cell viabilities were measured using MTT assay. The cells were washed with PBS (three times) before being treated with methylthiazolyldiphenyl-tetrazolium bromide (20 μL, 0.5 mg/mL, Sigma-Aldrich) for 3 h. Then, culture media were replaced with DMSO and the cell viabilities were determined through UV-vis absorption of the resulting formazan at wavelength 560 nm using microplate reader (BMG Labtech/SPECTROstar Nano).
Cell imaging experiments: For confocal imaging, HEK-293 cells were seeded at a density of 7 × 10³ cells per well in 8-well chambered coverglass with non-removable wells (Nunc Lab-Tek II) and incubated for 24 h at 37 °C under 5% CO2. After that, cell culture media were removed and the cells were pre-treated with a solution of Fe(NO3)3 ·9H2O in DMEM with 5% FBS at final concentrations of 10 or 20 μM for 30 min. Afterwards, the cells were washed three times with PBS before adding solutions of BODIPY-PH in DMEM with 5% FBS at final concentrations of 5 or 10 μM. After 30 min incubation, the cells were washed three times with PBS to remove the non-uptake dye before being stained with 1.0 μM Hoechst 33,342 (Thermo Fisher Scientific) for 10 min. All cells were brought to image under laser scanning confocal microscope (LSCM, Nikon A1Rsi). BODIPY-PH was excited by 488 nm laser and Hoechst 33,342 was excited by 405 nm laser. A 60× oil immersion objective lens was used. Image analysis was performed using ImageJ software, version 1.52v (developed by Wayne Rasband, National Institutes of Health, Bethesda, MD, USA) and Java 1.8.0_112 (64-bit) engine.
3. Results and Discussion
3.1. Synthesis, Characterizations, and Crystal Structures of BODIPY-PH
A new pyridylhydrazone-linked BODIPY probe (BODIPY-PH) has been prepared by simple condensation reaction between the known aldehyde-functionalized BODIPY (BODIPY-CHO) and 2-hydrazinopyridine as demonstrated in Scheme 1. Its 1H NMR spectra manifested the anticipated phenyl and pyridyl resonances at the aromatic region (6–8 ppm) as well as two methyl resonances of the BODIPY backbone (Figure S1, Supplementary Materials). The NH signal of this derivative was distinctly shifted downfield to around 11 ppm as seen in other pyridylhydrazone derivatives [18]. The observations of the positive molecular ions by electrospray mass spectrometry at m/z = 444.2165 served as an additional confirmation for the identity of BODIPY-PH (Figure S3).
Additionally, the structure of BODIPY-PH was confirmed by single crystal X-ray crystallographic technique. The ORTEP plot showing the molecular structure of BODIPY-PH is illustrated in Figure 2A, while the corresponding crystal data and the refinement details are tabulated in Table S1. The compound BODIPY-PH crystallized in P space group of triclinic crystal structure with Z = 2 possessing the asymmetric unit of a single BODIPY-PH molecule. From the crystal structure, the non-hydrogen atoms in the BODIPY moiety, excluding fluorine (C1–C4/C7–C11/N1–N2/B1) are arranged planarly as observed from the r.m.s. deviation of the C1–C4/C7–C11/N1–N2/B1 mean plane of 0.0377 Å. The boron atom is the most deviated atom within the BODIPY plane with the deviation of 0.074 (3) Å as it forms sp3 hybridization (other atoms possess sp2 hybridization). In addition, the non-hydrogen atoms in the benzene ring adjacent to the BODIPY moiety (C14–C19) and the benzylidenehydrazinylpyridine (C14–C25/N3–N5) group are located planarly. The corresponding r.m.s. deviations are 0.0056 Å and 0.0247 Å for the benzene and benzylidenehydrazinylpyridine groups, respectively. The mean planes of the BODIPY and benzene rings are roughly perpendicular to each other exhibiting the dihedral angle of 87.70 (9)° (Figure 2B).
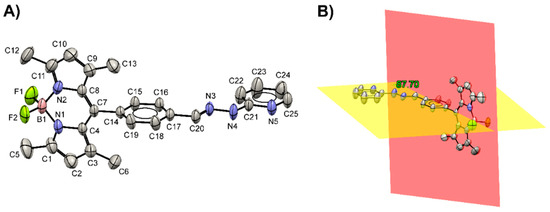
Figure 2.
(A) The ORTEP plot showing the molecular structure of BODIPY-PH together with a non-IUPAC atom-labeling scheme. Displacement ellipsoids are drawn at the 50% probability level (CCDC No. 2040756). (B) The mean planes constructed from 12 atoms (C1–C4/C7–C11/N1–N2/B1; red plane) and 6 atoms (C14–C19; yellow plane) are roughly perpendicular to each other.
The intermolecular interactions within the crystals are displayed in Figure 3 and listed in Table S2. The N—H⋯N hydrogen bond is observed in the crystal structure of BODIPY-PH. The freely refined N—H bond distance is 0.89(2) Å, while the N4—H4⋯N5 bond angle is 177 (2)°. The N—H⋯N hydrogen bonds (red dash lines in Figure 3) linked two molecules related by an inversion center to a R22(8)-loop motif constructed from a H4—N4—C21—N5—H4—N4—C21—N5 synthon. Moreover, two different C—H⋯F interactions are observed. The first one (C25—H25⋯F2; magenta dash lines) joins the BODIPY-PH molecules related by a translational symmetry, while the second one (C15—H15⋯F1; orange dash lines) links the inversion-related BODIPY-PH molecules. According to the steric hindrance of the two perpendicular bulky groups, the centroids of aromatic rings are pushed off. Consequently, the distance between the ring centroids is larger than 4 Å. Hence, no π–π interactions are observed in the crystal structure [44].
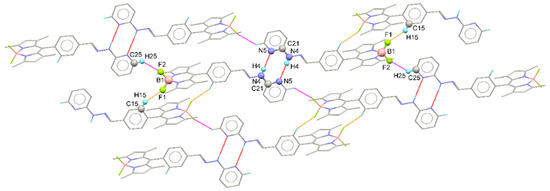
Figure 3.
Views of the crystal packing which illustrate the R22(8) N—H⋯N hydrogen bonding loop (red dash lines) as well as the C—H⋯F interactions (orange and magenta dash lines) in the extended structure of BODIPY-PH.
3.2. Photophysical Properties toward Ferric Ion Sensing
The photophysical properties of BODIPY-PH (10 µM) were investigated toward ferric ions in an aqueous solution (acetonitrile-water = 1:9 v/v). Upon constant addition of 1 molar equivalent (10 µM) to 16 molar equivalents (160 µM) of Fe3+ (10 µM increment) to the 1 molar equivalent (10 µM) of BODIPY-PH, the absorption intensities of the BODIPY derivative at 500 nm gradually increased while the intensities at 543 nm concurrently decreased resulting in a color change from pink to orange (Figure 4A). As shown in Figure 4B, the emission spectra of BODIPY-PH exhibited around a 2.5-fold increase upon adding ferric ions and the emission maxima at the concentrations of Fe3+ from low to high displayed a slightly bathochromic shift from 512 nm to 518 nm. Both absorption and emission intensities remained constant at 10 equivalents of Fe3+ added indicating ferric ion saturation for BODIPY-PH. In addition, the fluorescence quantum yield of BODIPY-PH was enhanced from 1.3 (±0.6, n = 3) % to 3.3 (±0.6, n = 3) % after additions of 10 equivalents of Fe3+. These results confirmed the potential of this pyridylhydrazone-tethered BODIPY as a fluorescence turn-on chemosensor for Fe3+ in aqueous media.
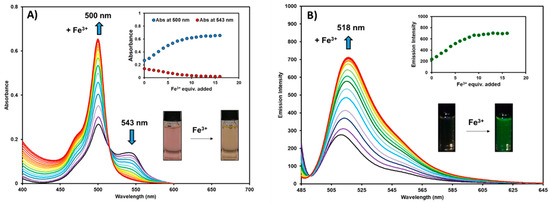
Figure 4.
Changes in the absorption spectra of BODIPY-PH (A), and emission spectra of BODIPY-PH (B) (excitation wavelength = 475 nm) with respect to the increasing of Fe3+ equivalents (1–16 equiv.) in acetonitrile-water (1:9 v/v) solutions (Note that, the final concentration of BODIPY-PH was fixed to be 10 µM).
3.3. Sensing Properties of BODIPY-PH toward Ferric Ions
The selectivity of BODIPY-PH toward various metal cations was investigated by mixing them with 10 equivalence of Ag+, Al3+, Ca2+, Cd2+, Co2+, Cr3+, Cu2+, Fe2+, Fe3+, Hg2+, Mg2+, Mn2+, Ni2+, Pb2+, and Zn2+, respectively. As demonstrated in Figure 5A, only the presence of Fe3+ led to a strong green emission for BODIPY-PH suggesting its high selectivity toward ferric ions. Al3+ and Cr3+ induced a weak green emission due to their trivalent nature which has been observed in previous works [45,46,47,48], while Hg2+ caused a small fluorescence quenching. The interfering effect of the above-mentioned cations toward Fe3+ sensing was also investigated. As seen in Figure 5B, the co-existence of Fe3+ and Hg2+ could interfere with the detection of ferric ions in real applications as the fluorescent quenching was noticeably observed. Based on previous literature, Hg2+ could potentially bind to pyridyl unit in optical sensor systems [49,50,51], therefore, Hg2+ and Fe3+ could competitively bind to the pyridylhydrazone unit in BODIPY-PH.
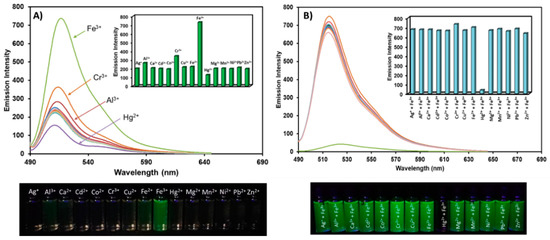
Figure 5.
(A) The fluorescence spectra of BODIPY-PH in the presence of various metal cations (10 equiv.) and the images BODIPY-PH (10 µM) upon addition of those metal ions. The inset displays bar charts of fluorescent intensities at 518 nm of BODIPY-PH after additions of metal ions. (B) The fluorescence spectra of BODIPY-PH in the presence of Fe3+ co-existing with other metal ions and the images BODIPY-PH (10 µM) in the presence of Fe3+ co-presenting with those metal ions. The inset shows bar charts of fluorescent intensities at 518 nm of BODIPY-PH in the existence of Fe3+ co-presenting with other metal ions.
The binding stoichiometry of BODIPY-PH-Fe3+ complex was proved by Job’s plot analysis. As displayed in Figure 6A, the emission intensities at 518 nm were plotted against molar fractions of BODIPY-PH ([BODIPY-PH]/[ BODIPY-PH] + [Fe3+])) at the constant total concentrations of BODIPY-PH and Fe3+ ([BODIPY-PH] + [Fe3+]) of 50 µM. The maximum emission intensity of this BODIPY derivative was observed at the mole fractions of 0.5, suggesting 1:1 binding stoichiometry of BODIPY-PH-Fe3+ complex [38]. Next, the association constant (K) for this metal-ligand formation was determined using Benesi-Hildebrand Equation (2). The linearly fitted plot between 1/(F-Fmin) and 1/[Fe3+] further confirmed the 1:1 binding ratio between BODIPY-PH and Fe3+ ions (Figure 6B). Derived from the slope of this plot, the K value was calculated as 5.35 × 10⁴ M−1 which is comparable with those of BODIPY-based sensor in the literature (Table 1).
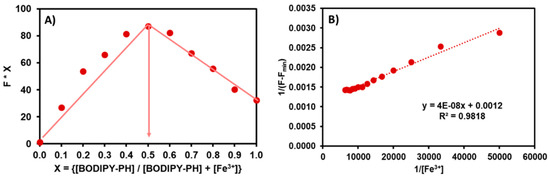
Figure 6.
(A) Job’s plot for BODIPY-PH in acetonitrile-water (1:9 v/v). (B) Benesi-Hildebrand binding plot generated from the analysis of fluorescence enhancements of BODIPY-PH upon addition of Fe3+, and fitted in accordance with Equation (2).

Table 1.
Comparison of BODIPY-PH with other reported BODIPY- and rhodamine-based sensors for ferric ion detection.
Next, the Fe3+ binding at the pyridylhydrazone (PH) unit was investigated by 1H NMR spectroscopy. As Fe3+ is paramagnetic ions that can affect relaxation times of proton-NMR spectra, the NMR resonance frequency of protons close to Fe3+ binding unit could be altered upon binding [52]. As displayed in Figure 7, the hydrazone proton signal (H4) at 8.06 ppm completely disappeared and the amine proton resonance (H5) at 10.98 ppm almost completely disappeared upon the addition of Fe3+. The rest of the proton peaks of pyridylhydrazone moiety became broader indicating that Fe3+ bound to the PH unit which is consistent with the previous findings [25,53,54]. In addition, the detections of molecular ions at m/z = 639.0923 {[(BODIPY-PH-H)Fe(NO3)(DMSO)]+} and 684.0762 {[(BODIPY-PH-H)Fe(NO3)(DMSO)(EtOH)] from electrospray ionization mass spectra (ESI-MS) confirmed the existence of iron-BODIPY complex (Figure S4).
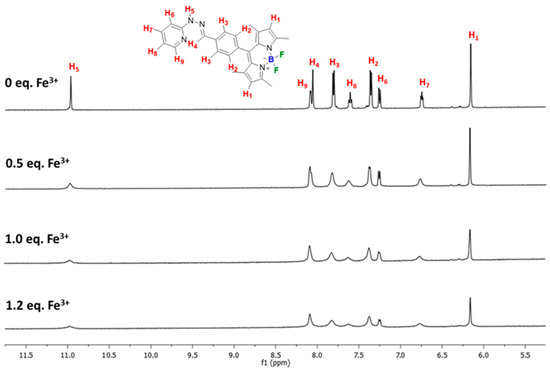
Figure 7.
1H NMR (500 MHz) spectra of BODIPY-PH in the presence of Fe3+ in DMSO-d6.
FT-IR spectroscopy was also carried out to confirm the complex formation between Fe3+ and BODIPY-PH (Figure 8). For the BODIPY-PH spectrum, the characteristic peaks at 3181, 2978, 2926, 1597, and 1584 cm−1 were assigned to N—H, Cmethyl—H, Cmethyl—H, C=N, and C=N stretching vibrations, respectively. It was observed that the wavenumbers of the N—H and C=N peaks were found at the lower frequencies than those values reported in the literature [55,56], due to the larger conjugation length. After complex formation, the broad and intense O—H peak at 3231 cm−1 regarding the H2O ligands that coordinated to the Fe3+ was detected. Moreover, the C=N peaks of the BODIPY-PH-Fe3+ complex were enlarged and shifted toward the lower wavenumbers (1551, 1524 cm−1) compared to those of BODIPY-PH. This suggested that the Schiff base nitrogen was likely to coordinate with the Fe3+ ions [57] which is agreeable with the result from NMR spectroscopic technique.
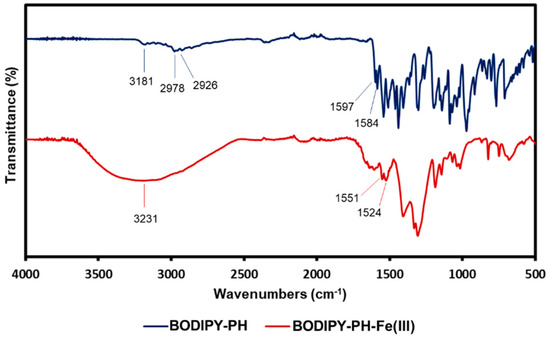
Figure 8.
Fourier transform infrared spectroscopy (FTIR) spectra of BODIPY-PH (blue line) and BODIPY-PH-Fe3+ (red line).
In addition, the limit of detection (LOD) of BODIPY-PH was calculated from the plots of the increased fluorescence intensities and the Fe3+ concentrations, as demonstrated in Figure S5 by using 3σ/m formula, where σ is the standard deviation of fluorescence signals of the chemosensor without analyte and m is the slopes of the plots. The LOD of BODIPY-PH was estimated as 0.58 µM, which was slightly higher than that of other reported BODIPY-based Fe3+ sensors A and B and considerably higher than that of C (Table 1 and the structures of sensors show in Figure 9). However, compared with the reported rhodamine-based sensors tethered nitrogen-chelating moiety (sensor D, E, F), the LOD of BODIPY-PH was about 4 to 6-time lower, indicating superior sensitivity toward Fe3+.
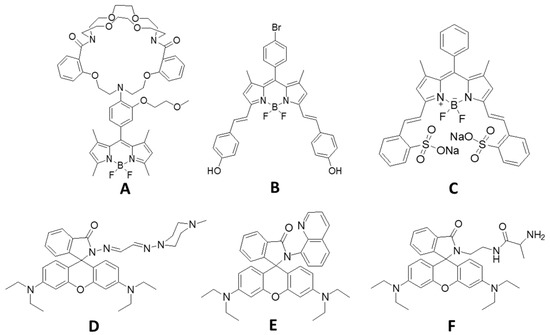
Figure 9.
Structures of BODIPY- and rhodamine-based Fe3+ sensors in the literature.
The effect of pH toward photophysical properties of BODIPY-PH (10 µM) with and without the addition of Fe3+ was explored in acetonitrile-standard buffer solution (1:9 v/v) in the pH range of 1–12. As seen in Figure 10, BODIPY-PH exhibited low fluorescence signals at a pH range of 5–12, while showed the increased emission intensity with the decreased pH from 5 to 1. Upon addition of Fe3+ (10 molar equivalents or 100 µM) to the solution of BODIPY-PH (10 µM) in various pH, the highest fluorescent signal changes were observed in the pH range from 5 to 7 which could be a suitable pH range for Fe3+ detection in real water samples. The emission intensities of BODIPY-PH in the presence of Fe3+ decreased at pH > 7 indicating poor stability of BODIPY-PH-Fe3+ complex at high pH values.
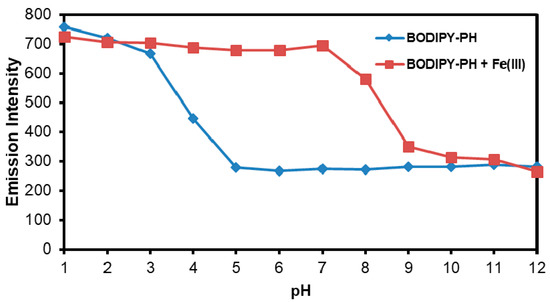
Figure 10.
Fluorescence intensity variation at maximum emission of 518 nm of BODIPY-PH (10 µM) at media alternation of pH from 1 to 12.
Then, the reversibility and reusability of BODIPY-PH as proposed in Figure 11A was systematically investigated by the fluorescence titration of the dye with consecutive additions of Fe3+ (100 µM) and the common metal ion sequester, ethylenediaminetetraacetic acid (EDTA) (100 µM). As displayed in Figure 11B, the fluorescence signals reached the maximum point when BODIPY-PH (10 µM) was saturated by the addition of 10 equiv. of Fe3+ (100 µM) and quenched upon the further addition of EDTA (100 µM). Nevertheless, when another 100 µM of Fe3+ was added to the resulting mixture, the fluorescent intensity was almost recovered. This off-on-off cycle could be effectively repeated up to three times confirming the practical regeneration of the BODIPY-PH after ferric ion detection.
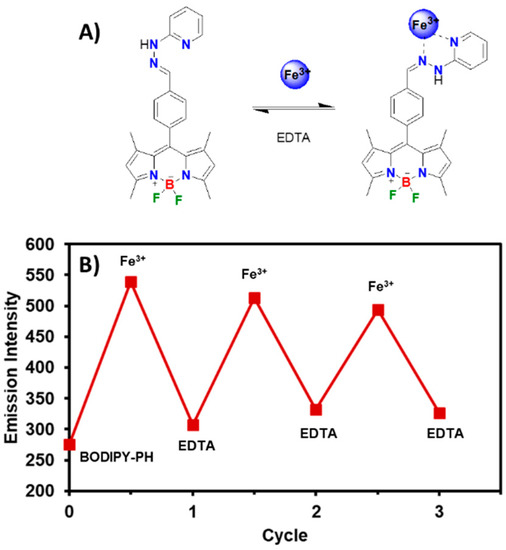
Figure 11.
(A) The proposed binding mode between BODIPY-PH and Fe3+ and its reversible reaction through EDTA complexation. (B) Reversible changes in fluorescence intensity of BODIPY-PH (10 µM) at 518 nm upon alternate addition of Fe3+ (100 µM) and EDTA (100 µM).
3.4. Theoretical Calculations
To identify the sensing mechanism of the BODIPY-PH toward Fe3+ complexation, we performed the DFT calculations using BHandHLYP/6-311G* level of theory in the implicit water solvent and the LANL2DZ basis set for Fe3+. The highest occupied molecular orbital (HOMO) and the lowest unoccupied molecular orbital (LUMO) of BODIPY-PH and BODIPY-PH-Fe3+ complex with the isovalue of 0.02 and their corresponding energy gaps are illustrated in Figure 12A. The density distributions of HOMO- and LUMO-electrons on the BODIPY-PH are mainly located on the BODIPY backbone as also observed in other BODIPY derivatives according to the literature [62,63,64]. In addition, there are no π-electrons covered on the pyridylhydrazone moiety which indicates the separation of the π-conjugated system on the BODIPY core from the one on pyridylhydrazone unit. On the other hand, the electron density distributions of BODIPY-PH-Fe3+ complex are shifted from the BODIPY core (in the HOMO) to the phenylene moiety and the Fe3+ binding site (in the LUMO). This result indicates the increased π-conjugation in the BODIPY-PH-Fe3+ complex and the inhibition of C=N isomerization leading to the fluorescence enhancement (Figure 12B). These theoretical results confirm the chelation-enhanced fluorescence (CHEF) effect in BODIPY-PH upon Fe3+ binding as shown in Figure 12B.
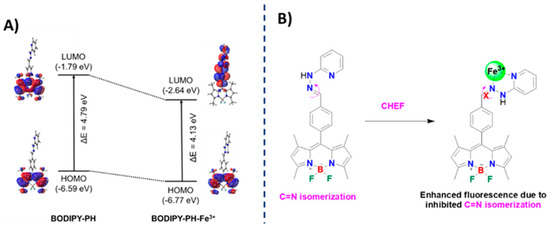
Figure 12.
(A) Frontier molecular orbitals (HOMO and LUMO) of BODIPY-PH and BODIPY-PH-Fe3+ compounds and their corresponding energy gaps (ΔE in eV) computed by BHandHLYP/6-311G* level of theory. The HOMO and LUMO orbitals are plotted with isovalue of 0.02. (B) Proposed sensing mechanism of BODIPY-PH upon Fe3+ binding.
3.5. Investigation of the Binding and Complexation between BODIPY-PH Ligand and Fe3+ Ions by X-ray Absorption Spectroscopy (XAS)
XAS spectra at Fe K-edge were collected in both XANES and EXAFS regions to reveal the structural information upon binding of Fe3+ ions to the BODIPY-PH ligand (named as BODIPY-PH-Fe3+). As shown in Figure 13A, the XANES spectrum of BODIPY-PH-Fe3+ illustrates the rather similar absorption edge and fingerprint feature with that of the standard solutions of Fe3+ in acetonitrile-water (1:9 v/v) solution. In other words, the oxidation state of Fe in the BODIPY-PH-Fe3+ remains +3 and the complexation of BODIPY-PH-Fe3+ may resemble the octahedral geometry as observed in the Fe3+ aqua complex.
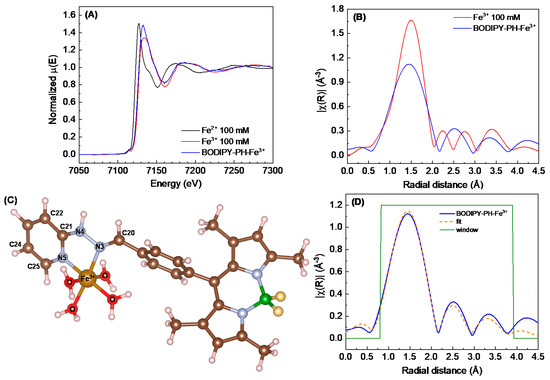
Figure 13.
(A) X-ray absorption near edge structure (XANES) spectra probed at Fe K-edge of the mixture between BODIPY-PH ligand and Fe3+ (BODIPY-PH-Fe3+) compared to the 100 mM standard solutions of Fe2+ and Fe3+ in acetonitrile-water (1:9 v/v). (B) Comparison of the extended X-ray absorption fine structure (EXAFS) data of the BODIPY-PH-Fe3+ with respect to the one of 100 mM standard solutions of Fe3+. (C) The DFT-calculated structural model of BODIPY-PH-Fe3+ used for EXAFS fitting indicating the neighboring atoms around Fe3+. (D) EXAFS data fitting by employing ARTHEMIS software of the BODIPY-PH-Fe3+.
Closer inspection into the EXAFS data plotted in R-space (Figure 13B), the amplitude at the first shell of BODIPY-PH-Fe3+ is relatively lower and the first-shell feature becomes broader than those of the standard Fe3+ solution. This observation suggests the deviation from the symmetric octahedral coordination sphere in the Fe3+ aqua complex by means of the binding of Fe3+ with the BODIPY-PH ligand. Moreover, the radial distance distribution at the second and the third shell around the Fe3+ in the BODIPY-PH-Fe3+ is different from the feature of the Fe3+ aqua complex. To identify the structural complexation of BODIPY-PH-Fe3+, the structural optimization of the octahedral Fe3+ complex coordinated with four H2O molecules and two nitrogen (N3 and N5) at the pyridylhydrazone unit of BODIPY-PH ligand (Figure 13C) was performed by DFT calculation. The EXAFS data fitting was operated by using this DFT-calculated structure as a model. The well-matching of the structural model with the experimental data is observed (Figure 13D) showing the corresponding EXAFS-fitting parameters in Table S3. Noteworthy, the EXAFS data fitting reveals the complexation of Fe3+ ions with BODIPY-PH ligand in 1:1 ratio and forms the octahedral coordination geometry with the additional four H2O molecules.
3.6. Cell Imaging Study
To prove the capability of BODIPY-PH for Fe3+ analysis in a cellular matrix, the cell imaging experiment was investigated in the human embryonic kidney (HEK293) cell line acting as a cellular model. As an excessive uptake of iron can cause acute kidney injury in human [65], this work could provide an alternative fluorescence tool to study oxidative damage of iron toward kidney cells. Based on cell viability assay (Figure S6), BODIPY-PH is non-toxic to HEK293 cells at concentrations ranging from 5 to 50 µM. So, this BODIPY concentration range was next employed for the cell culture experiments with and without Fe3+ ions.
Live cell-imaging experiments incubated with 5 µM and 10 µM of BODIPY-PH were done in parallel to investigating the effect of dye concentrations toward Fe3+ sensing and the confocal laser scanning microscopy (CLSM) (images of HEK293 cells of both experimental sets are demonstrated in Figure S7A and Figure 14A), respectively. After incubating with ferric ions for 30 min at the twice concentrations of the dye, the HEK293 cells exhibited increased fluorescence signals which was consistent with the corrected total cell fluorescence (CTCF) bar chart ((Figure S7B) and Figure 14B). Both cell-imaging experimental sets manifested~1.4-fold fluorescence enhancement (Figure S8) which is comparable to the fluorescence enhancement of compound A (Figure 9) in HCT-116 cells upon addition of Fe3+ [36]. Additionally, the TD images confirmed a good viability of the cells throughout the experiments. These results strongly suggested the capability of BODIPY-PH for Fe3+ analysis in live cells without any observed cell damages.
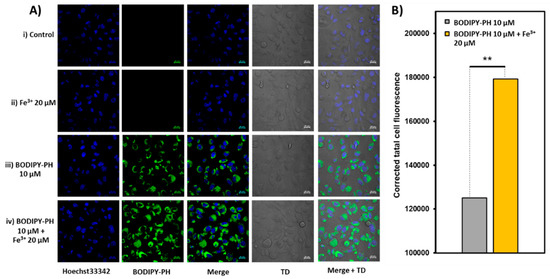
Figure 14.
(A) Confocal laser scanning microscopy (CLSM) images of HEK-293 cells. Row i, control HEK-293 cells with no treatment. Row ii, HEK-293 cells incubated with Fe3+ (20 µM) for 30 min. Row iii, HEK-293 cells incubated with BODIPY-PH (10 µM) for 30 min. Row iv, HEK-293 cells incubated with Fe3+ (20 µM) for 30 min and subsequently incubated with BODIPY-PH (10 µM) for another 30 min (For BODIPY-PH: λex = 488 nm, λem = 509 nm, scale bar = 20 µm, TD = transmitted light differential interference contrast image). All images were collected at the same microscopy settings. (B) Bar chart showing corrected total cell fluorescence (CTCF) of HEK-293 cells incubated with BODIPY-PH (10 µM) before and after the addition of Fe3+ (20 µM). Statistical analysis is based on student’s two tailed t-test (* p < 0.05, ** p < 0.01, *** p < 0.001).
4. Conclusions
In summary, we have synthesized a new BODIPY derivative (BODIPY-PH) containing pyridylhydrazone moiety acting as a Fe3+ ion-binding site. This compound displayed fluorescent enhancement response toward ferric ion binding in acetonitrile-water (1:9 v/v) solution due to the effect from the chelation-enhanced fluorescence (CHEF) process. This ligand exhibited high selectivity for Fe3+ ions over various metal ions, however, its fluorescent sensing ability toward Fe3+ could be interfered by the co-presence of Hg2+. The Job’s plot and the Benesi-Hildebrand analysis indicated a 1:1 binding mode between Fe3+ and BODIPY-PH with a binding constant of 5.4 × 10⁴ M−1. The X-ray absorption spectroscopy (XAS) further confirmed the Fe3+ binding by BODIPY-PH ligand and suggested an asymmetric octahedral geometry of the resulted BODIPY-PH-Fe3+ complex. The low limit of detection of 0.58 µM, the Fe3+-sensing capability at neutral pH, and the reversible nature toward Fe3+ binding suggested the potential of BODIPY-PH for Fe3+ detection in real water samples. Finally, the fluorescence imaging results in living HEK293 cells indicated that the BODIPY-PH possesses excellent cell permeability, good biocompatibility, and high stability under physiological conditions and can be applicable for detecting Fe3+ in living cells.
Supplementary Materials
The following are available online at https://www.mdpi.com/article/10.3390/chemosensors9070165/s1, Figure S1: 1H NMR spectra of BODIPY-PH, Figure S2: 13C NMR spectra of BODIPY-PH, Figure S3: Mass spectra of BODIPY-PH, Figure S4: Mass spectra of BODIPY-PH-Fe3+ complexes, Figure S5: Standard calibration curve demonstrating the fluorescence intensity increments at 518 nm (n = 3) as a function of Fe3+ concentrations incubated with BODIPY-PH (10 µM) in acetonitrile-water (1:9 v/v), Figure S6: Percent cell viability estimated by MTT proliferation test versus incubation concentrations of BODIPY-PH. HEK-293 cells were cultured in the presence of BODIPY-PH (0–50 µM) at 37 oC for 24 h, Figure S7: (A) Confocal laser scanning microscopy (CLSM) images of HEK-293 cells. Row i, control HEK-293 cells with no treatment. Row ii, HEK-293 cells incubated with Fe3+ (10 µM) for 30 min. Row iii, HEK-293 cells incubated with BODIPY-PH (5 µM) for 30 min. Row iv, HEK-293 cells incubated with Fe3+ (10 µM) for 30 min and subsequently incubated with BODIPY-PH (5 µM) for another 30 min (For BODIPY-PH: λex = 488 nm, λem = 509 nm, scale bar = 20 µm, TD = transmitted light differential interference contrast image). All images were collected at the same microscopy settings. (B) Bar chart showing corrected total cell fluorescence (CTCF) of HEK-293 cells incubated with BODIPY-PH (5 µM) before and after the addition of Fe3+ (10 µM). Statistical analysis is based on student’s two tailed t-test (* p < 0.05, ** p < 0.01, *** p < 0.001), Figure S8: Bar chart showing the relative corrected total cell fluorescence (CTCF) of HEK-293 cells incubated with BODIPY-PH (5 and 10 µM) comparing between before and after the addition of Fe3+ (10 and 20 µM), Table S1: Crystal data and structure refinement for BODIPY-PH, Table S2: Geometric parameters and symmetry operations for intermolecular H-bond interactions (Å,°), Table S3: EXAFS fitting data for investigating the structural information of the complexation between BODIPY-PH ligand and Fe3+ ion.
Author Contributions
J.N.: methodology, investigation, validation, and writing—original draft. C.S.: formal analysis and writing—review and editing. R.D.: investigation, validation, and writing—review and editing. A.K.: formal analysis and writing—review and editing. W.W.: formal analysis and writing—review and editing. S.W.: formal analysis and writing—review and editing. P.R.: resources and supervision. K.C.: conceptualization, methodology, resources, supervision, project administration, funding acquisition, writing—review and editing. All authors have read and agreed to the published version of the manuscript.
Funding
This work has been financially supported by the Research Network of NANOTEC (RNN) program of the National Nanotechnology Center (NANOTEC), NSTDA, Ministry of Higher Education, Science, Research, and Innovation, Thailand (Grant No. P1851658) and New Researcher Grant (NRCT5-TRG630014-02) from National Research Council of Thailand (NRCT) co-funded with National Nanotechnology center (P2051931).
Acknowledgments
The authors thank nanocharacterization central laboratory, National Nanotechnology Center (Nanotec) and NSTDA Characterization and Testing Service Center (NCTC) for providing research facilities for this project. Synchrotron Light Research Institute, Thailand is also acknowledged for the provision of XAS beamtime at the Beamline 1.1W (Multiple X-ray Techniques, MXT).
Conflicts of Interest
The authors declare no conflict of interest.
References
- Dai, S.; Schwendtmayer, C.; Schürmann, P.; Ramaswamy, S.; Eklund, H. Redox Signaling in Chloroplasts: Cleavage of Disulfides by an Iron-Sulfur Cluster. Science 2000, 287, 655. [Google Scholar] [CrossRef] [PubMed] [Green Version]
- Atkinson, A.; Winge, D.R. Metal Acquisition and Availability in the Mitochondria. Chem. Rev. 2009, 109, 4708–4721. [Google Scholar] [CrossRef] [PubMed] [Green Version]
- Kaplan, C.D.; Kaplan, J. Iron Acquisition and Transcriptional Regulation. Chem. Rev. 2009, 109, 4536–4552. [Google Scholar] [CrossRef]
- Theil, E.C.; Goss, D.J. Living with Iron (and Oxygen): Questions and Answers about Iron Homeostasis. Chem. Rev. 2009, 109, 4568–4579. [Google Scholar] [CrossRef] [PubMed] [Green Version]
- Weizman, H.; Ardon, O.; Mester, B.; Libman, J.; Dwir, O.; Hadar, Y.; Chen, Y.; Shanzer, A. Fluorescently-Labeled Ferrichrome Analogs as Probes for Receptor-Mediated, Microbial Iron Uptake. J. Am. Chem. Soc. 1996, 118, 12368–12375. [Google Scholar] [CrossRef]
- Sumner, J.P.; Kopelman, R. Alexa Fluor 488 as an iron sensing molecule and its application in PEBBLE nanosensors. Analyst 2005, 130, 528–533. [Google Scholar] [CrossRef]
- Ferrali, M.; Donati, D.; Bambagioni, S.; Fontani, M.; Giorgi, G.; Pietrangelo, A. 3-Hydroxy-(4H)-benzopyran-4-ones as potential iron chelating agents in vivo. Biorg. Med. Chem. 2001, 9, 3041–3047. [Google Scholar] [CrossRef]
- Pithadia, A.S.; Lim, M.H. Metal-associated amyloid-β species in Alzheimer’s disease. Curr. Opin. Chem. Biol. 2012, 16, 67–73. [Google Scholar] [CrossRef]
- Zheng, H.; Weiner, L.M.; Bar-Am, O.; Epsztejn, S.; Cabantchik, Z.I.; Warshawsky, A.; Youdim, M.B.H.; Fridkin, M. Design, synthesis, and evaluation of novel bifunctional iron-chelators as potential agents for neuroprotection in Alzheimer’s, Parkinson’s, and other neurodegenerative diseases. Biorg. Med. Chem. 2005, 13, 773–783. [Google Scholar] [CrossRef]
- Schulz, J.B.; Boesch, S.; Bürk, K.; Dürr, A.; Giunti, P.; Mariotti, C.; Pousset, F.; Schöls, L.; Vankan, P.; Pandolfo, M. Diagnosis and treatment of Friedreich ataxia: A European perspective. Nat. Rev. Neurol. 2009, 5, 222–234. [Google Scholar] [CrossRef]
- Galaris, D.; Skiada, V.; Barbouti, A. Redox signaling and cancer: The role of “labile” iron. Cancer Lett. 2008, 266, 21–29. [Google Scholar] [CrossRef]
- Kaur, D.; Rajagopalan, S.; Andersen, J.K. Chronic expression of H-ferritin in dopaminergic midbrain neurons results in an age-related expansion of the labile iron pool and subsequent neurodegeneration: Implications for Parkinson’s disease. Brain Res. 2009, 1297, 17–22. [Google Scholar] [CrossRef] [PubMed] [Green Version]
- Kozlowski, H.; Janicka-Klos, A.; Brasun, J.; Gaggelli, E.; Valensin, D.; Valensin, G. Copper, iron, and zinc ions homeostasis and their role in neurodegenerative disorders (metal uptake, transport, distribution and regulation). Coord. Chem. Rev. 2009, 253, 2665–2685. [Google Scholar] [CrossRef]
- Andersen, J.E.T. A novel method for the filterless preconcentration of iron. Analyst 2005, 130, 385–390. [Google Scholar] [CrossRef]
- Del Castillo Busto, M.E.; Montes-Bayón, M.; Blanco-González, E.; Meija, J.; Sanz-Medel, A. Strategies to Study Human Serum Transferrin Isoforms Using Integrated Liquid Chromatography ICPMS, MALDI-TOF, and ESI-Q-TOF Detection: Application to Chronic Alcohol Abuse. Anal. Chem. 2005, 77, 5615–5621. [Google Scholar] [CrossRef] [PubMed]
- Pomazal, K.; Prohaska, C.; Steffan, I.; Reich, G.; Huber, F.K.J. Determination of Cu, Fe, Mn, and Zn in blood fractions by SEC-HPLC-ICP-AES coupling. Analyst 1999, 124, 657–663. [Google Scholar] [CrossRef] [PubMed]
- Chansaenpak, K.; Kamkaew, A.; Weeranantanapan, O.; Suttisintong, K.; Tumcharern, G. Coumarin Probe for Selective Detection of Fluoride Ions in Aqueous Solution and Its Bioimaging in Live Cells. Sensors 2018, 18, 2042. [Google Scholar] [CrossRef] [Green Version]
- Nootem, J.; Sattayanon, C.; Namuangruk, S.; Rashatasakhon, P.; Wattanathana, W.; Tumcharern, G.; Chansaenpak, K. Solvatochromic triazaborolopyridinium probes toward ultra-sensitive trace water detection in organic solvents. Dye. Pigment. 2020, 181, 108554. [Google Scholar] [CrossRef]
- Vongnam, K.; Chansaenpak, K.; Sukwattanasinitt, M.; Rashatasakhon, P. Aryl Ethynylpyrene as Fluorescent Sensors for Cyanide Ions in Aqueous Media. ChemistrySelect 2020, 5, 4303–4306. [Google Scholar] [CrossRef]
- Silpcharu, K.; Sam-ang, P.; Chansaenpak, K.; Sukwattanasinitt, M.; Rashatasakhon, P. Selective Fluorescent Sensors for Gold(III) Ion from N-Picolyl Sulfonamide Spirobifluorene Derivatives. J. Photochem. Photobiol. A Chem. 2020, 112823. [Google Scholar] [CrossRef]
- Perumal, S.; Atchudan, R.; Edison, T.N.J.I.; Lee, Y.R. Sustainable synthesis of multifunctional carbon dots using biomass and their applications: A mini-review. J. Environ. Chem. Eng. 2021, 9, 105802. [Google Scholar] [CrossRef]
- Chansaenpak, K.; Wang, M.; Liu, S.; Wu, Z.; Yuan, H.; Conti, P.S.; Li, Z.; Gabbaï, F.P. Synthesis and in vivo stability studies of [18F]-zwitterionic phosphonium aryltrifluoroborate/indomethacin conjugates. RSC Adv. 2016, 6, 23126–23133. [Google Scholar] [CrossRef]
- Wang, H.; Wang, M.; Chansaenpak, K.; Liu, Y.; Yuan, H.; Xie, J.; Yin, H.; Branca, R.T.; Li, Z.; Wu, Z. A Novel PET Probe for Brown Adipose Tissue Imaging in Rodents. Mol. Imaging Biol. 2019. [Google Scholar] [CrossRef]
- Chansaenpak, K.; Wang, M.; Wang, H.; Giglio, B.C.; Gabbaï, F.P.; Wu, Z.; Li, Z. Preparation of [18F]-NHC-BF3 conjugates and their applications in PET imaging. RSC Adv. 2017, 7, 17748–17751. [Google Scholar] [CrossRef] [Green Version]
- Mukherjee, S.; Paul, A.K. Pyrene Based Chemosensor for Selective Sensing of Fluoride in Aprotic and Protic Environment. J. Fluoresc. 2015, 25, 1461–1467. [Google Scholar] [CrossRef] [PubMed]
- Zhang, Y.; Teng, H.; Gao, Y.; Afzal, M.W.; Tian, J.; Chen, X.; Tang, H.; James, T.D.; Guo, Y. A general strategy for selective detection of hypochlorous acid based on triazolopyridine formation. Chin. Chem. Lett. 2020, 31, 2917–2920. [Google Scholar] [CrossRef]
- Üçüncü, M.; Emrullahoğlu, M. A BODIPY-based reactive probe for the detection of Au(iii) species and its application to cell imaging. Chem. Commun. 2014, 50, 5884–5886. [Google Scholar] [CrossRef] [Green Version]
- Bag, S.; Tseng, J.C.; Rochford, J. A BODIPY-luminol chemiluminescent resonance energy-transfer (CRET) cassette for imaging of cellular superoxide. Org. Biomol. Chem. 2015, 13, 1763–1767. [Google Scholar] [CrossRef]
- Ozdemir, T.; Sozmen, F. BODIPY based self-healing fluorescent gel formation via acylhydrazone linkage. RSC Adv. 2016, 6, 10601–10605. [Google Scholar] [CrossRef]
- APEX3 and SAINT; Bruker AXS Inc.: Madison, WI, USA, 2018.
- SADABS; Bruker AXS Inc.: Madison, WI, USA, 2016.
- Dolomanov, O.V.; Bourhis, L.J.; Gildea, R.J.; Howard, J.A.K.; Puschmann, H. OLEX2: A complete structure solution, refinement and analysis program. J. Appl. Crystallogr. 2009, 42, 339–341. [Google Scholar] [CrossRef]
- Sheldrick, G. SHELXT—Integrated space-group and crystal-structure determination. Acta Crystallogr. Sect. A 2015, 71, 3–8. [Google Scholar] [CrossRef] [PubMed] [Green Version]
- Sheldrick, G. Crystal structure refinement with SHELXL. Acta Crystallogr. Sect. C 2015, 71, 3–8. [Google Scholar] [CrossRef]
- Macrae, C.F.; Sovago, I.; Cottrell, S.J.; Galek, P.T.A.; McCabe, P.; Pidcock, E.; Platings, M.; Shields, G.P.; Stevens, J.S.; Towler, M.; et al. Mercury 4.0: From visualization to analysis, design and prediction. J. Appl. Crystallogr. 2020, 53, 226–235. [Google Scholar] [CrossRef] [Green Version]
- Sui, B.; Tang, S.; Liu, T.; Kim, B.; Belfield, K.D. Novel BODIPY-Based Fluorescence Turn-on Sensor for Fe3+ and Its Bioimaging Application in Living Cells. ACS Appl. Mater. Interfaces 2014, 6, 18408–18412. [Google Scholar] [CrossRef] [PubMed]
- Chansaenpak, K.; Wang, H.; Wang, M.; Giglio, B.; Ma, X.; Yuan, H.; Hu, S.; Wu, Z.; Li, Z. Synthesis and Evaluation of [18F]-Ammonium BODIPY Dyes as Potential Positron Emission Tomography Agents for Myocardial Perfusion Imaging. Chem. A Eur. J. 2016, 22, 12122–12129. [Google Scholar] [CrossRef]
- Li, Y.; Han, X.; Song, Y. An azo-phenol derivative probe: Colorimetric and “turn-on” fluorescent detection of copper(ii) ions and pH value in aqueous solution. RSC Adv. 2017, 7, 20537–20541. [Google Scholar] [CrossRef] [Green Version]
- Li, C.-r.; Qin, J.-c.; Wang, G.-q.; Wang, B.-d.; Yang, Z.-y. A novel pyrazine derivative as a “turn on” fluorescent sensor for the highly selective and sensitive detection of Al3+. Anal. Methods 2015, 7, 3500–3505. [Google Scholar] [CrossRef]
- Becke, A.D. A new mixing of Hartree–Fock and local density-functional theories. J. Chem. Phys. 1993, 98, 1372–1377. [Google Scholar] [CrossRef]
- Cossi, M.; Barone, V. Time-dependent density functional theory for molecules in liquid solutions. J. Chem. Phys. 2001, 115, 4708–4717. [Google Scholar] [CrossRef]
- Ordon, P.; Tachibana, A. Investigation of the role of the C-PCM solvent effect in reactivity indices. J. Chem. Sci. 2005, 117, 583–589. [Google Scholar] [CrossRef] [Green Version]
- Frisch, M.J.; Trucks, G.W.; Schlegel, H.B.; Scuseria, G.E.; Robb, M.A.; Cheeseman, J.R.; Scalmani, G.; Barone, V.; Petersson, G.A.; Nakatsuji, H.; et al. Gaussian 16, Revision C.01; Gaussian, Inc.: Wallingford, CT, USA, 2016. [Google Scholar]
- Suramitr, S.; Teanwarawat, J.; Ithiapa, N.; Wattanathana, W.; Suramitr, A. Crystal structure, Hirshfeld surface analysis and computational study of a rhodamine B-salicylaldehyde Schiff base derivative. Acta Crystallogr. Sect. E 2020, 76, 1027–1032. [Google Scholar] [CrossRef]
- Alam, R.; Bhowmick, R.; Islam, A.S.M.; Katarkar, A.; Chaudhuri, K.; Ali, M. A rhodamine based fluorescent trivalent sensor (Fe3+, Al3+, Cr3+) with potential applications for live cell imaging and combinational logic circuits and memory devices. New J. Chem. 2017, 41, 8359–8369. [Google Scholar] [CrossRef]
- Chandra, R.; Manna, A.K.; Rout, K.; Mondal, J.; Patra, G.K. A dipodal molecular probe for naked eye detection of trivalent cations (Al3+, Fe3+and Cr3+) in aqueous medium and its applications in real sample analysis and molecular logic gates. RSC Adv. 2018, 8, 35946–35958. [Google Scholar] [CrossRef] [Green Version]
- Roy, A.; Das, S.; Sacher, S.; Mandal, S.K.; Roy, P. A rhodamine based biocompatible chemosensor for Al3+, Cr3+ and Fe3+ ions: Extraordinary fluorescence enhancement and a precursor for future chemosensors. Dalton Trans. 2019, 48, 17594–17604. [Google Scholar] [CrossRef]
- Wang, L.; Fang, G.; Cao, D. A novel phenol-based BODIPY chemosensor for selective detection Fe3+ with colorimetric and fluorometric dual-mode. Sens. Actuators B Chem. 2015, 207, 849–857. [Google Scholar] [CrossRef]
- Guo, S.; Fan, C.; Liu, G.; Pu, S. A colorimetric and fluorescent chemosensor for Hg2+ based on a photochromic diarylethene with a quinoline unit. RSC Adv. 2018, 8, 39854–39864. [Google Scholar] [CrossRef] [Green Version]
- Arshad, M.N.; Rahman, M.M.; Asiri, A.M.; Sobahi, T.R.; Yu, S.-H. Development of Hg2+ sensor based on N′-[1-(pyridin-2-yl)ethylidene]benzenesulfono-hydrazide (PEBSH) fabricated silver electrode for environmental remediation. RSC Adv. 2015, 5, 81275–81281. [Google Scholar] [CrossRef]
- Yang, Y.; Ni, X.-L.; Sun, T.; Cong, H.; Wei, G. A highly selective and sensitive fluorescent chemosensor for Hg2+ based on a pyridine-appended π-conjugated ligand. RSC Adv. 2014, 4, 47000–47004. [Google Scholar] [CrossRef]
- Angelone, M. Trace elements concentrations in soils and plants of western Europe. In Biogeochemistry of Trace Metals: Advances in Trace Substances Research; Adriana, D.C., Ed.; CRC Press: Boca Raton, FL, USA, 1992. [Google Scholar]
- Wang, H.-F.; Wu, S.-P. A pyrene-based highly selective turn-on fluorescent sensor for copper (II) ions and its application in living cell imaging. Sens. Actuators B Chem. 2013, 181, 743–748. [Google Scholar] [CrossRef]
- Mukherjee, S.; Talukder, S. A Reversible Pyrene-based Turn-on Luminescent Chemosensor for Selective Detection of Fe3+ in Aqueous Environment with Logic Gate Application. J. Fluoresc. 2016, 26, 1021–1028. [Google Scholar] [CrossRef] [PubMed]
- Monfared, H.H.; Pouralimardan, O.; Janiak, C. Synthesis and Spectral Characterization of Hydrazone Schiff Bases Derived from 2,4-Dinitrophenylhydrazine. Crystal Structure of Salicylaldehyde-2,4-Dinitrophenylhydrazone. Z. Nat. B 2007, 62, 717–720. [Google Scholar] [CrossRef] [Green Version]
- Elachi, K.A.S.H.; Haque, M.M.; Ranjan, K.; Mohapatra, K.-E.-Z. Synthesis, Spectral and Thermal Characterization of Cu (II) Complexes Containing Schiff Base Ligands and Their Antibacterial Activity Study. Am. J. Mater. Synth. Processing. 2019, 4, 43–53. [Google Scholar] [CrossRef]
- Kursunlu, A.N. A fluorescent “turn on” chemosensor based on Bodipy–anthraquinone for Al(iii) ions: Synthesis and complexation/spectroscopic studies. RSC Adv. 2015, 5, 41025–41032. [Google Scholar] [CrossRef]
- Ji, J.; Chereddy, S.S.; Ren, Y.; Chen, X.; Su, D.; Zhong, Z.; Mori, T.; Inoue, Y.; Wu, W.; Yang, C. A BODIPY-based near infrared fluorescent probe for Fe3+ in water. J. Photochem. Photobiol. A Chem. 2018, 355, 78–83. [Google Scholar] [CrossRef]
- Liu, S.-R.; Wu, S.-P. New water-soluble highly selective fluorescent chemosensor for Fe (III) ions and its application to living cell imaging. Sens. Actuators B Chem. 2012, 171–172, 1110–1116. [Google Scholar] [CrossRef]
- Huang, J.; Xu, Y.; Qian, X. Rhodamine-based fluorescent off–on sensor for Fe3+—In aqueous solution and in living cells: 8-aminoquinoline receptor and 2:1 binding. Dalton Trans. 2014, 43, 5983–5989. [Google Scholar] [CrossRef] [PubMed]
- Saleem, M.; Abdullah, R.; Ali, A.; Park, B.J.; Choi, E.H.; Hong, I.S.; Lee, K.H. Facile synthesis, cytotoxicity and bioimaging of Fe3+ selective fluorescent chemosensor. Biorg. Med. Chem. 2014, 22, 2045–2051. [Google Scholar] [CrossRef]
- Zhang, J.; Yang, M.; Mazi, W.; Adhikari, K.; Fang, M.; Xie, F.; Valenzano, L.; Tiwari, A.; Luo, F.-T.; Liu, H. Unusual Fluorescent Responses of Morpholine-Functionalized Fluorescent Probes to pH via Manipulation of BODIPY’s HOMO and LUMO Energy Orbitals for Intracellular pH Detection. ACS Sens. 2016, 1, 158–165. [Google Scholar] [CrossRef] [Green Version]
- Dolati, H.; Haufe, L.C.; Denker, L.; Lorbach, A.; Grotjahn, R.; Hörner, G.; Frank, R. Two π-Electrons Make the Difference: From BODIPY to BODIIM Switchable Fluorescent Dyes. Chem. A Eur. J. 2020, 26, 1422–1428. [Google Scholar] [CrossRef] [PubMed]
- Filatov, M.A.; Karuthedath, S.; Polestshuk, P.M.; Callaghan, S.; Flanagan, K.J.; Wiesner, T.; Laquai, F.; Senge, M.O. BODIPY-Pyrene and Perylene Dyads as Heavy-Atom-Free Singlet Oxygen Sensitizers. ChemPhotoChem 2018, 2, 606–615. [Google Scholar] [CrossRef] [Green Version]
- Walker, V.J.; Agarwal, A. Targeting Iron Homeostasis in Acute Kidney Injury. Semin. Nephrol. 2016, 36, 62–70. [Google Scholar] [CrossRef] [PubMed] [Green Version]
Publisher’s Note: MDPI stays neutral with regard to jurisdictional claims in published maps and institutional affiliations. |
© 2021 by the authors. Licensee MDPI, Basel, Switzerland. This article is an open access article distributed under the terms and conditions of the Creative Commons Attribution (CC BY) license (https://creativecommons.org/licenses/by/4.0/).